


Actin filament dynamics must be precisely controlled in cells to execute behaviors such as vesicular trafficking, cytokinesis, and migration. Coronins are conserved actin-binding proteins that regulate several actin-dependent subcellular processes. Here, we describe a new conditional knockout cell line for two ubiquitous coronins, Coro1B and Coro1C. These coronins, which strongly co-localize with Arp2/3-branched actin, require Arp2/3 activity for proper subcellular localization. Coronin null cells have altered lamellipodial protrusion dynamics due to increased branched actin density and reduced actin turnover within lamellipodia, leading to defective haptotaxis. Surprisingly, excessive cofilin accumulates in coronin null lamellipodia, a result that is inconsistent with the current models of coronin–cofilin functional interaction. However, consistent with coronins playing a pro-cofilin role, coronin null cells have increased F-actin levels. Lastly, we demonstrate that the loss of coronins increases accompanied by an increase in cellular contractility. Together, our observations reveal that coronins are critical for proper turnover of branched actin networks and that decreased actin turnover leads to increased cellular contractility.
Introduction
The controlled polymerization and depolymerization of filamentous actin (F-actin) in cells, regulated by a myriad of actin-binding proteins, drives many physiological processes including cell migration, cytokinesis, and membrane trafficking (Campellone and Welch, 2010). In particular, cell migration relies on dynamic remodeling of the actin cytoskeleton to facilitate protrusion formation at the leading edge and coordinated retraction at the rear of cells (Ridley et al., 2003). Lamellipodia are thin, sheet-like, transient protrusions found in adherent cells that contain branched or dendritic actin networks. The seven-subunit Arp2/3 complex serves as the main driver of this highly branched array of actin by nucleating daughter filaments from the sides of the pre-existing filaments (Krause and Gautreau, 2014; Mullins et al., 1998; Svitkina and Borisy, 1999). Arp2/3-nucleated actin branches must undergo coordinated rounds of assembly, disassembly, and recycling (Svitkina and Borisy, 1999). Although the activation of the Arp2/3 complex has been studied extensively, the factors that regulate filament debranching and turnover in Arp2/3-based actin networks are not as well understood.
Coronins are highly conserved F-actin binding proteins implicated in cell motility, membrane trafficking, and phagocytosis (Chan et al., 2011). There are seven mammalian coronin genes, classified into three types (I, II, and III) based on functional and structural similarities (Chan et al., 2011). All coronins contain a characteristic seven-bladed β-propeller thought to facilitate protein–protein interactions, a variable unique region, and a coil–coil domain that mediates trimerization, with the exception of Coro7, which contains two β-propellers in tandem (Appleton et al., 2006; Chan et al., 2011; Xavier et al., 2008). While some coronins show restricted cell type and tissue expression, Coronin 1B (Coro1B) and Coronin 1C (Coro1C) are type I coronins that are ubiquitously expressed in all mammalian cell types, can hetero-trimerize with each other, and most closely resemble ancestral coronins from single cell organisms (Abella et al., 2016; Chan et al., 2011; Spoerl et al., 2002).
One of the first clues as to coronin’s function came from studies in budding yeast, where deletions in the gene encoding coronin showed a synergetic genetic interaction with a cofilin mutation (Goode et al., 1999). ADF/cofilin proteins (hereafter referred to as cofilin) are highly conserved actin depolymerizing and filament severing proteins that localize to lamellipodia and regulate actin turnover, thus promoting whole cell motility (Ghosh et al., 2004; Hotulainen et al., 2005; Svitkina and Borisy, 1999). Cofilin binds cooperatively to actin filaments, promoting phosphate release, inducing torsional strain on filaments and severing filaments at boundaries between cofilin decorated and undecorated regions (Blanchoin et al., 2000; Huehn et al., 2020; Prochniewicz et al., 2005; Schramm et al., 2017). Interestingly, cofilin is proposed to be most efficient at severing when it partially decorates actin, thereby creating alternating regions of cofilin-bound and cofilin-free sections of the actin filament (Huehn et al., 2020). Further evidence for a functional linkage between coronin and cofilin comes from the biochemical reconstitution of the actin comet tails of Listeria (Brieher et al., 2006), in which coronins were shown to functionally synergize with cofilin and Aip1 to facilitate rapid actin depolymerization and turnover (Brieher et al., 2006). Finally, activated mutations of cofilin (S3A) can partially rescue lamellipodial defects associated with Coro1B RNAi depletion in mammalian cells (Cai et al., 2007b).
The molecular basis for coronin’s pro-cofilin effects in various systems is not clear. In vitro studies using purified proteins show that coronins can increase cofilin’s affinity for F-actin by inducing conformational changes along the filament that promote cofilin binding, leading to actin severing and turnover (Jansen et al., 2015; Mikati et al., 2015; Tang et al., 2020). However, these findings are at odds with other in vitro studies that show that coronins display a much stronger affinity for actin filaments with ATP/ADP-Pi subunits, as opposed to cofilin’s preference for ADP-filaments (Cai et al., 2007a; Merino et al., 2018). Furthermore, filaments bound by coronin were protected from cofilin-based depolymerization (Cai et al., 2007a). Since most of our current understanding is based on cell-free systems, in which the dynamics of leading edge dendritic actin cannot be reliably reproduced, it is imperative to study the mechanism(s) of possible coronin–cofilin functional interactions in the physiological milieu of the cytoplasm.
In addition to interactions with cofilin, coronins also functionally interact with the Arp2/3 complex and the branched actin it forms. The first evidence of coronin’s interaction with the Arp2/3 complex was again identified in yeast, where coronin (Crn1) inhibits Arp2/3 complex activation and nucleation in a dose-dependent manner (Humphries et al., 2002). Crn1 was shown to bind near the Arpc2 subunit of the Arp2/3 complex, stabilizing its open conformation, thus inhibiting Arp2/3-dependent nucleation (Rodal et al., 2005). Mammalian Coro1B also inhibits Arp2/3 activation, and this inhibition is regulated by phosphorylation of the protein at Ser2 by PKC (Cai et al., 2005; Cai et al., 2007b). In addition, Coro1B has also been shown to induce Arp2/3 debranching of existing networks, in a manner antagonized by cortactin, an actin branch stabilizer (Cai et al., 2008). Coro1A, a closely related coronin primarily expressed in hematopoietic cells, shows similar inhibitory activity on the Arp2/3 complex (Shiow et al., 2008; Terzi et al., 2014). Thus, coronins are positioned to tune or coordinate the assembly of actin networks through the regulation Arp2/3 activation and branch lifetime, as well as through effects on cofilin-based turnover.
Through cofilin-mediated cortical actin turnover, non-muscle myosin II (NMII)-based cellular contractions can also be regulated (Cheffings et al., 2019). Cofilin has been shown to competitively antagonize NMII, such that its depletion leads to increased contractile actomyosin assembly by increasing actin–myosin binding (Wiggan et al., 2012). Interestingly, it has been postulated that myosin II may in fact reciprocally regulate cofilin activity by inducing torsional strain along filaments, thus promoting cofilin-mediated severing (Haviv et al., 2008; Ngo et al., 2016; Wilson et al., 2010). Together, this implies that effective mechanosensing and force generation requires dynamic reorganization and turnover of branched actin networks, thus tuning the formation of contractile actin arrays (Lehtimaki et al., 2021; Tojkander et al., 2011). However, the precise relationship between branched actin at the periphery and contractile actin arrays in the interior of the cell remains obscure.
In this work, we describe a new inducible knockout cell line system for the ubiquitous coronins, Coro1B and Coro1C. With this system in hand, we set out to elucidate the function of coronins in cell motility and protrusion dynamics. These cells give us a clean genetic system to understand these molecules without the limitations of previous studies, such as partial depletion (i.e., RNAi), functional isoform redundancy, or the lack of consistent in vitro assay conditions. Our findings support a key role for coronins in regulating branched actin turnover, directional cell motility, and a surprising role in controlling overall cell contractility.
Results and discussion
Development and validation of a Coro1B and Coro1C inducible knockout cell line
To address some of the unanswered questions about the mechanism(s) of Coro1B and Coro1C function in cells, we developed an inducible knockout cell line for these two genes. To accomplish this, we crossed mice containing a Coro1C conditional allele (LoxP sites flanking Coro1C allele) into a Coro1B−/− background (Behrens et al., 2016; Foger et al., 2011). Fibroblasts derived from the adult tail (mouse tail fibroblasts [MTFs]) of these mice were rescued at early passage with human Coro1B-tagged with EGFP (Coro1B-GFP) flanked by LoxP sites and then stably transduced with a taxmoxifen-inducible Cre recombinase (CreER; Fig. 1 A). Treatment of this line with 4-hydroxytamoxifen (4-OHT) activates Cre recombinase activity, resulting in complete loss of endogenous Coro1C and Coro1B-GFP proteins, thus generating matched pair of cell lines with and without Coro1B and Coro1C, hereafter referred to as parental and null cells (Fig. 1 A). To validate the loss of Coro1B and Coro1C in null cells, we performed immunoblotting and immunofluorescence, which confirmed the complete deletion of both coronin proteins (Fig. 1, B and C; and Fig. S1, A and B). This tightly controlled, simultaneous deletion of Coro1B-GFP and Coro1C allowed us to assess their function in cells without concern for compensation of one protein for the other or the long-term adaptation of the cells to the loss of either protein. In addition, we can use the loss of GFP fluorescence as a readout to confirm the loss of Coro1B and Coro1C during live imaging approaches, without the need for fixation and staining, to examine the impact on actin dynamics and other cellular processes. Characterization of these cells showed that loss of Coro1B and Coro1C had no effect on cell proliferation 7 d post-treatment with 4-OHT (Fig. S1 C). To determine if the loss of coronins affected cell spreading, we plated cells and assessed their area over time. There was no change in cell spread area over 3 h post-plating and no overt changes to cell morphology (Fig. S1 D).

Generation and characterization of Coro1B and Coro1C matched pair cell lines. (A) Schematic representation of 4-hydroxytamoxifen-induced deletion of Coro1B-GFP and Coro1C. (B) Western blot analysis of matched-pair MTFs with and without Coro1B-GFP and Coro1C. (C) Confocal micrographs showing mixed populations of Parental and Null cells immunostained for Coro1C and phalloidin (F-actin visualization). Only parental cells express Coro1B–GFP and Coro1C. White asterisks denote null cells. Scale bar, 25 μm. (D and E) Representative images for Coro1B-GFP, Coro1C, Arpc2, and F-actin in parental cells. (D) Insets show Coro1B-GFP and Coro1C in magnified regions of the lamellipodia. Scale bar, 5 μm. (E) Parental cells after 30-min treatment with 150 μM CK666 or DMSO. Yellow arrowheads denote the lack of Coro1B or Coro1C along linear actin cables. Scale bar, 30 μm. Source data are available for this figure: SourceData F1.
Generation and characterization of Coro1B and Coro1C matched pair cell lines. (A) Schematic representation of 4-hydroxytamoxifen-induced deletion of Coro1B-GFP and Coro1C. (B) Western blot analysis of matched-pair MTFs with and without Coro1B-GFP and Coro1C. (C) Confocal micrographs showing mixed populations of Parental and Null cells immunostained for Coro1C and phalloidin (F-actin visualization). Only parental cells express Coro1B–GFP and Coro1C. White asterisks denote null cells. Scale bar, 25 μm. (D and E) Representative images for Coro1B-GFP, Coro1C, Arpc2, and F-actin in parental cells. (D) Insets show Coro1B-GFP and Coro1C in magnified regions of the lamellipodia. Scale bar, 5 μm. (E) Parental cells after 30-min treatment with 150 μM CK666 or DMSO. Yellow arrowheads denote the lack of Coro1B or Coro1C along linear actin cables. Scale bar, 30 μm. Source data are available for this figure: SourceData F1.

F-actin regulators Coro1B and Coro1C are regulators of cell motility in fibroblasts. (A and B) Relative expression of (A) human Coro1B-GFP and (B) endogenous Coro1C in parental and null populations normalized to GAPDH loading control. Plotted as mean ± SEM. (C) Cell growth represented as number of cells (×105) in parental and null populations over time. Three independent experiments were performed in duplicates. (D) Cell spread area (in microns squared) of parental and null cells over 3 h after plating on 10 μg/ml FN. Two independent experiments were performed; n > 300 cells per time point. C and D are plotted as mean with 95% CI. (E) Total distance traveled by parental (n = 223) and null (n = 300) cells in microns. (F) Schematic of mixed parental and null cell populations in the microfluidic haptotaxis chamber. (G) Velocity in microns per hour (left) and total distance traveled in microns (right) of parental (n = 102) and null (n = 139) cells from haptotaxis assays. (H) Protrusion distance of parental (n = 17) and null (n = 16) cells plated on 10 μg/ml uniform FN. For beeswarm superplots, means of experimental replicates are color-coded and overlayed on violin plots respresenting cumulative cell level data. Error bars denote SEM. Student’s t tests were performed for graphs A and B and E–H. *P value = 0.028; **P value = 0.0013; ***P value = 0.0007; ****P value <0.0001.

F-actin regulators Coro1B and Coro1C are regulators of cell motility in fibroblasts. (A and B) Relative expression of (A) human Coro1B-GFP and (B) endogenous Coro1C in parental and null populations normalized to GAPDH loading control. Plotted as mean ± SEM. (C) Cell growth represented as number of cells (×105) in parental and null populations over time. Three independent experiments were performed in duplicates. (D) Cell spread area (in microns squared) of parental and null cells over 3 h after plating on 10 μg/ml FN. Two independent experiments were performed; n > 300 cells per time point. C and D are plotted as mean with 95% CI. (E) Total distance traveled by parental (n = 223) and null (n = 300) cells in microns. (F) Schematic of mixed parental and null cell populations in the microfluidic haptotaxis chamber. (G) Velocity in microns per hour (left) and total distance traveled in microns (right) of parental (n = 102) and null (n = 139) cells from haptotaxis assays. (H) Protrusion distance of parental (n = 17) and null (n = 16) cells plated on 10 μg/ml uniform FN. For beeswarm superplots, means of experimental replicates are color-coded and overlayed on violin plots respresenting cumulative cell level data. Error bars denote SEM. Student’s t tests were performed for graphs A and B and E–H. *P value = 0.028; **P value = 0.0013; ***P value = 0.0007; ****P value <0.0001.
To assess the localization of Coro1B and Coro1C more closely in the established parental cell line, we performed immunofluorescence, which demonstrated strong lamellipodial and vesicular localization of Coro1B and Coro1C that is very similar to the localization pattern of the Arp2/3 complex (Fig. 1 D). To determine if Arp2/3-branched actin is required for Coro1B and Coro1C localization, we treated parental cells with the small-molecule inhibitor of Arp2/3, CK666. Cells treated with CK666 showed complete loss of lamellipodia, as expected. Interestingly, Arp2/3 inhibition caused Coro1B and Coro1C to become diffuse in the cytoplasm, despite the continued presence of non-branched F-actin structures such as stress fibers (Fig. 1 E). This result indicates that while Coro1B and Coro1C are general F-actin binding proteins in vitro (Cai et al., 2007a; Gandhi et al., 2009), in cells, these proteins localize specifically to Arp2/3-branched F-actin networks.
Migration and protrusion dynamics are negatively impacted by the deletion of Coro1B and Coro1C
To determine the role of Coro1B and Coro1C in cell migration, we analyzed the migration paths of cells plated on glass coated with a uniform layer of fibronectin (FN; Fig. 2 A and Video 1). Deletion of Coro1B and Coro1C reduced cell migration in this context, with significant declines in the velocity and distance traveled (Fig. 2 B and Fig. S1 E). Previously, we demonstrated that Arp2/3 complex is required for haptotaxis, the directed migration on a gradient of substrate-bound cue such as the ECM protein, toward higher levels of FN (King et al., 2016; SenGupta et al., 2021; Wu et al., 2012). To determine if Coro1B and Coro1C are also involved in haptotaxis, we utilized microfluidic chambers to establish immobilized FN gradients as previously described (King et al., 2016). This approach allowed for the visualization of a mixed population of parental and null cells in the same chamber over 16 h, thus eliminating artifacts due to variable plating conditions (Fig. S1 F and Video 2). Forward migration index (FMI), which measures the directional fidelity of migration toward an extracellular cue (positive FMI), was significantly lower in null cells as compared to parental controls (Fig. 2, C and D). However, there was no significant difference in the velocities or distance travelled of parental and null cells in the microfluidic haptotaxis chambers (Fig. S1 G), likely to due to variable FN concentrations in the chambers that impact velocity (Wu et al., 2012).

Loss of Coro1B/1C affects random and directed migration and lamellipodia dynamics. (A) Sample plot depicting the tracks of parentals (cyan) and null (magenta) cells migrating on 10 μg/ml FN. (B) Beeswarm superplot depicting random migration velocity of parental (n = 223) and null (n = 300) fibroblasts. The mean of each biological replicate is color-coded and overlayed on violin plots. Error bars represent the standard error of mean. (C) Rose plots for parental (n = 102) and null (n = 139) cells on a FN gradient. (D) FMI graph (mean ± 95% confidence interval) for haptotaxis of cells on FN gradient. *P value = 0.04. (E) Example kymographs for parental and null cells. White and black arrows represent protrusion and retraction, respectively. Scale bar, 5 μm. (F–H) Beeswarm superplots of lamellipodial dynamics in parental (n = 17) and null (n = 16) cells showing (F) protrusion rate in microns per minute, (G) retraction rate in micron per minute and, (H) protrusion duration in minutes. For all graphs, Student’s t tests were performed. Error bars represent the SEM. ****P < 0.0001.
Loss of Coro1B/1C affects random and directed migration and lamellipodia dynamics. (A) Sample plot depicting the tracks of parentals (cyan) and null (magenta) cells migrating on 10 μg/ml FN. (B) Beeswarm superplot depicting random migration velocity of parental (n = 223) and null (n = 300) fibroblasts. The mean of each biological replicate is color-coded and overlayed on violin plots. Error bars represent the standard error of mean. (C) Rose plots for parental (n = 102) and null (n = 139) cells on a FN gradient. (D) FMI graph (mean ± 95% confidence interval) for haptotaxis of cells on FN gradient. *P value = 0.04. (E) Example kymographs for parental and null cells. White and black arrows represent protrusion and retraction, respectively. Scale bar, 5 μm. (F–H) Beeswarm superplots of lamellipodial dynamics in parental (n = 17) and null (n = 16) cells showing (F) protrusion rate in microns per minute, (G) retraction rate in micron per minute and, (H) protrusion duration in minutes. For all graphs, Student’s t tests were performed. Error bars represent the SEM. ****P < 0.0001.
Random migration of mouse tail fibroblasts.Parental (left) and null (right) cells randomly migrating on uniform FN. Images were acquired every 10 min for 16 h using a 20× objective on an Olympus VivaView FL incubator microscope.
Random migration of mouse tail fibroblasts.Parental (left) and null (right) cells randomly migrating on uniform FN. Images were acquired every 10 min for 16 h using a 20× objective on an Olympus VivaView FL incubator microscope.
Mouse tail fibroblasts migrating in a microfluidic haptotaxis chamber.Parental (left) and null (right) cells migrating on a gradient of FN. Images were acquired every 10 min for 16 h using a 10× objective on an Olympus VivaView FL Incubator Microscope.
Mouse tail fibroblasts migrating in a microfluidic haptotaxis chamber.Parental (left) and null (right) cells migrating on a gradient of FN. Images were acquired every 10 min for 16 h using a 10× objective on an Olympus VivaView FL Incubator Microscope.
To assess whether whole-cell migration defects in null cells were due to differences in their Arp2/3-based lamellipodial protrusion dynamics, we used kymography to quantify protrusions (Fig. 2 E and Video 3). We observed that null cells have lower protrusion rates compared to the parental controls (Fig. 2 F). Similarly, the rate of retraction of the lamellipodia in null cells was slower compared to parental cells (Fig. 2 G). Concomitantly, the protrusion duration of null cells significantly increased as compared to parental controls, with a noticeable increase in the distance of protrusions (Fig. 2 H and Fig. S1 H). Together, these data indicate that Coro1B and Coro1C tune lamellipodial protrusion and retraction dynamics, a phenotype that is likely required for maintaining the haptotactic fidelity of cells.
Lamellipodial protrusion dynamics of mouse tail fibroblasts.Parental (left) and null (right) cells plated on uniform FN to assess protrusion and retraction dynamics. Images were acquired every 2 s for 10 min using a 40× objective on a Nikon Biostation IM microscope.
Lamellipodial protrusion dynamics of mouse tail fibroblasts.Parental (left) and null (right) cells plated on uniform FN to assess protrusion and retraction dynamics. Images were acquired every 2 s for 10 min using a 40× objective on a Nikon Biostation IM microscope.
Lack of Coro1B and Coro1C results in increased leading edge Arp2/3 and branched actin
Considering the impact of Coro1B and Coro1C deletion on protrusion dynamics, we next examined how their deletion affected Arp2/3-branched actin. Due to coronin’s effects on actin depolymerization in several systems (Brieher et al., 2006; Cai et al., 2007b; Gandhi et al., 2010; Howell et al., 2015), we hypothesized that there would be an increase in the density of F-actin in lamellipodia of null cells. We stained parental and null lines with phalloidin to visualize F-actin density at the cell periphery (Fig. 3 A). From fluorescent images, we extracted the pixel intensity of actin within 5 μm of the edge, as previously described (Cai et al., 2007b). The width of F-actin staining in lamellipodia of null cells increased significantly, as compared to parental controls, despite similar total actin levels in the two populations determined from immunoblotting (Fig. 3 B and Fig. 4 B). Since previous work showed that coronins negatively regulate the Arp2/3 complex through direct inhibition of activation as well as debranching (Cai et al., 2005; Cai et al., 2008; Humphries et al., 2002), we stained cells for the Arpc2 subunit of the Arp2/3 complex to assess the impact of Coro1B and Coro1C on cortical distribution of Arp2/3 in cells (Fig. 3 C). We first quantified the percentage of the cell periphery that was positive for Arp2/3 complex, relative to the cell perimeter. A higher proportion of the periphery of null cells stained positive for Arpc2 as compared to parental cells, suggesting a dysregulation of Arp2/3-containing protrusions in null cells (Fig. 3, C and D). We next assessed the average intensity of Arpc2 at the leading edge to specifically address whether there were changes in the density of branched actin. We observed that Arpc2 intensity increased by roughly a third in the lamellipodia of null cells despite no change in the total Arpc2 levels in the two populations detected by immunoblotting (Fig. 3 E and Fig. S2 A). Null cells also tended to have broader Arpc2 localization at the leading edge, albeit not significantly different from parental cells (Fig. S2 B). Given the increase in F-actin density and Arpc2 intensity at the leading edge of null cells, we hypothesized that there would be a concomitant decrease in the actin retrograde flow and a consequent reduction in the actin polymerization rate, as compared to parental controls. To investigate the effect of Coro1B and Coro1C on the rate of actin polymerization at the periphery, we bleached mScarlet-tagged β-actin in discrete regions of the edge of lamellipodia and monitored the reemergence of the labeled dendritic actin network over time (Fig. 3 F). To account for the varying degrees of protrusive behavior during our analysis of the bulk leading-edge actin network dynamics, we defined the rate of actin polymerization as the sum of the actin retrograde flow rate and protrusion rate. As anticipated, null cells exhibited a decrease in the actin network polymerization rate relative to parental controls. Because the null cells exhibit this decrease in the bulk actin network flow rate while the width of the Arp2/3-labeled actin network remains unchanged (Fig. S2 B), this result suggests that Coro1B and Coro1C play a role in the turnover and recycling of branched actin at the lamellipodia (Fig. 3 G).

Deletion of Coro1B/1C impact F-actin dynamics at the lamellipodia. (A) Immunofluorescent staining of F-actin in parental and null cells; scale bar, 10 μm. Lower panels are 2× magnifications of boxed regions above; scale bar, 5 μm. (B) Beeswarm superplot depicting the width of actin at the edge of parental and null cells. Widths are calculated from maximum pixel intensities within 5 μm (lines) of the edge. (C) Representative images of Arpc2 localization in parental and null cells. Scale bar, 30 μm. Top right insets are magnifications of yellow boxed region. Scale bar, 5 μm. (D) Percentage of cell edge positive for Arpc2 signal (length of Arpc2-positive lamellipodia/cell perimeter × 100) for parental (n = 47) and null (n = 54) cells. (E) Fluorescence intensity of Arpc2 within 5 μm of the leading edge of parental (n = 45) and null (n = 34) cells. (F) Representative live-cell confocal micrographs of mScarlet-β-actin and Coro1B-GFP in parental and null cells (left). Scale bar, 5 μm. Corresponding kymographs on the right show mScarlet-β-actin returning to the bleached region indicated with a yellow dashed line in the panels on the left. Images were acquired roughly every 1 s and bleached at t = 3 s and t = 33 s as indicated by red arrowheads. (G) Quantification of polymerization rates in microns per minute of parental (n = 75) and null (n = 71) cells. For all beeswarm superplot graphs, Student’s t tests were performed and error bars denote SEM. *P value <0.041, **P value = 0.0018.
Deletion of Coro1B/1C impact F-actin dynamics at the lamellipodia. (A) Immunofluorescent staining of F-actin in parental and null cells; scale bar, 10 μm. Lower panels are 2× magnifications of boxed regions above; scale bar, 5 μm. (B) Beeswarm superplot depicting the width of actin at the edge of parental and null cells. Widths are calculated from maximum pixel intensities within 5 μm (lines) of the edge. (C) Representative images of Arpc2 localization in parental and null cells. Scale bar, 30 μm. Top right insets are magnifications of yellow boxed region. Scale bar, 5 μm. (D) Percentage of cell edge positive for Arpc2 signal (length of Arpc2-positive lamellipodia/cell perimeter × 100) for parental (n = 47) and null (n = 54) cells. (E) Fluorescence intensity of Arpc2 within 5 μm of the leading edge of parental (n = 45) and null (n = 34) cells. (F) Representative live-cell confocal micrographs of mScarlet-β-actin and Coro1B-GFP in parental and null cells (left). Scale bar, 5 μm. Corresponding kymographs on the right show mScarlet-β-actin returning to the bleached region indicated with a yellow dashed line in the panels on the left. Images were acquired roughly every 1 s and bleached at t = 3 s and t = 33 s as indicated by red arrowheads. (G) Quantification of polymerization rates in microns per minute of parental (n = 75) and null (n = 71) cells. For all beeswarm superplot graphs, Student’s t tests were performed and error bars denote SEM. *P value <0.041, **P value = 0.0018.

F-actin levels and cofilin activity are impacted by loss of Coro1B and Coro1C. (A) Immunofluorescent staining of parental and null populations for F-actin; Scale bar, 100 μm. (B) Integrated pixel density of phalloidin staining in fixed parental (n = 1,271) and null (n = 1,154) cells from A (top). Blots of total actin from matched whole cell lysates below. Ratios of actin levels relative to the HSC70 loading control are indicated below the blot. (C) Representative still frames from live cell imaging of parental and null cells expressing cofilin-mScarlet. Scale bar,10 μm. (D) Immunofluorescent staining for endogenous cofilin in parental and null cells. Scale bar, 10 μm. (E) Width of cofilin at the edge of parental (n = 46) and null (n = 48) cells. (F) Fold change in polymerization rate of parental and null cells after treatment with 100 nM jasplakinolide. Data is displayed using a logarithmic transformation to the base 2 and color-coded by experimental replicate. For bar graph, an unpaired Student’s t test with Welch’s correction was performed and error bars represent standard deviation. For beeswarm superplots, the mean of experimental replicates are color-coded and overlayed on violin plots representing cumulative cell level data. Error bars represent SEM. For all graphs, Student’s t tests were performed, unless otherwise stated. *P value = 0.04, **P value = 0.0032, ****P value <0.0001. Source data are available for this figure: SourceData F4.
F-actin levels and cofilin activity are impacted by loss of Coro1B and Coro1C. (A) Immunofluorescent staining of parental and null populations for F-actin; Scale bar, 100 μm. (B) Integrated pixel density of phalloidin staining in fixed parental (n = 1,271) and null (n = 1,154) cells from A (top). Blots of total actin from matched whole cell lysates below. Ratios of actin levels relative to the HSC70 loading control are indicated below the blot. (C) Representative still frames from live cell imaging of parental and null cells expressing cofilin-mScarlet. Scale bar,10 μm. (D) Immunofluorescent staining for endogenous cofilin in parental and null cells. Scale bar, 10 μm. (E) Width of cofilin at the edge of parental (n = 46) and null (n = 48) cells. (F) Fold change in polymerization rate of parental and null cells after treatment with 100 nM jasplakinolide. Data is displayed using a logarithmic transformation to the base 2 and color-coded by experimental replicate. For bar graph, an unpaired Student’s t test with Welch’s correction was performed and error bars represent standard deviation. For beeswarm superplots, the mean of experimental replicates are color-coded and overlayed on violin plots representing cumulative cell level data. Error bars represent SEM. For all graphs, Student’s t tests were performed, unless otherwise stated. *P value = 0.04, **P value = 0.0032, ****P value <0.0001. Source data are available for this figure: SourceData F4.
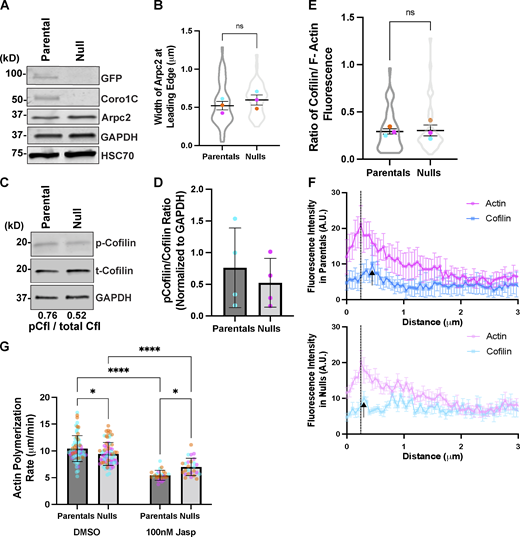
Deletion of Coro1B and Coro1C do not significantly impact Arpc2 and cofilin levels in fibroblasts. (A) Western blot analysis of Arpc2 in parental and null cells. (B) Width of Arpc2 at the edge in microns of parental (n = 22) and null (n = 24) cells. (C) Blot analysis of total cofilin and phospho-cofilin (p-cofilin) in parental and null cells. Average ratio of p-cofilin to total cofilin levels are depicted below blot. (D) Quantification of p-cofilin/cofilin ratios from parental and null populations. Each dot represents an independent experiment and error bars denote SD. (E) Quantification of the ratio between cofilin and F-actin fluorescence at the leading edge of parental (n = 46) and null (n = 46) cells. (F) Fluorescence intensity profiles of cofilin and actin in parental (n = 7) and null (n = 8) cells within 3 μm from the cell edge. Black dotted lines denote the average peak in F-actin intensity and black arrows depict a similar peak in cofilin fluorescence in parental and null cells. (G) Quantification of polymerization rates in microns per minute of parental and null cells in the presence and absence of 100 nM jasplakinolide; n > 25. Individual cell data from three experimental replicates are overlayed on bar graph, and error bars denote SD. Two-way ANOVA was performed. For all beeswarm superplots, the mean of experimental replicates are color-coded and overlayed on violin plots representing cumulative cell level data. For all graphs, Student’s t tests were performed, and error bars denote SEM, unless otherwise stated. *P value <0.04, ****P value <0.0001. Source data are available for this figure: SourceData FS2.

Deletion of Coro1B and Coro1C do not significantly impact Arpc2 and cofilin levels in fibroblasts. (A) Western blot analysis of Arpc2 in parental and null cells. (B) Width of Arpc2 at the edge in microns of parental (n = 22) and null (n = 24) cells. (C) Blot analysis of total cofilin and phospho-cofilin (p-cofilin) in parental and null cells. Average ratio of p-cofilin to total cofilin levels are depicted below blot. (D) Quantification of p-cofilin/cofilin ratios from parental and null populations. Each dot represents an independent experiment and error bars denote SD. (E) Quantification of the ratio between cofilin and F-actin fluorescence at the leading edge of parental (n = 46) and null (n = 46) cells. (F) Fluorescence intensity profiles of cofilin and actin in parental (n = 7) and null (n = 8) cells within 3 μm from the cell edge. Black dotted lines denote the average peak in F-actin intensity and black arrows depict a similar peak in cofilin fluorescence in parental and null cells. (G) Quantification of polymerization rates in microns per minute of parental and null cells in the presence and absence of 100 nM jasplakinolide; n > 25. Individual cell data from three experimental replicates are overlayed on bar graph, and error bars denote SD. Two-way ANOVA was performed. For all beeswarm superplots, the mean of experimental replicates are color-coded and overlayed on violin plots representing cumulative cell level data. For all graphs, Student’s t tests were performed, and error bars denote SEM, unless otherwise stated. *P value <0.04, ****P value <0.0001. Source data are available for this figure: SourceData FS2.
Coro1B and Coro1C are required for the maintenance of global F-actin and leading edge cofilin levels
To determine if the increase in F-actin observed at the leading edge translated to whole-cell effects, we tested the impact of Coro1B and Coro1C on the balance between F-actin and G-actin levels in cells. To do this, we used widefield epifluorescence microscopy to measure F-actin levels as visualized by phalloidin staining in whole cells at low magnification (Fig. 4 A). Then, using whole cell lysates, we quantified the total actin content in matched cells via immunoblotting. Although parental and null cells had similar levels of total actin, the proportion of F-actin in null cells increased by 17.9% as compared to parental controls (Fig. 4 B).
Since coronin and cofilin have been shown to work synergistically to regulate F-actin levels across several systems (Gandhi et al., 2010; Goode et al., 1999; Jansen et al., 2015; Kueh et al., 2008; Mikati et al., 2015), and similar increases in F-actin content have previously been observed upon depletion of cofilin (Hotulainen et al., 2005; Rasmussen et al., 2010; Tahtamouni et al., 2013), we sought to assess whether the loss of coronins affected cofilin localization or activity. We stably expressed cofilin-mScarlet in parental and null cells to visualize its dynamics in real time (Video 4). Previous in vitro work suggested that mammalian coronins were important for cofilin recruitment to actin filaments (Jansen et al., 2015), and we hypothesized that the increase in F-actin levels in our null cells was due to weaker localization and thus lower, severing the activity of cofilin in the lamellipodia of null cells. To our surprise, we observed a substantial enrichment of cofilin at the edge of null cells relative to parental controls, which had intermittent and weaker accumulation in lamellipodia (Fig. 4 C and Video 4). To ensure that this observation was not due to an artifact of tagged-cofilin overexpression, we used immunofluorescence to assess endogenous cofilin in the two populations. Consistent with our results using tagged cofilin, we observed a broader enrichment of endogenous cofilin at the leading edge of null cells as compared with parental cells (Fig. 4, D and E). To confirm that the accumulation of cofilin was not due to increases in protein expression, we assessed total and phosphorylated cofilin levels in parental and null cells via immunoblotting (Fig. S2 C). We observed relatively similar total and phosphorylated cofilin levels in parental and nulls cells (Fig. S2 D).
Localization dynamics of cofilin in cells.Parental (left) and null (right) cells exogenously expressing cofilin-mScarlet plated on uniform FN. Images were acquired every 2 s for 3 min using a 63× objective on a Zeiss LSM 800 microscope.
Localization dynamics of cofilin in cells.Parental (left) and null (right) cells exogenously expressing cofilin-mScarlet plated on uniform FN. Images were acquired every 2 s for 3 min using a 63× objective on a Zeiss LSM 800 microscope.
We next sought to addresss whether the accumulation of cofilin at the leading edge of nulls cells was the result of increased F-actin density in the lamellipodium (Fig. 3 A). We calculated the ratio of the mean fluorescence intensities of endogenous cofilin to F-actin in Arp2/3-positive, lamellipodial regions of cells. Null cells showed no significant difference in the ratio of cofilin to F-actin, relative to parental controls (Fig. S2 E), suggesting that the increased cofilin localization in the null cells may simply reflect higher F-actin content in this compartment. We also measured the spatial relationship of cofilin and F-actin at the leading edge of cells in the absence of Coro1B and Coro1C. In parental cells, cofilin intensity peaked 0.20 μm further from the cell edge relative to F-actin (Fig. S2 F). This is consistent with the notion that cofilin is normally recruited to aged actin that is enriched at the rear of lamellipodia (Svitkina and Borisy, 1999; Vitriol et al., 2013). In the null cells, we did not observe a discernible peak of cofilin fluorescence intensity; rather, cofilin localized broadly along the front-to-back axis of the lamellipodium (Fig. S2 F), suggesting that the normal pattern of F-actin turnover is disrupted without coronins.
To probe the synergistic relationship between coronins and cofilin in branched actin turnover further, we examined the effects of F-actin stabilization on the actin polymerization rate in cells with and without coronins. Cofilin depletion leads to a decrease in actin turnover and an increase in actin stress fibers (Hotulainen et al., 2005; Lee and Kumar, 2020; Munoz-Lasso et al., 2020), and to mimic these effects, we utilized a cell-permeant F-actin stabilizer that prevents monomer dissociation, Jasplakinolide (Jasp; Chandra et al., 2022; Ponti et al., 2005; Visegrady et al., 2004), which has been shown to cause comparable cellular phenotypes (Cramer, 1999; Ponti et al., 2005). In both parental and null cells, treatment with 100 nM of Jasp reduced actin polymerization rate (Fig. S2 G), consistent with its reported effects on F-actin turnover. However, coronin null cells were much less sensitive to Jasp treatment, showing less than half the reduction in actin polymerization rate with the same treatment (Fig. 4 F), and as a result, the null cells exhibited an overall higher rate than the parentals upon Jasp treatment (compare Fig. 3 G and Fig. S2 G). This suggests that the stability of cofilin-enriched F-actin in the lamellopodia of null cells is basally higher than the parental controls.
Loss of Coro1B and Coro1C increases cell contractility
The changes in global and lamellipodial actin turnover prompted us to investigate whether there were differences in contractility and the forces exerted by the cells on substrates. To initially assess this, we used a collagen contraction assay (Bell et al., 1979; Zagai et al., 2004) to determine if there were differences in macroscale cell-induced contraction of collagen gels (Fig. 5 A). Gels containing null cells showed a decrease in the area (indicating increased contraction) relative to that of gels containing equivalent numbers of parental control cells (Fig. 5 B). While promising, the contraction of collagen networks could involve several processes, including contractility and extracellular remodeling. To directly assess if contractility is affected in null cells, we utilized traction force microscopy to measure the contractile energy of individual cells on FN-coated polyacrylamide hydrogels. In brief, we plated mixed populations of cells on 8 kPa polyacrylamide hydrogels embedded with fluorescent beads using an established method (Knoll et al., 2014; Fig. S3 A; and Videos 5 and 6). As cells migrate on hydrogels, they exert mechanical forces that deform the substrate, which can be visualized and measured by the displacement of the fiducial fluorescent beads. Using these bead displacement measurements, we generated traction force maps, from which we computed various parameters such as strain energy density (energy stored in the substrate when it undergoes cell-specific deformations normalized by cell spread area), a well-known measure of contractile strength (Fig. 5 C; Butler et al., 2002). Consistent with the results from collagen gel contraction assays, the average strain energy density of null cells (15.22 ± 1.91 fJ/µm2) was significantly higher than that of parental controls (9.952 ± 0.93 fJ/µm2; Fig. 5 D).

Loss of Coro1B/1C increases contractility. (A) Representative collagen contractility gels. (B) Quantification of collagen gel area, 24 h post-plating, from control (n = 10), parental (n = 24), and null (n = 20) population, acquired from three independent experiments. One-way ANOVA with Dunn’s multiple comparison test performed. Error bars show 95% C.I. (C) Representative traction force maps of parental and null cells plated on 8 kPa polyacrylamide hydrogels. Scale bar, 50 μm. Scale (right) shows traction force magnitude in pascals. (D) Average strain energy density (in femtojoules per micron squared) of parental (n = 40) and null (n = 24) cells extracted from traction force map in C. Data represents two independent experiments with two technical replicates in each experiment. (E) Immunofluorescent staining of vinculin and F-actin in parental and null populations. Scale bar, 100 μm. Lower panels are 2× magnifications of vinculin and F-actin from boxed regions. (F) Graph depicts number of vinculin-positive adhesions per cell; parental (n = 19) and null (n = 18) cells. (G–I) Quantification of (G) vinculin fluorescence intensity; (H) area (in micron squared); and (I) aspect ratio of parental (n = 49) and null (n = 50) cells. For all beeswarm superplots, the mean of experimental replicates are color-coded and overlayed on violin plots representing cumulative cell-level data. Error bars denote SEM. For all graphs, Student’s t tests were performed. **P value <0.005, ***P value <0.0005, ****P value <0.0001.
Loss of Coro1B/1C increases contractility. (A) Representative collagen contractility gels. (B) Quantification of collagen gel area, 24 h post-plating, from control (n = 10), parental (n = 24), and null (n = 20) population, acquired from three independent experiments. One-way ANOVA with Dunn’s multiple comparison test performed. Error bars show 95% C.I. (C) Representative traction force maps of parental and null cells plated on 8 kPa polyacrylamide hydrogels. Scale bar, 50 μm. Scale (right) shows traction force magnitude in pascals. (D) Average strain energy density (in femtojoules per micron squared) of parental (n = 40) and null (n = 24) cells extracted from traction force map in C. Data represents two independent experiments with two technical replicates in each experiment. (E) Immunofluorescent staining of vinculin and F-actin in parental and null populations. Scale bar, 100 μm. Lower panels are 2× magnifications of vinculin and F-actin from boxed regions. (F) Graph depicts number of vinculin-positive adhesions per cell; parental (n = 19) and null (n = 18) cells. (G–I) Quantification of (G) vinculin fluorescence intensity; (H) area (in micron squared); and (I) aspect ratio of parental (n = 49) and null (n = 50) cells. For all beeswarm superplots, the mean of experimental replicates are color-coded and overlayed on violin plots representing cumulative cell-level data. Error bars denote SEM. For all graphs, Student’s t tests were performed. **P value <0.005, ***P value <0.0005, ****P value <0.0001.
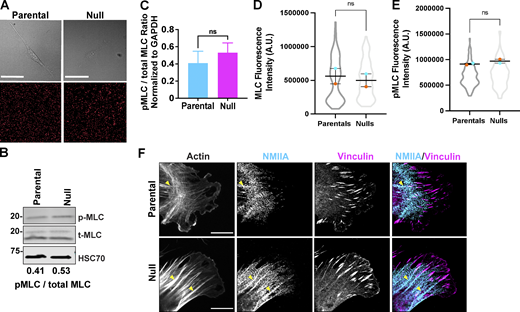
Deletion of Coro1B and Coro1C do not directly affect NMIIA localization and activity. (A) Still frames of parental and null cells (top) plated on 8 kPa polyacrylamide gels. Corresponding still images of fluorescent beads below. (B) Western blot analysis of myosin light chain (MLC) and phosphorylated MLC (pMLC) in parental and null populations. pMLC/MLC ratios are provided below. (C) Bar graph representing quantification of pMLC to total MLC ratios across five independent experiments. (D and E) Integrated fluorescence intensity of (D) MLC and (E) pMLC in parental (n = 181) and null (n = 193) cells. (F) Representative immunofluorescent staining of non-muscle myosin IIA, vinculin and F-actin in parental and null cells; Scale bar, 10 μm. Yellow arrowheads mark accumulation of NMIIA along actin bundles associated with focal adhesions. For all beeswarm superplots, the mean of experimental replicates are color-coded and overlayed on violin plots representing cumulative cell level data. For all graphs, Student’s t tests were performed, and error bars denote SEM, unless otherwise stated. Source data are available for this figure: SourceData FS3.

Deletion of Coro1B and Coro1C do not directly affect NMIIA localization and activity. (A) Still frames of parental and null cells (top) plated on 8 kPa polyacrylamide gels. Corresponding still images of fluorescent beads below. (B) Western blot analysis of myosin light chain (MLC) and phosphorylated MLC (pMLC) in parental and null populations. pMLC/MLC ratios are provided below. (C) Bar graph representing quantification of pMLC to total MLC ratios across five independent experiments. (D and E) Integrated fluorescence intensity of (D) MLC and (E) pMLC in parental (n = 181) and null (n = 193) cells. (F) Representative immunofluorescent staining of non-muscle myosin IIA, vinculin and F-actin in parental and null cells; Scale bar, 10 μm. Yellow arrowheads mark accumulation of NMIIA along actin bundles associated with focal adhesions. For all beeswarm superplots, the mean of experimental replicates are color-coded and overlayed on violin plots representing cumulative cell level data. For all graphs, Student’s t tests were performed, and error bars denote SEM, unless otherwise stated. Source data are available for this figure: SourceData FS3.
Traction force microscopy of a parental cell migrating on an 8 kPa polyacrylamide hydrogel coated with uniform FN. Migration of parental cell (left) and corresponding displacements of fiduciary fluorescent beads (right) embedded within hydrogels. Cells were imaged every 10 min for 2 h using a 20× air objective on a Nikon Eclipse Ti2 inverted widefield microscope.
Traction force microscopy of a parental cell migrating on an 8 kPa polyacrylamide hydrogel coated with uniform FN. Migration of parental cell (left) and corresponding displacements of fiduciary fluorescent beads (right) embedded within hydrogels. Cells were imaged every 10 min for 2 h using a 20× air objective on a Nikon Eclipse Ti2 inverted widefield microscope.
Traction force microscopy of a null cell migrating on an 8 kPa polyacrylamide hydrogel coated with uniform FN. Migration of null cell (left) and corresponding displacements of fiduciary fluorescent beads (right) embedded within hydrogels. Cells were imaged every 10 min for 2 h using a 20× air objective on a Nikon Eclipse Ti2 inverted widefield microscope.
Traction force microscopy of a null cell migrating on an 8 kPa polyacrylamide hydrogel coated with uniform FN. Migration of null cell (left) and corresponding displacements of fiduciary fluorescent beads (right) embedded within hydrogels. Cells were imaged every 10 min for 2 h using a 20× air objective on a Nikon Eclipse Ti2 inverted widefield microscope.
To test whether the increase in traction forces in null cells was due to an increase in the NMII activity, we used immunoblotting to measure the ratio of phosphorylated myosin light chain (pMLC) levels, an indicator of NMII activation, to total MLC (t-MLC) levels (Fig. S3 B). There was no significant difference in the ratio of pMLC/t-MLC in parental and null populations (Fig. S3 C), suggesting that the loss of Coro1B and Coro1C does not directly impact NMII activity (Clark et al., 2007). As an additional test, we used immunofluorescence to assess the fluorescence intensity of pMLC and t-MLC in the two populations and did not detect a significant difference in global intensities of pMLC and t-MLC (Fig. S3, D and E). To examine whether Coro1B and Coro1C might control contraction through local changes in NMII localization, we visualized NMII localization and organization in the two populations (Fig. S3 F). Although total NMII levels were similar between populations, we observed an increase in NMIIA recruitment to thick actin cables directly attached to mature FA in null cells, as compared to parental controls (Fig. S3 F). This suggests that the differences in force generation and contractility may be due to increased NMIIA loading on F-actin bundles, possibly due to decreased F-actin turnover.
We next sought to assess the impact of Coro1B and Coro1C KO on focal adhesions (FAs), as these structures are critical for fibroblasts to exert force upon the substrate. Using immunofluorescent staining of vinculin, a core focal adhesion protein (Fig. 5 E), we observed a significant increase in the number of adhesion sites and an increase in fluorescence intensity of vinculin at these sites in null cells relative to parental controls (Fig. 5, F and G). Further analysis of FAs revealed an increase in the area of adhesions in null cells as compared with parental controls (Fig. 5 H). We observed no significant change in the aspect ratio of vinculin-positive FAs in null cells relative to parental controls (Fig. 5 I). From this data, we postulate that the increase in size and intensity of these mechanosensitive adhesions in null cells leads to heightened force generation, owing to increased tension along the actin filaments directly attached to the FA.
The conditional knockout cell line system described here has yielded several important findings about the mechanistic function of type I coronins in cells. It has been known for some time that coronins colocalize with the Arp2/3 complex in cells, but here we find that inhibiting Arp2/3 branch formation with CK666 causes a near complete loss of coronin localization, despite the presence of other forms of non-branched F-actin in these cells. Thus it seems that while coronins readily bind to linear F-actin in vitro, they appear to require Arp2/3-branched actin for localization in cells. This suggests that type I coronins may need to engage with both Arp2/3 complex and F-actin for high-affinity binding in cells, prefer the branched geometry of dendritic networks, have a higher affinity for the newly generated branched F-actin in lamellipodia, or any combination of these factors to achieve proper cortical localization. Previous work indicated that coronins could inhibit the activation of the Arp2/3 complex and induce debranching (Cai et al., 2005; Cai et al., 2008; Humphries et al., 2002; Sokolova et al., 2017). The increased density of Arp2/3 complex in the lamellipodia of the coronin null cells is consistent with both potential mechanisms, but the decreased rate of actin polymerization observed in these cells is more consistent with an effect on debranching. However, it is difficult to disentangle coronin’s effects on Arp2/3 debranching from its effects enhancing cofilin function, since both can contribute to actin network turnover in the lamellipodium. Regardless of the precise contribution of each mechanism, it is clear that coronins are important for fine-tuning actin dynamics within lamellipodia, which in turn affect protrusion dynamics and whole-cell processes, such as haptotaxis.
Across many systems, coronins have been linked to the regulation of the ADF/cofilin family of proteins (Cai et al., 2007b; Goode et al., 1999; Kueh et al., 2008; Tang et al., 2020). Our data confirm that Coro1B and Coro1C are pro-cofilin factors, such that in their absence, F-actin levels in cells rise despite no change in total actin levels. However, our data are at odds with some of the proposed mechanisms of this functional interaction. Previous biochemical studies have suggested that coronins promote the binding of cofilin to F-actin, possibly by inducing conformational changes along the filaments, thus increasing their affinity for cofilin (Jansen et al., 2015; Mikati et al., 2015; Ydenberg et al., 2015). Based on this notion, it might be assumed that the absence of Coro1B and Coro1C would lead to much less cofilin localization at the leading edge. However, in our cells, the loss of coronins causes an increase in the amount of cofilin at the leading edge. The observed increase in cofilin localization at the leading edge, which may be coupled with the increase in F-actin levels in the same compartment, suggests a more complex mechanism may be at play. One possible explanation comes from recent studies of cofilin’s turnover mechanism which found that it tends to sever actin filaments at unstable boundaries between cofilin-decorated and undecorated regions (Huehn et al., 2018; Huehn et al., 2020). This is consistent with earlier studies showing that full saturation of filaments with cofilin leads to lower severing (Elam et al., 2013). Therefore, we reasoned that the increase in cofilin in lamellipodia of coronin null cells might oversaturate actin filaments, leading to lower F-actin severing and depolymerization at the leading edge. In this model, coronin’s role would be to “insulate” segments of filament from cofilin binding and create more boundaries between cofilin saturated and unsaturated segments, leading to more efficient severing and turnover. This insulating property of coronin would be consistent with its strong preference for binding to ATP/ADP-Pi actin filaments (Cai et al., 2007a; Merino et al., 2018) and the shift we observed in the distribution of cofilin staining intensity toward the leading edge in coronin null cells. Alternately, coronin may enhance cofilin’s F-actin severing/turnover mechanism by some structural changes in the actin filament unrelated to the nucleotide state, an idea supported by the lack of change in cofilin to F-actin ratio observed at the leading edge of coronin null cells. Further studies will be required to test these ideas to provide more mechanistic insight into the precise functional interaction between coronin and cofilin.
One interesting cellular consequence of reduced cofilin activity is altered cell contractility. Using a variety of assays, we found that contractility increased in the absence of coronins. Coronin was first identified in the contracted pellet of actin-myosin networks in Dictyostelium (de Hostos et al., 1991) and was later implicated in maintaining NMII at epithelial adherens junctions (Michael et al., 2016; Priya et al., 2016). Changes in cell contractility are usually attributed to the regulation of NMII; our observations, however, revealed no change in global or local changes in the phosphorylation of the regulatory myosin light chain (MLC) in the absence of coronins and no differences in NMIIA organization between the parental and null cells. These data suggest that coronin’s effect on contractility in coronin null cells is largely due its effects on F-actin, consistent with the model of reduced F-actin turnover impacting maturation of stress fibers, and in turn, cell contractility (Wiggan et al., 2017; Wiggan et al., 2012). Together, our data argue that cellular contractility can also be tuned at the level of F-actin turnover, in contrast to the conventional pathway of regulating NMII loading and activity on F-actin fibers. This expands the known regulatory repertoire that cells use to tune their response to variable mechanical environments and stimuli.
Materials and methods
Materials and reagents
Antibodies for Western blotting and immunofluorescence were purchased from Cell signaling (Cofilin, [5175s]; Phospho-Cofilin [Ser3] [3313s]; Phospho-Myosin Light Chain 2 [Thr18/ser19] [3672s]), Takara Bio (GFP-JL8 [632381]), Thermo Fisher Scientific (GAPDH (6C5), Coronin 1B (PA5-64443); ARPC2/p34-ARC (07-227); Hoechst 33342 (H3570); Rhodamine Red-X (goat anti-rabbit; R-6394); Phalloidin (Alexa Fluor 405 [A30104], 568[A12380], 647[A2287]; Dylight 405 [anti-rabbit] [35550], Dylight 405 [anti-mouse] [35500BID] and Cy5 [anti-rabbit] [A10523]), Santa Cruz (HSC70 [B6]), Sigma-Aldrich (Vinculin [V9131]), BioLegend (Myosin Heavy Chain II-A [909801]) ECM Biosciences (Myosin Light Chain [MM3441], Phospho-Myosin Light Chain [MP4221]). The Coronin 1C antibody was purified as previously described (Chan et al., 2012). 4-Hydroxytamoxifen, DMSO, CK666, N-Hydroxysuccinimide (NHS), 1-Ethyl-3-(3-dimethylaminopropyl) carbodiimide (EDC), 3-(Aminopropyl)triethoxysilane (APTES), and type I rat tail collagen were purchased from Sigma-Aldrich. PDMS-SYLGARD was purchased from Krayden. 20% Paraformaldehyde was purchased from EMS. Ammonium persulfate (APS) was purchased from Biorad. Non-fat dry milk, bovine serum albumin, puromycin, normal goat serum, 100× protease and phosphatase inhibitors, acrylamide solution (40%), bis-acrylamide solution (2%), tetramethylethylenediamine (TEMED), 6× laemmli buffer, 10× MEM and human FN were purchased from Thermo Fisher Scientific. Cy5-labelling kit purchased from GE Healthcare was used for FN conjugation, as previously described (Wu et al., 2012).
Cell culture and viral transduction
All cells were cultured and imaged live in high-glucose DMEM (4.5 g/l D-glucose, 0.584 g/l L-glutamate, 110 mg/l sodium pyruvate; Gibco) supplemented with 10% fetal bovine serum (MedSupply Partners), 100 U/ml Penicillin/Streptomycin (Invitrogen), and 1% Glutamax (Gibco) at 37 C and 5% CO2. For passaging and plating, cells were lifted by washing twice with DPBS (Gibco) followed by a 1-min incubation at 37 C 0.25% trypsin-EDTA (Gibco). An equal volume of culture media was added to cells to stop trypsin reaction, and once in suspension, cells were used as desired. To generate the parental line, mouse tail fibroblasts (MTFs) were stably transduced with pBabe-Puro retrovirus (Morgenstern and Land, 1990) expressing CreERT2 (Metzger et al., 1995) followed by puromycin selection (2 μg/ml). Puro-resistant cells were the stably transduced with human Coro1B-GFP (Cai et al., 2005) expressed in the pLL5.0 lentivirus (Vitriol et al., 2007). GFP-positive cells were selected using FACS and expanded. Parental cells were screened for Coro1B-GFP expression using Western blotting.
Tamoxifen treatment
Parental cells were plated at low density (∼50,000 cells) in 6-cm tissue culture dishes in duplicate (day 1). After 4 h, media in one dish was replaced and supplemented with 2 μM of 4-hydroxy-tamoxifen (4OHT) and 2 μg/ml puromycin to generate the null population. The parental control dish was supplemented with 1 μl 100% ethanol and 2 μg/ml puromycin. After 48 h (day 3), media was replaced with a second dose of 4-OHT and puromycin. After 48 h (day 5), cells were harvested for Western blot analysis, imaging, or expanded for other experiments described below. To suppress any effects of compensation, null cells were only used up to 2 wk after 4OHT treatment before repeating the process of generating a matched-pair parental and null cell lines for further experiment cells.
Western blotting
Cells (4 × 10⁵) were plated in 6-cm dishes and incubated overnight. The following day, plates were quickly washed once with cold 1X DPBS and then scraped in 4°C RIPA buffer—50 mM Tris, pH 8, 150 mM NaCl, 0.5% deoxycholate, 0.1% SDS, 1% NP-40, with 1× concentration of protease and phosphatase inhibitors (Thermo Fisher Scientific) and 1× Laemmli buffer (Alfa Aesar). For myosin light chain blotting specifically, cells were instead lysed in 200 μl of hot lysis buffer (1% SDS, 10 mM Tris-HCl, pH 7.4, 10 mM NaF and 10 mM sodium orthovanadate, warmed in a dry bath at 75°C). Lysates were sonicated twice for 20 s (1 s on; 0.5 s off) and supplemented with 3× Laemmli buffer and Dithiothreitol (DTT).
All lysates were boiled for 5 min, run on 4–12% gradient SDS-PAGE gels (Biorad), and transferred to nitrocellulose membranes (Thermo Fisher Scientific). Membranes were blocked with 5% (wt/vol) milk (or BSA for phosho-specific antibodies) for 1 h at room temperature (RT) before overnight incubation at 4°C with primary antibodies (diluted in 1% BSA with 0.01% sodium azide). Membranes were washed and then incubated at RT with secondary fluorescent-conjugated secondary antibodies (LI-COR). Western blots were developed using LI-COR Odyssey system and analyzed using ImageJ.
Migration and kymography
Glass-bottom dishes (CelVis) were uniformly coated with 10 μg/ml human FN (Corning) for 1 h at 37°C. Mixed populations of parental and null cells were plated and allowed to spread for 3 h. Cells were imaged at 37°C and 5% CO2 with a 20× objective on an Olympus VivaView FL microscope for 16 h at 10-min intervals. Single cells were tracked manually using the Manual Tracking plugin in ImageJ. Cell tracks were terminated when cells collided; migrated outside the field; divided or died. Velocity, forward migration index (FMI) and distance traveled were extracted from raw tracking data using the Chemotaxis Tool plugin in ImageJ. Wind-rose plots, which are circular histograms of final path endpoint relative to the starting point, were also generated using the Chemotaxis Tool plugin in ImageJ. Haptotaxis was performed as previously described (King et al., 2016). In brief, microfluidic chambers for haptotaxis were cast with polydimethylsiloxane (PDMS) from a custom-made silicone mold. Chambers were plasma cleaned, attached to 35 mm glass-bottom dishes, and then Cy5-conjugated FN (source concentration of 500 μg/ml FN) was used to establish the haptotactic gradients. Mixed populations of parental and null cells were plated and allowed to spread for 3 h before imaging. Random migration imaging and analysis parameters were also used for haptotaxis. For kymography, cells were imaged using phase contrast microscopy on a Biostation IM (Nikon) using a 40× objective for 10 min in 2-s intervals. Kymographs were generated from movies in ImageJ using the Multiple Kymograph plugin. Lines were drawn along protrusions and retractions, and the angles and lengths of these lines were recorded. A Perl script was used to extract protrusion rates, protrusion duration, protrusion distance and retraction rates from angle and length data.
Microscopy and image analysis
Confocal microscopy
Fixed and live-cell microscopy were performed on the Zeiss LSM800 microscope using 10×; 20×; 40× and 63× objectives for confocal and airyscan imaging. All movies and images were processed using Zen Blue, Matlab, or ImageJ software.
Immunofluorescence
Acid-washed coverslips were coated with 10 μg/ml FN for 1 h at 37°C. Cells were plated at ∼60% confluency and allowed to spread for 3 h. Cells were fixed at RT for 10 min with 4% paraformaldehyde (PFA) diluted in cytoskeleton buffer (10 mM MES, pH 6.1, 138 mM KCl 3 mM MgCl 2 mM EGTA). Sucrose was added to the buffer at a concentration of 0.32 M prior to dilution of 20% PFA (EMS). For immunostaining cofilin, cells were fixed for 12 min at 37°C. Cells were then permeabilized with 0.02% Triton X-100 (Thermo Fisher Scientific) at RT for 5 min and blocked with 5% BSA:5% normal goat serum (NGS) for 30 min at RT. Primary antibodies were diluted in 1% BSA and added to coverslips for 1.5 h at RT. Secondary antibodies were diluted in 1% BSA and incubated on coverslips for 1 h at RT. Coverslips were mounted in Fluoro-gel (EMS).
Cell spread size analysis
Coverslips were coated with 10 μg/ml FN as previously described, and 5,000 cells were plated on six coverslips per population (parental and null). Coverslips were placed in the incubator to spread and then fixed with 4% PFA at 15-, 30-, 45-, 60-, 120-, and 180-min time post-plating. After 10-min incubation with fixative, coverslips were transferred to a clean 24-well plate and washed with 1× PBS. After the final timepoint, cells were permeabilized and stained with phalloidin and Hoechst 33342 dye. Coverslips were imaged using 10× epifluorescence and then segmented to extract cell spread area using ImageJ and automated measuring.
Cell proliferation assay and analysis
Cells were trypsinized, counted using the TC20 Automated Cell Counter (Biorad), and 2 ml of culture media containing 104 cells were plated into each well of a six-well plate (day 0). To ensure equal plating density, 7 × 10⁴ cells from each population were resuspended in 14 ml of fresh media and 2 ml was added to each well. After 24 h (day 1), cells were trypsinized and counted. This was repeated for the following 5 d. Three independent experiments were performed in duplicates.
Polymerization rate analysis
Live cell micrographs were acquired of parental or null cells expressing mScarlet-β-actin via lentiviral infection using the 63× oil objective on the Zeiss LSM800. For the visualization of actin polymerization rates, discrete regions near the edge of protrusions covering roughly 2.5 µm inside and outside the cell (∼5 micron long total) and 2 µm wide were bleached (10 mW 561 nm laser, 0.76 μs pixel dwell time, 0.1 μm pixel size, four iterations) and subsequently monitored at ∼1 s per frame, rebleaching regular intervals to allow for multiple measurements per cell. ImageJ was used to extract the relevant metrics from live-cell imaging data. For the measurement of actin polymerization, kymographs were generated from regions of leading cell edges labeled with mScarlet-β-actin during sequential bleaching using the KymographBuilder Plugin. Fresh F-actin polymerization was visualized as shown in Fig. 3 F, and the overall width of returning mScarlet-β-actin to the dense leading-edge actin network the cell periphery was measured during steady-state protrusion events over a given time. Data was organized in Excel (Microsoft), and Prism (GraphPad) was used for statistical analysis and graphing data. Unpaired parametric t tests were utilized to assess statistical significance.
CK666 treatment
Coverslips were coated with 10 μg/ml FN and cells were plated and allowed to spread as described above. After 4 h, media was replaced and supplemented with 150 μM of CK666 or DMSO for 30 min. Cells were then immediately fixed by adding 20% PFA directly to media for a final concentration of 4% PFA to prevent the recovery of lamellipodia. Cells were permeabilized and immunostained for Arpc2 and Coro1C, and labeled phalloidin was used for F-actin visualization. Images were acquired using the 63× objective and airy scan settings (Zeiss LSM800) and processed using Zen Blue and ImageJ.
Width of protein at edge analysis
Cells were fixed and stained for phalloidin, cofilin, or Arpc2, as previously described. Images were acquired using the 63× objective (Zeiss LSM800). Lamellipodial regions were identified for analysis and 5-μm lines (6-pixel width) were drawn from the cell edge, perpendicular to the cell periphery, as previously described (Cai et al., 2007b). Pixel intensities of fluorescent proteins were extracted from lines and the width of protein at the edge was calculated as the distance between the cell edge and point at which 50% of signal decayed. Two regions were used for each cell.
Arpc2 intensity at cell edge
Cells were fixed, stained for Arpc2, and imaged using a 40× objective, as previously described. Edge intensity was measured in ImageJ as the mean gray value using the freehand tool. Regions positive for Arpc2 were outlined with a 3-μm line along the cell edge. This was done three times per cell. Values for each cell were averaged and corrected by subtracting the average mean gray value of the cell interior from periphery measurements.
Percentage of Arpc2-positive edge analysis
Cells were fixed and stained for Arpc2, as previously described, and images were acquired using the 40× objective (Zeiss LSM800). After maximum intensity projections of cells were generated, cell perimeter and the lengths of all Arpc2-positive regions of the edge were extracted using the freehand tool, with a width setting of 6 pixels, in ImageJ. Regions were deemed Arpc2-positive if the signal rose above the mean gray value of the cell interior. The cumulative length of the edge marked by this Arpc2 signal was divided by the perimeter of the cell and multiplied by 100 to generate the percentage of Arpc2 positive cell edge.
F-actin/total-actin quantification
After coating coverslips with FN, 3 × 10⁴ cells were plated for F-actin visualization. To ensure F-actin quantification matched with total actin levels in cells, a subset (1 × 10⁵) of trypsinized cells from the same population were spun at 1,000 g for 2 min. Whole-cell lysates were generated from pelleted cells using RIPA buffer as previously described (Rotty et al., 2015). Lysates were run on SDS-PAGE gels, and the total actin levels for each population were measured using the LI-COR imaging system. For quantification of F-actin content, cells were fixed and stained with phalloidin 4 h after plating. Epifluorescent images were then acquired with a 10× objective (Zeiss LSM800). Images were processed using a custom MATLAB script adapted from Mathworks and available on GitHub (https://github.com/maxhocken/ObjectOrientedSegmentation), which segmented cells and extracted integrated pixel intensities from phalloidin signal. In brief, the image processing toolbox is used to load each image file and a gradient Sobel filter is applied to the image, where the gradient is modulated in intensity by a fudge factor. This is moderated in a GUI where the fudge factor and other parameters including cell size can be altered to improve automatic segmentation. When complete, outputs are saved to a folder and can be loaded into a second GUI that allows fine-tuning of individual segmented masks by manually correcting mask shape. Once fine-tuning is complete, .csv files are produced with several morphological quantifications, mean gray value, and integrated fluorescence intensity.
MLC fluorescence intensity
Cells were plated overnight on 10 μg/ml FN as previously described. Cells were then fixed, immunostained for MLC (ECM Biosciences) and pMLC (ECM Biosciences), and the epifluorescent images were acquired using the 20× objective on the Zeiss LSM800. The cells were analyzed by manually segmenting with the freehand tool in ImageJ, and the integrated pixel intensities were extracted. Fluorescence intensities were corrected by subtracting background pixels from the integrated pixel intensity of each cell.
Focal adhesion analysis
The cells were plated on 10 μg/ml FN-coated glass and allowed to spread overnight. Fresh media was added to the cells 1 h prior to fixation. Cells were fixed at 37°C by directly adding 20% PFA to the media for a final concentration of 4% PFA. Cells were stained for vinculin and F-actin (phalloidin) and imaged using a 20× objective (Zeiss LSM800). To quantify focal adhesion numbers per cell, the multipoint feature in ImageJ was used. For analysis of focal adhesion morphology and intensity, vinculin-positive adhesions were manually segmented using the freehand tool in ImageJ. Area, mean gray value, integrated pixel intensity, and shape descriptors were extracted from segmentations.
Collagen gel contractility
Collagen gels were generated by adding 500 µl of 10× MEM (Gibco), 200 μl culture medium (DMEM and 10% FBS), and 270 µl of 7.5% sodium bicarbonate (Gibco) to 3.75 ml of 3 mg/ml rat tail type-I collagen (Gibco). About 765 µl of this mixture was added to a tube containing 1 million cells in 1.235 ml of culture media. Cells were quickly resuspended, and 400 µl of this mixture was added to wells and allowed to gel at 37°C with shaking every 15 min to prevent the sedimentation of cells. This was done for parental and null populations, as well as for the no-cell control. After 1 h, 1 ml of media was added to each well, and a P20 pipette tip was used to separate the gel from the well. Samples were placed in an incubator for 24 h before imaging plates using white light setting on ChemiDoc XRS system (Biorad). The area was analyzed using ImageJ. Data was acquired from three independent experiments.
Traction force microscopy
Hydrogel fabrication
Traction force microscopy (TFM) was performed as previously described (Han et al., 2015; Knoll et al., 2014). In brief, TFM substrates were generated using a mixture of 2% Bis-Acrylamide and 40% Acrylamide in water for a final volume of 10 ml to produce ∼8 kPa hydrogels (Tse and Engler, 2010). Glass-bottom dishes (Celvis) were activated with 0.5% APTES and 0.5% glutaraldehyde. Then 5 μl of 10% APS and 0.5 μl of TEMED were added to 495 μl of degassed polyacrylamide (PA) mixture, and 20 μl of this mix was added to the glass-bottom dish. A 12-mm coverslip coated with poly-D-Lysine and fluorescent beads is sandwiched as previously described (Knoll et al., 2014) and allowed to polymerize for 15 min. The dish was flooded with 2 ml of PBS for 15 min and the top coverslip was gently lifted, leaving behind the PA gel attached to the dish. The PA gel was then activated with an EDC and NHS reaction before the addition of 50 μg/ml FN for overnight incubation at 4°C. After three washes with PBS, gels were allowed to incubate in 1 ml of culture media at 37°C until cells were plated. Cells were trypsinized, counted, and then 50 μl of media containing 2,000 cells was added directly onto gels and incubated at 37°C for 30 min. After 30 min, 2 ml of media was added to the dish before incubating overnight at 37°C. Cells were imaged on a Nikon Eclipse Ti2 inverted widefield microscope with a 20× Air objective (MRD00205, NA: 0.75; Nikon) with a 1.5× tube lens in place for a final magnification of 30×. Images were taken every 10 min for 2 h before 50 µl of 10× SDS was added to acquire the relaxed state snapshot.
TFM processing and analysis
Traction force microscopy was performed using a MATLAB package available from the Danuser lab, as previously described (Han et al., 2015). Briefly, images were processed into single frames and passed through the MATLAB GUI. Drift correction was performed through Efficient Subpixel Registration. Displacement fields were calculated with high-resolution subsampling of beads and expecting no outward deformations. The template size for bead correlations was set to 21 pixels and maximum displacement to 20 pixels. Displacement field correction filtered vector field outliers using a normalized displacement residual of 2. Force field reconstruction was performed with FTTC with a Young’s modulus of 8 kPa and gel thickness of 135 μm. The regularization parameter was set constant to 0.00001 for all movies. Custom MATLAB scripts were used to extract traction maps and compute strain energy density. Force measurements were averaged over 2 h with images taken every 10 min. Cell spread area was computed by manual segmentation in the Fiji distribution of ImageJ for the first frame of each movie, and cells did not dramatically change spread area or cell shape over the course of the experiment.
Statistical analysis
All statistical analyses of raw data were performed in Prism (GraphPad). For beeswarm superplots, cell-level data (technical replicates) are represented by violin plots. Technical replicates are pooled per trial (biological replicate), color-coded, and overlayed on violin plots to demonstrate the reproducibility of the Coro1B and Coro1C KO system. Error bars on superplots represent the standard error of the mean of biological replicates, and statistical significance was determined from cell-level data, unless otherwise stated. For bar graphs, error bars represent the standard deviation, unless stated otherwise. For graphs depicting the mean as a single point, error bars represent 95% confidence intervals. Unless otherwise stated, statistical significance was determined using unpaired two-tailed t tests, with P values <0.05 considered as significant. For the calculation of actin polymerization rates, statistical outliers beyond three standard deviations from the mean were excluded from the analysis. To demonstrate the difference between the polymerization rates of jasplakinolide-treated and untreated cells, a ratio of the mean rate (before and after treatment) was determined per biological replicate for both parental and null populations. Fold change was computed as the logarithmic transformation of ratios to the base 2.
Online supplemental material
Fig. S1 shows F-actin regulators Coro1B and Coro1C are regulators of cell motility in fibroblasts. Fig. S2 shows that the deletion of Coro1B and Coro1C does not significantly impact Arpc2 and cofilin levels in fibroblasts. Fig. S3 shows deletion of Coro1B and Coro1C do not directly affect NMIIA localization and activity. Video 1 shows the random migration of mouse tail fibroblasts. Video 2 shows mouse tail fibroblasts migrating in a microfluidic haptotaxis chamber. Video 3 shows lamellipodial protrusion dynamics of mouse tail fibroblasts. Video 4 shows localization dynamics of cofilin in cells. Video 5 shows traction force microscopy of a parental cell migrating on an 8 kPa polyacrylamide hydrogel. Video 6 shows traction force microscopy of a null cell migrating on an 8 kPa polyacrylamide hydrogel.
Acknowledgments
We thank members of the Bear lab for scientific feedback on this work.
We gratefully acknowledge support from National Institutes of Health grants to J.E. Bear (R35GM130312) and Z.T. King (T32GM119999, F31GM133094).
The authors declare no competing financial interests.
Author contributions: Z.T. King: Conceptualization, Data curation, Formal Analysis, Investigation, Visualization, Writing—original draft, Writing—review & editing. M.T. Butler: Conceptualization, Data curation, Formal Analysis, Investigation, Writing—review & editing M.A. Hockenberry: Data curation, Formal Analysis, Investigation, Writing—review & editing B.C. Subramanian: Data curation, Formal Analysis, Investigation, Writing—review & editing P.F. Siesser: Data curation, Formal Analysis, Investigation. D.M. Graham: Investigation. W.R. Legant: Funding acquisition, Project administration, Supervision, J.E. Bear: Conceptualization, Funding acquisition, Project administration, Supervision, Writing—original draft, Writing—review & editing.

