


Integrins mediate cell adhesion by connecting the extracellular matrix to the intracellular cytoskeleton and orchestrate signal transduction in response to chemical and mechanical stimuli by interacting with many cytoplasmic proteins. We used BioID to interrogate the interactomes of β1 and β3 integrins in epithelial cells and identified PEAK1 as an interactor of the RGD-binding integrins α5β1, αVβ3, and αVβ5 in focal adhesions. We demonstrate that the interaction between integrins and PEAK1 occurs indirectly through Tensin3, requiring both the membrane-proximal NPxY motif on the integrin β tail and binding of the SH2 domain of Tensin3 to phosphorylated Tyr-635 on PEAK1. Phosphorylation of Tyr-635 is mediated by Src and regulates cell migration. Additionally, we found that Shc1 localizes in focal adhesions in a PEAK1 phosphorylated Tyr-1188–dependent fashion. Besides binding Shc1, PEAK1 also associates with a protein cluster that mediates late EGFR/Shc1 signaling. We propose a model in which PEAK1 binds Tensin3 and Shc1 to converge integrin and growth factor receptor signal transduction.
Introduction
Cell adhesion to the ECM is essential for the development and postnatal homeostasis of multicellular organisms. Cell–ECM adhesions are largely facilitated by the integrin family of adhesion receptors, which are formed through heterodimerization of an α and β subunit. Depending on the combination of the 24 α and 8 β subunits, integrins bind different ECM components, including laminins, collagens, and proteins containing an arginine (R), glycine (G), aspartic acid (D) tripeptide, such as fibronectin and vitronectin (Geiger and Yamada, 2011; Hynes, 2002). Integrins link the ECM to the intracellular cytoskeleton via a regulated network of adaptor proteins and recruit many cytoplasmic scaffolding and signaling proteins to generate an integrated signaling network with growth factor receptors (Morse et al., 2014). These protein complexes, known as the “integrin adhesome,” play key roles in a wide range of cellular processes, including cell migration, proliferation, differentiation, and survival. Failure to properly establish cell adhesion complexes can result in severe human diseases (Winograd-Katz et al., 2014).
Multiple studies have been undertaken to characterize the integrin adhesome and mechanistically understand how it drives a multitude of cellular functions in health and disease (Horton et al., 2016; Manninen and Varjosalo, 2017). These efforts have resulted in an extensive literature-based adhesome protein–protein interaction network (Winograd-Katz et al., 2014; Zaidel-Bar et al., 2007), and a large list of adhesome components are a result of multiple proteomic studies (Manninen and Varjosalo, 2017). Combining different proteomic studies generated a dataset of 60 components termed the consensus integrin adhesome (Horton et al., 2015; Humphries et al., 2009; Ng et al., 2014; Robertson et al., 2015; Schiller et al., 2011; Schiller et al., 2013). Remarkably, only half of the proteins in the consensus adhesome are described in the literature-curated adhesome (Manninen and Varjosalo, 2017), indicating the need for further refinement.
A powerful technology to study protein interactions at nanometer resolution in integrin adhesion sites is the proximity-dependent biotin identification (BioID) assay combined with mass spectrometry (MS)-based proteomics (Roux et al., 2012). BioID has been used to characterize the proximity interactors of the focal adhesion (FA) proteins Paxillin and Kindlin2 (Dong et al., 2016) and to map the composition and topological features of integrin adhesion complexes by using 16 commonly identified adhesome components as bait (Chastney et al., 2020). Integration of these BioID datasets revealed a network of 147 proteins, of which only 11 were identified by multiple bait proteins and most likely represent the core adhesome components (Chastney et al., 2020). We also successfully used BioID to characterize the proximitome of integrin β4 and β5 in epithelial cells (Te Molder et al., 2020; Wang et al., 2020; Zuidema et al., 2018).
In the present study, we characterized the proximitome of integrin β1 and β3 and found a set of five adhesome components also reported in other BioID datasets (Chastney et al., 2020; Dong et al., 2016). Among the established integrin interactors Talin1, Kindlin2, and Tensin3, we also identified Kank2 and pseudopodium-enriched atypical kinase 1 (PEAK1; SgK269). PEAK1 is a member of the PEAK family of pseudokinases, can form homo- or heterodimers with its family member inactive tyrosine-protein kinase PRAG1 (Skg223; Ha and Boggon, 2018; Patel et al., 2017; Patel et al., 2020), and associates with FAs and the EGFR signaling pathway (Bristow et al., 2013; Chastney et al., 2020; Dong et al., 2016; Wang et al., 2010; Zheng et al., 2013). How PEAK1 is integrated into FAs and whether it links FA and EGFR signaling is poorly understood. Several studies have reported elevated levels of PEAK1 and implicated PEAK1 in the regulation of tumor cell proliferation and invasion (Abu-Thuraia et al., 2020; Agajanian et al., 2015; Croucher et al., 2013; Ding et al., 2018; Fujimura et al., 2014; Kelber et al., 2012; Strnadel et al., 2017). Furthermore, it was shown that PEAK1 is phosphorylated by Src family kinases downstream of growth factor receptors, which promotes its localization in FAs (Agajanian et al., 2015; Bristow et al., 2013; Leroy et al., 2009; Wang et al., 2010; Zheng et al., 2013). PEAK1 also interacts with the scaffolding protein Shc1, which occurs upon EGF stimulation with a delayed kinetics and regulates the assembly of a protein cluster involved in cytoskeletal reorganization (Zheng et al., 2013). Finally, PEAK1 has been identified as a component of the canonical Src-p130Cas-CrkII-Paxillin and Erk signaling pathways (Wang et al., 2010). Our findings show that PEAK1 is a specific proximity interactor of RGD-binding integrins in FAs, and that phosphorylation of Tyr-635 in PEAK1 regulates cell migration through association with Tensin3. In turn, PEAK1 recruits Shc1 to FAs, which increases Shc1 phosphorylation and thereby links the integrin adhesion and EGFR signaling pathways.
Results
Identification of PEAK1 as core FA component
To characterize the integrin β1 and β3 proximitome by BioID (Fig. 1 A), we transfected β1-null mouse epithelial GE11 cells (Gimond et al., 1999) with integrin β1- or β3-BirA* cDNA and selected the bulk population of cells expressing the integrin-BirA* fusion proteins by FACS. Integrin β1- and β3-BirA* localized in FAs and β1-BirA* additionally in cell–cell contacts and in adhesion structures that resemble fibrillar adhesions/podosomes (Fig. 1 B). Cells were treated for 24 h with biotin before cell lysis, and untreated cells were used as negative controls. The use of untreated controls allowed us to normalize for any changes in protein composition resulting from expression of integrin β1 or β3. Purified proteins were run and excised from a stained polyacrylamide gel and analyzed by LC-MS/MS. We cannot rule out that the C-terminal fusion of the BirA* to the cytoplasmic tail of integrin β1 or β3 could interfere with the recruitment of some integrin-associated proteins; nevertheless this approach resulted in datasets of 170 and 61 proteins for β1 and β3, respectively (Fig. 1, C and D; Fig. S1; and Tables S1, S2, S3, and S4). Among the top integrin proximity interactors, we found the integrin-binding proteins Talin1/2, Kindlin2, and Tensin3. Furthermore, PEAK1 and Kank2 were also among the significantly enriched proteins (Fig. 1, C and D). Major differences between the β1 and β3 proximitomes were the integrin α subunits (α2, α3, α5, α6, and α7 for β1 and αV for β3) and the enrichment of CD151 in the proximity of β1 (Fig. 1 E). Further comparison of the β1 and β3 datasets revealed a common set of 46 proteins (Figs. 1 F and S1 A), which was further compared to the proximitomes of Paxillin and Kindlin2 (Dong et al., 2016) revealing an overlap with 6 adhesome components (Fig. 1 F). Among them were proteins associated with FAs (Talin1, Kindlin2, and Tensin3) and the cortical microtubule stabilizing complex (Kank2; Bouchet et al., 2016; Sun et al., 2016). Additionally, PEAK1 and EphA2 were identified in all four datasets. Talin1, Tensin3, Kank2, and PEAK1 were also identified by Chastney et al. (2020) using multiple FA proteins, including Kindlin2, as bait. Whereas Talin1 and Kindlin2 were reported in both the consensus adhesome (Horton et al., 2015) and the literature-curated adhesome (www.adhesome.org; Winograd-Katz et al., 2014; Zaidel-Bar et al., 2007), Tensin3 was reported only in the consensus adhesome, PEAK1 in the literature-curated dataset, and EphA2 and Kank2 in neither (Fig. 1 E).

Identification of PEAK1 as a proximity interactor of integrin β1 and β3. (A) Schematic depiction of the BioID assay. Integrin β subunits are tagged with the promiscuous biotin ligase BirA* on the cytoplasmic domain. Biotin is added to allow biotinylation of neighboring proteins, which are identified by MS analysis after cell lysis and isolation of biotinylated proteins using streptavidin beads. (B) Integrin β1- or β3-BirA* was expressed in β1-null GE11 cells and visualized using antibodies against the β1 or β3 subunit (magenta in merge). FAs (stained with phospho-Y31 Paxillin) are shown in green, and nuclei (stained with DAPI) in blue. Scale bar, 20 μm. (C and D) MS analysis of proximity interactors of β1 (C) and β3 (D). Cells were lysed after 24 h of 50 μM biotin treatment. Untreated cells were used as negative control. Volcano plot shows proteins enriched in biotin-treated over control samples. The logarithmic ratio of protein LFQs were plotted against negative logarithmic P values of a two-sided two-sample t test. The hyperbolic curve separates significantly enriched proteins from common binders (FDR: 0.05, n = 4). (E) Volcano plot shows the proximity interactors of β1 versus β3 for samples treated with biotin. (F) Comparison of the proximity interactors of β1/3 and Kindlin2/Paxillin (Dong et al., 2016) results in six proteins found in all datasets. Of these six proteins, five are also identified in the integrin adhesome BioID study of Chastney et al. (2020) (bold font). 1, mentioned in consensus adhesome (Horton et al., 2015); 2, www.adhesome.org.
Identification of PEAK1 as a proximity interactor of integrin β1 and β3. (A) Schematic depiction of the BioID assay. Integrin β subunits are tagged with the promiscuous biotin ligase BirA* on the cytoplasmic domain. Biotin is added to allow biotinylation of neighboring proteins, which are identified by MS analysis after cell lysis and isolation of biotinylated proteins using streptavidin beads. (B) Integrin β1- or β3-BirA* was expressed in β1-null GE11 cells and visualized using antibodies against the β1 or β3 subunit (magenta in merge). FAs (stained with phospho-Y31 Paxillin) are shown in green, and nuclei (stained with DAPI) in blue. Scale bar, 20 μm. (C and D) MS analysis of proximity interactors of β1 (C) and β3 (D). Cells were lysed after 24 h of 50 μM biotin treatment. Untreated cells were used as negative control. Volcano plot shows proteins enriched in biotin-treated over control samples. The logarithmic ratio of protein LFQs were plotted against negative logarithmic P values of a two-sided two-sample t test. The hyperbolic curve separates significantly enriched proteins from common binders (FDR: 0.05, n = 4). (E) Volcano plot shows the proximity interactors of β1 versus β3 for samples treated with biotin. (F) Comparison of the proximity interactors of β1/3 and Kindlin2/Paxillin (Dong et al., 2016) results in six proteins found in all datasets. Of these six proteins, five are also identified in the integrin adhesome BioID study of Chastney et al. (2020) (bold font). 1, mentioned in consensus adhesome (Horton et al., 2015); 2, www.adhesome.org.
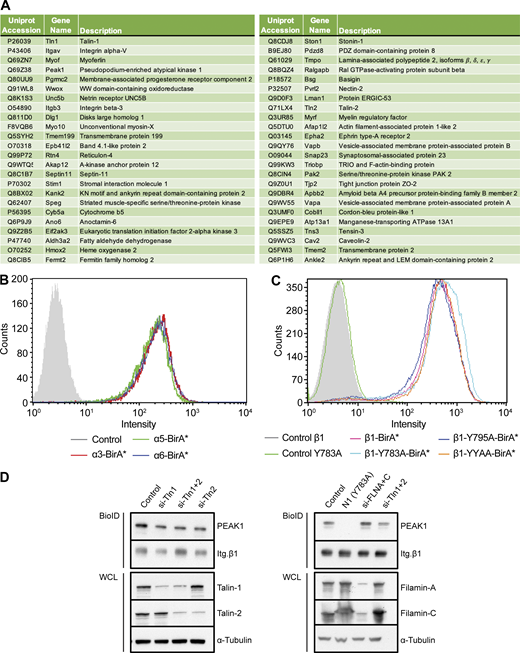
Identification of overlapping proteins in β1- and β3-BioID data sets, expression of integrin subunits and knockdown of integrin NPxY-binding proteins. (A) Table of proteins identified in both the integrin β1-BirA* and integrin β3-BirA* BioID datasets. (B and C) Flow cytometry analyses of Itg. β1 expression in GE11 cells stably expressing the indicated integrin α (B) or mutant β1 (C) subunits with a C-terminal BirA* tag. (D) Western blots of BioID assays performed using GE11/β1-BirA* cells transfected with siRNAs against Talin1/2 or Filamin A/C 72 h before cell lysis. All samples were treated with 50 μM biotin 24 h before cell lysis. WCL, whole-cell lysate. Source data are available for this figure: SourceData FS1.
Identification of overlapping proteins in β1- and β3-BioID data sets, expression of integrin subunits and knockdown of integrin NPxY-binding proteins. (A) Table of proteins identified in both the integrin β1-BirA* and integrin β3-BirA* BioID datasets. (B and C) Flow cytometry analyses of Itg. β1 expression in GE11 cells stably expressing the indicated integrin α (B) or mutant β1 (C) subunits with a C-terminal BirA* tag. (D) Western blots of BioID assays performed using GE11/β1-BirA* cells transfected with siRNAs against Talin1/2 or Filamin A/C 72 h before cell lysis. All samples were treated with 50 μM biotin 24 h before cell lysis. WCL, whole-cell lysate. Source data are available for this figure: SourceData FS1.
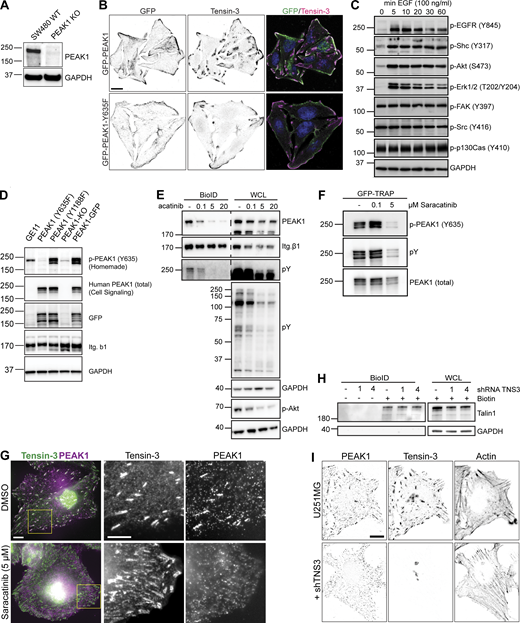
Biochemical and immunofluorescent analysis of Tensin3-PEAK1 interactions. (A) SW480 WT or PEAK1 KO (generated using CRISPR/Cas9) cells were lysed and analyzed by Western blot for PEAK1 expression. (B) SW480 PEAK1 KO cells stably expressing GFP-PEAK1 or GFP-PEAK1-Y635F cultured overnight on coverslips before fixation and staining for Tensin3; scale bar, 10 µm. (C) GE11 cells expressing GFP-PEAK1 were serum starved for 16 h and treated with 50 ng/ml EGF for the indicated periods of time. Phosphorylation of indicated proteins was analyzed by Western blot. (D) Lysates of GE11 cells (GE11) and PEAK1-deficient GE11 cells (KO) reconstituted with GFP-PEAK1 (WT) or the GFP-PEAK1 mutants (Y635F and Y1188F) were analyzed by Western blot with antibodies against phospho-PEAK1 (Y365; homemade), total PEAK1, GFP, β1 integrin, or GAPDH. (E) Representative Western blots of BioID assays performed using GE11/β1-BirA* cells treated with different concentrations of the Src inhibitor Saracatinib (AZD0530) for 24 h. (F) GFP-PEAK1 was expressed in PEAK1-deficient GE11 cells, and cells were treated with Saracatinib as indicated for 24 h before cell lysis. Subsequently, GFP pull-downs were performed, and PEAK1 Y635 phosphorylation was analyzed by Western blot. (G) U251MG cells spread on fibronectin-coated coverslips overnight with either Saracatinib (5 µM) or an equivalent volume of DMSO were fixed and stained for Tensin3 and PEAK1. Note the absence of PEAK1 from Tensin3 positive adhesion structures in Src inhibited cells. Scale bar, 10 µm. (H) Representative Western blots of BioID assays performed using integrin β5–deficient U251MG cells expressing β5-BirA*, in which Tensin3 was depleted by two different shRNAs (1 and 4). Cells were treated with 50 μM biotin 24 h before cell lysis. WCL, whole-cell lysate. (I) U251MG cells transfected with control or shRNA against TNS3 were fixed and stained for PEAK1 and Tensin3. Note the lack of PEAK1 at cell matrix adhesions in shTNS3 cells. Scale bar, 10 µm. Source data are available for this figure: SourceData FS2.
Biochemical and immunofluorescent analysis of Tensin3-PEAK1 interactions. (A) SW480 WT or PEAK1 KO (generated using CRISPR/Cas9) cells were lysed and analyzed by Western blot for PEAK1 expression. (B) SW480 PEAK1 KO cells stably expressing GFP-PEAK1 or GFP-PEAK1-Y635F cultured overnight on coverslips before fixation and staining for Tensin3; scale bar, 10 µm. (C) GE11 cells expressing GFP-PEAK1 were serum starved for 16 h and treated with 50 ng/ml EGF for the indicated periods of time. Phosphorylation of indicated proteins was analyzed by Western blot. (D) Lysates of GE11 cells (GE11) and PEAK1-deficient GE11 cells (KO) reconstituted with GFP-PEAK1 (WT) or the GFP-PEAK1 mutants (Y635F and Y1188F) were analyzed by Western blot with antibodies against phospho-PEAK1 (Y365; homemade), total PEAK1, GFP, β1 integrin, or GAPDH. (E) Representative Western blots of BioID assays performed using GE11/β1-BirA* cells treated with different concentrations of the Src inhibitor Saracatinib (AZD0530) for 24 h. (F) GFP-PEAK1 was expressed in PEAK1-deficient GE11 cells, and cells were treated with Saracatinib as indicated for 24 h before cell lysis. Subsequently, GFP pull-downs were performed, and PEAK1 Y635 phosphorylation was analyzed by Western blot. (G) U251MG cells spread on fibronectin-coated coverslips overnight with either Saracatinib (5 µM) or an equivalent volume of DMSO were fixed and stained for Tensin3 and PEAK1. Note the absence of PEAK1 from Tensin3 positive adhesion structures in Src inhibited cells. Scale bar, 10 µm. (H) Representative Western blots of BioID assays performed using integrin β5–deficient U251MG cells expressing β5-BirA*, in which Tensin3 was depleted by two different shRNAs (1 and 4). Cells were treated with 50 μM biotin 24 h before cell lysis. WCL, whole-cell lysate. (I) U251MG cells transfected with control or shRNA against TNS3 were fixed and stained for PEAK1 and Tensin3. Note the lack of PEAK1 at cell matrix adhesions in shTNS3 cells. Scale bar, 10 µm. Source data are available for this figure: SourceData FS2.
The identification of Talin1, Kindlin2, Tensin3, Kank2, and PEAK1 as adhesome components in multiple studies, together with their close association to integrin β1 and β3 observed in our experiments, points to their crucial role in integrin function. Because the interaction between PEAK1 and integrins is poorly understood, we decided to study this interaction.
PEAK1 interacts with RGD-binding integrins
Cell adhesion to fibronectin was shown to induce PEAK1 tyrosine phosphorylation (Wang et al., 2010). The fibronectin dependence of this process suggests that PEAK1 associates with RGD-binding integrins. Immunofluorescence analysis of endogenous PEAK1 (Fig. 2 A) or overexpression of PEAK1-GFP (Fig. 2 B) in GE11/β1-BirA* cells shows that the protein localized to cell matrix adhesions.
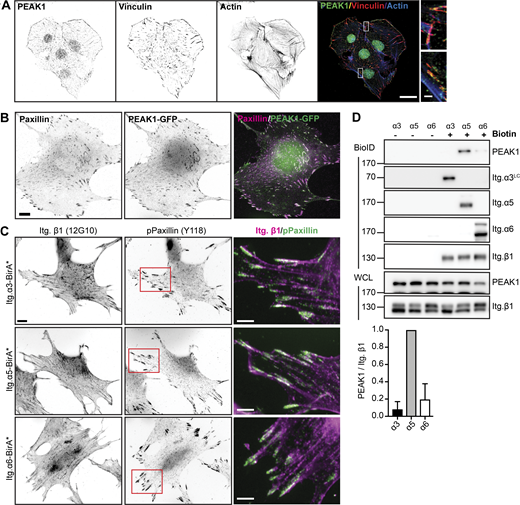
PEAK1 interacts with integrin α5β1. (A) Immunofluorescence analysis of PEAK1 (green in merge), vinculin (red in merge), and actin (blue in merge) in GE11 cells expressing β1-BirA*. Nuclear localization of PEAK1 is not specific. Scale bar, 20 µm; in magnified region, 2 µm. (B) Overexpression of PEAK1 in GE11 Tet-ON integrin β1 cells treated with 1 μg/ml doxycycline for 48 h to induce β1 expression. Scale bar, 20 μm. (C) Integrin α3-, α5-, or α6-BirA* was expressed in GE11 cells that stably express β1. Subcellular distribution of (active) β1 (12G10 antibody; magenta in merge) together with Paxillin (Y118) is shown. Scale bar, 10 μm; scale bar in magnified regions, 5 µm. (D) Representative Western blots of the BioID assays performed using the GE11/β1 cells expressing the integrin α3-, α5-, or α6-BirA* shown in C. Cells were grown to subconfluence in plastic tissue culture plates and treated with 50 μM biotin for 24 h before cell lysis. Quantifications of PEAK1 signal intensities normalized to integrin β1 levels are shown (n = 3; bars show mean with SD). Source data are available for this figure: SourceData F2.
PEAK1 interacts with integrin α5β1. (A) Immunofluorescence analysis of PEAK1 (green in merge), vinculin (red in merge), and actin (blue in merge) in GE11 cells expressing β1-BirA*. Nuclear localization of PEAK1 is not specific. Scale bar, 20 µm; in magnified region, 2 µm. (B) Overexpression of PEAK1 in GE11 Tet-ON integrin β1 cells treated with 1 μg/ml doxycycline for 48 h to induce β1 expression. Scale bar, 20 μm. (C) Integrin α3-, α5-, or α6-BirA* was expressed in GE11 cells that stably express β1. Subcellular distribution of (active) β1 (12G10 antibody; magenta in merge) together with Paxillin (Y118) is shown. Scale bar, 10 μm; scale bar in magnified regions, 5 µm. (D) Representative Western blots of the BioID assays performed using the GE11/β1 cells expressing the integrin α3-, α5-, or α6-BirA* shown in C. Cells were grown to subconfluence in plastic tissue culture plates and treated with 50 μM biotin for 24 h before cell lysis. Quantifications of PEAK1 signal intensities normalized to integrin β1 levels are shown (n = 3; bars show mean with SD). Source data are available for this figure: SourceData F2.
Integrin αVβ3 is a receptor for RGD-containing ECM proteins, but β1 can heterodimerize with 12 different α subunits to additionally mediate adhesion to laminins and collagens. To study the specificity of the integrin–PEAK1 interaction, we overexpressed integrin α3-, α5-, or α6-BirA* fusion proteins in GE11 cells that also stably express integrin β1. These integrin α subunits are expressed at high levels in GE11 cells and are among the top hits in the β1 proximitome (Fig. 1 C). All overexpressed integrin α BirA* constructs were expressed at the cell surface and similar levels of Itg. β1 could be detected using FACS analysis (Fig. S1 B). Integrin α3β1 and α6β1 are laminin receptors, whereas α5β1 binds fibronectin. Overexpression of the α subunits resulted in an altered β1 subcellular distribution, with β1 localizing in FAs in the α5-BirA*–expressing cells and showing a more dispersed organization in the α3- and α6-BirA*–expressing cells (Fig. 2 C), likely owing to the ability of integrin α3β1 and α6β1, but not α5β1, to incorporate into tetraspanin webs through their interaction with CD151 (Charrin et al., 2014).
To examine whether PEAK1 associates primarily with the RGD-binding α5β1 integrin, we performed BioID assays combined with Western blot analysis to determine the levels of biotinylated PEAK1 in GE11 cells stably expressing integrin β1 and overexpressing integrin α3-, α5-, or α6-BirA* fusion proteins. Strong biotinylation of PEAK1 was detected in cells expressing α5-BirA* but was absent or hardly detected in cells expressing the α3- or α6-BirA* constructs (Fig. 2 D). Altogether, these findings demonstrate that PEAK1 localizes in FAs and acts downstream of the RGD-binding integrins α5β1 and αVβ3.
Tensin3 links PEAK1 and integrins
Many adaptor proteins engage with the conserved membrane-proximal (MP) NPxY or membrane-distal (MD) NxxY motifs on the cytoplasmic tail of integrin β subunits (Calderwood et al., 2003). For example, the MP-NPxY is required for the interaction of Talin1 with the integrin β1/3 subunit, while the MD-NxxY motif is needed for Kindlin2 binding (Moser et al., 2009). PEAK1 does not contain an integrin-binding FERM or PTB domain found in other proteins that interact with the MP-NPxY or MD-NxxY motifs (Wang et al., 2010). Therefore, we hypothesized that the interaction between PEAK1 and integrin β subunits might be indirect, through an adaptor protein. To further examine the PEAK1–integrin interaction, we generated β1- and β3-BirA* fusion proteins carrying disruptive Y>A mutations in the MP-NPxY (termed N1), MD-NxxY (termed N2), or both (termed N1 + 2; Fig. 3 A). These mutants were stably expressed in β1-null GE11 cells; FACS analysis confirmed that all the mutants were expressed at the cell surface at similar levels (Fig. S1 C). The generated cell lines were used to perform BioID combined with MS (Fig. 3, B and C). Our experiments revealed that the proximity of Talin, Tensin3, and PEAK1 to β1/3 was strongly impaired when MP-NPxY was mutated and reduced when MD-NPxY was mutated. These results were confirmed by performing BioID assays in combination with Western blot analysis (Fig. 3, D and E).
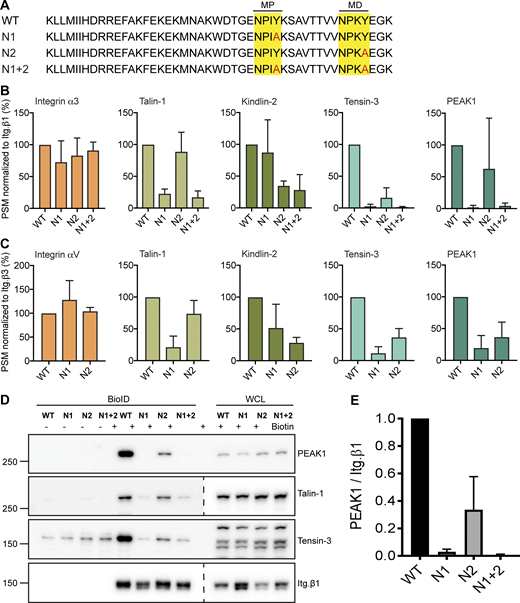
Integrin β1 and β3 MP-NPxY motif required for interaction with PEAK1. (A) Amino acid sequence of integrin β1 cytoplasmic domain and β1 mutants that contain Y>A mutations in the MP and/or MD NPxY motifs. (B and C) Peptide spectral match (PSM) values of selected proximity interactors of β1 (B) and β3 (C) WT and NPxY/NxxY mutants as analyzed by MS. PSM values are normalized to the PSM values of the integrin-BirA* fusion protein (n = 3; bars show mean with SD). (D) Validation by Western blot of the experiments shown in B and C. WCL, whole-cell lysate. (E). Quantifications of PEAK1 signal intensities normalized to integrin β1 levels are shown (n = 3; bars show mean with SD). Source data are available for this figure: SourceData F3.
Integrin β1 and β3 MP-NPxY motif required for interaction with PEAK1. (A) Amino acid sequence of integrin β1 cytoplasmic domain and β1 mutants that contain Y>A mutations in the MP and/or MD NPxY motifs. (B and C) Peptide spectral match (PSM) values of selected proximity interactors of β1 (B) and β3 (C) WT and NPxY/NxxY mutants as analyzed by MS. PSM values are normalized to the PSM values of the integrin-BirA* fusion protein (n = 3; bars show mean with SD). (D) Validation by Western blot of the experiments shown in B and C. WCL, whole-cell lysate. (E). Quantifications of PEAK1 signal intensities normalized to integrin β1 levels are shown (n = 3; bars show mean with SD). Source data are available for this figure: SourceData F3.
To determine which integrin MP-NPxY motif interacting protein could mediate the PEAK1–integrin association, we depleted established interactors of the integrin MP-NPxY motif by using siRNAs and studied the effects on the integrin–PEAK1 interaction by BioID and Western blot. Interestingly, knockdown of Talin1/2 or Filamins (Calderwood et al., 2003; Kiema et al., 2006) did not reduce the integrin β1–PEAK1 proximity interaction (Fig. S2 D). We therefore wondered whether the proximity interaction between RGD-binding integrins and PEAK1 could be mediated by Tensin3, which contains a C-terminal PTB domain shown to interact with the integrin MP-NPxY domain (Calderwood et al., 2003; McCleverty et al., 2007) and was identified as an interactor of β1 and β3 in our proximity screen (Figs. 1 and 3). Unfortunately, we were unable to successfully reduce Tensin3 expression by using siRNAs/shRNAs or CRISPR/Cas9-mediated gene disruption in GE11 cells. As an alternative approach to investigate whether Tensin3 mediates the integrin–PEAK1 association, we generated PEAK1-deficient GE11/β1-BirA* cells using CRISPR/Cas9 and subsequently introduced WT or mutant forms of PEAK1 that carried a Y635F or Y1188F substitution. The Y635F mutation was selected based on the remarkable similarity of the 635YDNL sequence in PEAK1 to the YDNV sequence present in DLC1, which mediates an interaction with the Tensin SH2 domain that precedes the PTB domain (Liao et al., 2007; Yam et al., 2006). Moreover, YDNL was identified as a binding peptide motif in a pY peptide library screen using the SH2 domain of Tensin (Wavreille and Pei, 2007). On the other hand, Y1188 was shown to bind Shc1, which could represent an alternative connection between PEAK1 and the integrin β NPxY motif (Cowan et al., 2000; Deshmukh et al., 2010; Smith et al., 2006; Zheng et al., 2013). BioID experiments combined with Western blot analysis clearly indicated that phosphorylation of Y635 in PEAK1 establishes the proximity interaction with integrin β1, while Shc1 binding is not required for the PEAK1–β1 interaction (Fig. 4, A and B).
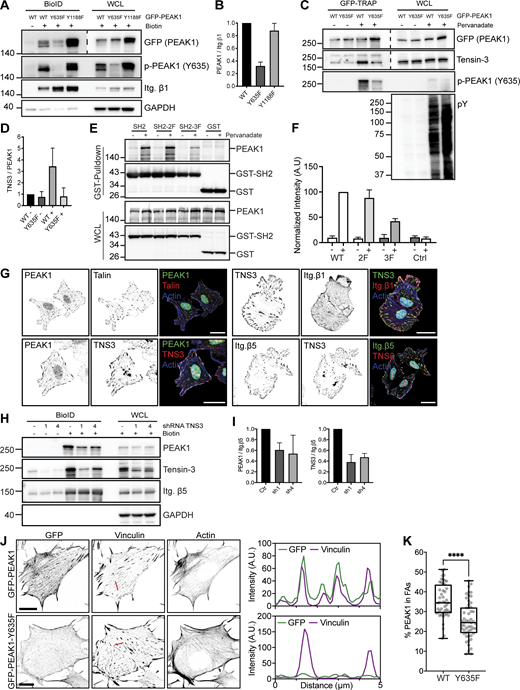
Tensin3 binds to p-Y635 PEAK1. (A) Integrin β1-BirA* and GFP-PEAK1 WT or Y635F/Y1188F mutants were expressed in PEAK1-deficient GE11 cells. Representative Western blots of BioID assays are shown. (B) Quantifications of PEAK1 signal intensities normalized to integrin β1 levels are shown (n = 3; bars show mean with SD). (C) GFP-PEAK1 WT and Y635F mutant were expressed in PEAK1-deficient SW480 cells. Cells were serum starved overnight and then treated with pervanadate for 10 min before cell lysis. Representative Western blots are shown of GFP-TRAP experiments. WCL, whole-cell lysate. (D) Quantification of Tensin3 signal intensities normalized to PEAK1 (GFP) levels are shown (n = 3; bars show mean with SD). (E) COS-7 cells transiently transfected with GST and GST-SH2 constructs together with a plasmid expressing HA-tagged full-length PEAK1 were treated with or without pervanadate for 10 min. Cell lysates derived from these transfected cells were subjected to a GST pull-down assay with glutathione-Sepharose (GE Healthcare). WCLs and the pulled-down proteins were analyzed by Western blotting with antibodies against PEAK1 (D4G6J) and GST (2F3). (F) Quantification of Tensin3 signal intensities normalized to those of GST are shown (n = 3; bars show mean with SD). (G) Colocalization of PEAK1, Talin, Tensin3, and integrin β1 and β5 (shown in green or red in merge) in U251MG cells seeded on glass coverslips and cultured in medium supplemented with 10% FCS. Actin cytoskeleton (blue) and nuclei (cyan) are visualized. Scale bar, 20 μm. (H) Representative Western blots of BioID assays performed using integrin β5–deficient U251MG cells expressing β5-BirA*, in which Tensin3 was depleted by two different shRNAs (1 and 4). Cells were treated with 50 μM biotin 24 h before cell lysis. (I) Quantifications of PEAK1 and Tensin3 signal intensities normalized to integrin β5 levels are shown (n = 3; bars show mean with SD) in I. (J) Colocalization of vinculin and GFP-PEAK1 WT versus Y635F in PEAK1-deficient GE11 tet-ON integrin β1 cells treated with 1 μg/ml doxycycline for 48 h to induce β1 expression. Scale bar, 10 μm. (K) Quantifications of colocalization of FAs and PEAK1 (calculated as a percentage of total PEAK1) of immunofluorescence images as shown in K. FAs were stained with vinculin or pY. n = 3; total number of cells analyzed: 47 (WT); 53 (Y635F). Box plots range from the 25th to 75th percentile; central line indicates the median; whiskers show smallest to largest value. Mann–Whitney U test was performed to determine statistical significance. ****, P < 0.0001. Source data are available for this figure: SourceData F4.
Tensin3 binds to p-Y635 PEAK1. (A) Integrin β1-BirA* and GFP-PEAK1 WT or Y635F/Y1188F mutants were expressed in PEAK1-deficient GE11 cells. Representative Western blots of BioID assays are shown. (B) Quantifications of PEAK1 signal intensities normalized to integrin β1 levels are shown (n = 3; bars show mean with SD). (C) GFP-PEAK1 WT and Y635F mutant were expressed in PEAK1-deficient SW480 cells. Cells were serum starved overnight and then treated with pervanadate for 10 min before cell lysis. Representative Western blots are shown of GFP-TRAP experiments. WCL, whole-cell lysate. (D) Quantification of Tensin3 signal intensities normalized to PEAK1 (GFP) levels are shown (n = 3; bars show mean with SD). (E) COS-7 cells transiently transfected with GST and GST-SH2 constructs together with a plasmid expressing HA-tagged full-length PEAK1 were treated with or without pervanadate for 10 min. Cell lysates derived from these transfected cells were subjected to a GST pull-down assay with glutathione-Sepharose (GE Healthcare). WCLs and the pulled-down proteins were analyzed by Western blotting with antibodies against PEAK1 (D4G6J) and GST (2F3). (F) Quantification of Tensin3 signal intensities normalized to those of GST are shown (n = 3; bars show mean with SD). (G) Colocalization of PEAK1, Talin, Tensin3, and integrin β1 and β5 (shown in green or red in merge) in U251MG cells seeded on glass coverslips and cultured in medium supplemented with 10% FCS. Actin cytoskeleton (blue) and nuclei (cyan) are visualized. Scale bar, 20 μm. (H) Representative Western blots of BioID assays performed using integrin β5–deficient U251MG cells expressing β5-BirA*, in which Tensin3 was depleted by two different shRNAs (1 and 4). Cells were treated with 50 μM biotin 24 h before cell lysis. (I) Quantifications of PEAK1 and Tensin3 signal intensities normalized to integrin β5 levels are shown (n = 3; bars show mean with SD) in I. (J) Colocalization of vinculin and GFP-PEAK1 WT versus Y635F in PEAK1-deficient GE11 tet-ON integrin β1 cells treated with 1 μg/ml doxycycline for 48 h to induce β1 expression. Scale bar, 10 μm. (K) Quantifications of colocalization of FAs and PEAK1 (calculated as a percentage of total PEAK1) of immunofluorescence images as shown in K. FAs were stained with vinculin or pY. n = 3; total number of cells analyzed: 47 (WT); 53 (Y635F). Box plots range from the 25th to 75th percentile; central line indicates the median; whiskers show smallest to largest value. Mann–Whitney U test was performed to determine statistical significance. ****, P < 0.0001. Source data are available for this figure: SourceData F4.
PEAK1 binds to Tensin3 in a phosphorylation-dependent manner to connect to integrins
To demonstrate that PEAK1 interacts directly with Tensin3 in a phosphorylation-specific manner, we expressed GFP-tagged PEAK1 or PEAK1-Y635F in CRISPR/Cas9-generated PEAK1-knockout human colorectal SW480 cells (Fig. S2 A). GFP-PEAK1 was expressed at high levels and used for GFP pull-down experiments. Cells were serum-starved overnight and treated with pervanadate, an irreversible inhibitor of protein tyrosine phosphatases, before lysis. GFP pull-down experiments showed that Tensin3 is associated with PEAK1 in pervanadate-treated samples but hardly associated with PEAK1 in serum-starved PEAK1-WT– or PEAK1-Y635F–expressing cells (Fig. 4, C and D). Furthermore, PEAK1-Y635F showed reduced colocalization with Tensin3 compared with PEAK1-WT (Fig. S2 B). Intriguingly, the interaction between DLC1 and the SH2 domain of Tensin3/c-ten does not require phosphorylation of the YDNV motif in DLC1 (Cao et al., 2015; Liao et al., 2007) and is less dependent on the tyrosine phosphorylation of the Tensin3 SH2 domain (Qian et al., 2009). This indicates that direct competition between DLC1 and PEAK1 for Tensin3 binding is unlikely, because phosphorylation events upon growth factor stimulation would promote a switch from Tensin3-DLC1 to Tensin3-PEAK1 binding (Chumbalkar et al., 2011; Cui et al., 2004).
PEAK1 is recruited to FAs upon phosphorylation by Src family kinases (Bristow et al., 2013; Croucher et al., 2013; Leroy et al., 2009; Wang et al., 2010). In GE11 cells, where Src is already maximally active in the absence of EGF stimulation (i.e., its activity cannot be further increased by EGF stimulation; Fig. S2 C), PEAK1 is highly phosphorylated on Y635 (Fig. S2 D). To analyze whether PEAK1 phosphorylation by Src is required for the PEAK1–Tensin3–β1 interaction, we conducted a BioID assay using GE11/β1-BirA* cells treated with Saracatinib, an inhibitor of Src and Abl family kinases. Saracatinib treatment decreased tyrosine phosphorylation of PEAK1 and decreased the proximity interaction between PEAK1 and β1 (Fig. S2 E), in line with previous findings (Bristow et al., 2013). GFP pull-down experiments using PEAK1-deficient GE11 cells expressing GFP-PEAK1 treated with Saracatinib confirmed that phosphorylation of PEAK1-Y635 is decreased upon Src inhibition (Fig. S2 F).
Notably, Src has also been implicated in the phosphorylation of the SH2 domain of Tensin3, and tyrosine phosphorylation of the SH2 domain contributes to complex formation with several proteins (Qian et al., 2009). To determine the importance of tyrosine phosphorylation of the SH2 domain for PEAK1 binding, we transiently expressed SH2-WT and SH2 double (SH2-2F; Y1206 and Y1256F) and SH2 triple (SH2-3F; Y1173F, Y1206, and Y1256F) mutants, engineered as GST fusion proteins together with PEAK1 in COS-7 cells. Cells were treated or not with pervanadate for 10 min. GST pull-down confirmed that the Tensin3 SH2-WT binds to PEAK1 and showed that tyrosine phosphorylation of the SH2 domain greatly enhanced the binding of Tensin3 to PEAK1 (Fig. 4 E). Compared with Tensin3 SH2-WT, binding of the SH2-2F mutant to PEAK1 was only slightly reduced, but that of the SH2-3F mutant was reduced by >50% (Fig. 4, E and F).
Next, we analyzed the PEAK1-Tensin3-integrin interaction in human U251MG glioblastoma cells, which express Tensin3 at high levels. PEAK1 and Tensin3 colocalized in FAs, as shown by immunofluorescence analysis (Fig. 4 G). In line with our biochemistry results, PEAK1 was absent from cell matrix adhesions in U251MG cells spread on fibronectin in the presence of the Src inhibitor Saracatinib (Fig. S2 G). Integrin αVβ5 is the main RGD-binding integrin found to colocalize with Tensin3 and PEAK1 in FAs, whereas integrin β1 shows a more dispersed subcellular distribution, and integrin β3 could not be detected (Fig. 4 G). We performed BioID assays by expressing β5-BirA* in β5-deficient U251MG cells that were additionally depleted of Tensin3 by shRNA-mediated gene knockdown. Depletion of Tensin3 by two different shRNAs reduced the PEAK1–integrin β5 proximity interaction (Fig. 4, H and I), while the Talin1-integrin β5 interaction was not affected (Fig. S2 H). Furthermore, PEAK1 was absent from cell matrix adhesions in Tensin3-depleted cells (Fig. S2 I). Finally, we compared the localization of GFP-PEAK1 WT versus Y635F in FAs by immunofluorescence analysis. PEAK1-Y635F showed significantly reduced colocalization with the FA marker Vinculin compared with WT PEAK1 (Fig. 4, J and K). Taken together, these results indicate that Src-mediated phosphorylation of PEAK1 and the SH2 domain of Tensin3 promote their binding and facilitate PEAK1 interaction with the integrin β MP-NPxY motif.
Mapping the PEAK1 interactome
To identify additional proteins that interact with PEAK1, we used a GFP-Trap–based affinity purification method combined with MS using PEAK1-deficient GE11 cells that express GFP-PEAK1, or the PEAK1-deficient cells as a negative control. This screen identified Shc1 and many proteins involved in the EGFR/Shc1 signaling network (Zheng et al., 2013), including Asap1/2, Dab2ip, Grb2, Lrrk1, Ppp1ca/cc, Prag1, and Rasal2 as major PEAK1 interacting proteins (Fig. 5 A and Table S5). Both human and mouse PEAK1 were enriched in the GFP-PEAK1 sample, indicating that endogenous PEAK1 is not completely deleted in our GE11 control sample and dimerizes with the GFP-PEAK1 fusion protein (Patel et al., 2020). Tensin3 was not found as a significant interactor of PEAK1 in this analysis (Fig. 5 A). However, in a GFP-Trap pull-down assay using SW480 cells, a physical interaction between Tensin3 and PEAK1 could be demonstrated and was found to be dependent on the phosphorylation of PEAK1 at Y635 (Fig. 4 C). Interestingly, Asap1/2 and Grb2 were recently identified as binding partners of the smaller PEAK family member PEAK3 (Hou et al., 2022), suggesting that these proteins may interact with conserved domains in PEAK1–3.
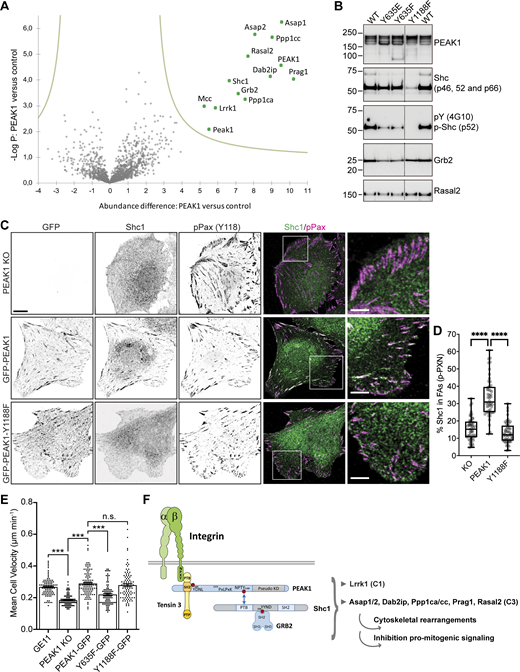
PEAK1 recruits Shc1 to FAs. (A) GFP-PEAK1 was expressed in PEAK1-deficient GE11 cells to perform GFP-TRAP experiments followed by MS analysis of binding partners. Volcano plot shows proteins enriched in PEAK1-GFP over control (PEAK1 knockout cells) samples. The logarithmic ratio of protein LFQs were plotted against negative logarithmic P values of a two-sided two-sample t test. The hyperbolic curve separates significantly enriched proteins (indicated in green) from common binders (FDR: 0.05, n = 4). (B) GFP-PEAK1 WT or Y635E/Y635F/Y1188F mutants were expressed in PEAK1-deficient GE11 cells. Representative Western blots of GFP-TRAP experiments are shown. (C) Colocalization of GFP-PEAK1, Shc1 (green in merge), and Paxillin (magenta in merge) in PEAK1-deficient versus GFP-PEAK1 WT or Y1188F mutant–expressing GE11 cells. Scale bar, 10 μm; in magnified regions, 5 µm. (D) Quantifications of colocalization of Shc1 and phospho-Y118 Paxillin (calculated as a percentage of total Shc1) of immunofluorescence images as shown in C. n = 3, total number of cells analyzed: 52 (KO); 48 (PEAK1); 51 (Y1188F). Box plots range from the 25th to 75th percentile; central line indicates the median; whiskers show smallest to largest value. Mann–Whitney U test was performed to determine statistical significance. ****, P < 0.0001. (E) Migration of GE11 Tet-ON integrin β1 cells (WT or PEAK1-deficient with or without rescue with the indicated PEAK1-GFP constructs) treated with 1 μg/ml doxycycline for 48 h to induce β1 expression on fibronectin-coated plastic was analyzed in overnight videos. Kruskal–Wallis with Dunn’s multiple comparisons test was performed to determine statistical significance; error bars show SEM; ***, P < 0.0001; n = 93 (GE11), 105 (PEAK1 KO), 105 (PEAK1-GFP), 94 (PEAK1-Y635F), 94 (PEAK1-Y1188F) cells. (F) Model of PEAK1 and its binding partners. PEAK1 is connected to integrins by Tensin3, which binds to phospho-Y635 PEAK1 and the integrin β MP-NPxY motif. Shc1 binds phospho-Y1188 PEAK1. PEAK1 also interacts with proteins that were classified in different clusters based on their association rates with Shc1 upon EGF stimulation (Zheng et al., 2013), including the cluster 1 (C1) proteins Grb2 and Lrrk1 and C3 proteins Asap1/2, Dab2ip, Ppp1ca/cc, Prag1, and Rasal2. Source data are available for this figure: SourceData F5.
PEAK1 recruits Shc1 to FAs. (A) GFP-PEAK1 was expressed in PEAK1-deficient GE11 cells to perform GFP-TRAP experiments followed by MS analysis of binding partners. Volcano plot shows proteins enriched in PEAK1-GFP over control (PEAK1 knockout cells) samples. The logarithmic ratio of protein LFQs were plotted against negative logarithmic P values of a two-sided two-sample t test. The hyperbolic curve separates significantly enriched proteins (indicated in green) from common binders (FDR: 0.05, n = 4). (B) GFP-PEAK1 WT or Y635E/Y635F/Y1188F mutants were expressed in PEAK1-deficient GE11 cells. Representative Western blots of GFP-TRAP experiments are shown. (C) Colocalization of GFP-PEAK1, Shc1 (green in merge), and Paxillin (magenta in merge) in PEAK1-deficient versus GFP-PEAK1 WT or Y1188F mutant–expressing GE11 cells. Scale bar, 10 μm; in magnified regions, 5 µm. (D) Quantifications of colocalization of Shc1 and phospho-Y118 Paxillin (calculated as a percentage of total Shc1) of immunofluorescence images as shown in C. n = 3, total number of cells analyzed: 52 (KO); 48 (PEAK1); 51 (Y1188F). Box plots range from the 25th to 75th percentile; central line indicates the median; whiskers show smallest to largest value. Mann–Whitney U test was performed to determine statistical significance. ****, P < 0.0001. (E) Migration of GE11 Tet-ON integrin β1 cells (WT or PEAK1-deficient with or without rescue with the indicated PEAK1-GFP constructs) treated with 1 μg/ml doxycycline for 48 h to induce β1 expression on fibronectin-coated plastic was analyzed in overnight videos. Kruskal–Wallis with Dunn’s multiple comparisons test was performed to determine statistical significance; error bars show SEM; ***, P < 0.0001; n = 93 (GE11), 105 (PEAK1 KO), 105 (PEAK1-GFP), 94 (PEAK1-Y635F), 94 (PEAK1-Y1188F) cells. (F) Model of PEAK1 and its binding partners. PEAK1 is connected to integrins by Tensin3, which binds to phospho-Y635 PEAK1 and the integrin β MP-NPxY motif. Shc1 binds phospho-Y1188 PEAK1. PEAK1 also interacts with proteins that were classified in different clusters based on their association rates with Shc1 upon EGF stimulation (Zheng et al., 2013), including the cluster 1 (C1) proteins Grb2 and Lrrk1 and C3 proteins Asap1/2, Dab2ip, Ppp1ca/cc, Prag1, and Rasal2. Source data are available for this figure: SourceData F5.
Because PEAK1 is a scaffolding protein that functions in late EGFR-mediated signaling responses (Zheng et al., 2013), we investigated whether the PEAK1 interactome changes upon 20-min EGF stimulation. The major interactors of PEAK1 remained unchanged after EGF treatment (Fig. S3), which is in line with our finding that Src is already maximally phosphorylated and PEAK1 phosphorylation is high in GE11 cells. However, Ptpn13 and Shroom2 were identified as additional, EGF-induced PEAK1-binding proteins (Fig. S3). The interaction of these proteins with PEAK1 likely depends on non–Src-mediated posttranslational modifications that occur downstream of EGFR activation.

PEAK1 interactome of EGF stimulated GE11 cells. PEAK1-deficient GE11 cells expressing GFP-PEAK1 were treated with EGF for 20 min, lysed, and subjected to immunoprecipitation using GFP-TRAP. Volcano plot shows proteins enriched in PEAK1-GFP over control (PEAK1 knockout cells) samples. The logarithmic ratios of protein LFQs were plotted against negative logarithmic P values of a two-sided two-sample t test. The hyperbolic curve separates significantly enriched proteins (indicated in green) from common binders (FDR: 0.05, n = 4).
PEAK1 interactome of EGF stimulated GE11 cells. PEAK1-deficient GE11 cells expressing GFP-PEAK1 were treated with EGF for 20 min, lysed, and subjected to immunoprecipitation using GFP-TRAP. Volcano plot shows proteins enriched in PEAK1-GFP over control (PEAK1 knockout cells) samples. The logarithmic ratios of protein LFQs were plotted against negative logarithmic P values of a two-sided two-sample t test. The hyperbolic curve separates significantly enriched proteins (indicated in green) from common binders (FDR: 0.05, n = 4).
To further analyze the scaffolding function of PEAK1, we expressed different PEAK1 mutants in PEAK1-depleted GE11 cells and subsequently performed GFP pull-down experiments. Western blot analysis indicated that the Y1188F mutation almost completely abrogated the binding of PEAK1 to Shc1, but not to Rasal2 and only slightly to Grb2 (Fig. 5 B). Grb2 binding to PEAK1-Y635E/F decreased by ∼50%, whereas Shc1 was unchanged. Interestingly, however, binding of tyrosine-phosphorylated Shc1 to PEAK1-Y635E/F was strongly decreased (Fig. 5 B). In line with these biochemical findings, immunofluorescence analysis revealed that PEAK1 recruits Shc1 to FAs (Fig. 5 C). Recruitment of Shc1 to FAs in PEAK1-deficient or PEAK1-Y1188F mutant cells shown by colocalization with phospho-Paxillin was significantly reduced (Fig. 5, C and D). Because PEAK1-Y635F cannot bind Tensin3, we speculate that the phosphorylation of Shc1 is increased upon its recruitment to FAs, via PEAK1–Tensin3–integrin binding. Grb2, which also binds PEAK1-Y635, is not found in FAs and therefore does not play a major role in the localization and phosphorylation of Shc1 in FAs. In line with our findings, Shc1 interacts with the FA-forming integrins, including α5β1 and αVβ3, and is phosphorylated by integrin β1 crosslinking or when cells are plated on fibronectin/vitronectin (Wary et al., 1996). Shc1 controls various cellular processes in association with integrins and growth factor stimulation, including cell survival, proliferation, and migration (Mauro et al., 1999; Wary et al., 1996). Therefore, we tested the contribution of PEAK1 phosphorylation at either Y635 or Y1188 to cell motility. GE11 cells depleted of endogenous PEAK1 migrated ∼40% more slowly compared with WT GE11 cells; reexpression of PEAK1-GFP was able to rescue this reduction in cell velocity (Fig. 5 E). The motility defect of the PEAK1-depleted GE11 cells was also rescued by expression of PEAK1-Y1188F-GFP, but not PEAK1-Y635F-GFP (Fig. 5 E).
Conclusions
We report here that Tensin3 mediates the proximity interaction between PEAK1 and RGD-binding integrins through binding of its SH2 domain to PEAK1. Our findings indicate that PEAK1 mainly interacts with Shc1 and its associated protein cluster (Zheng et al., 2013) and recruits Shc1 to FAs by interacting with Tensin3 and RGD-binding integrins (Fig. 5 F). Moreover, integrins and growth factor receptors synergize to regulate cellular functions, including cell motility (Miyamoto et al., 1996; Morello et al., 2011). In line with these findings, expression of PEAK1-Y635F, which showed decreased binding to tyrosine-phosphorylated Shc1, was unable to restore the migration velocity of GE11 PEAK1 KO cells, unlike expression of PEAK1 WT (Fig. 5 E). PEAK1 could be an important player in regulating integrin–growth factor receptor synergism, as it connects RGD-binding integrins to the protein cluster regulating late EGFR/Shc1 signaling (Zheng et al., 2013).
Materials and methods
Antibodies
Primary antibodies used are listed in Table S6. Secondary antibodies were as follows: goat anti-rabbit Alexa Fluor 488, goat anti-mouse Alexa Fluor 488, goat anti-mouse Texas Red, goat anti-mouse Alexa Fluor 568, donkey anti-rabbit Alexa Fluor 594, goat anti-rabbit Alexa Fluor 647, and goat anti-mouse Alexa Fluor 647 (Invitrogen); PE-conjugated donkey anti-rabbit antibody (#406421; BioLegend); and stabilized goat anti-mouse HRP-conjugated and stabilized goat anti-rabbit HRP-conjugated (Pierce; Bio-Rad).
Generation of phospho-site–specific Y365 PEAK1 antibodies
The phospho-peptide KVPIVINPNAY(PO3H2)DNLAIYKS with a cysteine added at the C-terminus was synthesized. The phospho-peptide was chemically conjugated with mariculture keyhole limpet hemocyanin (mcKLH) using Imject Maleimide-Activated mcKLH Spin Kit (77666; Thermo Fisher Scientific) according to the manufacturer’s protocol. Briefly, 1 mg phospho-peptide dissolved in 500 µl conjugation buffer was mixed with 2 mg mcKLH dissolved in water for 2 h at room temperature, and the conjugate was desalted and collected by passing through the Zeba Spin Desalting Column. Two rabbits were immunized with 500 µg mcKLH-conjugated peptide in TiterMax Gold-Adjuvant (T2684; Sigma-Aldrich) and subsequently boosted with the same mcKLH conjugated phospho-peptide in Freund’s incomplete adjuvant (F5506; Sigma-Aldrich) at 4, 8, and 12 wk. After the final immunization, blood of the animals was collected, and IgG was purified on a Protein A Sepharose column (Pharmacia LKB Biotechnology). The phospho-specific antibodies were then purified by positive and negative affinity purification. For positive affinity purification, the phosphorylated peptide was covalently coupled to SulfoLink Coupling Gels from Pierce according to the manufacturer’s protocol. Bound antibodies were eluted with 1 M glycine-HCl, pH 2.9, and neutralized with an equal volume of 1 M Tris-HCl, pH 8.5. Protein-containing fractions were pooled and concentrated with Amicon Ultra-4 10K centrifugal filter devices (Millipore). After washing with PBS using the same filter devices, the concentrated protein fraction was added to a second column in which the corresponding nonphosphorylated peptide was covalently bound. All flow-through fractions containing antibodies were collected and stored at 4°C.
Cell lines
GE11 β1 null cells were isolated from β1 chimeric embryos, as previously described (Gimond et al., 1999). SW480 and U251MG cell lines were obtained from American Type Culture Collection. COS-7 cells have been described previously (De Melker et al., 1997). All cell lines were cultured in DMEM containing 10% heat-inactivated FBS and antibiotics. All cells were cultured at 37°C in a humidified, 5% CO2 atmosphere.
Generation of PEAK1-deficient cells
The target sgRNA against mouse Peak1 (exon 4; 5′-AAGCAATTCTTGCATTCGCCAGG-3′) or human PEAK1 (exon 4; 5′-TGCCCGTGTTCCTGATGCGG-3′) was cloned into pX330-U6-Chimeric_BB-CBh-hSpCas9 (a kind gift from Feng Zhang, Broad Institute of MIT and Harvard, Cambridge, MA [Cong et al., 2013]; plasmid #42230; Addgene). GE11 cells were transfected with this vector in combination with a blasticidin cassette, as previously described (Heijink et al., 2015), and selected with 4 μg/ml blasticidin (Sigma-Aldrich) for 4 d after transfection. Transfected SW480 cells were selected with 2.5 μg/ml puromycin for 3 d.
Stable cellular transduction
The integrin β1 (mutants), generated as previously described (Margadant et al., 2012), were subcloned into the EcoRI and BamHI sites of the pcDNA3.1 MCS-BirA(R118G)-HA vector (a gift from Kyle Roux [plasmid #36047; Addgene; Roux et al., 2012]). The integrin α3-BirA* construct was cloned by 3-point ligation of an N-terminal PCR fragment containing an EcoRI site and a C-terminal part of 2.3 kb into EcoRI and BamHI sites of the pcDNA3.1 MCS-BirA(R118G)-HA vector. The integrin α5-BirA* construct was cloned by 3-point ligation of a N-terminal part of 2.7 kb and a C-terminal PCR fragment lacking the stop codon into the BamHI site of the pcDNA3.1 MCS-BirA(R118G)-HA vector. The integrin α6-BirA* construct was described previously (Te Molder et al., 2020). The integrin β1-BirA* (mutants), α5-BirA*, α3-BirA*, and α6-BirA* constructs were cloned into the SnaBI site of the LZRS-IRES-Zeo vector.
The pRetroX-DSRed-SGK269 plasmid encoding human PEAK1 cDNA was kindly provided by Dr. Roger Daly. The PEAK1 construct was subcloned by 3-point ligation of a N-terminal part of 4.9 kb and a C-terminal PCR fragment creating a stop codon and NotI site into EcoRI and NotI sites of pUC19 vector. Point mutants of PEAK1 Y635E, Y635F, and Y1188F were generated by site-directed mutagenesis with the PCR-based overlap extension method using Pfu DNA polymerase (Promega) and subcloned into the EcoRI and NotI sites of the pLZRS-EGFP vector, as previously described (Ketema et al., 2013).
Retroviral vectors were introduced into Phoenix packaging cells using the calcium phosphate method. Virus-containing supernatant was collected 48 h later. After retroviral transduction, infected cells were selected with 0.2 mg/ml zeocin (Invitrogen).
Generation of stable knockdown cell lines
Short hairpins against human Tensin3 (cloned into pLKO.1) were obtained from the MISSION TRC shRNA collection and transfected into HEK 293FT cells using Lipofectamine 2000 (Invitrogen). U251MG β5-BirA*–expressing cells were generated as previously described (Zuidema et al., 2018), infected with the produced recombinant lentivirus, and selected with puromycin for 3 d. Target sequences included: 5′-CCGGACGCATAGGAGTGGTCATATCCTCGAGGATATGACCACTCCTATGCGTTTTTTG-3′ (shRNA 1) and 5′-CCGGCTCCCAGCAAAGCGTTCAAACCTCGAGGTTTGAACGCTTTGCTGGGAGTTTTTG-3′ (shRNA 4).
Transient transfection
Talin1 (M-040902-01-0020), Talin2 (M-065877-01-0020), Filamin-A (M-058520-02-0020), and Filamin-C (M-055631-01-0020) siGENOME SMARTpool siRNAs were purchased from Dharmacon. GE11 cells were transiently transfected using lipofectamine 2000 (Invitrogen). Lipofectamine (20 μl/ml) and siRNA (0.5 μM) solutions in Opti-MEM were mixed (1:1) and incubated for 30 min at room temperature. Cells were incubated with the transfection solution overnight.
Flow cytometry
Cells were treated as indicated, trypsinized, and washed twice in PBS containing 2% FCS, followed by primary antibody (1:200 dilution) incubation for 1 h at 4°C. Then, cells were washed three times in PBS containing 2% FCS and incubated with secondary PE-conjugated antibodies (1:200 dilution) for 1 h at 4°C. After subsequent washing steps, desired cell populations were isolated by FACS sorting using a Becton Dickinson FACSAria IIu or Beckman Coulter Moflo Astrios cell sorter.
BioID assay
Cells stably expressing the integrin subunit-BirA* fusion proteins were grown on 100-mm or 3 × 145-mm plates (for Western blot or MS, respectively). Plates were coated with a laminin-332–rich matrix obtained by growing RAC-11P cells (Delwel et al., 1994) to complete confluence, after which the plates were washed with PBS and incubated with 20 mM EDTA in PBS overnight at 4 °C. The RAC-11P cells were then removed by extensive washing with PBS.
Cells were washed in cold PBS, lysed in radioimmunoprecipitation assay buffer (20 mM Tris-HCl, pH 7.5, 100 mM NaCl, 4 mM EDTA, pH 7.5, 1% NP-40, 0.1% SDS, and 0.5% sodium deoxycholate) supplemented with a protease inhibitor cocktail (Sigma-Aldrich), and cleared by centrifugation at 14,000 g for 30 min at 4°C. Lysates were incubated with Streptavidin Sepharose High Performance beads (GE Healthcare) overnight at 4°C. Beads were washed three times with NP40 buffer (20 mM Tris-HCl, pH 7.5, 100 mM NaCl, 4 mM EDTA, pH 7.5, and 1% NP-40) and twice with PBS, and the isolated biotinylated proteins were analyzed by MS or Western blotting.
GFP pull-down assays
Cells were washed in cold PBS, lysed in NP40 lysis buffer (20 mM Tris-HCl, pH 7.5, 100 mM NaCl, 4 mM EDTA, pH 7.5, and 1% NP-40) supplemented with a protease inhibitor cocktail (Sigma-Aldrich), 1.5 mM Na3VO4, and 15 mM NaF (Cell Signaling Technology), and cleared by centrifugation at 14,000 g for 30 min at 4°C. Lysates were incubated with GFP-Trap Agarose (Chromotek) according to the manufacturer’s instructions. Beads were washed three times with NP-40 lysis buffer and twice with PBS, and the isolated proteins were analyzed by MS or Western blotting.
GST pull-down assay and Western blotting
COS-7 cells were cotransfected with plasmids expressing GST and GST fusion proteins of Tensin3 WT (SH2-WT) and SH2-domain mutants (SH2-2F; Y1206F/Y1256F and SH2-3F; Y173F/Y1206F/Y1256; a kind gift from Douglas Lowy [Qian et al., 2009]), and a PEAK1 expressing plasmid using the DEAE-Dextran method (De Melker et al., 1997). 2 d after transfection, the cells were treated with or without pervanadate and lysed in NP-40 lysis buffer. After clearance of the lysates by centrifugation, equal amounts of proteins were used for pull-down assays by adding 25 µl glutathione Sepharose 4B beads (GE-Healthcare) and rotating for 4 h at 4°C. The beads were washed three times with NP-40 lysis buffer and two times with PBS, and bound proteins were eluted with Laemmli sample buffer containing 2% β-mercaptoethanol at 95°C for 5 min. Proteins were separated by electrophoresis using Bolt Novex 4–12% gradient Bis-Tris gels (Invitrogen), transferred to Immobilon-P transfer membranes (Millipore Corp.), and blocked for ≥30 min in 2% BSA in TBST buffer (10 mM Tris, pH 7.5, 150 mM NaCl, and 0.3% Tween-20). Primary antibody (diluted 1:1,000 in 2% BSA in TBST buffer) incubation took place overnight at 4°C. After washing twice with TBST and twice with TBS buffer, blots were incubated for 1 h at room temperature with HRP-conjugated goat anti-mouse IgG or goat anti-rabbit IgG (diluted 1:3,000 in 2% BSA in TBST buffer). After subsequent washing steps, the bound antibodies were detected by enhanced chemiluminescence using SuperSignal West Dura Extended Duration Substrate (Thermo Fisher Scientific) or Clarity Western ECL Substrate (Bio-Rad) as described by the manufacturer. Signal intensities were quantified using ImageJ.
MS
For BioID experiments, peptide mixtures were prepared, measured, and analyzed as previously described (Wang et al., 2020), with the following exceptions. Peptide mixtures (33% of total digest) were loaded directly on the analytical column and analyzed by nanoLC-MS/MS on an Orbitrap Fusion Tribrid mass spectrometer equipped with a Proxeon nLC1200 system (Thermo Fisher Scientific). Solvent A was 0.1% formic acid/water and solvent B was 0.1% formic acid/80% acetonitrile. Peptides were eluted from the analytical column at a constant flow of 250 nl/min in a 115-min gradient, containing a 100-min linear increase from 5 to 24% solvent B, followed by a 15-min wash at 90% solvent B.
Raw data were analyzed by MaxQuant (v2.0.1.0; Cox et al., 2014) using standard settings for label-free quantitation (LFQ). MS/MS data were searched against the Mus musculus Swissprot database (17,082 entries, release 2021_07) complemented with a list of common contaminants and concatenated with the reversed version of all sequences. LFQ intensities were log2-transformed in Perseus (v1.6.15.0; Tyanova et al., 2016), after which proteins were filtered for at least three valid values (of four total). Differentially expressed proteins were determined using Student’s t test (threshold: false discovery rate [FDR]: 5% and S0: 0.1).
GFP pull-down samples were loaded on an SDS-PAGE gel. Gel bands were excised into ∼1 × 1-mm pieces and subjected to destaining and reduction alkylation of cysteines, followed by overnight digestion with Trypsin (Promega). After digestion, the peptides were desalted and concentrated via StageTips. Peptides were separated on a 40-min gradient on a 15-cm analytical column (75 µm inner diameter) packed with 1.9 µm ReproSil Gold C18 reversed phase particles (Dr. Maisch). The column was maintained at 50°C, and peptides were directly sprayed into a Q Exactive HF mass spectrometer via a nano-electrospray ionization source. The mass spectrometer was operated in data-dependent mode, and ≤15 precursors were selected for fragmentation. Raw data were processed using MaxQuant (v1.6.0.15), and all identifications were filtered at 1% FDR.
Immunofluorescence
Subconfluent cells were fixed with 2% PFA for 10 min, permeabilized with 0.2% Triton X-100 for 5 min, and blocked with PBS containing 2% BSA (Sigma-Aldrich) for ≥30 min. Next, cells were incubated with the primary antibodies for 1 h at room temperature. Cells were washed three times before incubation with the secondary antibodies for 1 h. Additionally, the nuclei were stained with DAPI, and F-actin was visualized using Alexa Fluor 488– or 647–conjugated phalloidin (BioLegend; AAT Bioquest). After three washing steps with PBS, the coverslips were mounted onto glass slides in Mowiol. Images were obtained at room temperature using a Leica TCS SP5 confocal microscope with a AOBS scan head (158001107; Leica), controlled using Leica LAS AF SP5 software (v2.7.4), with a 63×/1.4 Oil CS HC PL APO objective (11506350; Leica), with filter cubes for 488/eGFP (15525302; Leica), 568/mCherry (15525303; Leica), and DAPI (15525301; Leica).
Cell motility
GE11 Tet-ON integrin β1 cells (WT, PEAK1 KO, and PEAK1 KO stably expressing PEAK1-GFP, PEAK1-Y635F-GFP, or PEAK1-Y1188F-GFP) were cultured for ≥48 h with 1 µg/ml doxycycline to induce β1 integrin expression, and then plated onto fibronectin-coated (10 µg/ml in PBS) plastic 12-well plates (20,000 cells per well) in DMEM containing 0.5% FBS, antibiotics, and doxycycline (1 µg/ml). After culture overnight, the medium was exchanged for DMEM containing 0.5% FBS, antibiotics, and doxycycline (1 µg/ml), and cells were transferred to the heated stage (37°C with 5% CO2) of a Zeiss AxioObserver Z.1 microscope. Phase-contrast images were acquired with a 10×/0.30 EC Plan-Neofluar Ph1 objective (Zeiss), captured with a Zeiss AxioCam MRm. Images were acquired every 10 min for 20 h. Cells were tracked manually using ImageJ; tracking data were analyzed using the Chemotaxis Tool plugin (Ibidi).
Image analysis and statistical analysis
Image analysis was performed using Fiji (ImageJ; Schindelin et al., 2012; Schneider et al., 2012). To quantify Shc1 clustering in FAs (based on Paxillin staining), background was subtracted in both channels using a bilateral filter, and the region of interest was selected at the cell periphery. Colocalization of Shc1 and FAs was determined using the Image Calculator (command “multiply”) on both channels and calculating the area of overlapping fraction as a percentage of the total Shc1 area per cell using the Analyze Particle function. The amount of GFP-PEAK1 (WT or Y635F) present in FAs was calculated in the same manner, using vinculin staining as a marker for FAs.
Mann–Whitney U test (two-tailed P value) was performed using GraphPad Prism (v7.0c). In figures, statistically significant values are shown as ****, P < 0.0001. Graphs were made in GraphPad Prism and show all data points. Data distribution was assumed to be normal but was not formally tested.
Online supplemental material
Fig. S1, a table of proteins identified as interactors of both integrin β1 and β3 in the BioID experiments, shows surface expression of the integrin BirA* constructs, assessed using FACS. Fig. S2 is related to data showing that PEAK1 is recruited to Tensin3 at cell matrix adhesions via a process requiring phosphorylation driven by Src. Fig. S3 shows interactors of GFP-PEAK from GFP-Trap–based affinity purification followed by MS in cells treated with EGF. Tables S1, S2, S3, S4 and S5 are Excel files with the MS data for proximity interactors of Integrin β1-BirA* (Table S1, complete data; Table S2, top 60 interactors), Integrin β3-BirA* (Table S3, complete data; Table S4, top 60 interactors), and GFP-Trap based affinity purification MS of GFP-PEAK expressed in PEAK1-null SW480 cells (Table S5). Table S6 is a list of antibodies used in this study.
Acknowledgments
We thank Anne Cress (University of Arizona Cancer Center, Tucson, AZ), David Critchley (University of Leicester, Leicester, UK), Roger Daly (Monash University, Victoria, Australia), Marina Glukhova (Institut Curie, PSL Research University, CNRS, Paris, France), Simon Goodman (Merck KGaA, Darmstadt, Germany), Douglas Lowy (National Institutes of Health, Bethesda, MD), Jacques Neefjes (Leiden University Medical Centre, Leiden, The Netherlands), Ellen van der Schoot (Sanquin Research, Amsterdam, The Netherlands), and NKI colleagues for sharing cells and reagents.
This work was supported by the Dutch Cancer Society (project 12143). Liesbeth Hoekman and Onno B. Bleijerveld are supported by the Dutch NWO X-omics Initiative. A. Sonnenberg and R. Fässler thank the Alexander von Humboldt Foundation for supporting A. Sonnenberg during his sabbatical year at the Max-Planck Institute.
The authors declare no competing financial interests.
Author contributions: A. Zuidema and A. Sonnenberg conceived the study, designed experiments, interpreted data, and wrote the manuscript with contributions from P. Atherton. A. Zuidema, P. Atherton, M. Kreft, L. Hoekman, O.B. Bleijerveld, N. Nagaraj, N. Chen, and A. Sonnenberg performed and analyzed the experiments. R. Fässler provided resources and reviewed and edited the manuscript.

