While the mutational landscape across early T-cell precursor acute lymphoblastic leukemia (ETP-ALL) and ETP-like leukemia is known, establishing a unified framework that activates stem cell genes characteristic of these tumors remains elusive. Using complementary mouse and human models, chromatin mapping, and enhancer profiling, we show that the coactivator ZMIZ1 promotes normal and malignant ETP population growth by inducing the transcription factor MYB in feedforward circuits to convergently activate oncogenes (MEF2C, MYCN, and BCL2) through essential enhancers. A key superenhancer, the N-Myc regulating enhancer (NMRE), drives malignant ETP population growth but is dispensable for normal lymphopoiesis. This network of stem cell superenhancers identifies treatment-resistant tumors and poor survival outcomes; unifies diverse ETP-ALLs; and contributes to cardinal features of the recently genomically identified high-risk bone marrow progenitor-like (BMP-like) ETP-ALL tumor—stem cell/myeloid gene expression, inhibited NOTCH1-induced T-cell development, aggressive clinical behavior, and venetoclax sensitivity. Since ZMIZ1 is dispensable for essential homeostasis, it might be possible to safely target this network to treat high-risk diseases.

Introduction
Several years ago, early T-cell precursor acute lymphoblastic leukemia (ETP-ALL) was defined by stem cell and/or myeloid cell markers using flow cytometry and was originally identified based on gene expression similarities with mouse ETPs, the most primitive cells in the thymus (Coustan-Smith et al., 2009). ETP-ALL is more aggressive than mature T-ALL but is often treated with the same chemotherapy-based regimens (Coustan-Smith et al., 2009; Teachey and O’Connor, 2020). Few drugs targeting ETP-ALL have entered clinical trials, which underscores our limited basic knowledge of this cancer (Pocock et al., 2021). Extensive analyses by many groups revealed that these tumors possess a diverse mutational landscape involving developmental transcription factors, signaling pathways, and chromatin modifiers (Bardelli et al., 2021; Liu et al., 2017; Montefiori et al., 2021; Zhang et al., 2012). However, no group has yet established a common framework that activates stem cell gene expression characteristic of these tumors.
Recent bulk and single-cell genomic profiling of the Children’s Oncology group AALL0434 clinical trial cohort classified T-ALL into novel biologic subtypes and identified genomic signatures that predict outcomes independent of response to treatment (Pölönen et al., 2024; Xu et al., 2024). Among these is a high-risk “ETP-like” subtype that overlaps with ∼70% of ETP-ALL cases but is comprised of about 1/3 ETP, 1/3 near-ETP, and 1/3 non-ETP cases and is defined by gene expression and diverse genetic alterations of a core set of hematopoietic stem cell (HSC) regulators. These studies also identified a treatment refractory “bone marrow progenitor–like” (BMP-like) leukemia subtype via single-cell sequencing, which is enriched in patients with poor response to induction therapy. Further analyses integrating these two genomically defined subtypes indicate that the ETP-like subtype is highly enriched for BMP-like cases (n = 180/240) and that the BMP-like expression signature adds prognostic value in stratifying survival in ETP-like patients treated on AALL0434. Identifying the underlying mechanism driving stem cell–like T-ALL has promise to guide new targeted therapeutic approaches for high-risk T-ALL. Notably, BMP-like ETP-ALLs are highly sensitive to BCL2 inhibition (Xu et al., 2024). Given this, we raised the question of whether a stem cell transcriptional network is co-opted by normal ETPs to drive the acquisition of aggressive clinical behavior, BCL2 inhibitor sensitivity, and other cardinal features of high-risk ETP-ALL.
In normal ETPs, stem cell gene expression programs are incompatible with high Notch1 transcription factor activity. Notch1 signaling must be low in ETPs since supraphysiological Notch1 activation induces a network of genes that impair stem cell quiescence and promote T-cell commitment (Chiang et al., 2013; Lee et al., 2013; Rothenberg et al., 2016). Similarly, in BMP-like ETP-ALL cases in AALL0434 defined by single-cell genomic analysis (n = 11/25), NOTCH1 pathway mutations were absent, aligning with significantly reduced NOTCH1 pathway activation in BMP-like blasts (Xu et al., 2024). Further, single-cell subclonal analysis showed that NOTCH1 mutation dosage is associated with differentiation away from the BMP-like state toward the T-specified state, consistent with observations in mouse studies. Recent studies suggest that the stem cell transcription factor MEF2C opposes NOTCH1 functions and promotes ETP-ALL proliferation by inducing other stem cell transcription factors LMO2, LYL1, and HHEX (Cante-Barrett et al., 2022). The ETP survival gene BCL2 is also induced, resulting in increased sensitivity to the BCL2 inhibitor venetoclax (Anderson et al., 2014; Cante-Barrett et al., 2022; Chonghaile et al., 2014). Despite these studies, it remains unclear what induces other key stem cell transcription factors, such as MYCN and MYB (León et al., 2020; Lieu and Reddy, 2009; Treanor et al., 2013), and what induces MEF2C itself beyond a handful of MEF2C-inducing chromosomal aberrancies (Homminga et al., 2011). Thus, a stem cell network might be at play that antagonizes NOTCH1 signals and maintains the ETP state.
ETP-ALL cells are not identical to mouse ETP cells. Recent mapping of human ETP-ALL profiled using single-cell RNA sequencing (scRNA-seq) to human bone marrow progenitor (BMP) and mouse thymocyte signatures from BLUEPRINT and Immgen, respectively, showed that ETP-ALL leukemia cells exhibit high intrasample heterogeneity in gene expression: scoring highly in HSC signatures, double-negative (DN) signatures, and even double-positive (DP) thymocyte signatures (Anand et al., 2021). Similarly, bulk RNA-seq of the modern ETP-like and BCL11B subtypes were mapped to a continuum of differentiation stages (Pölönen et al., 2024; Xu et al., 2024). scRNA-seq analysis of the ETP-like subtype in the Xu et al. report was limited to 24 cases (n = 21 ETP-ALL) among 40 T-ALL cases. Given the overlap between ETP-like and ETP-ALL subtypes, analysis of the 24 ETP-like cases would likely show intratumor heterogeneity. We will here show the mapping of the 25 ETP-ALL cases as single cells to a continuum of differentiation stages in the normal reference.
ZMIZ1 is a PIAS-like transcriptional coactivator that binds many transcription factors like SMAD3, p53, and hormone receptors to promote diverse pathways that are important for development, growth, and disease (Lee et al., 2007; Li et al., 2006; Lomelí, 2022; Sharma et al., 2003). ZMIZ1 was previously reported to be overexpressed in ETP-ALLs relative to normal hematopoietic progenitors (Anand et al., 2021). Thus, we proposed and experimentally tested the role of Zmiz1 in maintaining the undifferentiated and proliferating state of normal and malignant ETP cells. Mechanistically, ZMIZ1 induces MYB to convergently activate transcriptional feedforward loops through a network of previously unreported super-enhancers to induce expression of important oncogenes that promote cardinal features of BMP-like ETP-ALL—opposition to NOTCH1-induced T-cell development, highly aggressive proliferation, myeloid gene expression, and expression of the venetoclax target BCL2.
Results
ZMIZ1 is important for human immature T-ALL cell population growth
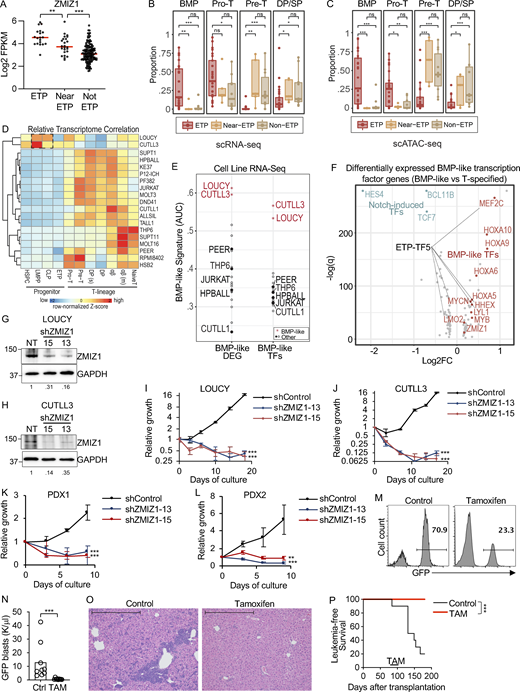
To understand whether ZMIZ1 is important for ETP-ALL, we examined ZMIZ1 expression in the TARGET (Therapeutically Applicable Research to Generate Effective Treatments) dataset (Liu et al., 2017). Consistently, ZMIZ1 expression is highest in ETP-ALL, low in T-ALL, and intermediate in near ETP-ALL (Fig. 1 A). To test the functional importance of ZMIZ1 in ETP-ALL, we collected cell lines that model this cancer (LOUCY [Van Vlierberghe et al., 2011] and CUTLL3 [Rashkovan et al., 2022]) and near ETP-ALL (THP-6 [Kawamura et al., 1999]). ETP-ALL cells are defined by the expression of CD7 and stem cell and/or myeloid cell markers and lack of CD5, CD1a, and CD8 by flow cytometry (Coustan-Smith et al., 2009). LOUCY cells fully matched these criteria except for the expression of a myeloid or stem cell marker (Fig. S1 A). CUTLL3 cells also matched these criteria although CD7 was expressed in a minor subset (Fig. S1 B). Near ETP-ALL cells meet ETP-ALL criteria but express CD5 (Liu et al., 2017). THP-6 cells fully matched these criteria (Fig. S1 C).
Next, we wondered if these cell lines might accurately model our recently described high-risk BMP-like ETP-ALL subset that is distinguished by poor response to induction chemotherapy and poor survival outcomes in the COG AALL0434 clinical trial, as well as sensitivity to BCL2 inhibition in pre-clinical testing (Xu et al., 2024). We defined this high-risk ETP-ALL subset based on integrated scRNA-seq and single-cell assay for transposase-accessible chromatin sequencing (scATAC-seq) analyses of primary ETP-ALL samples against single-cell reference maps of hematopoiesis, revealing a group of tumors in which the dominant cell population projects to normal BMPs (Fig. 1, B and C). To identify cell lines that model BMP-like ETP-ALL, we utilized two orthogonal approaches. First, in an analogous approach to how primary ETP-ALLs were projected against reference maps of T-cell development, we correlated T-ALL cell line RNA-seq isolated from DepMap with pseudo-bulk RNA-seq from 11 unique cell populations isolated from single-cell reference maps of T-cell development (Fig. 1 D). LOUCY and CUTLL3 cells showed the highest correlations with lymphoid-primed multipotent progenitor (LMPP)/common lymphoid progenitor (CLP) subsets, much like BMP-like ETP-ALL. We saw a similar correlation using publicly available datasets (Lasry et al., 2023; Park et al., 2020) (Fig. S1 D).
Second, we applied BMP-like gene signature-based scoring to identify cell lines with high expression of top BMP-like differentially expressed genes (DEGs) isolated from scRNA-seq data. Aligning with results from correlation analysis, we found that LOUCY and CUTLL3 expressed the highest levels of BMP-like DEGs and BMP-like transcription factors, followed by THP-6 (Fig. 1 E and Table S1). Finally, within the top BMP-like transcription factors (Table S1), we observed that five factors are experimentally defined drivers of ETP-ALL development, which we termed “ETP-TF5”—MEF2C, LYL1, HHEX, LMO2, and MYCN (Cante-Barrett et al., 2022; Homminga et al., 2011; León et al., 2020; McCormack et al., 2010, 2013; Smith et al., 2014; Treanor et al., 2013) (Fig. 1 F). These transcription factors are stem cell genes as they are highly expressed in HSC and normal ETPs and then decrease upon T-cell commitment and differentiation (Fig. S1 E). In the TARGET dataset, the ETP-TF5 signature is associated with treatment resistance based on minimum residual disease (MRD) at the end of induction (Fig. S1 F). In the AALL0434 dataset, the ETP-TF5 signature is differentially expressed in bulk ETP-ALL samples (Fig. S1 G) and BMP-like ETP-ALL blasts (Fig. S1 H). This signature predicts inferior overall survival independently of MRD (Fig. S1 I). LOUCY and CUTLL3 cells express high levels of ETP-TF5 compared with near ETP-ALL THP-6 and mature T-ALL cell lines (Fig. S1 J and Table S2). We here experimentally define these cells as “immature T-ALL” cells based on ETP-TF5 expression at >30-fold higher levels than a reference mature T-ALL cell line (Fig. S1 K). Taken together, LOUCY and CUTLL3 appear to model BMP-like ETP-ALL.
To test the importance of ZMIZ1 in immature T-ALL, we transduced ZMIZ1 shRNAs into LOUCY and CUTLL3 cells, leading to effective suppression of ZMIZ1 protein expression (Fig. 1, G and H). ZMIZ1 knockdown reduced population growth of BMP-like cells by 40–200-fold (Fig. 1, I and J). To test the antitumor effects of ZMIZ1 inactivation in non-immortalized human immature T-ALL cells, we took advantage of the success of shRNA protocols in knocking down gene expression in patient-derived xenografts (PDXs) (McCarter et al., 2020; Yost et al., 2013). ZMIZ1 knockdown reduced the viability of immature T-ALL PDX cells by 4–12-fold (Fig. 1, K and L; and Fig. S1, K and L). These results demonstrate strong and prevalent ZMIZ1 dependency in human immature T-ALL cells.
ZMIZ1 is important for murine immature T-ALL population growth
Next, we wondered whether the dependency of human immature T-ALL on Zmiz1 expression is conserved in mice. To test this possibility, we derived previously described mouse models of ETP-ALL driven by mutant IL7R and the BMP-like oncogene LMO2 (Smith et al., 2014; Treanor et al., 2014). We transduced bone marrow (BM) stem and progenitor cells from Rosa26CreERT2Zmiz1f/f mice with an Il7r mutant allele (GCinsL243). We transplanted these cells into recipient mice to generate primary tumors (Fig. S2 A). Next, we transplanted primary tumors into secondary recipients, which developed splenic tumors with the immunophenotype Lin−CD44+Kit+CD25+ (Fig. S2, B and C). These cells resemble DN2a cells and express high levels of BMP-like transcription factors (Fig. S2 D). We are mindful that the role of Zmiz1 might not be ETP-specific since the immunophenotype of these cells is DN2a, not ETP. However, the DN2 cell phenotype is not unreasonable for an ETP-ALL model since our scRNA-seq (Fig. 1 B) and scATAC-seq (Fig. 1 C) analyses identified pro-T cells (which are mostly the human DN2 equivalent) as the dominant projected population in ETP-ALL. Next, secondary recipients were injected with tamoxifen to delete Zmiz1. These mice showed ∼9–18-fold reduction in peripheral blast counts relative to control mice (Fig. 1, M and O; and Fig. S2, E and F). Median survival was prolonged by >200% (Fig. 1 P and Fig. S2 G). Thus, these data suggest that Zmiz1 has a role in maintaining the murine Lmo2/Il7r-mediated model of immature T-ALL, which is concordant with our data showing that ZMIZ1 is important for maintaining human immature T-ALL.
ZMIZ1 promotes ETP population growth and partly inhibits Notch1-induced T-cell development in vivo
During murine early T-cell development, ETPs differentiate to the DN2a stage (losing myeloid potential) and then commit to the T-cell lineage at DN2b (Fig. S2 H). Zmiz1 deletion using the Vav1-Cre strain (de Boer et al., 2003) reduced ETP numbers and promoted progression to the T-cell committed DN2b stage (Fig. S2, I–K). We here experimentally define “Notch1-induced T-cell development” as a specific readout that is measured by plating BM-derived LMPPs on OP9 stromal cells that express the Notch ligand DL1 and tracking development through the DN2a and DN2b stages with flow cytometry (Fig. 2 A) (Schmitt and Zuniga-Pflucker, 2002). A cardinal feature of BMP-like ETP-ALL is the suppression of NOTCH1 functions (Fig. 1 F) (Xu et al., 2024). Since ZMIZ1 is overexpressed in ETP-ALL relative to normal hematopoietic progenitors (Anand et al., 2021) and is higher in BMP-like cells (Fig. 1 F), we tested whether ZMIZ1 overexpression might suppress Notch1-induced T-cell development by plating ZMIZ1-transduced LMPPs on Notch ligands using this assay. These cells generated ninefold more ETP cells than control LMPPs but these ETPs showed impaired transition to DN2B cells (Fig. 2, B–E). Enforced ZMIZ1 increased expression by ∼2.2-fold, which was within the range of Zmiz1 levels seen in ETP-ALL models (Fig. 2 F). Expression of Notch1 target genes Tcf7, Gata3, and Hes1 (Hosokawa and Rothenberg, 2021) did not decrease in response to ZMIZ1 overexpression in ETPs, suggesting that ZMIZ1 does not directly suppress Notch1 transcriptional function (Fig. 2 G).
To test the effect of ZMIZ1 overexpression in vivo, we transferred transduced LMPPs into recipient mice through intrathymic injection (Fig. 2 H). ZMIZ1-transduced LMPPs generated fivefold higher ETP numbers than controls (Fig. 2, I and J). However, the expansion of ZMIZ1-transduced ETPs did not lead to the expansion of DN2a (Fig. 2 K) or DN2b (Fig. 2 L) stages. Further analysis showed that KitloCD25− myeloid progenitors were expanded more than KithiCD25− ETPs, although both effects were significant at P < 0.05. In a separate cohort of mice analyzed on day 13 after injection, average engraftment increased to 1.4% (range 0.1–3.2%) with an average %DP cells of 52% (range 12–89%). While these data are consistent with other in vivo data in Fig. S2, I–K and Wang et al. (2018) in showing inhibition from ETP to DN2a, they seem to conflict with in vitro data (Fig. 2, B–D). The reason might be technical or biological. On one hand, there might be technical differences between in vivo and in vitro models, such as supraphysiological Notch1 signaling in the OP9-DL1 system (Mohtashami et al., 2010; Xiong et al., 2011), which induces CD25, a characteristic feature of DN2a and a Notch1 target gene (Adler et al., 2003; Maillard et al., 2006). On the other hand, Zmiz1 might be active in both ETP and DN2a cells given that these categories are not static during normal development and given similar expression of Zmiz1 in mice (Immgen). Finally, there might also be mouse–human differences. In contrast to Immgen, scRNA-seq data on the largest atlas of normal human thymic progenitors (Lavaert et al., 2020) shows greater than twofold elevated expression (log2FC = 1.038) of ZMIZ1 in ETPs (n = 11,323) compared with “T-lineage specified cells” prior to T-cell commitment (n = 21,917). T-lineage specified cells are comparable with mouse DN2a. This difference was statistically significant (adjusted-P = 6.26×E-161; expression percentage 30.8% of ETP versus 18.6% of specified cells). Thus, we conservatively suggest that the overexpressed levels of ZMIZ1 in ETP-ALL induce population growth of precommitted T-cell progenitors and partial inhibition of Notch1-induced T-cell development in vivo.
ZMIZ1 promotes the expression of BMP-like oncogenes in normal and malignant ETPs
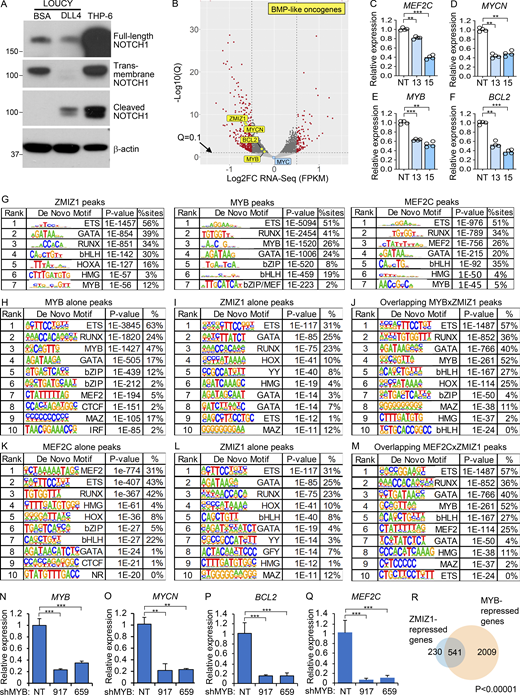
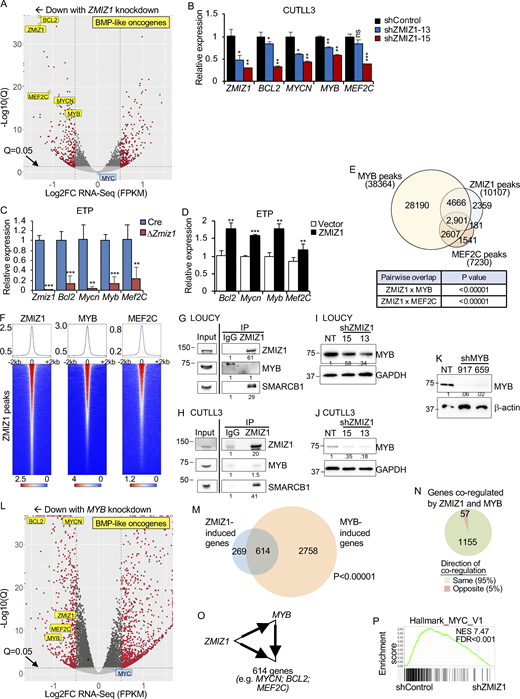
To understand the mechanism by which ZMIZ1 might promote high-risk ETP–ALL population growth, we knocked down ZMIZ1 in LOUCY cells and performed RNA-seq analysis. Since BMP-like ETP-ALL cells show low NOTCH1 activation (Fig. 1 F) (Xu et al., 2024), we confirmed that LOUCY cells do not express activated NOTCH1 (Fig. S3 A). RNA-seq identified 654 DEGs shared between two independent shZMIZ1 at q < 0.05 (Fig. 3 A and Fig. S3 B). ZMIZ1-induced target genes were significantly enriched for BMP-like signature genes, which robustly predict outcome in the full AALL0434 cohort (Table S1; P = 0.004169, Chi-square). Among the top 25 regulated genes, ZMIZ1 knockdown impaired the expression of BMP-like oncogenes MEF2C, BCL2, MYCN, and MYB in both LOUCY and CUTLL3 cells (Fig. 3 B, Fig. S3, C–F; and Table S3). To test whether ZMIZ1 regulation of BMP-like genes is native to normal ETPs, we sorted ETPs from Rosa26CreERT2Zmiz1f/f mice after injection of tamoxifen to delete Zmiz1. Consistently, Zmiz1 deletion repressed Bcl2, Mycn, Myb, and Mef2c (Fig. 3 C). Next, we transduced ZMIZ1 into ETPs on OP9-DL1 stroma. ZMIZ1 overexpression induced Bcl2, Mycn, Myb, and Mef2c (Fig. 3 D). ZMIZ1 knockdown had no significant effects on MYC levels (Fig. 3 A and Fig. S3 B). Thus, in contrast to T-committed cells and T-ALL (Pinnell et al., 2015; Wang et al., 2018), ZMIZ1 might not be a major regulator of MYC in BMP-like cells. These data suggest that ZMIZ1 has stage-specific effects and promotes normal and malignant ETP population growth through multiple BMP-like oncogenes.
ZMIZ1 induces MYB to convergently activate coherent feedforward loops that turn on the expression of BMP-like oncogenes
To test whether ZMIZ1 forms networks with its downstream transcription factor targets, we performed ZMIZ1 chromatin immunoprecipitation sequencing (ChIP-seq) and integrated this dataset with publicly available MYB and MEF2C ChIP-seq datasets in LOUCY cells. Globally, MYB co-occupied ∼75% ZMIZ1-bound sites while MEF2C co-occupied a lesser fraction (∼30%, Fig. 3, E and F). These overlaps were statistically significant at P < 0.00001. Motif analysis of ZMIZ1, MYB, and MEF2C ChIP-seq datasets showed top-ranked enrichment for the same transcription factor motifs—ETS, GATA, and RUNX—in addition to respective MYB and MEF2 motifs (Fig. S3 G). Motif analysis of pairwise overlaps identified enrichment for motifs of bHLH family and MYB family factors at overlapping MYB/ZMIZ1 and MEF2C/ZMIZ1 binding sites, respectively, compared with non-overlapping sites (Fig. S3, G–M). These data suggest a possible role for bHLH and MYB transcription factors in facilitating interactions between ZMIZ1 and transcription factors. Co-immunoprecipitation (co-IP) assay showed minimal protein–protein interaction between ZMIZ1 and MYB (fold change ∼1–1.5×) in contrast to a much stronger ZMIZ1–SMARCB2 interaction (fold change ∼29–50×; Fig. 3, G and H). Our inability to detect a ZMIZ1–MYB interaction is consistent with a mass spectrometry analysis conducted in MV-4-11 AML cells for MYB-interacting partners that did not detect ZMIZ1 (Takao et al., 2021).
The stronger overlap of ZMIZ1 peaks with MYB peaks relative to MEF2C peaks raised the possibility that ZMIZ1 induces MYB to convergently induce shared target genes. To test this possibility, we first confirmed that ZMIZ1 knockdown suppressed MYB protein expression (Fig. 3, I and J). Next, we transduced LOUCY cells with shMYB and confirmed the effective suppression of MYB protein expression (Fig. 3 K). RNA-seq analysis of MYB-knockdown cells showed differential expression of 5,922 genes at q < 0.05 (Fig. 3 L). Like ZMIZ1 knockdown (Fig. 3 A), MYB knockdown impaired the expression of MYCN, BCL2, and MEF2C as well as ZMIZ1 itself (Fig. 3 L and Fig. S3, N–Q). Overall, MYB co-regulated ∼70% of ZMIZ1 target genes (1,212 genes) of which 95% were strikingly in convergent direction (Fig. 3, M and N; and Fig. S3 R). These overlaps were statistically significant at P < 0.00001. These data suggest that ZMIZ1 induces MYB, which converges with ZMIZ1 to activate hundreds of genes, including BMP-like oncogenes, in coherent feedforward loops (Fig. 3 O).
ZMIZ1 induces MYCN, which promotes ETP population growth and myeloid cell fate and inhibits Notch1-induced T-cell development in gain-of-function studies
To determine the primary pathway activated by ZMIZ1, we performed a gene set enrichment analysis (GSEA). Despite the large number of ZMIZ1 targets shared with MYB, MYC rather than MYB target genes were the #1 and #3 most enriched Hallmark pathways for ZMIZ1-induced genes with normalized enrichment score (NES) of 4.9–7.5 and false discovery rate < 0.001 (Fig. 3 P and Table S4). MYC target gene lists also were highly ranked in C3 lists of transcription factor targets (#6 and #7 out of 958 lists) and C6 lists of oncogenic signatures (#3 out of 189 lists) (Tables S5 and S6). In contrast to committed pre-T cells, Zmiz1 deletion in ETPs had only modest effects on Myc expression (Fig. S4 A). Given these data and previous reports implicating MYCN in ETP-ALL oncogenesis (León et al., 2020; Treanor et al., 2013), we considered the possibility that MYCN is a major downstream effector of ZMIZ1. To test this, we transduced Mycn into LMPPs from control or Rosa26CreERT2Zmiz1f/f mice and cultured the cells on OP9-DL1 in the presence of OHT to delete Zmiz1. Mycn transduction strongly increased ETP numbers by ∼8.3-fold relative to vector control cells (Fig. 4, A and B). Mycn transduction increased KitloCD25− myeloid progenitor numbers by ∼3.6-fold (Fig. 4, A and C). Mycn transduction reduced DN2 numbers by twofold (Fig. 4, A and D). Zmiz1 deletion impaired ETP generation in OP9-DL1 culture (Fig. 4, A and B). Mycn transduction partially rescued this Zmiz1-dependent ETP defect (Fig. 4, A and B). Thus, ectopic Mycn can overcome strong Notch1 signaling, expanding ETPs, Zmiz1-deficient ETPs, and myeloid progenitors.
Since GFP is expressed from the same mRNA strand as Mycn, GFP levels can approximate Mycn levels. Consistently, Mycn-transduced GFPlow cells expressed Mycn ∼6.3-fold higher than controls and within the range of MYCN expression in ETP-ALL cells (∼2.4–7.3-fold; Fig. S4 B). GFPhigh cells expressed Mycn ∼19.8-fold higher than controls. Higher Mycn expression also repressed Tcf7 and Gata3, two important Notch1 target genes for T-cell specification (Hosokawa and Rothenberg, 2021), but not Hes1 (Fig. S4 C). Further, MYCN overexpression repressed the surface expression of CD25, encoded by the Notch1 target gene Il2ra. These data suggest that GFP expression correlates with Mycn expression, that Mycn-transduced GFPlow cells express Mycn on par with ETP-ALL cells, and that Mycn overexpression represses key Notch1 target genes important for Notch1-induced T-cell development.
To address the question of whether the expression level of Mycn predicts the likelihood that ETPs will be blocked from reaching the DN2 stage, we analyzed %ETP and %DN2 within the GFPlow and GFPhigh compartments in Fig. 4, A and B (Fig. S4, D–G). In the GFPlow compartment, ectopic Mycn increased %ETP by a respectable ∼3.9–4-fold while decreasing %DN2 by ∼0.77–0.79-fold compared with vector control (Fig. S4, H and I). In the GFPhigh compartment, ectopic Mycn increased %ETP by ∼5.2–11-fold while decreasing %DN2 by ∼0.15–0.17-fold compared with vector control (Fig. S4, J and K). To measure the transition block, we calculated the “ETP-to-DN2 inhibition index,” which we defined as a ratio of ratios = (%ETPMYCN/%DN2MYCN)/(%ETPvector/%DN2vector). The higher this index, the stronger the inhibition by Mycn on the ETP-to-DN2 transition. The GFPlow index gave a strong, approximately, five- to sixfold inhibition of the ETP-to-DN2 transition while the GFPhigh index showed even stronger ∼39- to 103-fold inhibition (Fig. S4 L). These data suggest that Mycn levels predict the magnitude of the block of the ETP-to-DN2 transition and strongly inhibit this transition at levels found in BMP-like ETP-ALL models.
Since Mycn impaired T-cell differentiation and since immature T-ALLs express myeloid genes (Haydu and Ferrando, 2013), we considered the possibility that the Mycn-transduced ETP cells were being diverted to the myeloid lineage. Consistently, Mycn transduction increased myeloid cell generation by ∼16-fold (Fig. 4, E and F). Zmiz1 deletion impaired myeloid cell generation by approximately threefold, and this defect was fully rescued by Mycn transduction (Fig. 4, E and F). These data suggest that the MYCN promotes ETP population growth and myeloid cell fate and inhibits Notch1-induced T-cell development downstream of Zmiz1, thereby promoting major features of BMP-like ETP-ALL.
Like Zmiz1, Mycn is important for restraining Notch1-induced T-cell development to preserve the ETP state in loss-of-function studies
Like other BMP-like transcription factors, Mycn expression is highest in ETPs and then decreases upon T-cell commitment and differentiation (Fig. S1 E and Fig. S5 A) (King et al., 2016). A previous report studying Mx1Cre Mycnf/f mice showed a modest defect in total thymocytes upon Mycn deletion (Laurenti et al., 2008). In our hands, Mx1Cre did not reliably induce efficient recombination in ETPs. Thus, we generated CD45.2+Il7rCre Mycnf/f mice. Next, we performed a competitive transplant assay with CD45.1+ competitor BM cells (Fig. 4 G). Peripheral blood cell analysis of CD4 and CD8 compartments showed significant but modest losses in %CD45.2+Il7rCre Mycnf/f cells relative to control cells (Fig. S5, B and C). At 16 wk, we did not observe any change in hematopoietic progenitor or ETP cell chimerism (Fig. 4 H and Fig. S5, D–G) but saw two- to threefold reductions in CD45.2+ chimerism from the DN2a stage to the CD4 and CD8 single-positive (SP) stages (Fig. 4, I–L; and Fig. S5, H–K). Since we did not detect a Mycn-dependent ETP defect, we wondered if Il7Cre was inefficiently deleting in ETPs. Consistently, deletion analysis showed only ∼65% Mycn deletion in ETPs compared with >95% deletion in DN2 cells (Fig. S5 L). To improve deletion efficiency, we seeded Rosa26CreERT2Mycnf/f LMPPs into OP9-DL1 cultures. The addition of OHT to delete Mycn induced a approximately fivefold reduction in ETP numbers (Fig. 4, M and N) and >80% Mycn deletion in ETPs relative to controls (Fig. 4 O). Mycn deletion released Notch1-induced T-cell development based on relatively fewer ETP cells and increased DN2b cell generation (Fig. 4, M and N). Taken together, the in vivo and in vitro data are generally concordant in showing that Mycn has an important role in normal T-cell development.
ZMIZ1 binds a native stem cell enhancer (NMRE) that interacts extensively with MYCN in ETP-ALL cells
To determine how ZMIZ1 regulates MYCN, we first analyzed H3K27ac and ATAC-seq profiles of BMP-like and near-ETP cell lines within the MYCN topologically associating domain (TAD) defined by our previous Hi-C and CTCF datasets (Kloetgen et al., 2020). Enhancers were identified based on the overlap of H3K27ac and ATAC-seq peaks distal from transcriptional start sites (TSS). We observed that ZMIZ1 and MYB strongly bind an unannotated +540 kb enhancer in CUTLL3, LOUCY, and THP-6 cells that loops to the MYCN promoter by H3K27ac Highly integrative chromatin immunoprecipitation (HiChIP) (red box, Fig. 5 A). Interestingly, this enhancer corresponds to an area previously reported to be activated by EZH2-knockout in Jurkat cells, correlating to a stem-like transcriptional program (León et al., 2020). We observed that the enhancer, which we named N-Myc regulating enhancer (NMRE), is robustly activated and accessible in primary ETP-ALL but not mature T-ALL, giving rise to an unannotated long noncoding RNA (lncRNA) whose expression correlates with MYCN expression (Fig. 5, B and C). Interestingly, the expression of NMRE lncRNA does not correlate with the expression of FAM49A, a neighboring gene located closer to NMRE than MYCN (Fig. 5 C). We found that the MYCN-NMRE region is flanked by CTCF sites in convergent orientation within the TAD, suggesting long-range interactions between elements in this domain (Fig. 5 A). Consistently, virtual 4C on our previous Hi-C datasets derived from patient samples (Kloetgen et al., 2020) revealed strong interactivity between MYCN and NMRE in ETP-ALL but not mature T-ALL cells (Fig. 5 D). This interactivity was highlighted by recent 3D chromatin profiling of pediatric patients, where HiChIP data revealed the NMRE locus as an ETP-ALL specific enhancer hub (Gambi et al., 2025), and it was confirmed by 4C-seq targeted on either element in BMP-like cells (LOUCY) but not in mature T-ALL (CUTLL1) (Fig. 5 E). These data suggest that the ZMIZ1-bound NMRE is a strong candidate as a major MYCN enhancer in ETP-ALL but not in mature T-ALL.
To determine the putative physiological cell-of-origin for the NMRE-MYCN interaction, we performed Hi-C in healthy human hematopoietic cells. We observed that intra-TAD activity is highest in ETP-ALL cells, high in CD34-positive hematopoietic stem and progenitor cells (HSPCs), intermediate in double-positive (DP) thymocytes, and lowest in mature T cells (Fig. 5 F). Intra-TAD activity strongly correlated with MYCN expression. To confirm that the NMRE is a stem cell enhancer, we examined publicly available ATAC-seq datasets of sorted human thymocytes (Roels et al., 2020). Consistently, NMRE chromatin is most open in HSPCs, begins to close in ETP/DN2 cells, and then closes completely upon T-cell commitment and differentiation (Fig. 5 G). We made similar observations in mice using publicly available ATAC-seq (Immgen) and Hi-C datasets of normal mouse BMP and thymic subsets (Fig. 5, H and I) (Hu et al., 2018). These data mirror the transient physiological expression pattern of Mycn in hematopoietic progenitors previously reported by our team (King et al., 2016). Our chromatin analysis suggests that NMRE has only a short temporal window in normal hematopoietic progenitors to potentially induce MYCN prior to T-cell commitment.
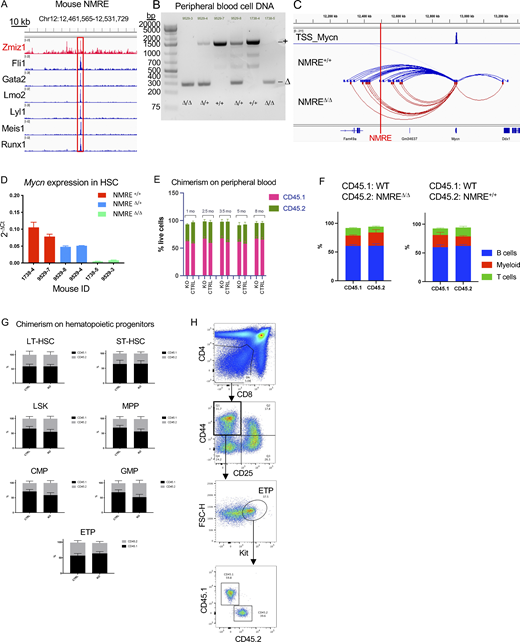
The NMRE is important for MYCN expression in BMP-like cells and BMPs but only drives population growth of BMP-like cells
The murine NMRE is bound by Zmiz1 and a cluster of leukemia-associated transcription factors, suggesting functional significance (Fig. 6 A). To confirm this, we inserted loxP sites flanking these binding sites in embryonic stem cells (ESC) to create a conditional NMRE deletion mouse model. Upon recombination through hematopoietic-specific Vav1-Cre, we observed NMRE deletion in mature peripheral blood cells (Fig. 6 B). Next, we performed Hi-C on sorted HSPCs from NMRE-deficient mice. NMRE deletion significantly reduced the number of interactions at the Mycn locus in knockouts (Fig. 6 C). Additionally, we observed a significant loss of Mycn expression in long-term HSCs (Fig. 6 D). Next, we questioned whether loss of NMRE might impair physiological hematopoiesis. To address this, we competitively transplanted CD45.2+ NMRE-deficient BM cells into lethally irradiated CD45.1+ recipient mice. Over an 8-mo follow-up, the NMRE-deficient and control cells contributed similar levels of engraftment to the peripheral blood, BMP, and thymic compartments (Fig. 6, E–H). These data demonstrate that NMRE is important for hematopoietic progenitor enhancer–promoter interactions and transcription of Mycn in vivo but is dispensable for HSC function and thymopoiesis.
Next, we wondered if NMRE is hijacked to induce MYCN expression and ETP-ALL cell growth. To test this possibility, we generated doxycycline (DOX)-inducible CRISPR interference (CRISPRi) versions of LOUCY, CUTLL3, and THP-6 cells using dCas9-KRAB (Chen et al., 2013). Consistently, repression of NMRE downregulated MYCN expression in BMP-like LOUCY and CUTLL3 cells by 30–50% and in near-ETP THP-6 cells by 60–70% (Fig. 7, A–C). Enhancer repression also impaired the population growth of LOUCY and CUTLL3 cells by three to fivefold but had no effect on near-ETP THP-6 cells (Fig. 7, D–F). We confirmed the effect of NMRE loss on BMP-like cells by CRISPRi drop-out assays, showing robust depletion of NMRE-deficient cells (Fig. 7 G) and significant reduction in MYCN expression (Fig. 7 H). In contrast to the effects on BMP-like cells, the growth of mature T-ALL cells (Jurkat, CUTLL1) were not affected by NMRE repression (Fig. 7, I and J). However, these cells were repressed by single guide RNAs (sgRNAs) targeting the MYC-specific enhancer N-Me (Herranz et al., 2014; Yashiro-Ohtani et al., 2014). Mycn transduction did not rescue ZMIZ1-deprived BMP-like cells (Fig. 7, K and L). Thus, MYCN is not the only important ZMIZ1 target gene. To test the importance of the NMRE in vivo, we injected the LOUCY cells into NSG mice and then induced sgRNA repression with DOX treatment. Repression of the NMRE reduced blast counts by fourfold and significantly increased survival (Fig. 7, M–O). These in vivo data are concordant with our in vitro data. Importantly, the suppression of blast counts (Fig. 7 N) and extension of survival (Fig. 7 O) were not statistically different compared to repressing a pan-essential gene (RPL8). These data demonstrate that the NMRE is essential for the population growth of BMP-like cells but is dispensable for normal ETPs, other normal blood cells, and more mature types of T-ALL.
ZMIZ1 induces MYB to directly and convergently activate a native stem cell network of high-risk BMP-like oncogenes
Since ZMIZ1 induces MYB to activate MYCN in a coherent feedforward loop through a native stem cell enhancer, we investigated the possibility that similar mechanisms apply to other key ZMIZ1/MYB-co-regulated ETP-ALL genes. Consistently, our analysis showed that ZMIZ1 strongly binds one putative enhancer in conjunction with MYB within each of the TADs containing MYB (red track, Fig. 8 A), BCL2 (red track, Fig. 8 B), and MEF2C (red track, Fig. 8, C and D). These unannotated enhancers show the strongest non-TSS H3K27ac and ATAC-seq signals within the TADs of respective genes. Further, these enhancers display strong H3K27ac signals in primary ETP-ALL and interact with respective promoters by H3K27ac HiChIP (Fig. 8, A–C). ATAC-seq datasets of sorted human thymocytes show that the chromatin of these enhancers is highly accessible in HSPCs and variably condenses upon T-cell commitment and differentiation (Fig. 8, E–G). Thus, like the NMRE, these regulatory elements appear to be native enhancers that are active and accessible in stem cells.
To test whether these stem cell enhancers regulate putative genes, we repressed them with DOX-inducible CRISPRi. Consistently, repression of the MYB, BCL2, and MEF2C enhancers downregulated the respective genes in BMP-like LOUCY (1.9→100-fold) and CUTLL3 cells (2.2→100-fold) (Fig. 9, A–C). Although statistically significant, the inhibitory effects in near-ETP THP-6 cells were generally weaker (1.2–2.9-fold). Furthermore, repression of the MYB and BCL2 enhancers had strong anti-population growth effects on LOUCY cells (15–31-fold) and CUTLL3 cells (72–187-fold) (Fig. 9, D and E; and Fig. 9, G and H). Anti-population growth effects on near-ETP THP-6 cells were weaker (Fig. 9, F and I). The stronger effects in the BMP-like models relative to the near-ETP model are reminiscent of the corresponding effects of NMRE repression in these models (Fig. 7, D–F). Interestingly, cell population growth was unaffected despite 65–75% MEF2C knockdown, suggesting that MEF2C might not be important for BMP-like cell maintenance (Fig. 9, J–L). In vivo repression of the BCL2 and MYB enhancers reduced blast counts by 12- and 17-fold, respectively, compared with control sgRNA and significantly increased survival (Fig. 7, M–O). These in vivo data are concordant with our in vitro data. Importantly, the suppression of blast counts (Fig. 7 M) and extension of survival (Fig. 7 O) were not statistically different compared with repressing a pan-essential gene (RPL8).
Since BMP expression predicts treatment resistance in ETP-ALL (Xu et al., 2024), we next wondered whether the ZMIZ1 stem cell network might also predict poor outcomes. Consistently, expression of the ZMIZ1 network signature (ZMIZ1-5—MEF2C, BCL2, MYB, MYCN, and ZMIZ1) is higher in MRD-positive than MRD-negative ETP/near-ETP ALL patients in the TARGET dataset (Fig. 10 A). Since MEF2C is known to induce the ETP-TF5 stem cell genes LYL1, LMO2, and HHEX (Homminga et al., 2011), we added these genes to the ZMIZ1-5 signature, which effectively merges the ZMIZ1-5 signature with the ETP-TF5 signature. MRD analysis using the combined signature (ZMIZ1-ETP-8) was more statistically significant than either signature alone (P = 0.0078 in Fig. 10 B compared to P = 0.02 in Fig. 10 A or P = 0.022 in Fig. S1 F). Further, the ZMIZ1-5 network signature predicted inferior overall survival of ETP-ALL patients in the AALL0434 clinical trial independently of MRD status (Cox-P = 4.74E-4, Fig. 10 C). The merged ZMIZ1-ETP-8 signature was even more predictive of inferior survival than the ZMIZ1-5 or ETP-TF5 signature alone (Cox-P = 5.4E-5, Fig. 10 D).
We next asked if the ZMIZ1 network would be highly expressed in the recently described high-risk ETP-like subtype, which is highly enriched for BMP-like cases (Pölönen et al., 2024; Xu et al., 2024). We observed strong and consistent enrichment of ZMIZ1 expression and signatures in the ETP-like subtype (n = 240) compared to other AALL0434 cases (P < 2.2e-16, Wilcox test, Fig. 10, E–M). Further, these data suggest that there is a range of ZMIZ1 network activity within the ETP-like subtype. Thus, we wondered if the ZMIZ1 signature could stratify ETP-like cases as it does in ETP-ALL cases. Consistently, ETP-like patients with high expression of the ETP-TF5, ZMIZ1-5, and ZMIZ1-ETP-8 signatures had inferior survival with Cox-P values of 2.31E-6 to 2.99E-6 (Fig. 10, N–P). In multivariate testing, we found each ZMIZ1 signature to obtain statistical significance independent of known clinically prognostic variables such as end-of-induction MRD and central nervous system (CNS) status, indicating that strong expression of ZMIZ1 network genes can add prognostic value even within the genomically defined high-risk ETP-like subtype. Taken together, our data show that ZMIZ1 induces MYB to directly and convergently activate the expression of genes associated with treatment resistance and inferior survival through a native stem cell enhancer network that is more essential for BMP-like leukemia than mature T-ALL.
Discussion
While the diverse mutational landscape across ETP-ALL and ETP-like tumors has been described (Liu et al., 2017; Montefiori et al., 2021; Pölönen et al., 2024; Zhang et al., 2012), establishing a common transcriptional network that activates stem cell genes, thereby unifying the aggressive behavior of these tumors, remains elusive. Identifying this network is an important unmet need as strong expression of stem cell gene signatures in BMP-like ETP-ALL samples predicts chemoresistance and venetoclax sensitivity more accurately than immunophenotype (Xu et al., 2024). This stem cell network might explain other characteristic features of BMP-like cells, such as myeloid gene expression, highly aggressive proliferation, and suppression of NOTCH1 function. Accordingly, this stem cell network should exclude NOTCH1-induced genes since Notch1 promotes T-cell commitment at the expense of stem cells and suppresses myeloid gene expression (Chiang et al., 2013; Hosokawa and Rothenberg, 2021; Klinakis et al., 2011; Rothenberg et al., 2016). Previously, we showed that the PIAS-like coactivator ZMIZ1 is a direct and context-dependent NOTCH1 cofactor that drives the proliferation of committed T-cell precursors and mature T-ALL cells (Pinnell et al., 2015; Wang et al., 2018). However, ZMIZ1 was later reported to be overexpressed in ETP-ALL cells compared to mature T-ALL cells and other blood cell types (Anand et al., 2021).
This observation led us to consider the possibility that ZMIZ1 induces a stem cell transcriptional network in ETP-ALL distinct from networks previously described in T-ALL (Sanda et al., 2012), and this might explain the cardinal features of BMP-like ETP-ALL. Toward this goal, we knocked down Zmiz1 in normal and malignant ETPs. Zmiz1 deletion in normal ETPs impaired population growth, reduced myeloid potential, and promoted Notch1-induced T-cell differentiation. Importantly, ZMIZ1 knockdown impaired cell population growth in multiple human and mouse models of BMP-like ETP-ALL. We next modeled the observed, overexpressed levels of ZMIZ1 in ETP-ALL (Anand et al., 2021). In vivo ZMIZ1 overexpression had the opposite effects as Zmiz1 loss-of-function, promoting ETP population growth and indirectly opposing Notch1-induced T-cell development. These data suggest that ZMIZ1 might activate a gene expression network that is important for opposing NOTCH1 and maintaining normal and malignant ETP stem cells in an undifferentiated, proliferative state.
To uncover this network, we integrated gene expression profiling, chromatin profiling, and 3D genome maps followed by validation with enhancer CRISPRi assays. These studies revealed a network of ZMIZ1-bound, previously unreported stem cell super-enhancers that induce four key BMP-like oncogenes—MYCN, BCL2, MEF2C, and MYB—in malignant and normal ETPs. The enhancers for BCL2, MYCN, and MYB were essential but the MEF2C enhancer was not. While MEF2C has not been reported to be essential for ETP maintenance, it has been reported to oppose NOTCH1-induced T-cell development and initiate mixed phenotype acute leukemia in mice (Cante-Barrett et al., 2022; Homminga et al., 2011). Thus, it is possible that ZMIZ1 might oppose the NOTCH1 function in the ETP context in part through MEF2C induction. Further, we found that 75% and 70% of ZMIZ1-bound regulated elements and target genes were co-occupied and co-regulated by MYB respectively. Strikingly, 95% of co-regulated genes were in a convergent direction. Thus, ZMIZ1 might induce MYB to convergently activate a shared stem cell gene expression program through co-occupied regulatory elements in coherent feedforward circuits that are rooted in normal ETP stem cells (Fig. 10 Q).
Our GSEA analysis identifying the MYC signature as the top enriched gene list for ZMIZ1-induced genes led us to consider whether Mycn is a major downstream ZMIZ1 effector pathway. To test this, we overexpressed Mycn or deleted Mycn in normal ETPs. Mycn overexpression reversed Zmiz1-deficient ETP loss and differentiation; promoted robust ETP population growth; diverted ETP cells to the myeloid cell fate, repressed Notch target genes, and impaired Notch1-induced T-cell development. Conversely, Mycn deletion had the opposite effect, impairing ETP population growth and promoting Notch1-induced T-cell development. Thus, it is possible that our observations that ZMIZ1 seems to oppose Notch1-induced T-cell development might be explained not only through MEF2C induction as described above but also through MYCN induction. It is also possible that ZMIZ1, MYCN, and NOTCH1 form an incoherent feed-forward circuit that allows complex regulatory control and explains the variable effects of ZMIZ1 on the ETP to DN2a transition. Future experiments would be needed to directly test this possibility.
Interestingly, our 3D chromatin mapping and accessibility analysis showed that ZMIZ1 normally has only a short temporal window to induce MYCN through the NMRE between the BMP and ETP stages. After the ETP stage, the NMRE becomes inactive. However, the hijacked ZMIZ1 transcriptional network enables ETP-ALL cells to continually access the NMRE by opposing NOTCH1-induced T-cell development. Sustained expression of MYCN then drives robust proliferation and reinforces the ETP state. While the NMRE maintains ETP-ALL, it is also a potential vulnerability as malignant ETPs but not normal ETPs or other blood cells are highly dependent on NMRE activity.
We did not show that NMRE inhibition leads to downregulation of BMP-like signatures in BMP-like ETP-ALL. However, our unpublished MYCN ChIP-seq data shows that MYCN binds elements regulating BMP-like genes, including the ones presented here (MYCN, MYB, MEF2C, and BCL2). Further, AALL0434 ETP-ALL samples expressing high MYCN transcripts also express higher levels of BMP-like signatures compared with ETP-ALL samples expressing low MYCN transcripts. Although these data suggest that NMRE and MYCN promote BMP-like gene expression, more definitive experiments are needed.
Our current study and others suggest conserved roles for mouse Zmiz1, Mycn, and Mef2C during early T-cell development (Cante-Barrett et al., 2022; Wang et al., 2018). However, to our knowledge (Lieu and Reddy, 2009; Ogilvy et al., 1999; Veis et al., 1993), it is unclear whether the roles of Myb and Bcl2 are also conserved.
The mechanism by which ZMIZ1 has differential effects on NOTCH1 function in immature versus mature T-ALL remains to be elucidated. To develop a working model, we are mindful of three key observations. First, Zmiz1 is a promiscuous cofactor, having several known partners besides Notch1 (Lomelí, 2022). Second, substantial changes in chromatin accessibility at regulatory elements occur between the ETP and DN3 stages (Johnson et al., 2018), such as the stem cell enhancers described in this manuscript moving from open to closed configuration. Third, Notch1 expression increases to high levels from ETP to DN3 through a positive autoregulatory loop (Wang et al., 2018; Yashiro-Ohtani et al., 2009). Thus, our working model is that in ETPs, ZMIZ1 primarily binds and coactivates a to-be-determined transcription factor (“Factor X”) to activate stem cell enhancers and induce expression of downstream factors like MYCN and MEF2C that oppose Notch functions. Upon transition from ETP to DN3 cells, chromatin configurations change, the expression of negative Notch regulators and Factor X decrease, and the expression of Notch1 increases. In this context, we predict that Zmiz1 moves from being a coactivator of Factor X to a coactivator of Notch1. This model will require rigorous future experiments to test.
Therapeutically, the ZMIZ1 stem cell network might be targeted by BCL2 inhibitors (BH3 mimetics) and MYB inhibitors (Clesham et al., 2022; He et al., 2018; Ramaswamy et al., 2018; Uttarkar et al., 2015, 2016a, 2016b; Walf-Vorderwülbecke et al., 2018) (Fig. 10 Q). Specific MYCN inhibitors are not available but covalent inhibitors developed for MYC (Boike et al., 2020) could in theory also be developed for MYCN. To target ZMIZ1 directly, future investigations should focus on the factors that regulate ZMIZ1 expression, activity, and protein–protein interactions. The ZMIZ1 network might be important to block as it can mechanistically contribute to several cardinal features of high-risk BMP-like leukemia—association with treatment resistance/poor survival, augmented BMP transcription factor expression, NOTCH1 opposition, venetoclax sensitivity, and aggressive clinical behavior through the synergistic combination of MYC+BCL2. Our basic science study does not nominate the ZMIZ1 signature as a high-risk biomarker. However, there might be a wide therapeutic window for ZMIZ1 inhibitors since Zmiz1 is dispensable for postnatal health (Pinnell et al., 2015). Thus, targeting ZMIZ1 directly might safely disable a hijacked stem cell gene expression program shared by ETP-ALL tumors that promotes high-risk disease.
Materials and methods
Mice
Zmiz1f/f, Rosa26CreERT2Zmiz1f/f, and Vav1-Cre Zmiz1f/f mice were previously generated (Pinnell et al., 2015; Wang et al., 2018). CD2-Lmo2-tg mice were a gift from Utpal Davé (Indiana University, Indianapolis, IN, USA) (Smith et al., 2014). Il7rCre mice were a gift from Hans-Reimer Rodewald (German Cancer Research Center, Heidelberg, Germany) (Schlenner et al., 2010). C57/BL6 mice between the ages of 4–8 wk were purchased from Taconic. Mycnf/f and NOD-scid-IL2Rgammanull (NSG) mice were obtained from Jackson. Specific pathogen–free female and male mice were used. The ages of mice from which cells were taken was 4–10 wk. All mouse experiments were performed according to National Institutes of Health (NIH) guidelines and approved protocols from the Institutional Animal Care and Use Committee at the University of Michigan (Ann Arbor, MI, USA).
Generation of conditional NMRE-deficient mice
To generate a conditional knockout system that deletes the transcription factor binding sites in the NMRE upon Cre activation, we sequentially inserted loxP sites flanking this region of interest (mm10: chr12:12496106–12497363). To this aim, we used small ssODN to drive CRISPR-mediated homology-driven recombination in murine ESC. After checking the correct CRISPR targeting by sequencing, we injected an ESC clone inside the blastocyst of a C57BL/6 mouse, which was then implanted into a surrogate mouse. Pups were checked for loxP insertion and then crossed to Vav1-Cre mice to obtain the deletion of the NMRE.
Primers, antibodies, sgRNA sequences, and flow cytometry reagents
Please see Table S7.
Constructs and viral production
MSCV-Mycn-IRES-GFP was obtained from Addgene (#35394; RRID:Addgene_35394). ShRNA constructs were obtained from Sigma-Aldrich or Open Biosystems: shControl (SHC002), shMYB-917 (TRCN0000295917), shMYB-659 (TRCN0000288659), shMEF2C-13 (TRCN0000015813), shMEF2C-14 (TRCN0000015814), and shMEF2C-16 (TRCN0000015816). ShZMIZ1-13 and -15 were previously generated and validated (Rakowski et al., 2013). MSCV-IL7r-GCinsL243-GFP virus was obtained from Charles Mullighan (St. Jude Children’s Research Hospital, Nashville, TN, USA). The TET3G activator plasmid was generated by subcloning the TET3G from pLVX-EF1a-Tet3G (#631359; Clontech) into pRRLsin.cPPTCTS.MNDU3.BXE.PGK.NGFR.WPRE (gift from Andrew Weng). CRISPRi sgRNAs were cloned into the sgOPTI virus (#85681; RRID:Addgene_85681; Addgene) and co-transduced with TRE-KRAB-dCas9-IRES-GFP virus (#85556; RRID:Addgene_85556; Addgene) and TET3G activator virus (Kodgule et al., 2023). High titer retroviral or lentiviral supernatant was produced using transient transfection of 293T cells (RRID: CVCL_0063) and assessed for GFP or NGFR titer by transducing 8,946 cells and measuring %GFP and %NGFR 2 days later.
Cell line experiments
CUTLL3 cells were obtained from Adolfo Ferrando (Columbia University, New York City, NY, USA). LOUCY cells (RRID: CVCL_1380) were obtained from ATCC. THP-6 cells were obtained from Andrew Weng (British Columbia Cancer Agency, Vancouver, Canada). OP9-DL1 and OP9-DL4 cells were obtained from J.C. Zuniga-Pflucker (University of Toronto, Toronto, Canada). All human cell lines were authenticated using STR analysis prior to use (Genetica Corporation). T-ALL cell lines were grown in RPMI 1640 (Invitrogen) supplemented with 10% fetal bovine serum (Hyclone or Gibco), 2 mM L-glutamine, 2-mercaptoethanol (0.0005% [vol/vol]; Sigma-Aldrich), penicillin, and streptomycin. OP9 and 293T cells were maintained in Dulbecco’s modified Eagle medium (DMEM; Invitrogen) with the same supplements except 2-mercaptoethanol and with 20% serum for OP9. Cells were grown at 37°C under 5% CO2. All cell lines were cultured <3 mo after resuscitation and tested for contaminants using MycoAlert (Lonza) every 1–3 mo to ensure they were free of Mycoplasma contamination. DLL4 was obtained from R&D. LOUCY-interference cell lines and other lines will be shared freely upon request.
Western blot
10 million cells of human T-ALL cell lines were washed with ice-cold TBS (50 mM Tris, pH8.0, 150 mM NaCl) and lysed in 250 μl NTEN buffer (50 mM Tris, pH 8.0, 1 mM EDTA, 150 mM NaCl and 1% [vol/vol] NP-40, I3021; Sigma-Aldrich) supplemented with the protease and phosphatase inhibitors on ice for 20 min, followed by centrifugation to remove cell debris (20 min, 16,000 g). Cells were washed with TBS and lysed in IP buffer (10% glycerol, 150 mM NaCl, 50 mM HEPES, pH 8.0, 2 mM EDTA, 0.1% NP-40) with protease and phosphatase inhibitors. Lysis was performed 6 h after incubation with DLL4 for LOUCY cells and 5 days after puromycin selection for LOUCY and CUTLL3 cells. 6× sample buffer was added and the samples were heated at 95°C for 5 min and then frozen. The molecular weight ladder was Precision Plus Protein Dual Color Standards (Bio-Rad). Western blot was performed using standard methods and visualized either with film or an Azure300 imager.
Flow cytometry
Cells were stained on ice in PBS containing 2% fetal bovine serum, 10 mM Hepes, and 0.02% NaN3 after blocking with rat and mouse IgG (Sigma-Aldrich). Flow cytometry antibodies were obtained from Biolegend or eBioscience. The lineage cocktail used for analysis and sorting was B220, CD19, CD8a, CD8b, CD3, TCRβ, TCRγ, CD11b, Gr-1, Ter119, NK1.1, and CD11c. Samples were analyzed on an LSR Fortessa flow cytometer or sorted using a FACSAria II (BD Biosciences). Dead cells were excluded using 7-aminoactinomycin D (7-AAD) or 4′,6-diamidino-2-phenylindole (DAPI). Intracellular staining was performed using the BD Cell Fixation/Permeablization Kit (Cat# 554714; BD). Data were analyzed using FlowJo (Tree Star). Cell cycle analysis was performed by administering 1 ml of propidium iodide stain solution (PI, 20 μg/ml and DNase-free RNase A, 100 μg/ml) to the freshly collected cells from primary tissues and analyzed by FACS within 30 min. All data acquisition was performed on BD-FACS Canto and analyzed using FlowJo analysis software (Tree Star).
Quantitative RT-PCR (qRT-PCR)
Total RNA was prepared using the RNeasy Plus Mini kit (Qiagen) according to the manufacturer’s protocol. Random-primed total RNAs (0.5 µg) were reverse-transcribed with SuperScript II (Invitrogen). Transcripts were amplified with either TaqMan Universal PCR Master Mix or Power Sybr Green PCR Master Mix (Applied Biosystems) on the Applied Biosystems StepOnePlus (Applied Biosystems). Relative expression of target genes compared to the control was calculated using the delta-delta cycle threshold method with the expression of EF1A or 18S as an internal reference.
ChIP
Cells were transduced with the specified viral construct. Crosslinking was performed with either formaldehyde alone or disuccinimidyl glutarate (DSG) and formaldehyde method. In the formaldehyde alone method, 12 million cells were harvested in 12 ml culture media. Formaldehyde (1%; Sigma-Aldrich) was added to the solution with shaking for 10 min followed by the addition of glycine buffer (125 mM) with shaking for 5 min. The sample was washed 2× in DPBS and snap frozen. In the DSG and formaldehyde method, 12 million cells were harvested and washed once with DPBS then resuspended in 12 ml 2% FBS and 1% HEPES in DPBS. Crosslinking was performed in a 2 mM DSG in DMSO (Thermo Fisher Scientific) solution with shaking for 30 min. Formaldehyde (1%; Sigma-Aldrich) was added to the solution with shaking for 10 min. The sample was washed three times with DPBS and snap-frozen. Cell lysis was performed with two washes of 1 ml of hypotonic lysis buffer (8 mM KCl, 5 mM Pipes pH 8.0, and 0.5% NP-40). After second wash, they were incubated on ice for 5 min. The sample was resuspended in 600 μl SDS lysis buffer (1% SDS, 10 mM EDTA, 50 mM Tris pH 7.5) and passed 2× through a 27 g needle. Sonication was performed on ice at level 3, 50% output, 30 s sonication, and 30 s rest, six times (Fisher Sonifier). The sample was centrifuged to remove debris, diluted in 5.4 ml dilution buffer (0.01% SDS, 1.1% Triton X-100, 1.2 mM EDTA, 16.7 mM Tris pH 7.5, 167 mM NaCl), divided into four tubes, and incubated with antibody overnight at 4°C with rotation. Dynabeads Protein G (10003D; Invitrogen) were blocked with 5% BSA, added to the sample (30 μl), and incubated for 1 h at 4°C with rotation. Samples were washed 1× in low salt buffer (0.1% SDS, 1% Triton X-100, 2 mM EDTA, 20 mM Tris-HCl pH 7.5, 150 mM NaCl), 1× in high salt buffer (0.1% SDS, 1% Triton X-100, 2 mM EDTA, 20 mM Tris-HCl pH 7.5, 500 mM NaCl), 1× in LiCl buffer (0.25 M LiCl, 1% NP-40, 1% deoxycholic acid, 1 mM EDTA, 10 mM Tris pH 7.5), and 2× in TE buffer (10 mM Tris pH 8.0, 1 mM EDTA). All washes were performed for 5 min at 4°C with rotation except for LiCl which was 3 min on ice without agitation. Beads were resuspended in 250 μl elution buffer (1 M NaHCO3, 1% SDS) and incubated at 42°C for 30 min. NaCl (0.2 M) was added to the eluted sample and incubated at 65°C overnight followed by 37°C for 30 min. RNAse A (0.1 mg/ml; Qiagen) was added followed by clean up using AMPure beads. Concentration was measured using the Qbit dsDNA HS assay kit (Life Technologies). Target regions were amplified with POWER SybrGreen PCR Master Mix (Applied Biosystems) on the ABI Prism 7900 sequence detection system (Applied Biosystems).
ChIP-seq library preparation, sequencing, alignment, filtering, motif analysis, display file generation, and peak calling
ChIP chromatin that was prepared from LOUCY cells was end-repaired (End-It; Epicentre), A-tailed (Klenow fragment 3′→5′ exo-; New England Biolabs), and ligated to barcoded Illumina adaptors (Quick T4 DNA ligase; NEB; adaptors produced by KAPA). Each reaction was followed by a clean-up with SPRI beads (AmpureXP; Beckman Coulter). Ligation products were amplified by 14 cycles of PCR with Illumina indexing primers and PFU Ultra II HS PCR mix (Agilent). Library size selection for 300–600 bp chromatin was performed using two-step SPRI bead selection (AmpureXP; Beckman Coulter). Library size was confirmed via Tapestation D1000 (Agilent). Final libraries were sequenced with 75 cycles paired-end (38 bp × 2) on a Nextseq (Illumina) according to the manufacturer’s protocols. Reads were aligned to the hg19 genome assembly using bwa-aln (bwa version 0.7.12). Data were filtered to remove PCR duplicates and reads mapping to >2 genomic sites. All peak sets were also post-filtered for known ENCODE blacklist regions (available at https://www.encodeproject.org/annotations/ENCSR636HFF/) (Amemiya, 2019). Filtered bam files were marked as “pruned bam files.” Next, bigwig display files were generated with igvtools count and deepTools bamCoverage. Bed peak files were generated with HOMER findPeaks (“style -factor” for transcription factors). Scaling for all ChIP-Seq tracks in the figures is equal to local paired-end fragment coverage × (1,000,000/totalCount). To determine overlaps between transcription factor peaks, we used intersectBed in BEDTools.
ATAC-seq library preparation, sequencing, alignment, filtering, motif analysis, display file generation, and peak calling
Nuclei were isolated from 50,000 cells for each sample using Nuclei EZ prep-Nuclei Isolation Kit (Sigma-Aldrich). The transposition reaction mix (25 μl of 2× TD buffer, 2.5 μl of Tn5 transposase [Illumina], 15 μl of PBS, and 7.5 μl of nuclease-free water) was added to nuclei and incubated at 37°C for 1 h in an orbital shaker at 300 RPM. 50 μl Qiagen buffer PB was added to each sample to stop the reaction and DNA was isolated with AMPure XP beads (Beckman Coulter). 15 cycles of PCR were performed with transposed DNA using the dual index primers and NEBNext PCR Master Mix, followed by AMPure XP purification. After quantification and fragment size analysis, libraries were sequenced on Illumina Nextseq with 2 × 38 bp paired-end sequencing. Paired-end ATAC-seq reads were aligned to hg19 using BWA-ALN (v0.7.17) and filtered to remove PCR duplicates and read-pairs mapping to >2 sites genome-wide. Display files were generated with deeptools bamCoverage and visualized with IGV. Scaling for all ATAC-seq tracks in figures is equal to local paired-end fragment coverage × (1,000,000/totalCount). ATAC-seq peak summits were identified with MACS2 using default parameters. All peak sets were post-filtered against hg19 blacklist regions as above.
Histone H3K27ac HiChIP
HiChIP was performed using the Arima HiC+ kit (Arima Genomics) following the manufacturer’s instructions (March 2020 user guide) with some modifications. Briefly, up to 3 million cells were crosslinked in 2% formaldehyde (Sigma-Aldrich) for 10 min at room temperature. Formaldehyde was neutralized by adding Stop Solution 1 (Arima HiC+ kit) and processed following the manufacturer’s instructions for steps: (1) restriction enzyme digestion, (2) chromatin shearing, (3) antibody incubation, (4) protein A bead blocking, (5) IP and washes, (6) quality controls, (7) library preparation, (8) library complexity quality control, and (9) library amplification. For step 2, chromatin was sheared on Covaris LE 220 (Covaris) at 300W peak incident power, 15% duty factor, 200 cycles per burst, 300 s treatment time, and 4°C. For step 5, samples were immunoprecipitated using 2.5 μl/sample of Abflex Histone H3K27ac antibody (ActiveMotif). Libraries were sequenced in paired-end by NovaSeq-6000 on SP flow cells at 50 cycles.
4C-seq
For the NMRE and MYCN viewpoints, we created biological duplicates for all experiments. For each replicate, 10 million cells (LOUCY or CUTLL1) were fixed in 2% formaldehyde and 10% FBS in PBS for 10 min at room temperature. Crosslinking was quenched with glycine and samples were digested with two sequential enzyme reactions (DpnII and Csp6I). To enable genome-wide screening of DNA contacts made by specific sites of interest (in this case the MYCN and the NMRE loci), we applied the standard 4C-seq protocol (Van der Werken et al., 2012) with some minor modifications. Briefly, 10 million cells per condition/viewpoint were collected, washed, and crosslinked by 2% formaldehyde for 10 min at room temperature. Crosslinking was quenched in 1 M glycine, and then cells were lysed (0.5% NP-40, 1% TritonX-100) and DNA was digested by DpnII restriction enzyme overnight at 37°C. After assessing digestion efficiency by electrophoresis, DNA fragments were ligated, crosslinks were reversed by incubating with 10 mg/ml proteinase K for 8 h at 65°C. After DNA purification, circular fragments were digested again, this time using the Csp6I restriction enzyme, ligated, purified, and amplified by specific PCR primers designed around the area of interest. More specifically, primers were designed in the region surrounding (±2.500 bases) the first exon of the desired genes. Each primer was supplemented with compatible restriction sites for the DpnII/Csp6I enzymes and designed according to the pipeline for 4-bp cutters (https://tanaylab.github.io). Libraries were created using primers including adapter sequences/index compatible with Illumina sequencing protocols. After amplification and purification, libraries were sequenced paired-end on Illumina HiSeq 2500. Each sample was processed and sequenced in replicates. To analyze the sequencing outputs, we first generated a reduced genome reference based on the human reference genome (GRCh37/hg19) by only considering unique sequence fragments that are adjacent to the restriction sites of the enzyme used in the 4C protocol (DpnII, in this case). All reads were aligned to this reduced reference genome by bowtie (v. 1.0.0) (Langmead and Salzberg, 2012), only considering uniquely aligned reads. We then removed all self-ligated and undigested fragments by 4C-ker pipeline and found that all samples had >10 million reads. We then defined successive overlapping windows of different resolutions (10 and 40 kb), with all adjacent windows overlapping by 90% of their length. We counted uniquely mapped reads for each window per sample and performed normalization with edgeR (leading to counts per million [CPM] per window), obtaining a smooth signal across samples for different sizes of regions to be plotted. Data from biological replicates were averaged after normalization for visualization. Differential interactions were identified by edgeR (v. 3.14.0) (functions glmQLFit and glmQLFTest). Log10(P value) is shown on the negative Y axis of 4C plots as an indicator for the most significant changes. Quantifications were calculated for the highest single peak at 40 kb resolution for both viewpoints. To generate the 4C-seq library, 1 µg of prepared 4C template was amplified with 30 PCR cycles per bait, and the fragments were sequenced on Illumina HiSeq 2500 to generate single-end reads at 50 cycles.
Human patient/PDX expression data
The human patient data were based upon data generated by TARGET initiative, phs000218 (https://www.cancer.gov/ccg/research/genome-sequencing/target). The ALL project team was headed by Stephen P. Hunger, M.D. at the University of Colorado Cancer Center, Denver, CO, USA. The dbGaP Sub-study ID was phs000463/phs000464. The data used for this analysis are available at https://portal.gdc.cancer.gov/projects/TARGET-ALL-P2.
PDX experiments
PDXs (BCAT17802-V2, and BCAT82114-V1) were obtained from Andrew Weng. PDXs were expanded in NSG mice, transduced, and cultured on OP9-DL4 cells. Live-frozen PDX aliquots were thawed and co-cultured on irradiated OP9-DL4 stromal cells in IMDM media (Invitrogen) supplemented with human stem cell factor (hSCF, #300-07, 50 ng/ml; Peprotech), human insulin-like growth factor (hIGF, #100-11, 10 ng/ml; Peprotech), human IL-2 (hIL2, #200-02, 10 ng/ml; Peprotech), murine IL-7 (mIL7, #217-17, 10 ng/ml; Peprotech), and SR-1 (0.57 μM; Cayman). PDXs were transduced with concentrated lentivirus and plated on irradiated OP9-DL4 cells for in vitro growth assay. Cells were analyzed via FACs for YFP and replated on freshly irradiated OP9-DL4 cells every 3 days. De-identified human samples were obtained and used with appropriate institutional approval (University of Michigan Institutional Review Board and UBC/BCCA Research Ethics Board) and informed consent under guidelines established by the Declaration of Helsinki.
BM transplantation
BM stem and progenitor cells of Lmo2-tg CreERT2Rosa26CreERT2 or Rosa26CreERT2Zmiz1f/f mice were transduced with IL7r-mutant alleles (IL7R-GCinsL243). BM cells were collected from 4- to 8-wk-old C57BL/6 mice 4 days after intravenous administration of 5-fluorouracil (5FU, 250 mg/kg). The cells were cultured overnight in the presence of IL-3 (6 ng/ml), IL-6 (5–10 ng/ml), and SCF (100 ng/ml). The cells were then washed, resuspended in retroviral supernatant containing GFP-expressing retrovirus (which had been normalized based on GFP-titers), placed in the same cytokine cocktail with the addition of polybrene (4 μg/ml), and centrifuged at 1,290 g for 90 min. A second round of “spinoculation” was performed the following morning. After washing with PBS, 4–5 × 10⁵ cells were injected intravenously into lethally irradiated (950 rads) syngeneic recipients. Mice were maintained on antibiotics in drinking water for 2 wk after BMT. Primary immature T-ALL tumors were subsequently injected into secondary syngeneic recipients. Secondary recipients were injected with tamoxifen (0.025 mg/g) 3×/wk for a total of 8–9 doses once the average peripheral GFP+ blast count was >5%. For competitive transplantation, 1 million BM cells from C57BL/6 mice (CD45.2+) were mixed with 1 million BM cells from C57BL/6.Ly5.2 (B6-SJL, CD45.1+) mice prior to injection into C57BL/6.Ly5.2 (B6-SJL, CD45.1+) recipient mice.
Transduction and co-culture of LMPPs on OP9-DL1 stroma
80 μl of RetroNectin (Takara) was added per well to 96-well plates, incubated overnight at 4°C or at room temperature for 2 h. RetroNectin was removed, and wells were blocked by 80 μl 2% BSA in PBS for 0.5 h. The 2% BSA was removed, the wells were washed with PBS, and 200 μl retroviral supernatants of equal titer were added to the wells. The plate was centrifuged for 2 h at 32°C at 1,811 g, the supernatant was removed, and the wells were washed with 2% BSA. 4,000 sorted murine Lineage−Sca1+Kit+Flt3+ LMPP cells were seeded into virus/RetroNectin-coated 96 well plates in SFEM with 20 ng/ml human Flt3-ligand (Peprotech), 20 ng/ml murine stem cell factor (Peprotech), 10 ng/ml murine IL-3 (Peprotech), and 10 ng/ml murine IL-6 (Peprotech), and penicillin and streptomycin, incubated 48 h at 37°C. LMPP cells were transferred to a collection tube by transferring the media and two PBS washes. Equal numbers of NGFR+ cells for each condition were sorted into a tube containing OP9 media. The cells were resuspended in OP9 media with 1 ng/ml IL-7 and 5 ng/ml Flt3-ligand and transferred to an OP9-DL1 feeder plate. The cells were harvested from the OP9-DL1 feeder plate after 3 or 4 days of culture, centrifuged, resuspended in fresh media and cytokines, and then added back to the feeder plate. After 7 days of culture with OP9-DL1 cells, the NGFR+ cells were analyzed by flow cytometry.
Intrathymic injection of transduced LMPPs
Intrathymic injection was performed according to published protocols (Manna and Bhandoola, 2016). Briefly, the mouse to be injected is anesthetized with ketamine and xylazine administration via intraperitoneal injection. Buprenorphine extended release (ethiqua) and meloxicam are administered sc preoperatively to provide a stable and consistent plane of analgesia for 48–72 h. Anesthesia takes effect in a few minutes and lasts for 20–30 min. Before starting the procedure, the toe of the mouse is pinched to assess the anesthetic depth. A small amount of ketamine solution can be injected at one-third of the original dose if the toe reflex is still active 5 min after ketamine/xylazine anesthetic injection. Side effects are bradycardia and hypotension. The work area is rinsed with 70% EtOH and covered with a sterile drape. The anesthetized mouse is placed on its back on a surgical board and immobilized by strapping its feet with rubber bands. An additional rubber band is loosely stretched across the mouth to hold back the head. The tongue is gently pulled out with forceps so that the mouse does not asphyxiate. The head of the mouse is oriented toward the operator. Eye moisture salve is applied to each eye to prevent the cornea from drying out. Hair is removed from the incision site and the incision site is cleaned using three alternating passes of a scrub (betadine or chlorhexidine) and rinse (sterile saline, water, or alcohol). The skin is pinched at the upper thoracic region with forceps. A small longitudinal midline cut is made with fine delicate scissors. The incision is continued through the skin with scissors. One continuous incision is made up to the xiphoid process visible as white “V” under the skin (from the maxillary to the middle of the rib cage). The skin is separated along the fascial plane on either side of the incision by gently inserting a forceps jaw underneath the skin. The cut skin is spread outward on each side with forceps, creating two “flaps” to expose the sternum. The salivary gland is carefully lifted, lying between the larynx and sternal notch, with forceps. A single cut in the connective tissue is made attaching it to the rib cage (at the end pointing away from the operator). The gland is pulled superiorly in the operator’s direction to visualize the top of the rib cage and trachea, taking care not to tear them. Using clean high-quality fine forceps, the operator very carefully pinches the thin muscle lying on top of the trachea. Once pinched, the operator does not let it go. The muscle is pulled inferiorly as far as possible (it should eventually tear) to reveal a small invagination at the top of the rib cage. By introducing scissors into the invagination, the operator makes a vertically oriented 3-mm incision (with an upward movement, less than one-third of the sternum) down through the sternum to bisect the upper sternum at the centerline (slightly to the right, at the level of first two ribs). The operator gently spreads the opened ribcage sideways using the tip of blunt, curved forceps to expose/reveal the thymus, the milky white-translucent-colored organ pulsing through the opening. At the time of thoracotomy, the operator keeps the tip of the scissors away from the heart and lungs. Bleeding may obscure the opening. If necessary, the blood is soaked with a clean absorbent pad. If the tip of the thymus is not visible, the operator can extend the sternum incision. A Hamilton syringe is filled with 10 μl cell suspension and air bubbles are removed. The operator maintains the split open by pushing it to the side with forceps. Using the other hand, the operator inserts the needle, bevel up, into the parenchyma of the thymus, 2–3 mm under the thymic capsule. 10 μl of cell suspension or solution is injected in the lobe and the needle is withdrawn carefully to minimize the backflow. If needed, injection is repeated for the other lobe. After administration of cell suspension or solution into the thymus, the needle is allowed to remain in the lobe for a few seconds so that the internal pressure decreases. This gives the injected solution time to redistribute, minimizing leakage after withdrawal. The injected volume should not exceed 10 μl per lobe. The goal is to inject close to the middle of the lobe ∼2–3 mm deep. Due to the enormous size variation of the mouse thymus with age, it is difficult to specify the injection depth. Immediately after injection, the syringe is flushed three to four times with sterile PBS, taking care not to bend the wire plunger. The operator puts back down the salivary gland in place, to block the rib cage opening. The mouse is released from the rubber bands. The operator holds the two flaps of skin together with forceps and closes the wound by stapling the skin gently with two to three wound clips. The mouse is returned to the cage, checking to ensure that the tongue is still out. To prevent hypothermia after surgery, animals are placed under a heating lamp while still under anesthesia. Mice are singly housed while recovering from anesthesia and placed back with cage mates when ambulatory. Transduction of CD45.2+ LMPP cells on RetroNectin (Takara) coated plates was performed. 2 days later, 6,000 sorted NGFR+ LMPP cells were injected into thymuses exposed with thoracotomy of anesthetized CD45.1 recipients that had been sublethally irradiated (450 rad). After 5 days, harvest thymus and stain DN cells, analyzed by flow cytometry.
Microscope
Thymus pictures were obtained with an optical microscope (Olympus SZX16) with a numerical aperture of the 0.7× objective lens of 0.15 at room temperature using an Olympus DP72 camera. An acquisition software was Olympus Cellsens Standard.
RNA-seq
LOUCY cells were transduced with equal titers of concentrated lentivirus in biological quadruplicates, treated at 48 h with puromycin, and harvested after an additional 48 h. RNA from the sorted cells was isolated using RNeasy Plus Micro Kit (QIA74034) according to the manufacturer’s protocols. RNA samples with RINs of 8 or greater according to the Bioanalyzer (Agilent) were used to generate libraries by the University of Michigan Sequencing Core. The libraries were multiplexed and the final library pools were clustered on the cBot (Illumina) and sequenced on a 50-cycle single end run on a HiSeq 2500 (with V4 reagents) or 4000 (Illumina) in High Output mode according to the manufacturer’s protocols. For creating MYB knockdown libraries, sequencing libraries were prepped with NEBNext Poly(A) mRNA Magnetic Isolation Module (#E7490L; New England Biolabs) and xGen Broad-range RNA Library Prep (#10010145; IDT) and sequenced on 5% of a NovaSeq S4 2 × 150 with strand-specific settings. For ZMIZ1 knockdown libraries, sequencing libraries were prepped with NEBNext Poly(A) mRNA Magnetic Isolation Module (#E7490L; New England Biolabs) and NEBNext Ultra II Directional RNA (#E7760L; New England Biolabs ) and sequenced on 5% of a NovaSeq S4 2 × 150 with strand-specific settings. RNA accession numbers are GSE225559 and GSE235685.
Projection of patient scRNA and scATAC data onto healthy reference trajectory
Patient-derived cells were projected onto the healthy reference trajectory using the MapQuery function in Seurat v4.0.5 (Hao et al., 2021), which assigns (1) predicted reference UMAP coordinates (2) nearest reference cell type label, and (3) confidence score for the nearest reference cell type labels. In addition to default cell type label transfer, predicted T-cell trajectory pseudotime values and myeloid-trajectory pseudotime values were transferred. To order myeloid development and T-lineage development onto a single trajectory, pseudotime values underwent the same transformations as described for healthy reference data. For scRNA-seq data, the UMAP model was constructed with the top 25 principal components and the min.dist parameter of 0.5 using the uwot 0.1.10 function. Next, patient and healthy control data were co-embedded into a low-dimensional space using the default anchor-based CCA method in Seurat 4.0.5 (30 dimensions, 2,000 anchor features), and cell type label transfer was performed on a sample-by-sample basis using the TransferData function. For scATAC-seq data, the UMAP model was constructed using uwot 0.1.10 with dimensions 2–10 from latent semantic index–based reduction and the min.dist parameter of 0.5. Prior to anchor-based integration and label transfer, peaks from the patient and healthy reference data were merged using the mergePeaks module from scATAC-pro (Yu et al., 2020), and peak-by-cell matrices with merged peaks were reconstructed for each patient with the scATAC-pro reConstMtx module. This allowed for patient and healthy control data to be co-embedded into a low-dimensional space using the default anchor-based CCA method in Seurat 4.0.5 (30 dimensions, 2,000 anchor features) and cell type label transfer to be performed on a sample-by-sample basis using the TransferData function. Boxplots were used to inspect patient-level arrest proportions in key cell states learned from heatmap visualizations. Each dot represents one patient and each panel one cell state. Patients were dichotomized by comparator variable (i.e., ETP status). Statistical comparisons were made using the Wilcoxon rank-sum test unless otherwise specified in the figure legend.
Identification of T-ALL cell line developmental arrest state
To interrogate the developmental arrest state of different T-ALL cell lines, we correlated bulk-RNA-seq data from n = 19 T-ALL cell lines with pseudobulk data obtained from scRNA-seq of healthy human BM and thymus (Xu et al., 2024). T-ALL cell line bulk-RNA-seq were obtained from three datasets (DepMap n = 16; GSE13859, n = 1; GSE59810, n = 1; GSE164928, n = 1). Matrices from each dataset were processed into TPM units and experimentally perturbed (i.e., shRNA or GSI-treated) cell lines were removed, leaving 21 untreated samples. scRNA-seq reference maps of pediatric hematopoiesis were obtained from Xu et al. (2024). Pseudobulk RNA-seq matrices were constructed for 11 T-cell developmental cell states using scRNA-seq data and compared with bulk-RNA-seq data for 19 T-ALL cell lines. Cell states were separated into multipotent progenitor (HSPC/LMPP/CLP/ETP) or T-lineage (pro-T to naïve T). DP thymocytes that are cycling in preparation for recombination are indicated with DP(s) and CCR7+ CCR9− mature αβ thymocytes are indicated with αβ (m). Pseudobulk RNA-seq data was constructed for 11 cell types relevant to T-cell development using the AverageExpression function from Seurat 4.0.5 with the slot argument set to “data” (containing depth/UMI normalized counts). The 11 cell types selected included four cell states prior to T-cell specification (HSPC/LMPP/CLP/ETP) and seven states after T-cell specification (pro-T to naïve-T). Bulk RNA-seq features were intersected with single-cell matrices and Pearson correlation matrixes calculated over 971 lineage-determinant genes (identified within scRNA-seq data) using the cor function (Xu et al., 2024). Correlation values were averaged across replicate samples (CUTLL3, n = 2; CUTLL1, n = 3) prior to plotting. Heatmaps were generated using pheatmap 1.0.12 with row-based Z-score normalization and k = 2 nodes hierarchical clustering.
As an alternative method to interrogate the differentiation stage of T-ALL cell lines, we correlated bulk-RNA-seq data from n = 17 T-ALL cell lines with pseudobulk data obtained from scRNA-seq of healthy human BM (Lasry et al., 2023, GSE185381) and thymus (Park et al., 2020, E-MTAB-8581). T-ALL cell line bulk-RNA-seq were obtained from three datasets (DepMap n = 14; GSE164928 [CUTLL3]; GSE59810 [CUTLL1]; and GSE235685 [LOUCY]). Matrices from each dataset were processed into TPM units. Pseudobulk-RNA-seq matrices were constructed for five BMP stages and 13 thymic T-cell developmental cell states using scRNA-seq data and compared with bulk-RNA-seq data for 17 T-ALL cell lines. Cell states are separated into multipotent progenitor (HSC/MPP/GMP/MEP/LymP) or thymic T-lineage (ETP/DN/DP/abT(entry)/CD8aa/CD4+T/CD4+Tmem/Treg/CD8+T/CD8+Tmem/ILC3/NKT/T(agonist)). Pseudobulk RNA-seq data was constructed for 18 cell types relevant to T-cell development using the AverageExpression function from Seurat 4.3.0 with the slot argument set to data (containing depth/UMI normalized counts). The 18 cell types selected included 6 cell states prior to T-cell specification (HSC/MPP/GMP/MEP/LymP/ETP) and 12 states after T-cell specification (DN to naïve-T). Bulk RNA-seq expression was averaged across replicate samples (CUTLL3, n = 2; CUTLL1, n = 3) prior to the correlation between pseudobulk and bulk RNA-seq data. Pearson correlation matrixes were calculated over 901 lineage-determinant genes (identified within scRNA-seq data, top 100 markers of BM progenitor cells versus mature BM T cells, and top 50 thymic T-lineage marker genes to account for the larger fraction of T cell markers calculated with FindAllMarkers() function) using the cor function. Heatmaps were generated using pheatmap 1.0.12 with row-based Z-score normalization.
BMP-like signature scoring of T-ALL cell lines
To identify T-ALL cell lines carrying the BMP-like phenotype, we performed AUC-based signature scoring on n = 19 T-ALL cell lines with bulk RNA-seq data from three datasets (DepMap n = 16; GSE13859, n = 1; GSE59810, n = 1; GSE164928, n = 1). Bulk RNA-seq from each dataset was processed into TPM units and features were intersected to yield a final matrix containing 17,270 genes. Treated (i.e., shRNA or GSI treated) cell lines were removed, leaving 21 untreated cell lines. Signature scoring of BMP-like marker genes (n = 66 with log2FC ≥0.5, adjusted P value <0.001) and BMP-like DE-TFs (n = 51 with log2FC >0.15, adjusted P value <0.05) was then performed using AUCell v1.12.0. Genes were first ranked within each cell using the AuCell_buildRankings function and signature AUC was calculated using AUCell_calcAUC with default suggested parameters. For building cell rankings, parallelization was utilized (nCores = 12); for calculating AUC, the top 50% of expressed genes were considered. Signature scores were averaged across replicate samples (CUTLL3, n = 2; CUTLL1, n = 3; THP-6, n = 4) prior to plotting.
To identify T-ALL cell lines expressing stem cell transcription factors that were previously experimentally identified as important ETP-ALL genes, we performed AUC-based signature scoring on the above n = 17 T-ALL cell lines with bulk RNA-seq data. Bulk RNA-seq from each dataset was processed into TPM units, replicates were averaged, and features were intersected to yield a final matrix containing 18,059 genes. Common ETP transcription factors (ETP-TF5: MEF2C, LYL1, HHEX, MYCN, and LMO2) were used for signature scoring. Signature scoring was performed using AUCell v1.20.1. Genes were first ranked within each cell using the AuCell_buildRankings function and signature AUC was calculated using AUCell_calcAUC with default suggested parameters.
ETP-TF5, ZMIZ1-5, and ZMIZ1-ETP-8 gene signature analyses using AALL0434 datasets
To quantify the ETP-TF5 signature within bulk and single-cell transcriptomic data, we performed AUC-based signature scoring using AUCell v1.12.0. Genes were ranked within each sample using the AUCell_buildRankings function and AUC was calculated using AUCell_calcAUC with the top 25% of expressed genes considered in scoring (aucMaxRank = 0.25) for bulk RNA-seq data or scRNA-seq respectively. To test if gene signatures could stratify patient overall survival, we first calculated the gene signature score across the bulk RNA-seq diagnostic samples from the COG AALL0434 trial (fully sequenced, n = 1,335) using AUCell (Aibar et al., 2017). Genes were ranked within each sample using the AUCell_buildRankings function on the VST-normalized count matrix followed by the AUCell_calcAUC function with the top 25% of the genes. We then binarized patients based on the signature score and utilized a Cox Proportional Hazard model using the survfit function from the survival R package. The log-likelihood test was computed using day 29 MRD as a covariate and the gene signature score coefficient P value was assessed using day 29 MRD, CNS status, diagnostic age, and WBC as covariates. Survival analyses were performed by subsetting the ETP-ALL patients (n = 110) or ETP-like patients (n = 240). For subtype-specific ZMIZ1 scoring, Z-score–based signature scoring was performed on bulk-sequenced diagnostic AALL0434 T-ALL patients with ZMIZ1 or ETP TF as positive features. A cohort-level z-score was calculated for each feature. To obtain a sample-level Z-score, Z-scores for each feature were averaged. Statistical testing was performed by Wilcoxon test (ETP-like versus other) as well as Kruskal–Wallis test.
MRD analyses
TARGET phase II data was downloaded from https://portal.gdc.cancer.gov/projects/TARGET-ALL-P2, and only patients with “Cell of Origin” = “ETP” or “near ETP” were kept for downstream analysis. To generate gene signatures, we added one to the expression values and used the average of the log2-transformed values as the gene set score. MRD values for all patients were available for day 29. Patients were classified into sub-groups based on residual disease as follows:
Broad: MRD_neg ≤0.01, MRD_pos >0.01. Gene scores distributions were visualized as boxplots and P values were calculated using the Wilcoxon test (two-group comparison).
Additional statistical information
Unless otherwise indicated, P values were derived from two-sided two-sample t tests of log2-transformed data for comparisons in experiments involving two groups and one-way ANOVA of log2-transformed data for pairwise contrasts in experiments with more than two groups. Unless otherwise stated, horizontal lines are means, and values are shown as mean + SD. Survival curves (or time-to-event data) were tested with log-rank tests comparing pairs of groups. GSEA was performed using GSEA v4.1.0 (Broad Institute) and gene lists from MSigDB v7.2.
Online supplemental material
Fig. S1 shows that LOUCY and CUTLL3 cell lines are models of the high-risk BMP-like subtype of ETP-ALLs. Fig. S2 shows that ZMIZ1 promotes murine ETP and immature T-ALL proliferation. Fig. S3 shows that ZMIZ1 and MYB promote the expression of BMP-like oncogenes in normal and malignant ETPs. Fig. S4 shows MYCN promotes ETP population growth while inhibiting Notch-induced T-cell differentiation. Fig. S5 shows that the Zmiz1 target gene Mycn is important for normal ETP generation. Table S1 shows BMP-like signature AUC scores of all cell lines shown in Fig. 1 E. Table S2 shows ETP-TF5 signature AUC scores of all cell lines shown in Fig. S1 J. Table S3 shows P values and log2FC of RNA expression of ZMIZ1-induced driver genes in ETP-ALL patients (N = 25), comparing BMP-like subset from non-responders versus T-specified subset from responders (Xu et al., 2024). Table S4 shows gene set enrichment analysis (Hallmark GSEA v7.2) of ZMIZ1-induced genes in LOUCY cells showing the top 10 lists ranked by P value. Table S5 shows gene set enrichment analysis (C3 GSEA v7.2; transcription factor targets) of ZMIZ1-induced genes in LOUCY cells showing the top 10 lists ranked by P value. Table S6 shows GSEA (C6 GSEA v7.2; oncogenic signatures) of ZMIZ1-induced genes in LOUCY cells showing the top 10 lists ranked by P value. Table S7 shows primers, antibodies, sgRNA sequences, and flow cytometry reagents.
Data availability
The high-throughput sequencing data, results, and statistics have been deposited in the Gene Expression Omnibus (GEO) database with accession numbers GSE225559, GSE235685, and GSE235848. The publicly available NGS datasets used during the present study can be found in GEO, ENCODE, or EGA under accession numbers GSE134761, GSE165209, GSE94000, GSE138660, GSE76783, GSE151075, GSE22601, GSE8879, GSE59810, GSE164928, GSE79422, GSE164929, GSE138659, GSM552233, GSM552234, GSM552237, GSM552238, GSM552239, GSM552241, ENCSR000ESE, and EGAS00001004810.
Acknowledgments
We would like to thank Christelle Carly, Avinash Bhandoola, Amparo Serna Alarcon, and Cher Sha for their experimental advice and technical assistance during this project; the late Rork Kuick for microarray analyses; Joonsoo Kang and Hans-Reimer Rodewald for the Il7rCre mice; Andrew Weng for lentiviral plasmids; Andrew Weng and Moshe Talpaz for PDX samples; Adolfo Ferrando for the CUTLL3 cells; Utpal Davé for the CD2-Lmo2-tg mice; the late Brian Sorrentino for the Il7r-mutant constructs; and Lindsey Montefiore for primary ETP-ALL .bedpe files.
This work was supported by funding from the National Institutes of Health and National Cancer Institute (NIH/NCI R01CA196604, NIH/NCI R01CA27611701, NIH/NIAID R01AI136941, and Gabriella Miller Kids First X01HD100702), Michigan Medicine Rogel Cancer Center, Alex’s Lemonade Stand, Rally Foundation for Childhood Cancer Research, Leukemia and Lymphoma Society, and Hyundai Hope of Wheels. F. Boccalatte was supported by funding from the Associazione Italiana per la Ricerca sul Cancro (Start-Up grant 26533) and a young investigator grant from the Alex’s Lemonade Stand Foundation for childhood cancer. K. Lin was supported by funding from NIH T32GM145470. J. Xu was supported by NIH grant F30-CA-268782. A.F. Melnick was supported by funding from NIH F31CA260929. G. Gambi was supported by the American-Italian Cancer Foundation. I. Aifantis was supported by the Vogelstein family foundation, the St. Baldricks Foundation, and the NIH/NCI (RO1CA228135, PO1CA229086, RO1CA242020, RO1CA252239). I. Aifantis is a consultant for Foresite Labs.
Author contributions: Q. Wang: Conceptualization, Data curation, Formal analysis, Investigation, Methodology, Project administration, Resources, Supervision, Validation, Writing - original draft, Writing - review & editing, F. Boccalatte: Conceptualization, Formal analysis, Investigation, Methodology, Visualization, Writing - original draft, Writing - review & editing, J. Xu: Conceptualization, Data curation, Formal analysis, Investigation, Methodology, Project administration, Resources, Software, Supervision, Validation, Visualization, Writing - original draft, Writing - review & editing, G. Gambi: Investigation, B. Nadorp: Data curation, Formal analysis, Investigation, Visualization, F. Akter: Formal analysis, Investigation, Validation, Visualization, C. Mullin: Investigation, A.F. Melnick: Investigation, E. Choe: Investigation, A.C. McCarter: Formal analysis, Investigation, N.A. Jerome: Formal analysis, Investigation, Validation, Visualization, S. Chen: Investigation, K. Lin: Investigation, S. Khan: Investigation, R. Kodgule: Investigation, J.H. Sussman: Formal analysis, P. Pölönen: Visualization, Writing - review & editing, J. Rodriguez-Hernaez: Formal analysis, Visualization, S. Narang: Formal analysis, Investigation, K. Avrampou: Investigation, B. King: Conceptualization, A. Tsirigos: Resources, Supervision, R.J.H. Ryan: Conceptualization, Resources, Writing - review & editing, C.G. Mullighan: Investigation, Resources, Writing - review & editing, D.T. Teachey: Conceptualization, Formal analysis, Supervision, Writing - review & editing, K. Tan: Funding acquisition, Resources, Supervision, Writing - review & editing, I. Aifantis: Conceptualization, Funding acquisition, Supervision, M.Y. Chiang: Conceptualization, Data curation, Formal analysis, Funding acquisition, Investigation, Methodology, Project administration, Resources, Supervision, Validation, Visualization, Writing - original draft, Writing - review & editing.