Integrating cellular sarcoplasmic reticulum (SR) Ca2+ release with the known Ca2+ activation properties of RyR2s remains challenging. The sharp increase in SR Ca2+ permeability above a threshold SR luminal [Ca2+] is not reflected in RyR2 kinetics from single-channel studies. Additionally, the current paradigm that global Ca2+ release (Ca2+ waves) arises from interacting local events (Ca2+ sparks) faces a key issue that these events rarely activate neighboring sites. We present a multiscale model that reproduces Ca2+ sparks and waves in skinned ventricular myocytes using experimentally validated RyR2 kinetics. The model spans spatial domains from 10−8 to 10−4 m and timescales from 10−6 to 10 s. Ca2+ release sites are distributed in cubic voxels (0.25-µm sides) informed by super-resolution micrographs. We use parallel computing to calculate Ca2+ transport, diffusion, and buffering. Substantial increases in SR Ca2+ release occur, and Ca2+ waves initiate when Ca2+ sparks become prolonged above a threshold SR [Ca2+]. These prolonged events (Ca2+ embers) are much more likely than Ca2+ sparks to activate release from neighboring sites and accumulate increases in cytoplasmic [Ca2+] along with an associated fall in Ca2+ buffering power. This primes the cytoplasm for Ca2+-induced Ca2+ release (CICR) that produces Ca2+ waves. Thus, Ca2+ ember formation and CICR are both essential for initiation and propagation of Ca2+ waves. Cell architecture, along with the differential effects of RyR2 opening and closing rates, collectively determines the SR [Ca2+] threshold for Ca2+ embers, waves, and the phenomenon of store overload–induced Ca2+ release.
Introduction
The internal structure of cardiac muscle cells (cardiomyocytes) is well adapted for transducing surface action potentials to the release of Ca2+ from intracellular stores and consequent myofilament contraction (excitation–contraction coupling). Ventricular myocytes are roughly cylindrical with a diameter of ∼20 μm and a length of 100–150 μm. They are delineated by a sarcolemma that forms deep invaginations into the cell interior called transverse tubules (T-tubules). Electron microscope and super-resolution optical images reveal that these T-tubules weave around the myofilaments to form transverse planar lattice structures every 1.7–1.9 μm along the cell (Bers, 2001). They also show specialized intracellular synapses (dyad junctions) between the T-tubules and the sarcoplasmic reticulum (SR, the intracellular Ca2+ store). The dyad junction is comprised of a 14-nm cytoplasmic cleft between the membranes of the T-tubule and a specialized subcompartment of the SR called the terminal SR (TSR), which is joined via a nexus to a longitudinal SR (LSR) network running along and around the myofilaments (Brochet et al., 2005). The dyad junctions occur along the T-tubule with a mean edge-to-edge spacing of ∼150 nm (Hou et al., 2015).
During excitation–contraction coupling, the action potential opens voltage-dependent, L-type Ca2+ channels in the sarcolemma and T-tubules, which causes Ca2+ to enter the dyad cleft. This releases Ca2+ from the TSR via clusters of Ca2+-activated ryanodine receptor Ca2+ channels (type 2 ryanodine receptors, RyR2s) in the TSR membrane (Bers, 2002). The subsequent release of calcium from the TSR further increases [Ca2+] in the cleft, which strongly reinforces local RyR2 activation, a process called Ca2+-induced Ca2+ release (CICR) (Fabiato, 1983). The combined action of Ca2+ release from many such dyad junctions produces a global increase in cytoplasmic [Ca2+], which is the trigger for myocyte contraction (systole). The resulting depletion of the SR terminates Ca2+ release, and Ca2+ is either sequestered back into the SR by the ATP-powered Ca2+ pumps (SERCA2a) in the LSR membrane or extruded from the cell by the Na/Ca exchanger (NCX) in the sarcolemma, allowing muscle relaxation (diastole) (Bers, 2002). This results in a Ca2+ transient in which cytoplasmic [Ca2+] increases from ∼0.1 to ∼1 μM and where LSR [Ca2+] decreases from ∼1 to 0.3 mM. In ventricular myocytes, the action potential normally drives the cyclic release and uptake of Ca2+ by the SR (Bers, 2002). However, pathological overactivation of Ca2+ release by altered RyR2 function or Ca2+ store overload can lead to propagating waves of SR Ca2+ release (Berlin et al., 1989) that initiate independently of the action potential leading to heart arrhythmias and sudden cardiac death (Belevych et al., 2012; Blayney and Lai, 2009).
Integrating these cellular Ca2+ release phenomena with the well-known Ca2+ activation of the RyR2 that underlies CICR has proved to be an ongoing challenge. CICR provides a strong positive feedback mechanism that, once initiated, should drive near-total Ca2+ depletion of the SR, independently of the sarcolemma membrane potential. To explain the observed graded response of Ca2+ release to sarcolemma membrane potential and the incomplete depletion of the SR, Stern (1992) proposed the “local control” model whereby CICR is moderated by the spatial separation of discrete Ca2+ release sites (see review by Cannell and Kong [2012]). Indeed, such a moderating process was demonstrated by Cheng et al. (1993) who observed discrete Ca2+ release events as Ca2+ sparks by virtue of their appearance as flashes of light (∼2 μm diameter) in the presence of fluorescent Ca2+ indicators. Ca2+ sparks are localized Ca2+ release events that occur at single-dyad junctions and are thought to be the basic quanta of global Ca2+ release phenomena such as Ca2+ waves and transients (Cheng et al., 1996). Their fluorescence time course has an exponential rising phase lasting 10–20 ms, which roughly corresponds to the time that the RyR2s are open and releasing Ca2+ (Kong et al., 2013). When the RyR2s close and Ca2+ release is terminated, the Ca2+ spark fluorescence declines to baseline within 50–100 ms. Although it was quickly understood that RyR2 opening during a Ca2+ spark is strongly reinforced by CICR between individual RyR2s in the dyad, it was not until much later that Ca2+ spark termination could be explained by a computational model incorporating experimentally measured properties of RyR2 gating and dyad architecture (Cannell et al., 2013; Laver et al., 2013). This computational model and a concurrent experimental investigation (Guo et al., 2012) both concluded that Ca2+ release is strongly reinforced by CICR between RyR2s in the dyad and cessation of release is due to decay of the CICR process by Ca2+ depletion of the TSR; a process dubbed as either induction decay (Cannell et al., 2013) or pernicious attrition (Guo et al., 2012).
Ca2+ sparks and waves also occur in chemically skinned cardiomyocytes that lack an effective sarcolemma (Lukyanenko and Gyorke, 1999), thus demonstrating that they emerge from properties of the SR and not the sarcolemma. Although it is assumed that Ca2+ waves are the summation of Ca2+ sparks that are coupled by CICR between neighboring dyads (Cheng et al., 1996), the details of this process remain unclear and the development of a convincing Ca2+ wave model has proved challenging (Izu et al., 2013). For example, RyR2 sensitivity to cytoplasmic Ca2+ (half-activation by 20–50 μM Ca2+ [Gyorke and Gyorke, 1998; Laver and Honen, 2008; Walweel et al., 2014]) is too low to explain Ca2+ wave propagation between dyads when wave amplitudes are typically only a few μM. Models that compensate by increasing RyR2 Ca2+ sensitivity generate unrealistically high spark frequencies and initiation of myriad wavelets rather than a single propagating wave (Izu et al., 2013). Other models solve this problem by incorporating store overload–induced Ca2+ release (SOICR) into their RyR2 gating models; a phenomenon in which SR Ca2+ release drastically increases when the SR [Ca2+] exceeds 0.5 mM (Jiang et al., 2004; Shannon et al., 2000a). These Ca2+ wave models frequently adopt a fourth-power (or more [Restrepo et al., 2008]) dependence for RyR2 sensitivity to SR [Ca2+] (Walker et al., 2017; Walker et al., 2014; Xie et al., 2019), which virtually amounts to a step change in RyR2 activity at a threshold SR [Ca2+]. Thus, RyR2s are made quiescent between waves when the SR load is low and yet very permissive to wave propagation when the SR load is high. The calcium release properties of RyR2s have been intensely studied and are very well characterized and demonstrate that the RyR2 can be activated by Ca2+ in both the SR and the cytoplasm (Laver, 2007; Sitsapesan and Williams, 1994). However, these studies reveal that the RyR2 has a smaller, more graded response to SR [Ca2+] (Gyorke and Gyorke, 1998; Laver and Honen, 2008). Over the SR [Ca2+] range 0.1–1 mM (in the presence of physiological luminal [Mg2+] of 1 mM), the RyR2 open probability increased only threefold (Walweel et al., 2014) and then only when cytoplasmic [Ca2+] was below 1 μM (Laver and Honen, 2008). At higher cytoplasmic concentrations, SR [Ca2+] had no effect on RyR2 activity. Thus, it is still not clear how Ca2+ signaling phenomena such as SOICR and Ca2+ waves arise in cells.
Here, we develop a model that successfully reproduces store load–dependent Ca2+ release and Ca2+ waves that use experimentally verified Ca2+-dependent rates of RyR2 opening and closing. The model is based on our previous induction-decay model of the dyad junction that explained the time course of Ca2+ sparks, Ca2+ blinks, and Ca2+ spark restitution (Cannell et al., 2013; Laver et al., 2013). We use parallel computing to calculate Ca2+ release in regions of the cell containing 103–105 dyad junctions that are distributed in array formations informed by super-resolution micrographs (Hou et al., 2015).
Materials and methods
Numerical methods
Details of the numerical methods are given by Vysma et al. (2023). Briefly, the model cell volume was divided into cubic voxels with sides of 0.25 μm containing either LSR or LSR plus a Ca2+-releasing dyad. Ca2+ diffusion and binding to Ca2+ buffers within and between voxels were calculated by solving Fick’s equation, which required the solution of a system of 62 ordinary differential equations (described in the Supplementary text at the bottom of the PDF.) using Diagonally Iterated fully Implicit Runge–Kutta (DIIRK). DIIRK offered a 10-fold speed improvement and removed out-of-memory exceptions for large models when used as a replacement for MATLAB’s ode15s solver (Vysma et al., 2023). Each voxel was given a parallel thread on either the CPU (two Intel Xeon Gold 5218 processors with a total of 64 hyper-threads) or GPU devices (four Nvidia Quadro RTX 6000 graphics cards). DIIRK uses a variable number of iterations depending on the difficulty of finding a solution. To efficiently use heterogeneous computation hardware (GPUs and CPUs), we developed a predictor function that estimates the number of iterations required for a voxel given the cytoplasmic calcium concentration. This heuristic predictor function was then used to dynamically assign voxels with higher expected computation costs to more powerful computation hardware. Model parameters, constants, and SR morphology were set within MATLAB, which then “just in time” compiles the model into C and OpenCL applications for each simulation. MATLAB collects the completed simulation data into a format suitable for presentation.
Permeabilized cell model
Since Ca2+ sparks and waves are similar in intact cells and chemically skinned cardiomyocytes (Lukyanenko and Gyorke, 1999), it is likely that the sarcolemma does not play a significant role in the initiation and propagation of Ca2+ waves. Therefore, we explored mechanisms of spark and wave generation in the simpler skinned cardiomyocyte model that excludes the sarcolemma. The dyad model is derived from a 3D spatial model that accurately simulated the activation and termination of Ca2+ sparks (Cannell et al., 2013; Laver et al., 2013) where Ca2+ activation arose from CICR between RyR2s within a dyad and termination arose from induction decay; a decay in CICR due to TSR depletion. The simplified dyad compartment model used here aims to capture both CICR and induction-decay mechanisms while being computationally feasible in a model cell containing many thousands of such dyads.
The dyad cleft is modeled by a 14-nm planar gap between the T-tubule and TSR (Fig. 1 A). The TSR is divided into four concentric interconnected pools. The RyR2 sits in a 5 × 5 square cluster with a nearest neighbor separation of 31 nm, which occupies the three inner pools. We expect that diffusion of Ca2+ within the RyR2 cluster is slowed by the tortuosity of diffusion paths around the RyR2 proteins. We calculated the fractional reduction in the diffusion rate (tortuosity factor = 0.5) by simulating diffusion in a 2D space containing a representative RyR2 cluster taken from Asghari et al. (2014) (Fig. S1).

Multiscale model for Ca 2+ sparks and waves in cardiomyocytes. (A) Arrangement of the RyR2 array in three concentric rings in the dyad cleft. (B) Side-on view of the spatial arrangement within a single voxel of the cytoplasm, the dyad cleft, the T-tubule, the TSR, and the RyR2 channels (not to scale). The Ca2+ diffusion/transport pathways between the compartments are indicated by blue arrows. (C) Arrangement of voxels that contain dyads and RyR2, associated with two representative planes of T-tubules. (D) Same arrangement shown within the model cell volume. The grids of T-tubules continue along the entire cell at 1.75-μm intervals.
Multiscale model for Ca 2+ sparks and waves in cardiomyocytes. (A) Arrangement of the RyR2 array in three concentric rings in the dyad cleft. (B) Side-on view of the spatial arrangement within a single voxel of the cytoplasm, the dyad cleft, the T-tubule, the TSR, and the RyR2 channels (not to scale). The Ca2+ diffusion/transport pathways between the compartments are indicated by blue arrows. (C) Arrangement of voxels that contain dyads and RyR2, associated with two representative planes of T-tubules. (D) Same arrangement shown within the model cell volume. The grids of T-tubules continue along the entire cell at 1.75-μm intervals.

Arrangement of individual RyRs in a dyad. (A) Arrangement derived from a dyad in a rat cardiomyocyte obtained by electron tomography as shown in Fig. 1 D of Asghari et al. (2014). (B) Derived mask used to numerically calculate diffusion of Ca2+ in the purple areas. The rates of diffusion in either the vertical or horizontal directions were both reduced by a factor of 2 compared with diffusion when the yellow areas were absent.
Arrangement of individual RyRs in a dyad. (A) Arrangement derived from a dyad in a rat cardiomyocyte obtained by electron tomography as shown in Fig. 1 D of Asghari et al. (2014). (B) Derived mask used to numerically calculate diffusion of Ca2+ in the purple areas. The rates of diffusion in either the vertical or horizontal directions were both reduced by a factor of 2 compared with diffusion when the yellow areas were absent.
The total Ca2+ flux through a RyR2 cluster is proportional to their unitary Ca2+ current, open probability, and their number in the cluster. The unitary current for a range of LSR [Ca2+] under physiological ionic conditions was measured by single-channel recording and is shown in Fig. S2. The RyR2 open probability in the dyad is calculated using a hybrid stochastic–deterministic method using experimentally determined Ca2+ dependencies of RyR2 opening and closing rates from sheep, human, and rat (Fig. S3 and Table S3). Ca2+ release is initiated by a RyR2 opening, modeled as a discrete-time stochastic process generated by the Monte Carlo technique at 20-μs intervals. Although any RyR2 in the cluster may open first, the initial current was assigned to the central, smallest pool, containing only 1 RyR, for CICR to rapidly (∼1 ms) activate the remaining RyR2s that are modeled using a deterministic process requiring the solution of differential equations.

Dependence of RyR2 unitary current on luminal [Ca 2+ ]. (A) Single RyR2 recordings at 0-mV bilayer potential in the presence of a cytoplasmic solution containing 1 mM Mg2+, 0.1 mM Ca2+, and 5 mM caffeine and a luminal solution containing 1 mM Mg2+ and the indicated [Ca2+]. Channel openings are shown as downward transitions from the baseline (dashed line). (B) Mean unitary current amplitude (n = 3) fitted with a Michaelis–Menten curve.
Dependence of RyR2 unitary current on luminal [Ca 2+ ]. (A) Single RyR2 recordings at 0-mV bilayer potential in the presence of a cytoplasmic solution containing 1 mM Mg2+, 0.1 mM Ca2+, and 5 mM caffeine and a luminal solution containing 1 mM Mg2+ and the indicated [Ca2+]. Channel openings are shown as downward transitions from the baseline (dashed line). (B) Mean unitary current amplitude (n = 3) fitted with a Michaelis–Menten curve.

Kinetics of RyR2 gating from single channel recording. (A–D) Cytoplasmic (A and B) and TSR (C and D) [Ca2+] dependencies of RyR2 opening (A and C) and closing rates (B and D) determined from single-channel recordings of bilayer experiments on RyR2 from sheep, human, and rat (mean and SEM). Sheep and rat data are taken from Cannell et al. (2013). (A and B) Cytoplasmic solution contained CsMS (130 mM for sheep and rat or 230 mM for human), 20 mM CsCl (150 mM Cs+), 2 mM ATP, 1 mM Mg2+, and the indicated [Ca2+], and the TSR solution contained CsMS (130 mM for sheep and rat or 230 mM for human), 20 mM CsCl, and 1 mM Mg2+. TSR [Ca2+] was either 1 mM (filled circles) or 0.1 mM (open circles). (C and D) Cytoplasmic solution contained CsMS (130 mM for sheep and rat or 230 mM for human), 20 mM, 2 mM ATP, 0 mM Mg2+, and 100 nM [Ca2+], and the TSR solution contained CsMS (130 mM for sheep and rat or 230 mM for human), 20 mM CsCl, 1 mM Mg2+, and the indicated Ca2+. The solid lines in A and B show the least squares fits of Eqs. 13 and 14 used in the simulations to the data. Their extrapolation down to 0.1 μM is modeled on data from Laver and Honen (2008) (see the text associated with Eq. 15). The dashed line shows values expected for TSR [Ca2+] = 0.1 mM derived from Laver and Honen (2008). In B, model values for 0.1 and 1 mM TSR [Ca2+] are indistinguishable.
Kinetics of RyR2 gating from single channel recording. (A–D) Cytoplasmic (A and B) and TSR (C and D) [Ca2+] dependencies of RyR2 opening (A and C) and closing rates (B and D) determined from single-channel recordings of bilayer experiments on RyR2 from sheep, human, and rat (mean and SEM). Sheep and rat data are taken from Cannell et al. (2013). (A and B) Cytoplasmic solution contained CsMS (130 mM for sheep and rat or 230 mM for human), 20 mM CsCl (150 mM Cs+), 2 mM ATP, 1 mM Mg2+, and the indicated [Ca2+], and the TSR solution contained CsMS (130 mM for sheep and rat or 230 mM for human), 20 mM CsCl, and 1 mM Mg2+. TSR [Ca2+] was either 1 mM (filled circles) or 0.1 mM (open circles). (C and D) Cytoplasmic solution contained CsMS (130 mM for sheep and rat or 230 mM for human), 20 mM, 2 mM ATP, 0 mM Mg2+, and 100 nM [Ca2+], and the TSR solution contained CsMS (130 mM for sheep and rat or 230 mM for human), 20 mM CsCl, 1 mM Mg2+, and the indicated Ca2+. The solid lines in A and B show the least squares fits of Eqs. 13 and 14 used in the simulations to the data. Their extrapolation down to 0.1 μM is modeled on data from Laver and Honen (2008) (see the text associated with Eq. 15). The dashed line shows values expected for TSR [Ca2+] = 0.1 mM derived from Laver and Honen (2008). In B, model values for 0.1 and 1 mM TSR [Ca2+] are indistinguishable.
The TSR portion of the dyad is connected via a nexus to the LSR (Fig. 1 B). Depletion of TSR and spark termination occurs when TSR refill via the nexus is slower than Ca2+ release through the RyR2 cluster. Also, the nexus controls the rate of TSR refill following a Ca2+ spark and hence the rate of spark restitution. In the absence of any details of nexus geometry, we estimated the nexus diffusion using an approach we adopted previously (Laver et al., 2013). The nexus Ca2+ diffusion constant was set as a fraction of the diffusion between voxels (LSR–TSR nexus factor, Nf), which was adjusted so that the rate of restitution of the spark amplitude following a spark at the same release site (see Fig. S4 B) was comparable to published values (Zima et al., 2008b).

Comparison of stochastic and hybrid models of Ca 2+ release. (A) The time course of [Ca2+] in the dyad cleft and TSR from Ca2+ spark simulations. The fully stochastic model for Ca2+ sparks used by Cannell et al. (2013); Laver et al. (2013) is compared with the hybrid model used here for clusters of 25 RyR2s. (B) Stochastic and hybrid simulations of dyad [Ca2+] for RyR2 cluster sizes of 9 and 36. (C) Time course of fluorescence during a Ca2+ spark using our hybrid model (black line). Colored lines show the time course of a second Ca2+ spark triggered at various delays after the first spark at the same site.
Comparison of stochastic and hybrid models of Ca 2+ release. (A) The time course of [Ca2+] in the dyad cleft and TSR from Ca2+ spark simulations. The fully stochastic model for Ca2+ sparks used by Cannell et al. (2013); Laver et al. (2013) is compared with the hybrid model used here for clusters of 25 RyR2s. (B) Stochastic and hybrid simulations of dyad [Ca2+] for RyR2 cluster sizes of 9 and 36. (C) Time course of fluorescence during a Ca2+ spark using our hybrid model (black line). Colored lines show the time course of a second Ca2+ spark triggered at various delays after the first spark at the same site.
The LSR is distributed uniformly throughout the cell, occupying 3.5% of the cytoplasmic volume (Bers, 2001) such that Ca2+ can diffuse between the LSR in neighboring voxels. The diffusion coefficient for Ca2+ in the LSR was chosen to match the fluorescence recovery after localized Ca2+ depletion of the LSR measured by Wu and Bers (2006) (Fig. S5). The model includes the Ca2+ transport properties of SERCA2a taken from Shannon et al. (2000b).

Simulation of experiments by Wu and Bers (2006) that measured the time course of Ca2+in the LSR after its partial depletion at the left end of the cell. (A) Time course of LSR [Ca2+] profile as Ca2+ diffuses with a diffusion coefficient of 0.6 × 10⁻¹⁰ m2/s. (B) LSR [Ca2+] time course at two ends of the model cell compared with an exponential fit to the experimental data (decay time constant = 27 s, dashed line).
Simulation of experiments by Wu and Bers (2006) that measured the time course of Ca2+in the LSR after its partial depletion at the left end of the cell. (A) Time course of LSR [Ca2+] profile as Ca2+ diffuses with a diffusion coefficient of 0.6 × 10⁻¹⁰ m2/s. (B) LSR [Ca2+] time course at two ends of the model cell compared with an exponential fit to the experimental data (decay time constant = 27 s, dashed line).
The cellular distribution of the Ca2+ release sites in the model is based on super-resolution micrographs of cardiac cells (see Fig. 1 of Hou et al. [2015]). Ca2+ release sites are distributed in a 1-μm planar grid at each Z-line, and Z-lines are spaced at 1.75-μm intervals along the entire cell (Fig. 1, C and D). RyR2 clusters contained a mean of 25 RyR2s, and the resulting RyR2 cluster density in the model is 4 μm−3, equating to 100 RyR2 μm−3 (estimates in the literature range from 18 to 130 μm−3 [Hayashi et al., 2009; Hou et al., 2015]). We considered two alternatives for dyad sizes in the model: (1) all dyads were of equal size and contained 25 RyR2s, and (2) dyads of equal size were randomly allocated a variable RyR2 cluster size ranging between 10 and 120, exponentially distributed with a mean of 25.
Artificial intelligence
ChatGPT assisted in condensing the abstract.
Online supplemental material
Supplemental figures describe the experimental data underlying key model parameters (Figs. S1, S2, S3, and S5), model simulations of [Ca2+] in the dyad cleft, TSR and LSR during Ca2+ sparks and embers (Figs. S4 and S6), spatial and temporal distributions of Ca2+ sparks and embers during a Ca2+ wave (Fig. S7), z-t scans showing the effect of Ca2+ embers on wave initiation and propagation (Fig. S8), the effect of cytoplasmic Ca2+ buffering on Ca2+ waves (Fig. S9), parameter sensitivity analysis of the model (Fig. S10), and the effect of RyR2 gating kinetics on Ca2+ waves (Figs. S11 and S12). Table S1 shows diffusion and buffering coefficients. Table S2 shows structural parameters. Table S3 shows RyR2 Ca2+ activation parameters. Table S4 shows miscellaneous model parameters. Supplemental text at the end of the PDF provides further information on the experimental methods and their analysis.
Results
Ca2+ sparks
The hybrid stochastic–deterministic method for calculating RyR2 activity during a single Ca2+ spark described here captures the main features of dyad [Ca2+] transients seen with the more computationally intensive, fully stochastic method used previously (Cannell et al., 2013; Laver et al., 2013). This, together with the DIIRK ODE solver and parallel computing approach, could carry out a single-spark simulation comparable to our previous studies with a 100-fold speed improvement. The hybrid method produces a slightly faster rise and decay in dyad [Ca2+] and a deeper faster depletion of the TSR (Fig. S4 A). With both methods, the initial rise in dyad [Ca2+] results from a regenerative phase of CICR between neighboring volume elements in the dyad that persists for 5 ms. TSR [Ca2+] declines to ∼10% of resting levels within 10 ms, which reduces the Ca2+ flux through RyR2s and hence dyad [Ca2+] to a point where RyR2s start to close, further reducing the Ca2+ flux in an induction-decay cycle that continues until Ca2+ release ceases all together after 30 ms. The TSR then slowly refills with Ca2+ that diffuses from the LSR via the nexus leading to Ca2+ spark restitution over the next few hundred ms (Fig. S4 B).
Ca2+ sparks generated by various RyR2 cluster sizes had similar morphology, but, as expected, occurred with frequencies in proportion to cluster number (Fig. 2 A). A representative simulated line-scan image of a Ca2+ spark cell is shown in Fig. 2 B for [Ca2+]. Morphology distributions and frequencies were gathered from those with dF/Fo amplitudes above 0.5. The amplitude of fluorescent transient signals varied from near zero up to dF/Fo ∼1.2. Smaller amplitude signals originated from Ca2+ sparks away from the scan line. Ca2+ spark frequency increased from 10 to 40 s−1(100 μm)−1 as LSR [Ca2+] increased from 0.4 to 0.75 mM (Fig. 2 C) primarily because of the luminal Ca2+ dependence of the RyR2 opening rate. Although reported Ca2+ spark frequencies vary considerably between studies, the relative dependence on LSR [Ca2+] is qualitatively like that seen by Zima et al. (2010). Histograms of Ca2+ spark amplitude, time-to-peak, width, and duration (LSR [Ca2+] = 0.6 mM, Fig. 2, D–G) when compared to experimental distributions (Picht et al., 2007) reveal similar spark amplitudes and durations but ∼2-fold faster time-to-peak and ∼1.5-fold lower width.

Spatial–temporal properties of Ca 2+ spark fluorescence (dF/Fo). The model cell dimensions were 5 × 5 × 100 μm. Solutions contained 30 μM Fluo-4, bath[Ca2+] = 100 nM, and LSR [Ca2+] = 0.6 mM, including the effects of blurring by a microscope with a point spread of 0.25 μm in x and z and 1 μm in y. (A) Individual sparks generated from dyads containing RyR2 clusters of either 11, 25, or 60 RyR2 listed along with frequency/dyad (Freq), amplitude (Amp), time from 10% to peak amplitude (TTP), full width at half maximum (FWHM), and full duration and half maximum (FDHM). (B) Simulated confocal z-t line scan of Ca2+ sparks where dyads contain an exponential distribution of RyR2 cluster sizes. Green circles indicate sparks detected with dF/Fo > 0.5. (C) Frequency of Ca2+ sparks detected and its dependence on [Ca2+] in the LSR. (D–G) Distribution of Ca2+ spark properties accumulated from 4 × 1-s simulated line scans.
Spatial–temporal properties of Ca 2+ spark fluorescence (dF/Fo). The model cell dimensions were 5 × 5 × 100 μm. Solutions contained 30 μM Fluo-4, bath[Ca2+] = 100 nM, and LSR [Ca2+] = 0.6 mM, including the effects of blurring by a microscope with a point spread of 0.25 μm in x and z and 1 μm in y. (A) Individual sparks generated from dyads containing RyR2 clusters of either 11, 25, or 60 RyR2 listed along with frequency/dyad (Freq), amplitude (Amp), time from 10% to peak amplitude (TTP), full width at half maximum (FWHM), and full duration and half maximum (FDHM). (B) Simulated confocal z-t line scan of Ca2+ sparks where dyads contain an exponential distribution of RyR2 cluster sizes. Green circles indicate sparks detected with dF/Fo > 0.5. (C) Frequency of Ca2+ sparks detected and its dependence on [Ca2+] in the LSR. (D–G) Distribution of Ca2+ spark properties accumulated from 4 × 1-s simulated line scans.
Ca2+ embers
We investigated the effect of increasing LSR [Ca2+] on Ca2+ release during a single Ca2+ spark and found that there was a threshold LSR [Ca2+] of ∼0.95 mM at which induction decay became substantially delayed, leading to an extended Ca2+ release (Fig. 3 A and Fig. S6); a phenomenon dubbed Ca2+ embers (Zhou et al., 2003). Above this threshold, Ca2+ diffusion from the LSR to TSR was able to keep up with Ca2+ release through RyR2 and the TSR failed to deplete sufficiently to initiate the induction-decay cycle. Ca2+ release continued until LSR [Ca2+] decreased to ∼0.7 mM after 1 s. The threshold LSR [Ca2+] for Ca2+ embers decreased as the external [Ca2+] increased (Fig. 3 B), indicating that higher cytoplasmic [Ca2+] promoted Ca2+ embers.

Effect of LSR [Ca 2+ ] on Ca 2+ release from a cluster of 25 RyRs in a dyad cleft. (A) Time course of [Ca2+] in the dyad (third concentric ring) at various LSR [Ca2+] showing termination of Ca2+ release within 40 ms for LSR [Ca2+] up to 0.9 mM and continuous Ca2+ release at higher LSR [Ca2+]. (B) Dependence of the threshold LSR [Ca2+] for onset of continuous Ca2+ release on the bath (cytoplasmic) [Ca2+]. (C) Cytoplasmic [Ca2+] at dyad #3 due to embers occurring at dyads #1 and #2. The labels indicate their initial transients. (D) Cumulative probability of an ember triggering Ca2+ release at a nearest neighbor dyad (0.25 μm away).
Effect of LSR [Ca 2+ ] on Ca 2+ release from a cluster of 25 RyRs in a dyad cleft. (A) Time course of [Ca2+] in the dyad (third concentric ring) at various LSR [Ca2+] showing termination of Ca2+ release within 40 ms for LSR [Ca2+] up to 0.9 mM and continuous Ca2+ release at higher LSR [Ca2+]. (B) Dependence of the threshold LSR [Ca2+] for onset of continuous Ca2+ release on the bath (cytoplasmic) [Ca2+]. (C) Cytoplasmic [Ca2+] at dyad #3 due to embers occurring at dyads #1 and #2. The labels indicate their initial transients. (D) Cumulative probability of an ember triggering Ca2+ release at a nearest neighbor dyad (0.25 μm away).

[Ca 2+ ] time courses in various model compartments over a range of initial LSR [Ca 2+ ] as indicated in the legend. (A–E) Third dyad ring (i.e., the outer ring of a 25-member RyR2 cluster), (B) the TSR, (C) the cytoplasm, (D) the LSR, and (E) the Ca2+ flux through all RyR2s. (F) Total number of embers at z = 21 μm in the lead-up to the waves simulated in Fig. 6 A (red) and Fig. 6 B (blue).
[Ca 2+ ] time courses in various model compartments over a range of initial LSR [Ca 2+ ] as indicated in the legend. (A–E) Third dyad ring (i.e., the outer ring of a 25-member RyR2 cluster), (B) the TSR, (C) the cytoplasm, (D) the LSR, and (E) the Ca2+ flux through all RyR2s. (F) Total number of embers at z = 21 μm in the lead-up to the waves simulated in Fig. 6 A (red) and Fig. 6 B (blue).
The Ca2+ flux during individual sparks and embers exhibited a similar initial transient lasting ∼20 ms, but only embers had an extended plateau with ∼5% of the amplitude of the initial transient (Fig. S6 E, solid line). The cytoplasmic [Ca2+] increase that occurred at the nearest neighboring dyad reached 2 μM during the transient and 100 nM during the plateau (Fig. 3 C, peak 2). During the triggering of two adjacent dyads, the extended plateau fluxes had a summative effect on the cytoplasmic [Ca2+] increase (Fig. 3 C, peak 1) that was unlikely to occur with brief transients. We calculated the cumulative probability that an ember would trigger Ca2+ release from a neighboring 25 RyR2 cluster (Fig. 3 D). During the flux transient (common to both embers and sparks), this probability rose to 0.13 in the first 20 ms, and during the plateau flux, it increased substantially more over the next few hundred milliseconds.
SOICR and Ca2+ waves
To investigate how Ca2+ release at individual dyads might contribute to global Ca2+ release, we considered a permeabilized cell volume, 16 × 16 × 55 μm, like that shown in Fig. 1 D. The computation speed was substantially increased by relying on fourfold symmetry and doing calculations in only one cell quadrant with reflecting intracellular boundaries (i.e., no diffusion; see Fig. 4 A) plus a reflecting boundary at one end. Unless otherwise stated, we doubled the Kmax of SERCA2a to 0.4 mMs−1 from the commonly used value (see Shannon et al. [2000b]) to reduce wave periods and hence simulation durations. The model parameters are given in Tables S1, S2, S3, and S4. The computed fluorescence ( [CaFluo-4], in the x–z plane) from spontaneous Ca2+ waves (propagating from right to left) from sheep/human RyR2 is shown in Fig. 4 B for the case of exponentially distributed RyR2 cluster sizes. Waves are shown at various time points, starting 200 ms before wave initiation. Ca2+ sparks are seen as cyan circular patches that appear mainly before the wave front.

Simulation of Ca 2+ release during Ca 2+ waves where dyads had exponentially distributed RyR2 cluster size. (A) Schematic of the model cell (dotted prism). The simulation was carried out in one quadrant of the cell (solid prism) where the intracellular boundaries were reflecting (i.e., no diffusion), as well as the end boundary marked by the black dot. The solid prism comprised a 33 × 33 × 222 array of voxels (cubes with sides of 0.25 μm). (B) Fluorescence is shown in the x–z plane (8 × 55 μm lying 1 μm above the cell midplane) at 100-ms intervals starting from 3 s after the start of the simulation. The Ca2+ wave is represented by the red area moving from right to left. The cyan circular patches represent Ca2+ sparks. The black dot in the plot at 3.6 s is a reference point to illustrate the orientation of the simulation output in A. The horizontal dashed lines show the position of the line scans that are commonly used experimentally and in Fig. 6 to chart the time course of Ca2+ release.
Simulation of Ca 2+ release during Ca 2+ waves where dyads had exponentially distributed RyR2 cluster size. (A) Schematic of the model cell (dotted prism). The simulation was carried out in one quadrant of the cell (solid prism) where the intracellular boundaries were reflecting (i.e., no diffusion), as well as the end boundary marked by the black dot. The solid prism comprised a 33 × 33 × 222 array of voxels (cubes with sides of 0.25 μm). (B) Fluorescence is shown in the x–z plane (8 × 55 μm lying 1 μm above the cell midplane) at 100-ms intervals starting from 3 s after the start of the simulation. The Ca2+ wave is represented by the red area moving from right to left. The cyan circular patches represent Ca2+ sparks. The black dot in the plot at 3.6 s is a reference point to illustrate the orientation of the simulation output in A. The horizontal dashed lines show the position of the line scans that are commonly used experimentally and in Fig. 6 to chart the time course of Ca2+ release.
Fig. 5, A and B, shows the [Ca2+] in the cytoplasm and LSR during waves generated from sheep/human in dyads with uniform RyR2 cluster sizes (black and red lines) or exponentially distributed cluster sizes (green lines) and that the waves were about the same. In the case of uniform clusters, [Ca2+] profiles are shown near the cell axis (black lines) and cell boundary (red lines). During the Ca2+ wave peak, Ca2+ diffuses out of the cell along its concentration gradient between the cell interior (8 μM) and the external bath (300 nM, Fig. 5 A, dashed line) so that at 1 μm from the cell boundary the wave peak is 3 μM. During the wave trough, Ca2+ diffuses into the cell along its concentration gradient between the external bath and the cell interior (50 nM) so that near the cell boundary the trough is 150 nM. Although the LSR is not directly connected with the external bath, it supports a transverse [Ca2+] gradient due to differences in SERCA2a-driven Ca2+ uptake (Fig. 5 B). During the trough, Ca2+ uptake into the LSR is larger, and Ca2+ loading is faster, near the cell surface because the SERCA2a substrate concentration there is higher. Ca2+ loading continued until LSR [Ca2+] reached ∼1 mM at which point the Ca2+ wave initiated and unloaded the LSR. Ca2+ waves appeared to initiate near the cell surface (see Fig. 4 B at 3.1 s) because Ca2+ loading of the LSR there is faster.

Ca2+ time courses during a Ca2+ wave. (A–D) Time course of Ca2+ in the cytoplasm and LSR in model cells with RyR2 from sheep/human (A and B) and rat (C and D). (A and B) Ca2+ waves near the longitudinal axis (x = 1 μm and y = 1 μm, z = 25 μm [near the midpoint of the longitudinal axis]) for simulations with uniform RyR2 cluster sizes (black) and exponentially distributed cluster sizes (green). Ca2+ waves near the cell exterior (x = 7 μm and y = 1 μm, z = 25 μm) from uniform clusters (red). External [Ca2+] = 0.3 μM as indicated by the dashed line in A. (C and D) Ca2+ waves in rat using uniform clusters near the longitudinal axis (black) and cell exterior (red).
Ca2+ time courses during a Ca2+ wave. (A–D) Time course of Ca2+ in the cytoplasm and LSR in model cells with RyR2 from sheep/human (A and B) and rat (C and D). (A and B) Ca2+ waves near the longitudinal axis (x = 1 μm and y = 1 μm, z = 25 μm [near the midpoint of the longitudinal axis]) for simulations with uniform RyR2 cluster sizes (black) and exponentially distributed cluster sizes (green). Ca2+ waves near the cell exterior (x = 7 μm and y = 1 μm, z = 25 μm) from uniform clusters (red). External [Ca2+] = 0.3 μM as indicated by the dashed line in A. (C and D) Ca2+ waves in rat using uniform clusters near the longitudinal axis (black) and cell exterior (red).
Ca2+ transients from waves generated by rat RyR2s are shown in Fig. 5, C and D. Rat RyR2s showed a threefold lower sensitivity to cytoplasmic Ca2+ compared with those from sheep/human (Fig. S3). These waves could only be sustained with reduced Ca2+ buffering (i.e., 30 μM Fluo-4 compared with 100 μM for sheep/human). Ca2+ waves in rat had higher LSR [Ca2+] threshold, larger cytoplasmic [Ca2+] amplitude, and longer periods than those in sheep/human. Waves had propagation velocities of 60 μm/s (sheep/human) and 100 μm/s (rat).
Fig. 6, A and B, compares the z-t line scans of Ca2+ waves generated from uniform RyR2 clusters (A) and exponentially distributed RyR2 cluster sizes (B). Embers were very dim in these z-t line scans due to the large dynamic range of brightness required to present the Ca2+ waves. The display of embers was enhanced in Fig. 6 C by plotting the logarithm of relative fluorescence, revealing that Ca2+ waves were preceded by Ca2+ embers that occurred both near and far from the wave origin (e.g., see arrows in Fig. 6 C). Waves generated by exponentially distributed cluster sizes were like uniform clusters except the former showed a twofold higher occurrence of embers ahead of the wave (Fig. S6 F). Variations in RyR2 cluster size led to a distribution in the threshold LSR [Ca2+] for triggering embers whereby outliers with low thresholds produced more embers further ahead of the wave.

Z -t line-scan images of Ca 2+ release from two alternative dyad structural distributions. (A and B) Uniform RyR2 cluster sizes (A) and exponentially distributed RyR2 cluster sizes (B). (C) Simulation in B shown again on a log scale to more clearly show embers that occur both near and far from the wave origin. Representative Ca2+ embers are identified by arrows.
Z -t line-scan images of Ca 2+ release from two alternative dyad structural distributions. (A and B) Uniform RyR2 cluster sizes (A) and exponentially distributed RyR2 cluster sizes (B). (C) Simulation in B shown again on a log scale to more clearly show embers that occur both near and far from the wave origin. Representative Ca2+ embers are identified by arrows.
Ca2+ wave initiation propagation and termination
We investigated the roles of Ca2+ sparks and embers in the initiation and propagation of a Ca2+ wave (the one simulated in Fig. 6 A) by plotting their locations at 100-ms intervals during the Ca2+ wave (Fig. S7, representative times shown in Fig. 7). Embers (red dots) were defined as Ca2+ release events that failed to terminate within 50 ms as opposed to Ca2+ sparks (blue dots). During the Ca2+ wave trough (Fig. 7, 2.4 s), Ca2+ sparks were uniformly distributed throughout the cell, whereas Ca2+ embers tended to locate the region of highest LSR [Ca2+] near the cell surface (x = y = 8 μm), especially along the corners (see Fig. S7 for LSR [Ca2+] distributions). At 2.7 s, embers become more numerous than sparks at z > 50 μm mainly due to increased LSR [Ca2+], while cytoplasmic [Ca2+] remains near baseline levels. At 3.0 s, cytoplasmic [Ca2+] at z = 53 μm increases above 1 μM, which should also decrease the LSR [Ca2+] threshold for embers by ∼10% (Fig. 3 B), providing an additional positive reinforcement for ember generation despite the falling LSR [Ca2+]. From 3.0 to 3.4 s, the cytoplasmic [Ca2+] distribution morphs into a 5-μM peak at the cell interior at z = 47 μm and depletion of the LSR returns the predominance of sparks over embers at higher z. From 3.4 s onward, CICR produces a propagating wave in cytoplasmic [Ca2+] where the Ca2+ embers are strongly stimulated at the wave peak and behind the wave front, and absent afterward (3.8 s).

[Ca 2+ ] profiles in the cytoplasm (left panels) and LSR (right panels) compared with locations of sparks and embers (middle panels). The cell long axis of symmetry (i.e., the cell center) is at x = y = 0. The z-t fluorescent line scan for this Ca2+ wave is shown in Fig. 6 A using the same time reference. Blue dots indicate locations of sparks, and red dots indicate embers (Ca2+ release events with duration >50 ms). The upper panels show the x-y plane indicated by the dotted line in the lower panels, and the lower-left panels show the x–z plane indicated by that in the upper-left panels. Release events along the z axis are shown throughout the entire cell volume and are viewed 1° rotated from the y-direction to avoid obscuring release sites.
[Ca 2+ ] profiles in the cytoplasm (left panels) and LSR (right panels) compared with locations of sparks and embers (middle panels). The cell long axis of symmetry (i.e., the cell center) is at x = y = 0. The z-t fluorescent line scan for this Ca2+ wave is shown in Fig. 6 A using the same time reference. Blue dots indicate locations of sparks, and red dots indicate embers (Ca2+ release events with duration >50 ms). The upper panels show the x-y plane indicated by the dotted line in the lower panels, and the lower-left panels show the x–z plane indicated by that in the upper-left panels. Release events along the z axis are shown throughout the entire cell volume and are viewed 1° rotated from the y-direction to avoid obscuring release sites.

Representative time sequence of [Ca 2+ ] profiles in the cytoplasm (left panels) compared with locations of sparks and embers (right panels). The cell long axis of symmetry (i.e., the cell center) is at x = y = 0. A complete set of images at 100-ms intervals is given in Fig. S7. The z-t fluorescent line scan for this Ca2+ wave is shown in Fig. 6 A using the same time reference. Blue dots indicate locations of sparks, and red dots indicate embers (Ca2+ release events with duration >50 ms). The upper-left panels show the x-y plane indicated by the dotted line in the lower-left panels, and the lower-left panels show the x–z plane indicated by that in the upper-left panels. Release events along the z axis are shown throughout the entire cell volume viewed 1° rotated from the y-direction to avoid obscuring release sites.
Representative time sequence of [Ca 2+ ] profiles in the cytoplasm (left panels) compared with locations of sparks and embers (right panels). The cell long axis of symmetry (i.e., the cell center) is at x = y = 0. A complete set of images at 100-ms intervals is given in Fig. S7. The z-t fluorescent line scan for this Ca2+ wave is shown in Fig. 6 A using the same time reference. Blue dots indicate locations of sparks, and red dots indicate embers (Ca2+ release events with duration >50 ms). The upper-left panels show the x-y plane indicated by the dotted line in the lower-left panels, and the lower-left panels show the x–z plane indicated by that in the upper-left panels. Release events along the z axis are shown throughout the entire cell volume viewed 1° rotated from the y-direction to avoid obscuring release sites.
We investigated the role of Ca2+ sparks and embers in wave initiation and propagation by calculating the Ca2+ fluxes from all the dyads in two x-y planes, one near the point of wave initiation at z = 46 μm (Fig. 8, A and C) and the other that experiences the propagating wave at z = 21 μm (Fig. 8 B). The total Ca2+ flux time courses in each x-y plane due to transient (from both sparks and embers) and plateau phases (embers only) are plotted separately in Fig. 8. Sparks occurred throughout the displayed interval (2–4 s) with a surge in spark frequency during the wave, whereas embers only started to occur at 2.7 s when LSR [Ca2+] reached 0.9 mM and ceased once LSR [Ca2+] had declined to 0.3 mM. Just before the wave begins (3.0–3.4 s, Fig. 8 A), the total flux from transients was about twice as high as the steady plateau flux. When the wave occurs (3.4–3.6 s), the transient flux increased to roughly 10 times higher than the plateau flux. During the wave, the plateau flux itself was about 50% higher compared with the period before the wave. Further from the wave’s point of origin (Fig. 8 B), the ratio of transient to plateau flux was like that near the origin. However, in this region, the plateau flux during the wave was four times greater than it was before the wave.

Ca2+ fluxes and concentrations during a Ca2+ wave. (A–C) Ca2+ release in the x-y planes at z= 46 μm (A and C) near where the Ca2+ wave initiates and z= 21 μm (B) near the z midpoint. Ca2+ release was simulated under the same conditions as used in Fig. 6 A. Upper panels show the time course of cytoplasmic [Ca2+] averaged over the x-y plane. Lower panels show the corresponding mean LSR [Ca2+] (green) and the total Ca2+ fluxes through all 371 dyads in the x-y plane originating from the initial flux transients from sparks and embers (red) or the subsequent flux plateaus from embers (blue). (C) Identical to A except that after the 3-s time point, the plateau phase of embers is suppressed (i.e., they become sparks) by a threefold decrease in diffusion across the LSR/TSR nexus. The horizontal bars in A and B indicate the period where the cytoplasm is being primed for CICR.
Ca2+ fluxes and concentrations during a Ca2+ wave. (A–C) Ca2+ release in the x-y planes at z= 46 μm (A and C) near where the Ca2+ wave initiates and z= 21 μm (B) near the z midpoint. Ca2+ release was simulated under the same conditions as used in Fig. 6 A. Upper panels show the time course of cytoplasmic [Ca2+] averaged over the x-y plane. Lower panels show the corresponding mean LSR [Ca2+] (green) and the total Ca2+ fluxes through all 371 dyads in the x-y plane originating from the initial flux transients from sparks and embers (red) or the subsequent flux plateaus from embers (blue). (C) Identical to A except that after the 3-s time point, the plateau phase of embers is suppressed (i.e., they become sparks) by a threefold decrease in diffusion across the LSR/TSR nexus. The horizontal bars in A and B indicate the period where the cytoplasm is being primed for CICR.
In Fig. 8 C, we did the same simulation up to the 3-s time point and subsequently suppressed plateau Ca2+ fluxes without significantly altering the frequency of initial transients by restricting diffusion between the LSR and TSR. This maneuver not only prevented wave initiation but also quenched an established Ca2+ wave within 200 ms despite the resulting increase in the SR load (Fig. S8), demonstrating that the Ca2+ flux plateau (i.e., embers) is a prerequisite for wave initiation and propagation.

The role of Ca2+ embers in wave initiation and propagation. (A–C) z-t line-scan images of (A) Ca2+ release under the same conditions as used in Fig. 6 A, (B and C) where Ca2+ embers are prevented from occurring by a threefold decrease in diffusion across the LSR/TSR nexus for times after the white dotted lines.
The role of Ca2+ embers in wave initiation and propagation. (A–C) z-t line-scan images of (A) Ca2+ release under the same conditions as used in Fig. 6 A, (B and C) where Ca2+ embers are prevented from occurring by a threefold decrease in diffusion across the LSR/TSR nexus for times after the white dotted lines.
The ability of Ca2+ release at one dyad to activate its neighbors (the essence of CICR) is dependent on the Ca2+ efflux from the dyad and the ability of Ca2+ to diffuse between dyads, which, in turn, is strongly influenced by Ca2+ buffering power. The buffering power of the cytoplasm is known to decrease with increasing cytoplasmic [Ca2+] (e.g., see a review by Smith and Eisner [2019]), and the buffering power of most Ca2+ buffers in our model decreases 10-fold between 100 nM and 1 μM and 100-fold at peak [Ca2+] (Fig. S9 A). We examined the role of this decreased buffering power in Ca2+ wave propagation by simulating Ca2+ release in the presence of a fictitious Ca2+ buffer with normal buffering power at 100 nM cytoplasmic [Ca2+] that remained constant up to 10 μM cytoplasmic [Ca2+] (Fig. S9 A, dashed line). Under these conditions, we could not sustain a propagating Ca2+ wave; instead, Ca2+ release appeared as a collection of stochastic, long-lasting release events (embers, Fig. S9, B and C). Therefore, the role of reduced cytoplasmic buffering power in CICR is important for the generation of a propagating wave.

The role of cytoplasmic Ca2+ buffering power in Ca2+ wave initiation and propagation. (A) Concentration dependencies of buffer power of important Ca2+ chelators in the cytoplasm and their summed total. Buffer power is defined as the ratio of change in total [Ca2+] to free [Ca2+]. z-t line-scan images of Fluo-4 fluorescence during a Ca2+ release (B) with Ca2+ buffering by chelators shown in A using the same conditions as in Fig. 6 and (C) when buffer power follows the fictitious, weak concentration dependence shown by the black dashed line in A.
The role of cytoplasmic Ca2+ buffering power in Ca2+ wave initiation and propagation. (A) Concentration dependencies of buffer power of important Ca2+ chelators in the cytoplasm and their summed total. Buffer power is defined as the ratio of change in total [Ca2+] to free [Ca2+]. z-t line-scan images of Fluo-4 fluorescence during a Ca2+ release (B) with Ca2+ buffering by chelators shown in A using the same conditions as in Fig. 6 and (C) when buffer power follows the fictitious, weak concentration dependence shown by the black dashed line in A.
Therefore, both Ca2+ embers and CICR are necessary to produce a Ca2+ wave in this model. Even though embers contributed only 30% to the total flux, they had a disproportionate ability to create a cumulative increase in cytoplasmic [Ca2+] (e.g., Fig. 3 C). Once cytoplasmic [Ca2+] nears 0.5 μM, CICR begins to recruit additional embers and sparks, providing the positive feedback in Ca2+ release needed to sustain the Ca2+ wave. Thus, our model predicts that embers are required to prime the cytoplasmic milieu for CICR as illustrated in Fig. 9 (the priming period is indicated by the black bar in Fig. 8). In the lead-up to a Ca2+ wave, Ca2+ uptake by the SERCA2a outpaces Ca2+ leak via Ca2+ sparks, resulting in Ca2+ loading of the LSR. At an LSR [Ca2+] threshold (in this case, 0.9 mM), embers start occurring that produce the increase in cytoplasmic [Ca2+] and decrease in cytoplasmic buffering power needed to initiate CICR. Moreover, Fig. S8 B shows that priming of the cytoplasm by embers throughout the cell is essential for sustaining CICR during the propagation of an established Ca2+ wave. At the wave peak, cytoplasmic [Ca2+] is high enough to drive the LSR [Ca2+] ember threshold down to 0.3 mM (Fig. 3 B), thus allowing increased ember frequency and plateau Ca2+ flux, even while LSR [Ca2+] decreases below the threshold for wave initiation. Once the Ca2+ wave is established, there is a more pronounced peak in the total plateau Ca2+ flux at peak cytoplasmic [Ca2+] (Fig. 8 B, blue, 3.7 s), indicating that cytoplasmic [Ca2+] is generating more embers. Thus, while embers initiate the wave, the established wave initiates more embers.

Schematic diagram of feedback mechanisms operating during Ca 2+ wave initiation and termination showing the roles of cytoplasmic priming.
Schematic diagram of feedback mechanisms operating during Ca 2+ wave initiation and termination showing the roles of cytoplasmic priming.
The process of wave termination is a negative feedback process that begins when flux due to transients drops 80% and plateaus drop 100% due to a depleting SR. Cytoplasmic [Ca2+] peaks and begins to fall as the flux balance shifts between Ca2+ release, diffusion into the surrounding cell and bath, and uptake by the LSR. As cytoplasmic [Ca2+] decreases, increased cytoplasmic buffering power decreases Ca2+ diffusion between neighboring dyads, which together with their decreased Ca2+ efflux attenuates CICR in a negative feedback loop that continues until cytoplasmic [Ca2+] returns to basal levels (Fig. 9). During this process, the LSR [Ca2+] threshold for embers returns to higher levels, which eliminates embers until the LSR refills.
Generally, we found that 2 μM was the smallest cytoplasmic [Ca2+] amplitude that could sustain Ca2+ waves with sheep and human RyR2s. For example, decreasing Ca2+ store capacity by decreasing its main Ca2+ buffer concentration (TSR [CSQ]) from 30 to 20 mM (Fig. 10), rather than merely decreasing wave amplitude as extrapolated from our sensitivity analysis (see below), caused the cell to exhibit wavelets in the case of uniform RyR2 clusters (Fig. 10 C) or to settle to a steady state for nonuniform clusters after two brief oscillations in the first 3 s in which cytoplasmic [Ca2+] = 0.3 μM and LSR [Ca2+] = 0.8 mM (Fig. 10, A and B, red line; and Fig. 10 D). Fig. 10 E shows the contributions of Ca2+ flux transients and plateaus to Ca2+ release for the case of nonuniform RyR2 clusters. As LSR [Ca2+] reaches a threshold, embers appear as seen by a rise in the plateau flux (blue), but in this case, it does not produce the surge in transient fluxes (red) normally seen with CICR. Hence, the Ca2+ flux is insufficient to create enough CICR or to reduce LSR [Ca2+] to below the threshold for embers so that the plateau current does not terminate. Thus, our model predicts that in cases of reduced Ca2+ release, sustained Ca2+ waves fail to occur because both positive and negative feedback mechanisms are insufficient to maintain system oscillations.

Situations where Ca2+ waves do not occure. (A and B) Time course of Ca2+ in the cytoplasm (A) and LSR (B) when the main Ca2+ buffer concentration in the TSR ([CSQ]) is decreased from 30 to 20 mM. Simulations were for sheep/human RyR2 with uniform RyR2 cluster sizes (black) and exponentially distributed cluster sizes (red) at positions x = 1 μm and y = 1 μm (near the longitudinal axis), z = 25 μm (midpoint of the longitudinal axis). (C and D) z-t fluorescent line scans for uniform clusters (C) and exponentially distributed cluster sizes (D). (E) For the case of exponentially distributed cluster sizes, the mean LSR [Ca2+] (green) and the total Ca2+ fluxes in the x-y plane at z = 25 μm originating from the initial flux transients from sparks and embers (red) or the subsequent flux plateaus from embers (blue).
Situations where Ca2+ waves do not occure. (A and B) Time course of Ca2+ in the cytoplasm (A) and LSR (B) when the main Ca2+ buffer concentration in the TSR ([CSQ]) is decreased from 30 to 20 mM. Simulations were for sheep/human RyR2 with uniform RyR2 cluster sizes (black) and exponentially distributed cluster sizes (red) at positions x = 1 μm and y = 1 μm (near the longitudinal axis), z = 25 μm (midpoint of the longitudinal axis). (C and D) z-t fluorescent line scans for uniform clusters (C) and exponentially distributed cluster sizes (D). (E) For the case of exponentially distributed cluster sizes, the mean LSR [Ca2+] (green) and the total Ca2+ fluxes in the x-y plane at z = 25 μm originating from the initial flux transients from sparks and embers (red) or the subsequent flux plateaus from embers (blue).
Model sensitivity analysis for Ca2+ embers and waves
Due to the enormous computational size of the model, the sensitivity analysis used a one-factor-at-a-time method to determine a ratio of the relative change in the model output with respect to relative changes in each model input. Fig. 11 shows the first of two analyses where the model outputs were the Ca2+ wave period, peak cytoplasmic [Ca2+] during a wave (cytmax), the minimum cytoplasmic [Ca2+] between waves (cytmin), the peak LSR [Ca2+] just before wave initiation (LSRmax), and the minimum LSR [Ca2+] immediately following wave termination (LSRmin). Model input parameters were grouped in the following categories: (1) Ca2+ diffusion, including Ca2+ diffusion constant, its relative permeability across the perforated external membrane, and [Ca2+] in the external bath; (2) the dimensions of the model compartments, RyR2 separation, and mean cluster size; (3) RyR2 unitary current and Ca2+ activation kinetics; (4) SERCA2a activity; and (5) Ca2+ buffering. The resulting heat map matrix of model sensitivities in Fig. 11 shows that wave period, LSRmax, and cytmax were most sensitive to the size of cell compartments and RyR2 distribution and moderately sensitive to SERCA2a activity, RyR2 gating parameters that determine CICR within and between dyads, and Ca2+ buffering in the cytoplasm by ATP and the TSR by CSQ.

Sensitivity analysis of the Ca 2+ wave model. Model outputs investigated were Ca2+ wave period, as well as maxima and minima in the time courses of [Ca2+] in LSR (LSRmax and LSRmin) and cytoplasm (cytmax and cytmin). The sensitivity of these outputs to each model parameter was measured as the ratio of the percentage change in the model output to the percentage change in the parameter as indicated by the color scale and the plus–minus symbols to indicate their sign. The numbers on the right are an index used to cross-reference with Fig. S10.
Sensitivity analysis of the Ca 2+ wave model. Model outputs investigated were Ca2+ wave period, as well as maxima and minima in the time courses of [Ca2+] in LSR (LSRmax and LSRmin) and cytoplasm (cytmax and cytmin). The sensitivity of these outputs to each model parameter was measured as the ratio of the percentage change in the model output to the percentage change in the parameter as indicated by the color scale and the plus–minus symbols to indicate their sign. The numbers on the right are an index used to cross-reference with Fig. S10.
In the second sensitivity analysis, the model output was the threshold LSR [Ca2+] for ember formation at a single release site using the same model inputs as our first analysis. We found a positive correlation between the effect of LSR [Ca2+] on ember formation and wave initiation in 22 out of the 31 model parameters inspected (Fig. S10). This is consistent with the transition of Ca2+ sparks to Ca2+ embers being a requirement for Ca2+ wave initiation seen in Fig. 8. Thus, our analyses support two governing principles of Ca2+ wave initiation: (1) Ca2+ embers occur when [Ca2+] (hence CICR) in the dyad cleft remains too high to initiate the induction-decay cycle that causes Ca2+ spark termination, and (2) Ca2+ waves initiate at the LSR [Ca2+] threshold where Ca2+ sparks transform into Ca2+ embers. In light of these principles, we explain (below) how the model parameters influence Ca2+ wave properties.

Model parameter sensitivity of the threshold for LSR [Ca 2+ ] for production of Ca 2+ embers (y axis) plotted against that for wave initiation (x axis). The sensitivities are determined by the ratio of the percentage change in LSR [Ca2+] thresholds for wave initiation and ember formation to the percentage change in each model parameter.
Model parameter sensitivity of the threshold for LSR [Ca 2+ ] for production of Ca 2+ embers (y axis) plotted against that for wave initiation (x axis). The sensitivities are determined by the ratio of the percentage change in LSR [Ca2+] thresholds for wave initiation and ember formation to the percentage change in each model parameter.
LSRmax is effectively the LSR [Ca2+] that can sustain sufficient CICR in the dyad cleft to prevent the induction-decay cycle. Thus, LSRmax is lowered by factors that increase CICR in the dyad cleft such as increasing RyR2 sensitivity to cytoplasmic Ca2+ or increasing RyR2 unitary current. We note that the RyR2 closing rate has a threefold stronger effect on LSRmax and ember threshold than the opening rate (Fig. S10, c.f. #13 and #14). LSRmax is also lowered by decreasing Ca2+ efflux from the dyad cleft via more constrained dyad geometry or decreasing Ca2+ buffering by ATP, T-tubules, and SR lipids, which also tends to maintain a higher dyad [Ca2+]. (The negative surface potential on the T-tubule strongly attracts Ca2+, increasing the Ca2+ buffering capacity of T-tubule lipids.) Increasing Ca2+ diffusion between the LSR and TSR or increasing TSR Ca2+ buffering by CSQ hinders TSR depletion, thus increasing [Ca2+] release and dyad [Ca2+]. Finally, the increase in LSRmax with increasing SERCA2a activity is because of its ability to lower cytoplasmic [Ca2+] between waves, hence reducing the cytoplasmic stimulus of RyR2s.
LSRmin was sensitive to EC50 for RyR2 activation, TSR [CSQ], diffusion between the LSR and TSR, and diffusion in the dyad cleft (notably, dyad gap and tortuosity factor). Otherwise, LSRmin followed a similar pattern of sensitivities as LSRmax albeit to a much lesser degree.
The wave period is influenced by most of the factors that influence LSRmax because it reflects the time taken for a given level of SERCA2a activity to load the LSR to a threshold level. By the same argument, the wave period is reduced by increasing SERCA2a activity. In addition, the wave period is sensitive to bath [Ca2+], the permeability of the external membrane to Ca2+, and the Ca2+ diffusion constant. This is because these factors limit SERCA2a activity by limiting the rate of Ca2+ diffusion from the external bath to SERCA2a.
Cytmax is positively correlated with factors determining the Ca2+ store load at wave initiation (SR Ca2+ buffering capacity and LSRmax) and negatively correlated with the cytoplasmic buffering by the fixed buffers, troponin (low-affinity site) and CaM, and relatively insensitive to troponin (high-affinity site), myosin, and SERCA2a. Interestingly, the diffusible buffers, ATP and Fluo-4, have the opposite effect on cytmax to the fixed buffers because diffusible buffers also act as Ca2+ carriers to increase Ca2+ diffusion in the cytoplasm and external bath, hence increasing SERCA2a activity and LSRmax.
Cytmin was mainly sensitive to factors influencing the transport of Ca2+ into the cytoplasm such as bath [Ca2+], surface membrane permeability, and Ca2+ diffusion constant, as well as SERCA2a activity, which determines transport of Ca2+ out of the cytoplasm. In addition, [ATP] had a positive correlation with cytmin for the same reasons as it did for cytmax.
Variables that had no significant impact on any aspect of the wave simulations were: (1) the EC50 for the RyR2 closing rate, which determines the Ca2+ dependence of the RyR2 closing rate; (2) [SR lipid], which is the concentration of Ca2+ binding lipids in the SR membrane; and (3) cytoplasmic Ca2+ buffering by myosin, SERCA2a, CaM, and high-affinity troponin sites and CSQ in the LSR.
Dependence of Ca2+ waves on RyR2 opening and closing rates
Our sensitivity analysis revealed differential effects of the RyR2 opening and closing rate on ember and wave initiation. We investigated the relative importance of RyR2 gating rates and open probability to Ca2+ wave properties by measuring the effect on Ca2+ waves of a uniform threefold reduction in RyR2 opening and closing rates over the full range of cytoplasmic [Ca2+] (Fig. S11. E and F, c.f. blue and green lines), thus reducing RyR2 gating rates without altering channel open probability. The resulting simulations produced Ca2+ waves with ∼10% longer period and 10% higher LSR [Ca2+] threshold for wave initiation (Fig. S11, A and B, c.f. blue and green lines).
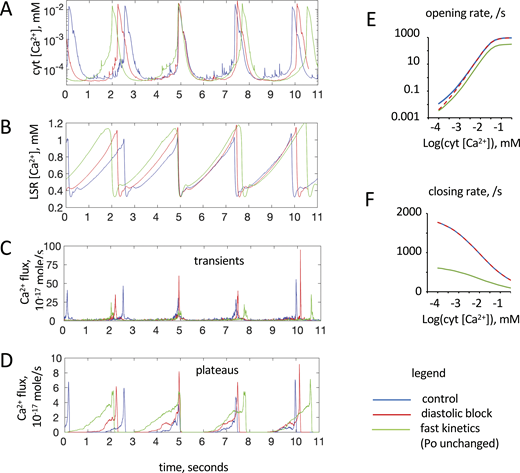
Effect of altering RyR2 opening and closing rates from control (blue lines, parameters given inTable S3and cytoplasmic [Ca2+] dependencies shown inFig. S3 ). (A–D) Resulting time courses of [Ca2+] in the cytoplasm (A) and LSR (B) and the total Ca2+ fluxes through all 371 dyads in the x-y plane originating from the initial flux transients from sparks and embers (C) or the subsequent flux plateaus from embers (D). Values were taken near the longitudinal axis (x = 1 μm and y = 1 μm, z = 25 μm [midpoint of the longitudinal axis]). In these simulations, [Fluo-4] = 0.05 mM so that waves would form under all conditions tested. (E and F) Green lines show a threefold reduction in opening and closing rates (fast kinetics with the same open probability), and red lines show a threefold reduction in opening rates at diastolic [Ca2+] (diastolic block).
Effect of altering RyR2 opening and closing rates from control (blue lines, parameters given inTable S3and cytoplasmic [Ca2+] dependencies shown inFig. S3 ). (A–D) Resulting time courses of [Ca2+] in the cytoplasm (A) and LSR (B) and the total Ca2+ fluxes through all 371 dyads in the x-y plane originating from the initial flux transients from sparks and embers (C) or the subsequent flux plateaus from embers (D). Values were taken near the longitudinal axis (x = 1 μm and y = 1 μm, z = 25 μm [midpoint of the longitudinal axis]). In these simulations, [Fluo-4] = 0.05 mM so that waves would form under all conditions tested. (E and F) Green lines show a threefold reduction in opening and closing rates (fast kinetics with the same open probability), and red lines show a threefold reduction in opening rates at diastolic [Ca2+] (diastolic block).
The reason for these changes lay in the differential effects of the opening and closing rate on CICR within dyads that underlies ember formation and CICR between dyads that together initiate waves (see Fig. 9). Slowing the closing rate resulted in a greater reduction in the LSR [Ca2+] threshold for ember formation compared with the increase caused by slowing the opening rate (see Fig. S10). The net effect was to decrease this threshold so that embers initiated earlier in the wave cycle, allowing them to generate a larger, longer plateau flux and hence a stronger priming phase (Fig. S11 D, green line). However, stronger priming of the cytoplasm was offset by the slower RyR2 opening rate, which delayed CICR between dyads and wave initiation, consistent with the reduced transient flux (Fig. S11 C, green line).
We also investigated how RyR2 activation at diastolic [Ca2+] may affect Ca2+ waves by reducing the RyR2 opening rate by approximately threefold at diastolic [Ca2+] via a threefold reduction in the parameter Gf, in Eq. 14 in the Supplemental text at the end of the PDF (Fig. S11, red lines). This caused a 5% increase in the wave period and amplitude, and a 10% higher LSR [Ca2+] threshold for wave initiation. The reduction in the opening rate caused a relatively small (0.05 mM) decrease in the LSR [Ca2+] threshold for ember formation but delayed the CICR phase so that wave initiation occurred at a higher LSR [Ca2+]. Once cytoplasmic [Ca2+] increased above diastolic levels, reestablishment of the normal RyR2 opening rate along with the higher LSR [Ca2+] produced a larger transient flux and wave amplitude (Fig. S11 C, c.f. red and blue lines).
Finally, we investigated how inhibition of RyR2 activity via decreasing channel open durations (open channel block) or increasing channel closed durations (closed channel block) might alter Ca2+ waves. We simulated the open channel block by a threefold increase in the RyR2 closing rate and the closed channel block by a threefold decrease in the opening rate (Fig. S12). The open channel block caused a 20% increase in the wave period, amplitude, and LSR [Ca2+] threshold, whereas the closed channel block increased all these by 40%. With the open channel block (red lines), the faster RyR2 closing rate increased the LSR [Ca2+] threshold for embers, causing them to initiate later in the wave cycle, but once embers did initiate, the higher LSR [Ca2+] increased the plateau flux, increasing CICR (note the increased transient flux in Fig. S12 C), thus rapidly stimulating wave initiation. With the closed channel block (green lines), the slower opening rate increased the LSR [Ca2+] threshold for embers, but only by a third of that for the open channel block. However, the slower opening rate also decreased CICR, which restrained wave initiation until a higher LSR [Ca2+] than seen with the open channel block, thus producing longer wave periods and amplitudes than for the open channel block.

Effect of open and closed RyR2 block on the time course of [Ca 2+ ] in the cytoplasm and LSR and Ca 2+ fluxes. (A–D) The control conditions and figure format are the same as Fig. S11. (E and F) Green lines show a threefold reduction in the opening rate (closed channel block), and red lines show a threefold increase in the closing rate (open channel block).
Effect of open and closed RyR2 block on the time course of [Ca 2+ ] in the cytoplasm and LSR and Ca 2+ fluxes. (A–D) The control conditions and figure format are the same as Fig. S11. (E and F) Green lines show a threefold reduction in the opening rate (closed channel block), and red lines show a threefold increase in the closing rate (open channel block).
Discussion
We show that it is possible to generate realistic simulations of Ca2+ waves using experimentally determined RyR2 gating kinetics without the need to introduce exaggerated RyR2 channel activation by SR luminal Ca2+. We find that sustained, cumulative increases in cytoplasmic [Ca2+] occur when brief localized Ca2+ release events (Ca2+ sparks) become prolonged by orders of magnitude (becoming Ca2+ embers) above a threshold SR [Ca2+] when CICR between RyR2s within the dyad does not decay to allow normal Ca2+ spark termination (Cannell et al., 2013). The resulting small, sustained increase in cytoplasmic [Ca2+], along with an associated fall in cytoplasmic buffering power, primes the cytoplasm throughout the cell for CICR between dyads that produces Ca2+ waves following a scheme illustrated in Fig. 9. In our model, the progression from sustained CICR within dyads (Ca2+ ember formation) to CICR between dyads is both essential for initiation and propagation of Ca2+ waves. We predict that the SR [Ca2+] threshold for Ca2+ embers underpins the [Ca2+] threshold for Ca2+ waves and SOICR.
Ca2+ sparks
Although our seven-compartment dyad model is a considerable simplification of our previous 3D dyad model for Ca2+ sparks (Cannell et al., 2013; Laver et al., 2013), the simplified model could still approximate the time course of Ca2+ spark activation, termination, and restoration (Fig. S4). Interestingly, the Ca2+ spark full width at half maximum values we obtain are 30% smaller than normally seen (Picht et al., 2007), which is a problem common to Ca2+ release models that may be due to an error in the common assumption that diffusion obeys Fick’s law (Tan et al., 2007). Like our previous model, the Ca2+ spark activation phase resulted from regenerative CICR between RyR2s in the dyad cleft and spark termination resulted from an induction-decay cycle in which Ca2+ depletion of the TSR reduces the RyR2 Ca2+ flux and hence dyad [Ca2+] to a point where RyR2s start to deactivate, further reducing the Ca2+ flux. Guo et al. (2012) presented experimental evidence for such a mechanism for spark termination which they called pernicious attrition. Our model also predicted that when the [Ca2+] in the LSR exceeds a certain threshold, the TSR fails to deplete sufficiently to initiate the induction-decay cycle that terminates a spark. In this case, replenishment of the TSR by Ca2+ diffusion from the LSR is sufficient to sustain a quasi- steady-state release of Ca2+ from the dyad, which lasts until the LSR [Ca2+] is sufficiently decreased.
Ca2+ embers
Although sustained (>50 ms) Ca2+ release occurred quite frequently in our simulations in the lead-up to a Ca2+ wave (Fig. S6 F and Fig. S7), the Ca2+ embers that result from these sustained releases were detected less frequently in line scans such as in Fig. 6. This is because of the low amplitude of embers compared with sparks and waves, go undetected when the release sites are displaced a mere 0.5 μm from the scan line. (To clearly distinguish embers in our simulations, we utilized a logarithmic fluorescence scale, as illustrated in Fig. 6 C.)
The properties of Ca2+ embers produced by our model are in accord with experiments. Long-lasting, localized Ca2+ release events (Ca2+ embers) were first seen in skeletal muscle where RyR1s were modified by Imperatoxin A (Shtifman et al., 2000) and in cardiomyocytes where RyR2s were either partially blocked by tetracaine or modified by ryanodine or FK506 (Sobie et al., 2002; Zima et al., 2008a). More recent studies observed embers in the absence of RyR2 modifiers. Zima et al. (2008b) reported that embers were promoted at higher LSR [Ca2+] and in regions where dyads had a greater connection (i.e., faster diffusion) with the LSR. Brochet et al. (2011) found that Ca2+ release underlying Ca2+ sparks in rabbit ventricular myocytes had a brief, large initial transient followed by a sustained, low-flux component; both components contributing similar to the total Ca2+ release. A cardiomyocyte model by Sato et al. (2016) produced embers lasting >1 s in response to the same factors that we also found important for ember generation, such as reducing the number of RyR2s in the dyad and/or their open probability, increasing Ca2+ diffusion between the TSR and LSR, and reducing Ca2+ diffusion in the cytosol. Importantly, and in agreement with our simulations, they showed that increased LSR [Ca2+] promoted embers.
Mechanisms of SOICR and Ca2+ waves
The model produced waves with velocities that ranged from 60 to 100 μM/s and with amplitudes as small as 2 μM, in line with experimental observations (Bers, 2002; Lipp and Niggli, 1993). Our waves tended to initiate at cell/bath boundaries (at x = 8 μm, y = 8 μm, and z = 52 μm) where the LSR would load more quickly and reach the threshold first. Therefore, waves in our simulations initiated at the end of the cell near z = 52 μm. Experimental observations often show that waves originate in central cell regions. Our model suggests that this could arise from cellular inhomogeneities, which cause local LSR [Ca2+] to reach the ember threshold earlier in these regions. This phenomenon may result from a more permeable surface membrane, increased LSR Ca2+ uptake, lower ember threshold, or other factors depicted in Fig. 11 that locally reduce the Ca2+ wave period.
Despite their modest Ca2+ flux, embers are essential precursors to Ca2+ waves in our model (Fig. 7 and Fig. 8) and that without embers, Ca2+ waves fail to initiate or propagate (Fig. S8). Our analysis of Ca2+ release from individual dyads (Fig. 3) shows that the sustained plateau flux of embers is much more likely than the initial transients of embers and sparks to cause CICR at neighboring release sites and produce cumulative increases in local cytoplasmic [Ca2+] needed to prime the cytoplasm for waves. Embers are clearly apparent in our line-scan simulations of Ca2+ waves at various points along the cell (Fig. 6), but in the wave initiation region, they are difficult to distinguish due to cluttering of many ember events, which may explain why embers have not been reported in association with wave initiation.
Our sensitivity analysis (Fig. 11 and Fig. S10) showed a strong positive correlation with 22 out of 31 model parameters between their effects on LSR [Ca2+] thresholds for promoting Ca2+ embers and Ca2+ waves. Thus, our model predicts that changes in cell properties that lower the LSR [Ca2+] threshold for embers are also likely to promote spontaneous Ca2+ waves and hence arrhythmias. Therefore, the threshold LSR [Ca2+] for SOICR depends on RyR2 sensitivity not only to SR luminal Ca2+ as previously thought (Jiang et al., 2004), but also to other factors such as dyad structure (see below), Ca2+ buffering in the cytoplasm by ATP and in the TSR by CSQ, and RyR2 sensitivity to cytoplasmic Ca2+. Indeed, recent experiments (Kurebayashi et al., 2022) show that SOICR is much more dependent on RyR2 sensitivity to cytoplasmic [Ca2+] than to SR [Ca2+] in accord with our model predictions.
Although our simulations show that Ca2+ embers are an essential precursor to waves, they do not always produce Ca2+ waves. It has been long recognized that increased Ca2+ buffering in the cytoplasm retards Ca2+ wave propagation (Gyorke and Gyorke, 1998) because it reduces CICR between adjacent release sites. A more nuanced buffering action on Ca2+ signaling occurs when cytoplasmic Ca2+ buffering power is reduced at higher [Ca2+] (e.g., see a review by Smith and Eisner [2019]) as shown in Fig. S9 A. Under these conditions, our simulations generated Ca2+ embers and wavelets but not waves (Fig. S9 C), demonstrating that declining buffering power at high [Ca2+] is a necessary component of the positive feedback provided by CICR that allows embers to initiate waves. More generally, where the initial peak cytoplasmic [Ca2+] is small, such as in the case of reduced CSQ in the TSR, cells may adopt a steady state in which the SR is highly permeable to Ca2+, but waves do not occur (Fig. 10). This is consistent with observations that skinned cardiomyocytes sometimes do not exhibit Ca2+ waves, especially so in cell lines where CSQ is lacking (B.C. Knollmann, personal communication).
Differing roles of RyR2 opening and closing rates in Ca2+ release
Experimental studies indicate that heart rhythm depends more on RyR2 opening and closing rates than it does on RyR2 open probability per se. During the discovery of the first effective treatment for ventricular arrhythmias arising from the overactive RyR2 in catecholaminergic polymorphic ventricular tachycardia (CPVT), it was found that reducing RyR2 open probability alone was insufficient to prevent CPVT. Flecainide, which reduced RyR2 open durations (considered an open channel blocker), was antiarrhythmic, whereas tetracaine, another RyR2 inhibitor that increased closed durations (a closed channel blocker), increased the Ca2+ wave amplitude and was proarrhythmic (Watanabe et al., 2009). In permeabilized cardiomyocytes, tetracaine and flecainide increased the period of Ca2+ waves. However, tetracaine alone increased the LSR content and wave amplitude (Hilliard et al., 2010).
These different effects of RyR2 opening and closing rates on Ca2+ waves can be understood within our model. Simulated open and closed channel RyR2 block in Fig. S12 show that the closed channel block produces increases in peak store load and wave amplitude that are larger than seen with the open channel block. These differences arise from the property that the RyR2 closing rate has a threefold bigger effect on the LSR [Ca2+] ember threshold than opening rates, whereas the opening rate is the main driver of CICR between dyads.
Carvajal et al. (2024) reported that the species (rabbit, human) with shorter systolic RyR2 open and closed times have a lower tendency to form delayed after depolarizations (DADs) and a lower SR Ca2+ content than species with the longer systolic open and closed times and higher diastolic open probability (mouse, rat) even though all species had similar RyR2 open probabilities at systolic (10 μM) cytoplasmic [Ca2+]. We indeed find that shorter RyR2 open and closed times lead to lower peak SR Ca2+ content (Fig. S11 B, c.f. blue and green lines). Although our simulations of Carvajal et al. (2024) findings explain how RyR2 open and closing rates in different species can produce different SR Ca2+ handling, just how these changes lead to different propensities for DADs requires a cell model that includes the surface membrane.
Role of dyad structure in Ca2+ release
Our sensitivity analysis predicts that Ca2+ wave properties depend on SR structural elements such as RyR2 separation, dyad surface area, TSR thickness, TSR/T-tubule separation, LSR–TSR connectivity, and Ca2+ diffusion tortuosity. (Tortuosity in the dyad cleft would depend on the distribution of proteins that limit diffusion paths.) Nanoscale dyad morphology is quite heterogeneous. Electron tomography of ultrarapid high-pressure frozen cardiomyocyte samples from healthy hearts revealed variations between dyads in dyad volume (twofold range) and TSR/T-tubule separation (3–20 nm) (Rog-Zielinska et al., 2021). The size of RyR2 clusters follows an exponential distribution (Hou et al., 2015), and RyR2 spatial distribution within clusters also varies (Asghari et al., 2014). Some of these dyad-to-dyad variations in the RyR2 cluster size have been included in our model. It has been proposed that such variations in cluster size should aid wave initiation on the assumption that waves are initiated by sparks (Xie et al., 2019). However, in our model, waves are initiated by embers, so cluster size variations only produce a minor effect on wave simulations as seen in line-scan images of Ca2+ waves (Fig. 6).
Confocal and super-resolution optical microscopy of cardiomyocytes from failing hearts has found that dysfunctional Ca2+ release is associated with remodeling of T-tubule structures, colocalization of structural proteins, and distribution and sizes of RyR2 clusters (see a review by Jayasinghe et al. [2018]). Previous models have addressed the influence of ion channel clustering on Ca2+ sparks (Iaparov et al., 2021; Walker et al., 2014) and excitation–contraction coupling (Cosi et al., 2019; Tanskanen et al., 2007). Our model predicts that proarrhythmic Ca2+ waves will occur at a lower LSR [Ca2+] threshold, by structural changes that constrain Ca2+ diffusion in the dyad such as increasing tortuosity of diffusion paths or dyad area or decreasing the dyad gap between the TSR and T-tubule. A lower LSR [Ca2+] threshold can also be achieved by closer average spacing of RyR2s in clusters and increased connectivity between the TSR and LSR.
Limitations of the model
Given the high sensitivity of SR Ca2+ release to the dyad structure, care should be taken when applying insights from this model to Ca2+ release in other cell types (e.g., HEK293) where SR organization is quite different. Also, the accuracy of the model is limited by our current knowledge about important dyad structures and their connectivity with the LSR, which awaits experimental data. Our simplified model of the Ca2+ release site structure, RyR2 distribution within clusters, and the hybrid stochastic–deterministic approximation for RyR2 gating restricts the scope of the model to mechanisms by which multiple Ca2+ release sites interact to produce Ca2+ waves. The deterministic calculation of RyR2 activity during Ca2+ release does not capture the stochastic aspects of Ca2+ spark transients such as the possibility of Ca2+ quarks in cases of insufficient CICR to generate a full Ca2+ spark nor does it capture the effects of fragmented RyR2 arrays on Ca2+ release investigated in previous Ca2+ spark models (Cannell et al., 2013; Cosi et al., 2019; Iaparov et al., 2021). Also, we adopted a simplified two-state RyR2 gating scheme based on single-channel recordings of RyR2s under steady conditions. However, RyR2s are known to have more complex Mg2+-dependent gating kinetics (Laver and Honen, 2008; Zahradníková and Zahradník, 2012), which, in the rapidly changing ion concentrations during sparks and waves, could generate a different Ca2+ release time course to the steady-state model used here (Iaparov et al., 2022). Despite these simplifications, our model still captured the overall time course of Ca2+ spark activation by CICR, termination by induction decay, and restitution by TSR refill.
Since our model does not include an active surface membrane, it mainly offers insights into spontaneous Ca2+ release phenomena generated by the SR alone such as Ca2+ sparks, embers, and waves. This study demonstrates that Ca2+ wave formation, driven by increasing LSR [Ca2+], involves a progression from sustained CICR within dyads (Ca2+ ember formation) to CICR between dyads. This provides a plausible alternative to the traditional mechanism of CICR between dyads alone in generating SOICR and Ca2+ waves. CICR both within and between dyads arises from the complex interplay of RyR2 Ca2+-dependent kinetics, organelle structure, and Ca2+ diffusion and buffering within the cell. We anticipate these and other novel factors that regulate SOICR in our simulations will guide the development of more complete cell models and future experimental investigations into cardiac excitation–contraction coupling and cardiac rhythm.
Data availability
Data are available in the published article and its online supplemental materials.
Acknowledgments
David A. Eisner served as an editor.
This work was funded by the NSW Health Infrastructure grant through the Hunter Medical Research Institute to D.R. Laver. This research was supported by Australian Government Research Training Program Scholarship to M. Vysma.
Author contributions: M. Vysma: investigation, methodology, software, and writing—review and editing. J.S. Welsh: conceptualization, data curation, formal analysis, methodology, software, and supervision. D.R. Laver: conceptualization, formal analysis, investigation, methodology, project administration, software, supervision, visualization, and Writing—original draft, review, and editing.