In the tumor microenvironment (TME), “exhausted” CD8+ T cells are classified into progenitor (Tpex) and terminally exhausted (Ttex) populations. Tpex cells, critically regulated by zinc finger and BTB domain containing 27 (Zbtb27)/Bcl6 transcription factor, could be reinvigorated during immune checkpoint blockade (ICB) therapy, while Ttex cells, characterized by stronger proliferation and cytotoxicity, play an indispensable role in tumor control. However, the mechanisms governing the differentiation into Ttex and their function remain not well understood. In this study, we identified that Zbtb32, highly expressed in CD8+ Ttex subset, is crucial for CD8+ T cells within tumors. Zbtb32, regulated by CD28 signaling, promotes the differentiation of CD8+ T cells into Ttex subset, enhancing their cytotoxicity, proliferation, and anti-tumor capability. Importantly, we found a competitive DNA binding between Zbtb32 and Bcl6, especially in regulation of Id2 expression. Thus, our findings demonstrate the pivotal role of Zbtb32 in CD8+ T cell anti-tumor function, with implications in cancer immunotherapy.
Introduction
CD8+ T cell exhaustion is a state of dysfunction that develops in response to persistent antigen exposure, particularly observed in chronic infection and cancer. The functional consequences of CD8+ T cell exhaustion are profound, severely limiting their ability to control tumors. CD8+ exhausted T (Tex) cells are transcriptionally and epigenetically distinct from effector CD8+ T cells, featured by dampened effector and cytokine gene expression (Chen et al., 2019b; Gebhardt et al., 2023). Continuous presence of tumor antigens in the immunosuppressive tumor microenvironment (TME) results in T cell exhaustion (Wherry and Kurachi, 2015; Philip and Schietinger, 2022; Dolina et al., 2021; McLane et al., 2019), marked by the upregulation of inhibitory receptors such as PD-1 and CTLA-4 (Ribas and Wolchok, 2018).
Within CD8+ Tex cell population, there exists a spectrum of differentiation states ranging from progenitor exhausted (Tpex) cells to terminally exhausted (Ttex) cells. CD8+ Tpex cells are an early subset in the exhaustion differentiation hierarchy (Gebhardt et al., 2023). These cells retain the potentials for proliferation and self-renewal, characterized by the expression of transcription factors (TFs) such as TCF1 and Bcl6 (Chen et al., 2019b; Utzschneider et al., 2016; Sun et al., 2023a; Wu et al., 2016). CD8+ Tpex cells respond to therapeutic interventions such as immune checkpoint blockade (ICB) (Miller et al., 2019; Utzschneider et al., 2016; Im et al., 2016; Kurtulus et al., 2019). In response to antigenic stimulation and perhaps the microenvironment, they progressively differentiate into Ttex cells, which are marked by strengthened cytolytic function but a gradual loss of proliferative capacity, making them less responsive to therapeutic interventions (Schietinger and Greenberg, 2014; Kurtulus et al., 2019; Paley et al., 2012). Ttex cells express high levels of multiple inhibitory receptors, including PD-1, TIM-3, and LAG-3 (Im et al., 2016; McLane et al., 2019; Andrews et al., 2017; Das et al., 2017). Increasing Tpex cell subpopulation and promoting their differentiation into Ttex cells has become an attractive strategy to enhance the long-term tumor control ability of CD8+ T cells. Therefore, researchers have attempted to identify key fate-determining factors that regulate CD8+ T cell stemness and differentiation in TME. For instance, TCF1 and TOX are crucial for Tpex cells (Chen et al., 2019b; Utzschneider et al., 2016; Seo et al., 2019; Niu and Wang, 2023; Scott et al., 2019; Yang et al., 2021; Khan et al., 2019; Kim et al., 2020), while Id2 and Blimp1 are essential for the induction and persistence of Ttex cells (Lagumdzic et al., 2022; Cannarile et al., 2006; Li et al., 2024; Yang et al., 2011; Omilusik et al., 2018; Sun et al., 2023a; Jung et al., 2022; Shin et al., 2009; Crotty et al., 2010). However, the molecular mechanisms underlying the differentiation of Tpex to Ttex cells are not well understood. Particularly, the maintenance of Ttex cells with potent cytotoxicity in TME still remains elusive.
Zinc finger and BTB domain containing (Zbtb) family TFs contain the BTB domain, which recruits cofactors and histone modification enzymes to the site of regulation, and the zinc finger domain, responsible for sequence-specific DNA binding (Kelly and Daniel, 2006; Beaulieu and Sant’Angelo, 2011; Cheng et al., 2021). Most Zbtb family members, such as PLZF (Zbtb16) and Bcl6 (Zbtb27), are critical in regulation of immune cells as classic transcriptional repressors (Hoatlin et al., 1999; Hatzi et al., 2015; Mondal et al., 2010). Our recent work has demonstrated a critical function of Bcl6 in CD8+ tumor-infiltrated T cells (TILs), including the maintenance of Tpex cells, and repression of Ttex cell–associated gene expression, thus offering long-term tumor control (Sun et al., 2023a). Interestingly, Bcl6 functions to antagonize the expression and function of Blimp1, which is regulated by IL-2 signaling. Zbtb32, another member in the Zbtb family, has been reported to play important roles in different types of immune cells, including inhibition of CD4+ T cell proliferation (Piazza et al., 2004), suppression of IL-4 gene activation (Omori et al., 2003), and restriction of memory B cell responses (Jash et al., 2016; Yoon et al., 2012), while positively regulating natural killer (NK) cell responses to infection (Beaulieu et al., 2014; Adams et al., 2018). During LCMV infection, Zbtb32 expression was mainly observed in terminal effector CD8+ T cells, rather than in naïve or memory subsets (Hudson et al., 2019), while Zbtb32-deficient CD8+ T cells were shown to have enhanced antiviral response (Shin et al., 2017).
In this study, we identified Zbtb32 as an important TF in Ttex TILs, which promotes CD8+ T cell effector function in tumor rejection. Interestingly, we discovered a competitive relationship of Zbtb32 and Bcl6 in tumor-specific CD8+ T cell fate determination, providing valuable insights into future immunotherapeutic development.
Results
Zbtb32 is selectively expressed in Ttex CD8+ TILs
To understand the fate determination of CD8+ T cells in cancer, we investigated into differentially expressed TFs between Tpex and Ttex CD8+ T cell subpopulations, marked by Bcl6 and Tim3 in E.G7 tumor-bearing mice (Sun et al., 2023a). Several well-known TFs, including Prdm1 and Id2, were highly expressed in Ttex subset, whereas Id3 and Tcf7 were in Tpex subset (Fig. 1, A and B). Interestingly, we noted that Zbtb32 exhibited upregulated expression levels in Ttex cells, as compared with Tpex cells.
Furthermore, by analyzing RNA-sequencing (RNA-seq) data from various human cancer types in TCGA datasets, we observed significant positive correlations between ZBTB32 expression and that of Ttex signature gene (CD8A, GZMB, GZMK, HAVCR2, ID2, IL2RA, IL2RB, LAG3, PDCD1, PRDM1, and TIGIT) in different cancer models, among which skin cutaneous melanoma (SKCM) exhibited highest correlation (Fig. S1, A and B), suggesting that ZBTB32 expression was increased with terminal differentiation of CD8+ TILs. Specifically, upon dividing various cancer patients into subgroups with increased or decreased expression of Ttex signature genes, we found that ZBTB32 expression exhibited significant increase in the subgroup enriched in expression of these genes, compared with that with decreased expression (Fig. S1, C and D).
To further elucidate the expression of ZBTB32 in CD8+ T cells from human cancer, we analyzed single-cell RNA-seq (scRNA-seq) data from melanoma patient samples (Fig. S1 E). Using TCF7 and HAVCR2 to distinguish CD8+ TILs into two main populations, CD8+ Tpex and Ttex, our results revealed a profound overlapping distribution of ZBTB32 with HAVCR2 and GZMB mRNAs (Fig. S1 F), indicating Ttex properties. Importantly, no overlap in mRNA expression was observed between ZBTB32 and TCF7 in cell subpopulations. Also, analysis of gene expression across distinct clusters revealed that ZBTB32, HAVCR2, and GZMB were predominantly expressed by T cells in clusters 0 and 4, whereas TCF1 expression was exclusively concentrated in clusters 1, 2, and 3 (Fig. S1 G). This underscores the selective expression of ZBTB32 in the Ttex subset rather than the Tpex subset of CD8+ TILs.
Moreover, to further elucidate the pivotal role of ZBTB32 in CD8+ T cell–mediated anti-tumor function, we analyzed clinical data from SKCM patients in TCGA, sorting them based on CD8A expression levels and getting two main groups from top 25% (CD8 enriched) and bottom 25% (CD8 decreased) of all. In this comparison, we only observed distinct survival rates between subgroups with high and low ZBTB32 expression levels only within the CD8+ T cell–enriched group, highlighting the potential benefits in patients with ZBTB32-expressing CD8+ TILs (Fig. S1 H).
Additionally, we examined the published scRNA-seq dataset from murine B16-OVA tumor model (Miller et al., 2019), which consistently demonstrated substantial expression of Zbtb32 in CD8+ TILs; Zbtb32 expression was mainly enriched in CD8+ T cells but not other immune cells in B16 (Fig. 1, C and D). Notably, Zbtb32 exhibited a similar expression pattern in B16 and human cancers, overlapping with that of Havcr2 and Gzmb but not Tcf7 in CD8+ TILs (Fig. 1, E–G). To confirm these results, we sorted two CD8+ TIL subsets, marked by Ly108 and Tim-3, representing Tpex and Ttex, respectively, from B16-OVA tumor-bearing mice. Quantitative RT-PCR (RT-qPCR) results indicated increased Zbtb32 mRNA levels in Ttex compared with Tpex (Fig. 1 H).
Collectively, these findings indicate that Zbtb32 is selectively expressed by Ttex cells, suggesting a potential role in T cell–mediated anti-tumor function.
Zbtb32 expression is regulated by CD28 signaling
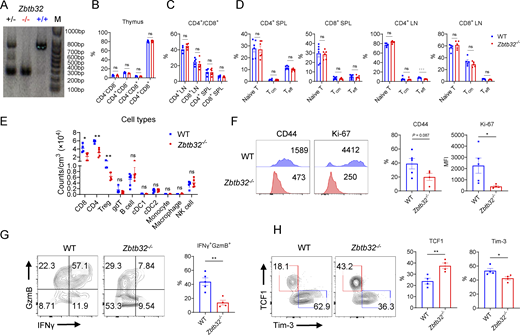
To understand the regulation and function of Zbtb32 expression in murine CD8+ T cells, we constructed Zbtb32 germline knockout (Zbtb32−/−) mice and validated efficient gene knockout efficiency (Fig. S2 A). We initially activated naïve CD8+ T cells with anti-CD3 and CD28 in vitro and collected samples at various time points to assess Zbtb32 mRNA levels. Results showed that Zbtb32 expression levels were increased at 48 h after T cell activation and peaked around 2–3 days compared with the naïve state, indicating induction of Zbtb32 expression following T cell activation (Fig. 2 A). To delineate the specific activation signals underlying Zbtb32 regulation, we activated WT naïve CD8+ T cells under varying concentrations of anti-CD3 or anti-CD28 for 3 days to assess Zbtb32 expression. The results revealed that Zbtb32 expression levels exhibited dose-dependent changes only in response to anti-CD28 stimulation, but not to anti-CD3 (Fig. 2 B). To validate this observation, we co-cultured Zbtb32−/− and WT naïve CD8+ T cells under the same settings. Consistently, the relative ratios of WT versus Zbtb32−/− cells responded in a dose-dependent manner only to anti-CD28 administration (Fig. 2 C). Together, these findings indicate that co-stimulatory CD28 signal, rather than TCR signal, predominantly regulates Zbtb32 expression.
More specifically, we activated CD8+ T cells with different signaling inhibitors and collected samples on day 3 for analysis. Since CD8+ T cells could secrete a large amount of IL-2 after activation, we also included with anti–IL-2 block antibody. Expectedly, a significant reduction in Zbtb32 mRNA levels was only noted in cells treated with an inhibitor to PI3K, downstream of CD28 (Fig. 2 D).
We then further assessed CD28-PI3K axis in regulation of Zbtb32 expression. Since the YMNM motif, especially the 189 tyrosine, in CD28 intracellular domain was essential to bind PI3K, we overexpressed WT CD28-YMNM and mutant CD28-FMNM in CD8+ T cells. Remarkably, WT CD28-YMNM induced higher Zbtb32 expression than mutant CD28-FMNM (Fig. 2 E), suggesting that CD28 signaling effectively augments Zbtb32 expression in a PI3K-dependent manner. To validate this, we overexpressed WT and mutant CD28 in both WT and Zbtb32−/− cells. Overexpression of WT CD28 in CD8+ T cells led to increased cell numbers and elevated expression of functional molecules compared with cells expressing mutant CD28 (Fig. 2 F). These effects were more pronounced in WT cells compared with Zbtb32−/− cells (Fig. 2 F), indicating that CD28-PI3K axis enhances CD8+ T cell effector functions, at least in part, through the upregulation of Zbtb32 expression.
Zbtb32 is required for optimal CD8+ T cell effector function
To assess the roles of Zbtb32 in T cell function, we firstly utilized fluorescence-activated cell sorting (FACS) to examine T cell compartments in primary and secondary lymphoid organs under steady-state condition, in which significant difference was hardly observed in cell populations between Zbtb32−/− and WT mice (Fig. S2, B–D), confirming that T cell development and homeostasis remained unaffected after Zbtb32 deficiency.
Then, to explore the function of Zbtb32 in CD8+ T cell activation and function, we isolated naïve CD8+ T cells from Zbtb32−/− and B6 mice and activated them with anti-CD3/CD28 for 3 days in vitro. Analysis revealed reduced T cell activation marker expression in Zbtb32−/− T cells, evidenced by decreased CD25+CD44+ and increased CD62L+ populations (Fig. 3, A–C). Additionally, the expression of effector molecules, such as IFNγ and GzmB, was substantially decreased in Zbtb32−/− cells, as compared with WT T cells (Fig. 3, A–C). Furthermore, we assessed the apoptosis levels of Zbtb32−/− and WT CD8+ T cells after 3-day activation, utilizing propidium iodide (PI) and Annexin V as indicators. Notably, Zbtb32−/− cells exhibited increased apoptosis compared with WT cells (Fig. 3, D and E). Besides, we evaluated cell proliferative potential by activating CFSE-labeled naïve cells in vitro for 3 days. Expectedly, Zbtb32−/− cells displayed stronger CFSE signals with fewer rounds of cell division than WT counterparts (Fig. 3 F), indicating compromised proliferation after Zbtb32 ablation.
Next, to evaluate the cytotoxicity in antigen-specific CD8+ T cells in the absence of Zbtb32, we firstly pre-activated Zbtb32−/− or WT OT-I cells for 36 h, followed by co-culture with OVA-expressing B16 cells at various effector-to-target (E:T) ratios. To avoid the impact of cell numbers, we also incubated CD8+ T cells with IL-2 before co-culture. Using caspase-3 as the indicator of cell death, we observed that almost all cells survived and WT CD8+ T cells exhibited stronger killing capacity and higher CD25 expression level compared with Zbtb32−/− counterparts (Fig. 3, G and H).
Moreover, to further verify the effector functions of Zbtb32−/− or WT T cells in vivo, we co-transferred naïve Zbtb32−/− and WT OT-I cells into mice infected with OVA-expressing Listeria monocytogenes (LM-OVA). Zbtb32−/− OT-I cells consistently displayed defects in T cell activation and function, with decreased cell numbers, cytotoxicity, and upregulated CD127 expression, representing increased memory cell proportions, while WT OT-I cells, with robust cytokine secretion and effector function, accompanied with increased KLRG1+ population (Fig. 3, I–K).
Collectively, these results demonstrate that Zbtb32 is required for optimal CD8+ T cell activation and effector function.
Zbtb32 promotes CD8+ T cell–mediated anti-tumor rejection
Upon establishing a pivotal role of Zbtb32 in CD8+ T cell function, we next analyzed the differences between Zbtb32−/− and WT mice in cancer, using B16-OVA, E.G7, and MC38-GP33 tumor models. Markedly, tumor growth was increased after the ablation of Zbtb32 compared with WT counterparts (Fig. 4 A). Given our focus on melanoma and the single-cell data in B16-OVA tumor models, we chose the B16-OVA model for further investigation.
Then, we quantified the numbers of various immune cell types in B16-OVA TME and observed a decrease only in CD4+ and CD8+ T cell numbers in Zbtb32−/− mice, while other immune cell populations remained relatively unchanged (Fig. S2 E). To ascertain which cell types were important in this anti-tumor process, we selectively depleted CD4+ T, CD8+ T, or NK cells in mice receiving B16-OVA (Fig. 4 B). Remarkably, the difference between Zbtb32−/− and WT mice in tumor volumes was only abolished in the absence of CD8+ T cells, but not CD4+ T cells or NK cells, when compared with the isotype IgG control group. This result demonstrates that CD8+ T cells are the key mediators of tumor rejection regulated by Zbtb32.
Furthermore, we analyzed CD8+ TILs in B16-OVA TME. Within the CD8+ T cell subset, we observed decreased levels of CD44 and Ki-67 in Zbtb32−/− mice (Fig. S2 F), indicating attenuated activation and proliferation. Importantly, IFNγ+GzmB+ population was significantly reduced in Zbtb32−/− mice, likely contributing to their decreased anti-tumor capacity (Fig. S2 G). Additionally, we noted that TCF1+ subpopulation was increased by ∼40% in all activated CD8+ TILs in Zbtb32−/− mice compared with 20% in WT mice (Fig. S2 H).
Subsequently, to further analyze tumor-specific T cells in their differentiation and function, we adoptively transferred naïve Zbtb32−/− or WT OT-I or P14 cells into mice subcutaneously inoculated with OVA or GP33-expressing B16-OVA, E.G7, and MC38-GP33 tumor cells (Fig. 4 C). We observed worse survival rates in mice receiving T cells with Zbtb32 ablation, along with a significant increase in tumor volumes (Fig. 4, D–I). Specifically, Zbtb32−/− OT-I cells exhibited impaired T cell function with reduced cell numbers, especially characterized by compromised CD8+ T cell differentiation, with TCF1+ and Ly108+ populations accounting for nearly half of total OT-I TILs (Fig. 4, J and K). In the meantime, these cells exhibited reduced Tim-3+ and Cx3CR1+ subsets, compared with WT OT-I cells (Fig. 4, J and K). Additionally, Zbtb32 deficiency led to a significant reduction in IFNγ and GzmB expression, along with a decrease in the level of Ki-67 expression (Fig. 4, J and K), which aligned with the differences observed in Zbtb32−/− and WT mice inoculated with tumors.
Similarly, Zbtb32-overexpressing (OE) CD8+ cells exhibited augmented function in vitro, further supporting our conclusion (Fig. 5 A). RT-qPCR results demonstrated various effectors—but not stem-like gene expression levels were upregulated after overexpression. And more importantly, when transferring WT or Zbtb32 OE OT-I cells into B16-OVA recipients (Fig. 5 B), diminished TCF1+ subset, enhanced cytokine expression, and cytotoxicity were observed in Zbtb32 OE cells, likely leading to improved tumor control and survival rates (Fig. 5, C–F).
Collectively, these findings demonstrate that Zbtb32 is vital for effective CD8+ T cell–mediated anti-tumor responses.
ICB overcomes Zbtb32 deficiency in tumor-specific T cells
In light of the previous reports on superior responses by Tpex cells to ICB therapy (Wei et al., 2017; Brummelman et al., 2018; Liu et al., 2022), we hypothesized that Zbtb32−/− T cells might exhibit improved response to ICB therapy. To investigate this, we treated B16-OVA–bearing mice transferred with Zbtb32−/− or WT OT-I naïve cells with or without anti–PD-1 at day 7, 10, and 13 posttumor inoculation (Fig. 6 A). Tumor volume evaluations revealed Zbtb32−/− OT-I cells had worsened tumor control ability compared with WT OT-I cells. However, both of them displayed improved tumor control upon ICB treatment, while mice with Zbtb32−/− T cells exhibited stronger enhancement than those with WT cells, resulting in similar tumor volumes between two groups of recipients (Fig. 6, B and C). This illustrates that ICB treatment eliminated the defects in tumor control caused by Zbtb32 deficiency.
To gain additional insights in this change, we examined the cellular characteristics with or without ICB treatment. Notably, ICB treatment did not significantly alter the proportions of Tpex and Ttex cells, wherein Zbtb32−/− OT-I cells consistently exhibited increased ratios of TCF1+ and Ly108+ populations (Fig. 6, D and E), indicative of enhanced stem-like attribute and maintenance of stemness. Then, statistical analysis revealed that ICB treatment significantly increased T cell numbers, particularly in Zbtb32−/− OT-I cells, which expanded dramatically to the comparable levels with WT cells (Fig. 6 F). Moreover, substantial increases in cell numbers of both TCF1+ and Tim-3+ populations were observed in anti–PD-1–treated Zbtb32−/− T cells, while those in WT counterparts remained largely unchanged, suggesting a greater impact of the ICB on Zbtb32−/− T cell numbers (Fig. 6 F).
Furthermore, the assessment of Ki-67 mean fluorescence intensity (MFI) and cytokine secretion, particularly IFNγ, GzmB, and IL-2, gave similar conclusions. The ICB treatment significantly enhanced proliferation and cytokine release in Zbtb32−/− T cells, without much impact on WT counterparts (Fig. 6, G–I), providing compelling evidence for the restoration of the anti-tumor response in Zbtb32−/− cells with ICB treatment. Additionally, there was no evident change in T cells in draining LNs (DLNs) (Fig. 6 J), likely due to low Zbtb32 expression levels in Tpex cells there.
Our results together show that the impairments in anti-tumor function of T cells resulted from Zbtb32 deficiency could be largely rescued after anti-PD1 treatment, associated with Tpex expansion and differentiation into Ttex.
Zbtb32 transcriptionally regulates CD8+ T cell function in tumor
To understand the molecular regulation of CD8+ T cells by Zbtb32 in cancer, we inoculated B16-OVA cells the day after co-transferring Zbtb32−/− and WT naïve OT-I cells into TCRbd−/− mice and sacrificed the recipients at day 30 (Fig. 7 A). Consistent with separate OT-I–adoptive cell transfer experiment, compromised CD8+ T cell numbers and the changes in TCF1+ and Tim-3+ frequencies were found due to Zbtb32 deficiency. T cell function and expansion was severely decreased as a result of Zbtb32 deletion, accompanied by reduced IFNγ and GzmB expression and MFI of Ki-67 (Fig. 7, B and C), indicating an indispensable role of Zbtb32 in tumor-specific CD8+ T cell function. Interestingly, similar difference was not observed in cell numbers or marker expression in DLNs and spleen (SPL) (Fig. S3, A and B), suggesting that the impact of Zbtb32 deficiency may be limited to the TILs.
To further explore Zbtb32 function over the course of tumor development, we compared CD8+ TILs at early and late phases. The results revealed that the differences between Zbtb32−/− and WT T cells in cell numbers and T cell subsets became more dramatic over time (Fig. S3, C–E). Then to analyze Zbtb32 function, we performed RNA-seq on FACS-sorted Zbtb32−/− and WT CD8+ TILs at day 30 after co-transfer in CD45.1+ recipients. Differentially expressed genes (DEGs) indicated downregulation of effector- and terminal-associated genes (Id2, Havcr2, Batf, Prdm1, Eomes, and Tigit), co-stimulatory or cytokine receptors (Il2ra, Il2rb, CD28, CD69, and Icos), and cytokines (Ifng, Il12, Il21, and granzyme family) in Zbtb32−/− cells, with upregulation of progenitor-associated genes (Id3, Bcl6, Tcf7, Sell, and Cxcr5), compared with WT T cells (Fig. 7, D and E). Gene ontology (GO) enrichment analysis unveiled the prominent presence of effector-related and proliferative pathways in WT cells (Fig. 7 F), underscoring a critical role of Zbtb32 in facilitating CD8+ T cell activation and functional differentiation. Furthermore, gene set enrichment analysis (GSEA) unveiled distinct patterns of gene expression between Zbtb32−/− and WT OT-I cells, in which genes upregulated in the Tpex population were more enriched in Zbtb32−/− OT-I cells, while those associated with the Ttex phenotype were predominantly concentrated in WT OT-I cells (Fig. 7 G).
Since the results of above experiments may be impacted by the changes of Tpex and Ttex cell ratios, we directly compared these subsets in the presence or absence of Zbtb32. We repeated the co-transfer assay (Fig. S4 A) and specifically analyzed the expression levels of effector molecules (IFNγ, GzmB, and Ki-67) within Tpex and Ttex subsets. Consistent with our previous results, WT TILs displayed a stronger bias toward terminal differentiation (Fig. S4, B and C). Moreover, both WT Tpex and Ttex cells exhibited higher expression levels of effector markers compared with Zbtb32-deficient counterparts (Fig. S4, B and C). For further investigation, we sorted WT and Zbtb32−/− Ttex TILs from B16-OVA tumor-bearing CD45.1 mice and performed RNA-seq analysis. WT Ttex cells expressed elevated levels of molecules representing CD8+ T cell activation, proliferation and terminal differentiation, and enriched for the pathways associated with T cell regulation (Fig. S4, D–F).
Of note, GSEA revealed that within Ttex population, WT OT-I TILs still displayed heightened expression of Ttex signature genes compared with Zbtb32−/− OT-I TILs (Fig. 7 H), indicating that Zbtb32 not only affects CD8+ T cell differentiation but also critically regulates effector gene expression in TME. However, the transcriptional differences between WT and Zbtb32−/− Tpex cells were less pronounced than those observed in Ttex cells (Fig. 7 H). We speculate it is due to the relatively low expression levels of Zbtb32 in Tpex cells.
Additionally, transposase-accessible chromatin with high-throughput sequencing (ATAC-seq) analysis was conducted on co-transferred Zbtb32−/− and WT OT-I cells in B16-OVA tumors. The results indicated that like other typical transcriptional regulators, Zbtb32 probably directly regulated gene transcription initiation, with the accessibility of promoter regions comprised by more than half of the differentially accessible regions (Fig. 8, A and B). While Zbtb32 deficiency did not globally abrogate chromatin accessibility, genes in the pathways regulating T cell function exhibited specifically increased accessibility in WT cells (Fig. 8, C and D). In several genes, whose promoter regions exhibited differential chromatin accessibility, genes associated with effector-like and terminal differentiation (Gzmk, Il2ra, Il2rb, Havcr2, Pdcd1, and Cd69) were less accessible in Zbtb32−/− OT-I cells, while those highly expressed in Tpex population with suppression activities on Ttex differentiation (Bcl6, Id3, and Myb) showed the opposite trends (Fig. 8 E). Peak set enrichment analysis revealed enrichment of Tpex and stem-like CD8+ T cell epigenetic signatures in Zbtb32−/− cells, contrasting with Ttex cell signatures in WT cells (Fig. 8 F).
In summary, our results highlight a pivotal role of Zbtb32 in the regulation of CD8+ T cells in their differentiation and effector function.
Antagonizing function of Zbtb32 and Bcl6 in CD8+ T cells
To understand the potential role of Zbtb32, we conducted chromatin immunoprecipitation sequencing (ChIP-seq) of Zbtb32 using CD8+ T cells activated in vitro for 4 days. The analysis of ChIP-seq results revealed that Zbtb32 might exert its function through binding to various DNA regions, with a considerable portion at the promoter regions (Fig. S5 A). Known motif analysis indicated a strong similarity between the binding motifs of Zbtb32 and several factors involved in regulating CD8+ T cell function, such as BATF, JunB, IRF4, Fli1, T-bet, and RUNX2 (Fig. S5 B), suggesting Zbtb32 may also participate in this process.
Bcl6 has been shown to be highly expressed by Tpex and functions to promote Tpex program in TME (Sun et al., 2023a; Wu et al., 2016). It thus appears that belonging to the same family, the functional roles of Zbtb32 and Bcl6 are not similar, but rather opposite. Based on our previous work (Sun et al., 2023a), GSEA analysis indicated that genes enriched in the Bcl6+ Tpex population were mostly associated with Zbtb32−/−, but not WT T cells (Fig. S5 C), indicating that these two factors might have distinct function in regulating CD8+ T cell subsets in TME. To explore the functional relationship of Bcl6 with Zbtb32, we integrated the ChIP-seq results of Zbtb32 with those of Bcl6 and other pivotal TFs regulating T cell exhaustion or enriched in motif analysis (Blimp1, TCF1, T-bet, and BATF). Particularly, predictions of TF-binding motifs revealed nearly identical top motifs for Zbtb32 and Bcl6 (Fig. 9 A). Remarkably, among these factors, Bcl6 exhibited highest overlap with Zbtb32 in their genome-wide occupancy (Fig. 9 B). Additionally, peak overlap diagrams and density maps illustrated striking similarities in their bindings on exhaustion-related gene loci (Fig. 9 C). However, this resemblance was not observed in other core factors, like Blimp1 and TCF1, which have been implicated in determining the fate of CD8+ TILs in TME (Fig. 9 C). These data strongly suggest functional interactions between Bcl6 and Zbtb32.
To further investigate the interplay between Zbtb32 and Bcl6, we integrated their ChIP-seq data with RNA-seq results to identify potential target genes regulated by both factors (Fig. S5 D). First, we identified genes directly induced or suppressed by Zbtb32 or Bcl6. Next, we integrated these findings with DEGs in TCF1+ Tpex and TCF1− Ttex TILs to compare their roles in T cell exhaustion. Notably, genes induced by Zbtb32 and suppressed by Bcl6 were predominantly enriched in the Ttex subset, while Zbtb32-suppressed and Bcl6-induced genes were mostly enriched in the Tpex subset. Among these exhaustion-associated genes, we identified numerous critical molecules regulated by both of them. Furthermore, more than half of the genes induced or suppressed by Zbtb32 were inversely regulated by Bcl6, highlighting their opposing roles in the CD8+ T cell regulatory network.
To confirm this, we separately or simultaneously overexpressed Zbtb32 and Bcl6 in OT-I cells and co-transferred them with control OT-I cells into B16-OVA recipients. Single overexpression of Zbtb32 enhanced, but that of Bcl6 impaired, CD8+ T cell function (Fig. S5 E). However, in doubly overexpressed T cells, there was no significant difference in cell numbers, cytotoxic molecule expression, and cell differentiation compared with control infected T cells (Fig. S5 E). Moreover, this conclusion was supported by B16-OVA recipients adoptively transferred with Zbtb32−/−, Bcl6−/− single-knockout, and Zbtb32−/−Bcl6−/− double-knockout naive OT-I cells (Fig. S5 F). The tumor volumes observed in mice transferred with double-knockout OT-I cells exhibited moderate differences in tumor control compared with mice receiving Zbtb32−/− and Bcl6−/− OT-I cells, but with no significant difference from those carrying WT OT-I cells (Fig. S5 G). All these results support the notion that Zbtb32 and Bcl6 antagonize each other in regulating CD8+ T cell–mediated anti-tumor capability.
Moreover, considering their significant co-occupancy in the genome yet opposing regulations, we attempted to determine whether Zbtb32 and Bcl6 might compete for DNA binding. We firstly compared their binding peaks from their ChIP-seq data and observed substantial overlap at shared sites, particularly in genes essential for CD8+ T cell exhaustion (Fig. S5 H). Analysis of the genome-wide landscape of DNA binding by Zbtb32 before and after Bcl6 overexpression, along with WT and Zbtb32−/− ATAC-seq data, revealed that the binding of Zbtb32 at loci of Ttex-related genes (Prdm1, Gzmb, Havcr2, and Gzmk) diminished or vanished following Bcl6 overexpression (Fig. 9 D).
To verify this discovery, we performed a Zbtb32 ChIP-qPCR assay in CD8+ T cells following 4-day activation, pulling down Zbtb32 before and after Bcl6 overexpression, assessing the binding of Zbtb32 at loci of genes upregulated by Zbtb32 but downregulated by Bcl6 (Gzmb, Havcr2, Prdm1) (Sun et al., 2023a). The results demonstrated that Bcl6 severely dampened Zbtb32 recruitment to these loci through competitive DNA binding (Fig. 9 E). Additionally, we examined the expression levels of these genes to determine if their expressions were influenced by this competition. qPCR results further validated that Bcl6 overexpression reduced the transcriptional levels of these genes (Fig. S5 I), consistent with their downregulations in Bcl6+ CD8+ TILs in our previous finding (Sun et al., 2023a).
Differing from Blimp1, which antagonizes Bcl6 through binding at different sites, Zbtb32 has a highly similar binding preference to Bcl6. To elucidate the differential gene regulation of Zbtb32 and Bcl6, we swapped the BTB domains of Zbtb32 and Bcl6, which recruit cofactors to regulate gene expression. Thus, we overexpressed Zbtb32, Bcl6, and Zbtb32 with the Bcl6 BTB domain (Zbtb-B) and Bcl6 with the Zbtb32 BTB domain (Bcl6-Z) in OT-I cells and transferred them into B16-OVA recipients (Fig. 9 F). Consistently, Zbtb32 OE cells exhibited enhanced tumor control ability, but strikingly, after swapping, the role of Zbtb32 in supporting CD8+ T cell anti-tumor rejection was attenuated in Zbtb32-B OE cells (Fig. 9 G). However, on the other hand, Bcl6 OE cells, which were defective in CD8+ T cell function, were partially rescued in Bcl6-Z OE cells, resulting in a similar anti-tumor capability with Zbtb32-B OE cells (Fig. 9 G). Moreover, we examined their regulation on Prdm1 expression, negatively regulated by Bcl6 (Johnston et al., 2009; Crotty et al., 2010; Vasanwala et al., 2002), and found that while Bcl6 OE obviously inhibited Prdm1 expression compared with Zbtb32 OE, Bcl6-Z OE sharply augmented its expression level by tens of times, but in Zbtb32-B OE cells, the level of Prdm1 decreased substantially (Fig. S6 J).
Furthermore, we co-transferred these four populations with WT OT-I cells into B16-OVA tumor-bearing mice (Fig. 9 H). Evidently, there were relatively higher numbers of Bcl6-Z OE cells than Bcl6 OE cells, while Zbtb32-B OE cells were sharply reduced to a level similar to Bcl6 OE cells (Fig. 9 I). Additionally, while Bcl6 OE inhibited GzmB secretion, Bcl6-Z OE enhanced its level compared with control cells (Fig. 9 J).
The above experiments indicate that Bcl6 and Zbtb32, with similar target genes, differ in the function of their BTB domains in CD8+ T cells. NCoR1 is a well-known cofactor directly recruited by the BTB domain of Bcl6. We thus overexpressed Bcl6 or Bcl6-Z in CD8+ T cells. ChIP-qPCR results reflected NCoR1 recruitment at Prdm1 gene locus following OE Bcl6, but not Bcl6-Z (Fig. 9 K).
Altogether, these data indicate that Zbtb32 and Bcl6 display antagonistic regulations on target genes through competitive DNA binding in CD8+ T cells, mainly due to their different BTB domains, possibly in recruiting different types or amounts of cofactors.
Zbtb32 mediates CD8+ T cell function through regulating Id2 expression
To further understand how Bcl6 and Zbtb32 antagonism influences CD8+ T cell function and the underlying mechanisms, we compared the expression levels of exhaustion-associated TFs among the DEGs regulated by Zbtb32 and Bcl6, with a particular focus on those downregulated in Zbtb32−/− TILs. Our analysis identified Id2 as a CD8+ T cell exhaustion-related TF with the most significant upregulation mediated by Zbtb32 in Ttex cells (Fig. 10 A). Notably, Id2 was also among the most downregulated TFs in Bcl6+ CD8+ TILs (Fig. 1 A and Fig. S5 D). Previous studies have reported that Bcl6 severely impairs Id2 expression in T cells (Sun et al., 2023a; Crotty, 2014). Based on these facts, we inferred that Id2 is a key target through which Bcl6 antagonizes Zbtb32 via competitive DNA binding. To validate this, we analyzed the occupancies of Zbtb32 and Bcl6 at the Id2 locus, which revealed strong binding peaks for both at the same promoter sites (Fig. 10 B). Furthermore, ChIP-qPCR results in CD8+ T cells after 4-day in vitro activation demonstrated the binding of Zbtb32 at these sites was significantly reduced following Bcl6 overexpression (Fig. 10 C). At the mRNA level, Id2 showed a pattern consistent with other key factors (Fig. 10 D), being markedly upregulated by Zbtb32 but downregulated by Bcl6. On the other hand, we overexpressed Zbtb32 and found Id2 RNA levels were significantly increased after Zbtb32 overexpression (Fig. 10 E). These findings confirm that Id2 is a major TF subject to competitive binding at its promoter by Zbtb32 and Bcl6, with opposing regulatory effects.
To analyze the role of Id2 in T cell exhaustion, we overexpressed Id2 in WT and Zbtb32−/− OT-I cells and transferred them into B16-OVA recipients (Fig. 10 F). Id2 overexpression enhanced anti-tumor control by CD8+ T cell, and importantly, it fully rescued the functional inefficiency of Zbtb32−/− CD8+ TILs, reaching the same level as WT cells (Fig. 10 G). Importantly, co-transfer assay further consolidates this observation (Fig. 10 H). Id2 overexpression significantly rescued the impaired tumor control observed following Zbtb32 ablation, as evidenced by the restoration of the Tpex/Ttex ratio to levels comparable with those in WT cells (Fig. 10 I). Functionally, Id2 partially restored cytotoxicity and proliferative capacity, while IFNγ production remained largely unchanged, both GzmB and Ki-67 expression were notably recovered (Fig. 10 J). These results align well with the known role of Id2 in promoting terminal differentiation and cytotoxic function of TILs (Li et al., 2024).
These findings highlight Id2 as a crucial downstream target upregulated by Zbtb32 to enhance CD8+ T cell–mediated tumor rejection. Moreover, they validate that Zbtb32 is antagonized by Bcl6 in regulating Id2 through competitive DNA binding, leading to different CD8+ T cell fates within TME.
Discussion
CD8+ T cells are crucial for tumor control in cancers. Within the TME, exhausted CD8+ T cells are divided into distinct Tpex and Ttex subsets, which mediate persistence and effector function in anti-tumor immunity, respectively. A growing body of literature has highlighted the complex regulatory network governing the differentiation and functional fate of tumor-specific CD8+ T cells within the TME (Miller et al., 2019; Li et al., 2024; Sun et al., 2023a; Jung et al., 2022; Chen et al., 2019a; Sun et al., 2023b; Seo et al., 2021; Yao et al., 2021; Jin et al., 2022). However, the mechanisms that fine-tune the balance between Tpex and Ttex CD8+ TILs remain poorly understood. In this study, we identify Zbtb32 as a key TF necessary for the anti-tumor activity of CD8+ T cells. Zbtb32 deletion severely impaired the differentiation, proliferation, survival, and cytotoxicity of tumor-specific T cells. Importantly, Zbtb32 directly upregulates Id2 to enhance CD8+ T cell function, which is antagonized by Bcl6.
Persistent antigen stimulation drives CD8+ T cell exhaustion in tumor and chronic infection (Hudson et al., 2019; Utzschneider et al., 2016; Wherry et al., 2007; Jadhav et al., 2019; Im et al., 2016; Das et al., 2017; Niu and Wang, 2023; Chen et al., 2019a; Yao et al., 2021). In LCMV clone 13 infection, virus-specific T cells experience persistent high-level stimulation, resulting in exhaustion characterized by elevated inhibitory signals (Zajac et al., 1998; Wherry et al., 2007). However, TILs targeting tumor self-antigens typically exhibit low TCR affinity due to a diverse repertoire of tumor-reactive CD8+ T cells, the immunosuppressive TME, tumor evasion mechanisms, and interactions with suppressive cells (McMahan et al., 2006; Mognol et al., 2017; Hoffmann and Slansky, 2020). Recent studies suggest that the exhaustion-related transcriptional program is more pronounced in the TME than in chronic infection, indicating distinct transcriptional programs under these two contexts (Tillé et al., 2023). Similarly, we found that Zbtb32 is primarily expressed in Ttex cells, where it promotes CD8+ T cell–mediated tumor rejection. This contrasts with findings in LCMV models, where Zbtb32 is expressed in Tpex cells and suppresses antiviral responses (Miller et al., 2019; Shin et al., 2017). Moreover, Zbtb32 appears to function differently across various cell types, with distinct roles in NK and T cell responses to infections (Beaulieu et al., 2014; Shin et al., 2017). Additionally, IL-12 has been shown to drive Zbtb32 expression (Adams et al., 2018; Shin et al., 2017), and our findings suggest that CD28 signaling during initial T cell activation may be important to regulate its expression. These results highlight the context-dependent roles of Zbtb32, influenced by specific microenvironmental factors and signaling pathways in different disease models. Further investigations are needed to fully elucidate the underlying mechanisms and their implications.
Although Zbtb32 and Bcl6 belong to the same TF family, our data revealed that they play distinct roles in T cells. Bcl6, a linage regulator in T follicular helper cells (Nurieva et al., 2009; Liu et al., 2013; Choi and Crotty, 2021), represses multiple genes involved in CD4+ T cell development and inhibits CD8+ T cell differentiation and proliferation (Sun et al., 2023a; Liu et al., 2013; Crotty, 2014). We demonstrate that despite shared DNA-binding capabilities, Zbtb32 and Bcl6 regulate CD8+ TILs differently through their BTB domains. While many Zbtb family members are thought to function as repressors (Hoatlin et al., 1999; Miaw et al., 2000), our study reveals that Zbtb32 may also act as an activator. In addition, our findings indicate that Bcl6 expression is mainly enriched in Tpex, whereas Zbtb32 expression is more prominent in Ttex subset. But we also observed the upregulation of Bcl6 in Zbtb32−/− Ttex TILs, along with reduced effector program. Furthermore, given that Id2 is a well-established mediator of effector function in Ttex cells (Li et al., 2024), our identification of Id2 as a downstream target co-regulated by Zbtb32 and Bcl6 and its selective expression in the Ttex subset further raised the possibility that in Ttex cells, in the absence of Bcl6 expression, Zbtb32 may function primarily through regulating Id2 expression. With the comparison of Zbtb32−/−Bcl6−/− and Bcl6−/− mice, the latter still exhibit more effective tumor control (Fig. S5 G), indicating that Zbtb32 can contribute to CD8+ T cell function through Bcl6-independent mechanisms.
Importantly, we identified Id2 as a critical target antagonistically regulated by Zbtb32 and Bcl6, offering novel insights into how these factors govern CD8+ TILs differentiation. Additionally, Id2 is a negative regulator of basic helix–loop–helix (bHLH) transcriptional factors. A previous study reported that Id2 prevents E proteins from enforcing a naïve T lymphocyte gene program (Zook et al., 2018), wherein Id2-deficient cells showed increased enrichment of a canonical bHLH-binding site (E-box motif), suggesting a loss of repression of E protein activity. Notably, HOMER analysis of Zbtb32−/− cells also revealed significant enrichment of multiple bHLH motifs (data not shown). These findings support a model in which Zbtb32 promotes Id2 expression to suppress bHLH TF activity, particularly via E-box motif inhibition, thereby regulating the terminal differentiation and effector function of CD8+ TILs.
ICB augments Tpex cell numbers and facilitates their conversion to Ttex cells (Miller et al., 2019; Im et al., 2016). However, identifying the patients most suitable for ICB stratification remains unclear. In this study, we found that melanoma patients with an abundance of CD8+ T cells but low ZBTB32 expression had a worse prognosis compared with those with high ZBTB32 expression. Consistently, mice lacking Zbtb32 exhibited impaired CD8+ T cell function and worsened tumor progression, which could be rescued by ICB treatment, highlighting Zbtb32 as a valuable biomarker for immunotherapy. However, unlike Blimp1 (Sun et al., 2023a), Zbtb32−/− cells did not exhibit a better response than WT counterparts following ICB treatment. Our RNA-seq analysis of Zbtb32−/− and WT OT-I TILs revealed enhanced expression of T cell effector genes in WT OT-I cells within Ttex subset, suggesting that Zbtb32 not only facilitates Tpex-to-Ttex conversion but also sustains CD8+ T cell function within the TME. Additionally, scRNA-seq analysis showed that Zbtb32 expression is predominantly enriched in TILs, rather than in DLNs (Carmona et al., 2020; Huang et al., 2022). Our observation that Zbtb32 affects cell numbers in the TME but not in the SPL or DLNs provides additional evidence supporting its role in maintaining CD8+ TIL function, whereas Blimp1 primarily regulates the commitment of Ttex from Tpex cells. It is noteworthy that, while melanoma patients with low ZBTB32 expression typically have a worse prognosis, our mouse data indicate that Zbtb32-deficient mice are more sensitive to ICB. This suggests a possibility that patients with low ZBTB32 expression may respond better to ICB, potentially achieving outcomes similar to those with high ZBTB32 expression. Further investigation is needed in whether low ZBTB32 expression might serve as a predictor of ICB responsiveness.
Overall, this study focusing on the function of Zbtb32 in CD8+ TILs has elucidated key mechanisms within the complex regulatory network of T cell exhaustion. The critical role of Zbtb32 as a transcriptional activator and its interaction with factors like Bcl6 and Id2 offer new possibilities in improving diagnostic and therapeutic strategies in cancer immunotherapy.
Materials and methods
Mice
The research presented in this study has been conducted in accordance with all relevant ethical regulations. C57BL/6, CD45.1, Tcrbd−/−, P14 (with transgenic expression of H-2D b-restricted TCR specific for gp33 epitope), and OT-I (with transgenic expression of H-2K b-restricted TCR specific for OVA257–264) mice were originally obtained from the Jackson Laboratory (JAX:030295). Zbtb32−/− mice were generated using standard CRISPR/Cas9 technology by truncating the second exon of Zbtb32, resulting in protein inactivation. The sequences of sgRNAs used in strain construction were gRNA1: 5′-CCAGAGTCAGTTAGGTTCTC-3′ and gRNA2: 5′-ACAAGCGAGTTGCAGAAGCCT-3′. The CD8CreBcl6fl/fl mice were generated by crossing CD8Cre and Bcl6fl/fl mice. Zbtb32−/− mice were crossed with CD8CreBcl6fl/fl mice, and they were then crossed with P14 and OT-I mice. CD45.1 congenic mice were crossed with OT-I mice to generate CD45.1 OT-I mice. All the experiments were conducted using age- and sex-matched mice between the ages of 6 and 12 wk. The mice were maintained under specific pathogen–free conditions, and the animal protocols were approved by and performed in accordance with the Institutional Animal Care and Use Committee of Tsinghua University.
Flow cytometry and cell sorting
For surface marker detection, cells were incubated with the indicated antibodies against surface markers at 4°C for 30 min. For intracellular detection, cells were activated for 4 h with phorbol 12-myristate 13-acetate (PMA, 50 ng/ml; P8139; Sigma-Aldrich), ionomycin (500 ng/ml; I0634; Sigma-Aldrich), and Brefeldin A 596 (Golgiplug, BD Bioscience). Subsequently, the samples were fixed and permeabilized with a fixation/permeabilization kit (554722; BD Biosciences) according to the instructions from manufacturer.
Surface staining antibodies used included anti-Fixable Viability Dye (65-0866; eBioscience), anti-TCRβ (553172; BD Bioscience), anti-CD25 (25-0251-82; eBioscience), anti-TIM3 (25-0251-82; eBioscience), anti-CD45 (25-0451-81; eBioscience), anti-CD25 (25-0251-82; eBioscience), anti-CD3e (552774; BD Bioscience), anti-CD25 (25-0251-82; eBioscience), anti-Ly-6C (560593; BD Bioscience), anti-TCRβ (560657; BD Bioscience), anti-NK1.1 (45-5941-82; eBioscience), anti-CD8a (45-0081-82; eBioscience), anti-CD24 (101827; BioLegend), anti-CD44 (563058; BD Bioscience), anti-CD4 (100548; BioLegend), anti-F4/80 (123110; BioLegend), anti-CD69 (12-0691; eBioscience), anti-V alpha 2 TCR (12-5812; eBioscience), anti-CD11c (562454; BD Bioscience), anti-CD19 (562291; BD Bioscience), anti-γδTCR (553177; BD Bioscience), anti-CD45 (11-0541-82; eBioscience), anti-CD8a (11-0081-82; eBioscience), anti-CD3e (560801; BD Bioscience), anti-CD45R (560472; BD Bioscience), anti-CD127 (48-1271-82; eBioscience), anti-Ly-6G (48-5931-82; eBioscience), anti-CD45.1 (48-4053-82; eBioscience), anti-CD8a (557959; BD Bioscience), anti-CD45.2 (56-0454; eBioscience), anti-CD62L (47-0621-82; eBioscience), anti-CD45.2 (109823; BioLegend), anti-MHCII (17-5321; eBioscience), anti-KLRG1 (561620; BD Bioscience), anti-CD3e (17-0032-82; eBioscience), anti-CD11b (17-0112-82; eBioscience), anti-Ly108 (12-1508-80, 17-1508-82; eBioscience).
Intracellular staining antibodies used included anti-Caspase-3 (561011; BD Bioscience), anti-KI-67 (556026; BD Bioscience), anti-KI-67 (556027; BD Bioscience), anti-IFNγ (554412; BD Bioscience), anti-IFNγ (48-7311-82; eBioscience), anti-IL-2 (560547; BD Bioscience), anti-IL-17A (11-7177-81; eBioscience), anti-TNFa (17-7321-82; eBioscience), anti-GzmB (50-8898-82; eBioscience), anti-Foxp3 (11-5773-82; eBioscience), anti-GATA3 (560074; BD Bioscience), anti-T-bet (25-5825-82; eBioscience), anti-TOX (50-6502-82; eBioscience), and anti-EOMES (48-4875-80; eBioscience).
For cell apoptosis analysis, the cells were fixed and incubated with PI from Annexin V Apoptosis Detection Kit I (556547; BD Bioscience) and Annexin V (550474; BD Bioscience) for 15 min at room temperature.
All cells were acquired using LSRFortessa (BD Bioscience) flow cytometer, and the data were analyzed using FlowJo V10.
CD8+ T cell purification and culture to induce exhaustion
CD8+ T cells were enriched from SPLs using Dynabeads FlowComp Mouse CD8 Kit (Invitrogen). Naïve CD8+ T cells were FACS sorted from CD8+CD25−CD44lowCD62Lhi population and cultured in RPMI 1640 medium supplemented with 10% (vol/vol) FBS (10099141C; Gibco), 1% (vol/vol) penicillin-streptomycin (30002-CI; Corning), 0.055 mM β-mercaptoethanol, 10 mM hepes (H4034; Sigma-Aldrich), and 1 mM sodium pyruvate (S6422; Gibco), 2 mM glutaMAX (35050061; Gibco) and activated with anti-CD3 (5 µg/ml, BE0001-1; BioXcell) plus anti-CD28 (1 µg/ml, BE0015-1; BioXcell) in the presence of 30 U/ml of IL-2 (212-12; PeproTech) in vitro for 6 days. The medium should be replenished with the same concentration of IL-2 every day after 3-day culture.
In vitro killing assay
Zbtb32−/− and WT OT-I naïve cells were activated with anti-CD3 (4 µg/ml, BE0001-1; BioXcell) and anti-CD28 (4 µg/ml, BE0015-1; BioXcell) antibodies in vitro for 48 h. Subsequently, live-activated OT-I cells were sorted and co-cultured with B16-OVA cells at different E:T ratios (4:1, 2:1, 1:1, 1:2, 1:4, and 1:10). B16-OVA tumor cells were pre-labeled with CellTrace Violet (C34557; Life Technologies), and analysis was conducted after a 12-h co-culture period.
Retrovirus packaging and infection
The CDS region of the genes was cloned into the digested vector to produce pRVKM-CDS-GFP plasmids. Plasmid transfection was performed when 293T cells reached 70–80% confluency. 12 μg pCL-Eco packaging plasmid, 12 μg pRVKM-CDS-GFP plasmid, and 93 μl 2M CaCl2 were mixed in sterile water to reach a final volume of 750 μl. A volume of 750 μl of 2× HBS (pH 7.00) was added drop by drop while bubbling vigorously with an automatic pipette for 1 min, and HBS/DNA solution was then gently and quickly added drop wise onto medium, spreading across a 10-cm dish seeded with 293T cells. Lastly, 100 μM chloroquine was added to the dish and incubated at 37°C. Medium was changed 8 h later, and the supernatant containing virus particles was harvested 48 h after transfection. To obtain gene OE CD8+ T cells, naïve CD8+ T cells were cultured and activated with anti-CD3 (4 µg/ml) and anti-CD28 (4 µg/ml) in vitro for 48 h. The cells were infected with viral supernatants containing 2 μg/ml polybrene at 1,800 rpm. and 37°C for 1.5 h. Subsequently, the cells were then replenished with fresh medium and grown for 1–2 days. The infected cells were then sorted from activated GFP+ CD8+ T cells for subsequent assays.
Tumor inoculation and isolation of TILs
B16 and MC38 cells were cultured in DMEM, and E.G7 cells were cultured in RPMI 1640 medium, both supplemented with 10% FBS and 1% penicillin and streptomycin. A suspension of 5 × 10⁵ B16, 1 × 10⁶ E.G7, or 1 × 10⁶ MC38 cells in 100 μl of 1× PBS was injected subcutaneously into 6–8-wk-old mice. Tumor growth was monitored every 2–3 days. Tumor volume was calculated by the following formula: tumor volume = length × width2/2.
For isolation of TILs, all tumors were digested with 1 mg/ml of collagenase D supplemented with 10 U/ml of DNase I for 40 min at 37°C prior to centrifugation on a discontinuous Percoll gradient (GE Healthcare).
LM infection
Erythromycin-resistant LM-expressing OVA257−264 were grown in brain heart infusion media supplemented with 5 μg/ml erythromycin. A suspension of 1 × 10⁵ CFU of LM-OVA in 100 μl PBS was injected intravenously (i.v.) into 6–8-wk-old mice. The infected mice were analyzed on day 8 after injection.
Bulk RNA-seq, ATAC-seq, and real-time qPCR
Naïve Zbtb32−/− and WT OT-I cells were sorted and co-transferred into CD45.1 mice one day before B16-OVA tumor cell inoculation. Zbtb32−/− and WT OT-I TILs were then sorted and prepared for RNA and ATAC sequencing.
Total RNA was extracted using TRIzol reagent (15596018; Invitrogen) according to the manufacturer’s instructions and precipitated with isopropanol. The quantity and quality of the RNA were evaluated using the Agilent 2100 Bioanalyzer. The samples were sent to BGI Genomics for library construction and sequencing. Low-quality reads and adaptor sequences were removed using Trim Galore version 0.4.4. The clean reads were mapped to the Mus musculus genome (mm10) by Bowtie2 with default parameter. The identification of DEGs was based on a minimum 1.5-fold change.
For ATAC-seq analysis, the samples were resuspended in 35 μl of lysis buffer (10 mM Tris-HCl, pH 7.4, 10 mM NaCl, 3 mM MgCl2, and 0.1% IGEPAL CA-630) and incubated on ice for 10 min with vortexing three times. Following addition of 10 μl of TruePrep Tagment Buffer L (TTBL) and 5 μl of TruePrep Tagment Enzyme (TTE) mix, the mixture was shaken at 37°C for 30 min to facilitate DNA fragmentation. The fragmented DNA was purified using 1.8-fold of AMPure beads, barcoded with dual indexes, and amplified by PCR. The DNA was then subjected to size selection and purification using 0.4-fold and 1.6-fold of AMPure beads, respectively. The size distribution and molarity of the library DNA were determined by Agilent 2100 bioanalyzer and Qubit. Sequencing was performed using Hiseq-PE150 (Illumina) provided by Novogene. Low-quality reads and adaptor sequences were removed by Trim Galore version 0.4.4 with parameters “-q 10-length 30-stringency 5”. Paired-end reads were aligned to the mm10 reference genome using Bowtie2 with "-×2000". Reads that aligned to the mitochondrial genome were filtered, and PCR duplicates were removed with Picard MarkDuplicates. To identify peaks, the bam files containing unique, non-chrM reads were used to call peaks with MACS2 using parameters “–nomodel–keep-dup all -q 0.01–shift −100–extsize 200–call-summits -g mm.” For differential coverage, corresponding bam files were merged to call peaks to get a union peak set. For each peak in the peak set, raw ATAC-seq reads were counted by featureCounts. Differentially expressed peaks were identified by at least twofold change and false discovery rate (FDR) adjusted P value of 0.01.
For real-time qPCR, M-MLV reverse transcription kit (Invitrogen) was used for generating cDNA. Gene expressions at the mRNA level were measured using the SYBR real-time kit (Bio-Rad Laboratories). For RT-qPCR analysis, the data shown were normalized to the expression of reference gene Actb. The primers used in RT-qPCR were as follows: Zbtb32-F: 5′-GGTGCTCCCTTCTCCCATAGT-3′, Zbtb32-R: 5′-GGAGTGGTTCAAGGTCAGTG-3′; Gzmb-F: 5′-TGTGAAGCCAGGAGATGTGT-3′, Gzmb-R: 5′-TCAGCTCAACCTCTTGTAGC-3′; Ifng-F: 5′-ACGGCACAGTCATTGAAAGC-3′, Ifng-R: 5′-GGCTCTGCAGGATTTTCATGTC-3′; Bcl6-F: 5′-CACACCCGTCCATCATT-GAA-3′, Bcl6-R: 5′-TGTCCTCACGGTGCCTTTTT-3′; Tcf7-F: 5′-AGCTTTCTCCACTCTA-CGAACA-3′, Tcf7-R: 5′-AATCCAGAGAGATCGGGGGTC-3′; Havcr2-F: 5′-ACAGAC-ACTGGTGACCCTCCAT-3′, Havcr2-R: 5′-CAGCAGAGACTCCCACTCCAAT-3′; Il2ra-F: 5′-AACCATAGTACCCAGTTGTCGG-3′, Prdm1-F: 5′-GACGGGGGTACTTCTGTTCA-3′, Prdm1-R: 5′-GGCATTCTTGGGAACTGTGT-3′; Id2-F: 5′-ATGAAAGCCTTCAGTCCGGTG-3′, Id2-R: 5′-AGCAGACTCATCGGGTCGT-3′; Bach2-F: 5′-AGATGACTTGGTGGTCAGCTTG-3′, Bach2-R: 5′-CTGCAAACAAACAGGCCATCCT-3′; and Actb-F: 5′-CCTGAACCCTAAG-GCCAAC-3′, Actb-R: 5′-ACAGCCTGGATGGCTACG-3′.
ChIP-seq and ChIP-qPCR
ChIP experiment was done following the manufacturer’s instructions of Active Motif’s ChIP assay kit (53035). 1 × 10⁷in vitro–cultured CD8+ T cells were fixed by 1% paraformaldehyde, followed by digestion and sonication. All ChIP samples were collected from RV overexpression activated CD8+ T cells, cultured in vitro for 4 days. The protocol was identical to that used for retrovirus infection.
The ChIP experiment was performed as indicated (Xu et al., 2019). The sequencing reads were mapped to the mouse genome mm 10 by Bowtie2 (Langmead and Salzberg, 2012). PCR duplicates were removed using Picard Mark Duplicates. The uniquely mapped reads were used to call peak with MACS2 using a P value cutoff of 0.01 (Zhang et al., 2008). ChIP seeker was used for peak annotation. deepTools was used to generate coverage track file (bigWig), which can be visualized in IGV 3. To generate a profile plot with deepTools (3.5.6), first use computeMatrix with parameters “–referencePoint center –missingDataAsZero -p 60 -R input.bed -S input.bw -b 5000 -a 5000 –skipZeros -o heatmap.gz” to calculate average signal values across regions. Signal normalization is typically applied during input file creation (using bamCoverage). Next, visualize with plotProfile using “-m (matrix file), –perGroup” to plot each group separately, and “–legendLocation” to position the legend. The y axis reflects the average signal intensity, depending on the chosen normalization method.
ChIP assay was performed using Active Motif’s ChIP assay kit (53035) according to manufacturer’s instructions with slight modifications (Wang et al., 2020). Briefly, a total of 1 × 10⁷ cells were activated for 4 days and harvested and cross-linked with paraformaldehyde. Then cells were lysed and digested with shearing enzyme followed by sonication. Anti-ZBTB32 antibody (ab235306; Abcam), Anti-HA-tag antibody (HA-Tag [C29F4] Rabbit mAb #3724; Cell Signaling), and Anti-NCoR antibody (A301-145A; Thermo Fisher Scientific) were added to supernatant followed by Dynabeads Protein A (Life Technologies) pulling down target fragment. The precipitated DNA was then washed, eluted, de-crosslinked, and purified for real-time qPCR analysis or sent to BGI Genomics for cDNA library preparation and sequencing. The following DNA fragments were amplified with primers as described: Gzmb-1-F: 5′-ATGACTGAGTTTGGGGTGAGGG-3′, Gzmb-1-R: 5′-GTG-AGTAAGCAACACCTTCCTT-3′; Havcr2-1-F: 5′-GTGTGTATGGC-TGCGTCATGCT-3′, Havcr2-1-R: 5′-CTACATGAGAGCATGCCTCAAA-3′; Prdm1-1-F: 5′-TTGGGCAGGTTCTCGCTAGCT-3′, Prdm1-1-R: 5′-ATGATGAAAGACTCTGAAGTCT-3′; Id2-1-F: 5′-TTCGCAGCCAATGCCTGTAGG-GT-3′, Id2-1-R: 5′-TAGCGACCTGTGACTTCCCGTCTG-3′; and Id2-2-F: 5′-TTGGAGCAA-CGCGGGAGGCCTT-3′, Id2-2-R: 5′-TAGTAACCCTGCCTCATTCTTGG-3′.
scRNA-seq analysis
scRNA-seq datasets were obtained from public resources GSE120575 (SKCM) and GSE122675 (B16) in the GEO database. Seurat (version 4.1) was used to perform dimensional reduction and clustering analysis of single-cell data. For dimensional reduction, t-distributed stochastic neighbor embedding (tSNE) was used for analysis. FindNeighbors and FindClusters function were used to cluster cells with a resolution of 1.0.
Statistical analysis
All statistical analysis was performed with Graph Prism 8.0.2 (GraphPad Prism software), and the results were presented as mean ± SEM. For two group comparisons, statistical analysis was performed using unpaired or paired two-tailed Student’s t tests. Tumor growths were compared using Bonferroni-corrected two-way ANOVA. The log-rank (Mantel–Cox) test was employed to determine statistical significance of the survival of tumor-bearing mice and the survival of cancer patients from TCGA. Pearson r correlation values were calculated to evaluate the strength of the relationship between the expression patterns of individual genes or gene signatures. P values were calculated and presented in most of the data with *P < 0.05; **P < 0.01; ***P < 0.001; ****P < 0.0001.
Online supplemental material
Fig. S1 shows how Zbtb32 enriched in Ttex CD8+ TILs benefits clinical outcome. Fig. S2 shows how Zbtb32 ablation worsens CD8+ T cell anti-tumor capability. Fig. S3 shows how Zbtb32 exerts a long-term influence on CD8+ T cells in tumor, but not in other immune organs. Fig. S4 shows how Zbtb32 transcriptionally regulates Ttex TIL function. Fig. S5 shows how Zbtb32 displays similar binding propensity but opposing regulation with Bcl6 in CD8+ T cells.
Data availability
Data from ATAC-seq of WT and Zbtb32−/− OT-I cells co-transferred into B16-OVA–bearing mice in Fig. 8 and Fig. 9 D are available in the GEO database under accession no. GSE284603. Data from RNA-seq of WT and Zbtb32−/− OT-I cells co-transferred into B16-OVA–bearing mice in Fig. 7, D–H; Fig. 10 A; Fig. S4, D–F; and Fig. S5, C and D are available in the GEO database under accession no. GSE284604. ChIP-seq of Zbtb32 in CD8+ T cells in Fig. 9, A–D; Fig. 10 B; and Fig. S5, A, B, D, and H are available in the GEO database under accession no. GSE284605.
Acknowledgments
We thank H. Qi from the Institute for Immunology at Tsinghua University in Beijing, China for providing Zbtb32−/− mice and X. Liu from South West Hospital at The Army Medical University in Chongqing, China for providing P14 mice. We thank the core facility of the Institute for Immunology at Tsinghua University for FACS sorting.
This work was supported by grants from the Natural Science Foundation of China (31991173 and 31991170), National Key Research and Development Program of China (2021YFC2302403), and Chinese Academy of Medical Sciences (CAMS) Innovation Fund for Medical Sciences (2022-I2M-5-01).
Author contributions: Birui Pan: conceptualization, data curation, formal analysis, investigation, project administration, software, supervision, validation, visualization, and writing—original draft, review, and editing. Qinli Sun: conceptualization, investigation, methodology, resources, and supervision. Ruifeng Li: data curation, visualization, and writing—original draft. Juan Feng: methodology. Jing Hao: resources. Bowen Xie: methodology and writing—review and editing. Xiaohong Zhao: data curation. Zixuan Zhao: resources. Peng Wei: methodology and resources. Qiuyan Lan: investigation and resources. Shiyuan Xie: formal analysis. Tian Xie: investigation. Yongzhen Chen: methodology. Kun Wei: resources. Xuan Zhong: validation. Hai Qi: resources. Ling Ni: formal analysis, supervision, and writing—original draft and writing—review and editing. Chen Dong: conceptualization, formal analysis, funding acquisition, project administration, and writing—original draft, review, and editing.
References
Author notes
Disclosures: The authors declare no competing interests exist.