


Proteasome activity is crucial for cellular integrity, but how tissues adjust proteasome content in response to catabolic stimuli is uncertain. Here, we demonstrate that transcriptional coordination by multiple transcription factors is required to increase proteasome content and activate proteolysis in catabolic states. Using denervated mouse muscle as a model system for accelerated proteolysis in vivo, we reveal that a two-phase transcriptional program activates genes encoding proteasome subunits and assembly chaperones to boost an increase in proteasome content. Initially, gene induction is necessary to maintain basal proteasome levels, and in a more delayed phase (7–10 days after denervation), it stimulates proteasome assembly to meet cellular demand for excessive proteolysis. Intriguingly, the transcription factors PAX4 and α-PALNRF-1 control the expression of proteasome among other genes in a combinatorial manner, driving cellular adaptation to muscle denervation. Consequently, PAX4 and α-PALNRF-1 represent new therapeutic targets to inhibit proteolysis in catabolic diseases (e.g., type-2 diabetes, cancer).
Introduction
Proteasome function is essential for vitality of all cells. By catalyzing the degradation of most cellular proteins (normal, unfolded, misfolded, or damaged), the proteasome sustains cellular integrity, biological functions, and tissue homeostasis. Conversely, impaired proteasome function is associated with protein accumulation and aggregation in age-related pathologies and neurodegenerative diseases (Dantuma and Bott, 2014). To withstand such diseases and compensate for the lost proteasome function, cells appear to have evolved mechanisms to increase proteasome production (Mitsiades et al., 2002; Meiners et al., 2003; Khandros et al., 2012).
Increasing the capacity for protein degradation in vivo is also important for survival during fasting when accelerated proteolysis in muscle produces amino acids that are converted to glucose by the liver to nurture the brain, although in the rapid atrophy induced by fasting, the primary physiological mechanism to increase protein degradation in vivo is believed to be more through post-synthetic modification of proteasomes rather than the production of new proteasomes (VerPlank et al., 2019). Generally, such physiological demands are met via the regulation of proteasome abundance by activation of proteasome gene expression or by post-synthetic mechanisms. Certain transcription factors have been reported to increase the expression of specific proteasome subunit genes to maintain basal levels of assembled active proteasomes (Vilchez et al., 2012; Xu et al., 2012) or to respond to proteasome inhibition in cultured cells (Steffen et al., 2010; Radhakrishnan et al., 2010). However, a more global response to boost proteasome content (expression and assembly) is probably necessary to meet cellular demand for excessive proteolysis in physiological catabolic states.
Coordinated induction of proteasome subunits and various ubiquitin-proteasome system (UPS) components are primarily responsible for the increased degradation of muscle proteins during atrophy (Lecker et al., 2004; Jagoe et al., 2002; Sacheck et al., 2007). The resulting loss of muscle mass and strength is an inevitable sequel of many systemic catabolic states (e.g., cancer, inactivity, and malnutrition) and leads to frailty, disability, morbidity, and mortality (Cohen et al., 2015). Because proteasome subunit genes are induced in most types of atrophy, animal models for muscle atrophy serve as an optimal in vivo system in a whole organism to address critical questions related to proteasome gene expression, assembly, and regulation.
The proteasome is a large, multiprotein complex composed of at least 33 subunits. The 20S core contains the proteolytic sites shielded within a cylindrical chamber, which is capped by a regulatory particle, the most common of which is the 19S regulator. Six AAA–ATPase subunits (Rpt1-6) form the base of the 19S cap and are responsible for unfolding substrates, opening the chamber of the 20S core, and translocating substrates to the proteolytic core (Bar-Nun and Glickman, 2012). The remainder of the 19S cap is composed of non-ATPase subunits (Rpn subunits), which recognize polyubiquitylated protein substrates and remove ubiquitin from them (Fu et al., 2001). At least five chaperones are involved in the assembly of the 20S core, namely proteasome assembly chaperones (PAC) 1–4 and proteasome maturation protein (POMP), while four chaperones are involved in the assembly of the Rpt ring that are conserved between yeast and mammals: PAAF1/Rpn14, Nas6/gankyrin, Nas2/p27, and Hsm3/S5b (Kaneko et al., 2009; Roelofs et al., 2009; Park et al., 2009). With 33 subunits required to work in concert, proteasome gene induction must be centrally orchestrated by transcription factors. Here, we report a novel mechanism elevating proteasome production in vivo, which involves the coordinated functions of two transcription factors, PAX4 and α-PALNRF-1.
We recently studied in mice the atrophy induced by muscle denervation and uncovered a delayed phase in the atrophy process, which involves the induction of genes that promote proteolysis by the transcription factor PAX4. PAX4 was originally identified as a transcriptional repressor in beta islet cells during pancreatic development (Ritz-Laser et al., 2002; Petersen et al., 2000; Smith et al., 1999), and its potential roles in muscle (or other tissues) had been generally overlooked. We discovered that this transcription factor induces the AAA-ATPase p97/VCP, the ubiquitin ligases MuRF1 and NEDD4, and the proteasome subunit PSMC2 (Rpt1) in the late stage of atrophy (10 days after denervation), and its function is crucial for degradation of ubiquitylated contractile myofibrils (Volodin et al., 2017). This second phase of gene expression during atrophy, when myofibril breakdown is rapid, occurs long after induction of the major atrophy-related genes by the transcription factors FOXO3 (Sandri et al., 2004; Bodine et al., 2001).
An established transcription factor for proteasome genes in cultured cells treated with proteasome inhibitors is a nuclear factor, erythroid 2 like 1, known as NRF-1 (gene name NFE2L1) (Radhakrishnan et al., 2010; Steffen et al., 2010). Here, we investigated another ubiquitously expressed transcription factor, nuclear respiratory factor 1, known as NRF-1 or α-PAL (gene name NRF1). Because these two distinct genes are commonly confused in the literature due to nearly identical abbreviations, we adopted the abbreviations used by Zhang: NRF-1NFE2L1 (Nuclear factor, erythroid 2 like 1) and α-PALNRF-1 (nuclear respiratory factor 1) (Zhang et al., 2020). ChIP-sequencing data from cultured SK-N-SH human neuroblastoma cells and analyses of the Encyclopedia of DNA Elements (ENCODE) data suggested that α-PALNRF-1 may regulate proteasome genes (Satoh et al., 2013; Bhawe and Roy, 2018); however, these data were not further verified. We show here that α-PALNRF-1 is of prime importance in the induction of most proteasome genes in denervated mouse muscle in vivo. Its function seems to be coordinated with PAX4, representing a new mode of regulation of proteasome gene expression.
Results
Two-phase differential expression of proteasome genes in atrophying mouse muscle in vivo
To understand proteasome dynamics during adaptation to a changing physiological environment, we studied denervated mouse muscles, which due to accelerated proteolysis primarily by the UPS lost ∼60% of their mass in 28 days (Fig. 1 A). During denervation-induced atrophy, proteolysis gradually rises, allowing the investigation of multiple cellular phases of this debilitating process (Volodin et al., 2017). The sciatic nerve of adult mice was transected and the muscles were analyzed 3–28 days later and compared with innervated controls. Denervation led to a gradual decrease in mass of tibialis anterior (TA) (13.6% loss at 3 days and 56.3% loss at 28 days) and gastrocnemius (GA) (11.5% loss at 3 days and 65.4% loss at 28 days) skeletal muscles (Fig. 1 A). This loss of mass was accompanied by a gradual decrease in muscle fiber size (cross-sectional area) (Fig. 1 B, statistics in Table 1) and the absolute content of the insoluble fraction (cytoskeletal and myofibrillar proteins, which comprise 70% of muscle proteins) (Fig. 1 C), consistent with prior studies (Sato et al., 2009; Cohen et al., 2009; Sacheck et al., 2007).

Time course of mouse muscle atrophy after denervation. The sciatic nerve of adult WT mice was transected, and TA and GA muscles were collected at several time points later. (A–C) Muscle weight (A), muscle fiber size (B), and total amount of insoluble fraction (C) decrease after denervation. The atrophy seen over time results primarily from the accelerated degradation of muscle proteins. (A) Mean muscle weights of denervated TA and GA muscles are presented as a percentage of innervated controls ± SEM. N = 5 mice per time point. *, P < 0.05 versus innervated by one-tailed unpaired Student’s t test. (B) Measurements of cross-sectional areas of 5,143 (3 days, n = 4 mice), 2,887 (7 days, n = 4 mice), 5,878 (14 days, n = 4 mice), 1,480 (28 days, n = 4 mice) fibers in denervated muscles and an identical number of fibers in innervated controls. Statistics in Table 1. (C) Mean total content of insoluble fraction per TA muscle at different times after denervation is depicted as the percent of innervated controls ± SEM. N = 3 mice per time point. *, P < 0.05 versus innervated by one-tailed unpaired Student’s t test.
Time course of mouse muscle atrophy after denervation. The sciatic nerve of adult WT mice was transected, and TA and GA muscles were collected at several time points later. (A–C) Muscle weight (A), muscle fiber size (B), and total amount of insoluble fraction (C) decrease after denervation. The atrophy seen over time results primarily from the accelerated degradation of muscle proteins. (A) Mean muscle weights of denervated TA and GA muscles are presented as a percentage of innervated controls ± SEM. N = 5 mice per time point. *, P < 0.05 versus innervated by one-tailed unpaired Student’s t test. (B) Measurements of cross-sectional areas of 5,143 (3 days, n = 4 mice), 2,887 (7 days, n = 4 mice), 5,878 (14 days, n = 4 mice), 1,480 (28 days, n = 4 mice) fibers in denervated muscles and an identical number of fibers in innervated controls. Statistics in Table 1. (C) Mean total content of insoluble fraction per TA muscle at different times after denervation is depicted as the percent of innervated controls ± SEM. N = 3 mice per time point. *, P < 0.05 versus innervated by one-tailed unpaired Student’s t test.
Statistical analysis of fiber size measurements
| Innervated | Denervated | % Change | ||
|---|---|---|---|---|
| 3-day denervation (Fig. 1 B) | Median | 3706 | 3084 | −20.63 |
| Skewness | 0.27 | 0.43 | −37.2 | |
| Brunner-Manzel test: P value = 1.00E+00 | ||||
| A-statistic = 0.61 | ||||
| 7-day denervation (Fig. 1 B) | Innervated | Denervated | % Change | |
| Median | 3452 | 2842 | −21.46 | |
| Skewness | 1.16 | 0.3 | −287 | |
| Brunner-Manzel test: P value = 1.00E+00 | ||||
| A-statistic = 0.63 | ||||
| 14-day denervation (Fig. 1 B) | Innervated | Denervated | % Change | |
| Median | 2779 | 2058 | −35.03 | |
| Skewness | 1.03 | 0.8 | −23 | |
| Brunner-Manzel test: P value = 1.00E+00 | ||||
| A-statistic = 0.62 | ||||
| 28-day denervation (Fig. 1 B) | Innervated | Denervated | % Change | |
| Median | 3411 | 2358 | −44.65 | |
| Skewness | 0.18 | 0.67 | 73.13 | |
| Brunner-Manzel test: P value = 1.00E+00 | ||||
| A-statistic = 0.68 | ||||
| shGankyrin (Fig. 3 D) | Non-transfected | Transfected | % Change | |
| Median | 1482 | 1772 | 19.56 | |
| Skewness | 0.94 | 1.80 | 91.23 | |
| Brunner-Manzel test: P value = 2.94E−12 | ||||
| A-statistic = 0.28 | ||||
| shPAX4 (Fig. 4 B) | Non-transfected | Transfected | % Change | |
| Median | 1883 | 2155 | 14.4 | |
| Skewness | 0.94 | 0.92 | −2.13 | |
| Brunner-Manzel test: P value = 0.00E+00 | ||||
| A-statistic = 0.38 | ||||
Summary statistics for fiber size analyses that are presented in Fig. 1 B; Fig. 3 D; and Fig. 4 B, based on our recent methodology paper (Gilda et al., 2021). Regarding A-statistic, if 0 ≤ A<0.5 then dataset1 (non-transfected) is stochastically less than dataset2 (transfected). If 0.5 ≤ A<1 then dataset1 (innervated) is stochastically greater than dataset2 (denervated). The A-statistics is a direct measure of the fiber size effect (Gilda et al., 2021), and it shows a beneficial effect on cell size by the specific shRNAs. Such an effect can be simply missed by traditional measurements of median, average, and Student’s t test.
Our previous studies indicated atrophy as a two-phase process involving an early (3–7 days post-denervation) loss of the desmin cytoskeleton, followed by a more delayed (at 10–14 days) increase in myofibril ubiquitylation and degradation by the UPS (Cohen et al., 2009; Volodin et al., 2017). While the rate of muscle loss peaks early in atrophy (3 days after denervation) (Sacheck et al., 2007), overall protein degradation is highest later in atrophy (Roseno et al., 2015; Argadine et al., 2009; Cohen et al., 2009). To determine how the expression of UPS genes is coordinated within these two phases of proteolysis, we analyzed atrophying muscles at different times after denervation by RT-PCR and compared them with innervated control muscles. Expression of proteasome subunit genes was analyzed according to subunit type along with their corresponding chaperones. Prior investigations on cultured cells or yeast showed that all proteasome genes rise at the same time (Boos et al., 2019). However, when investigated in atrophying adult mouse skeletal muscles in vivo, we surprisingly show distinct dynamics of proteasome gene expression during physiological adaptation to catabolic cues (e.g., muscle denervation). Gene expression of PSMC1 (Rpt2), PSMC4 (Rpt3), and PSMC5 (Rpt6) increased by 1.5–2.5-fold on average by 3 days after denervation and remained fairly steady until 28 days (Fig. 2 A). Early induction of PSMC4 (Rpt3) and PSMC5 (Rpt6) aligns with previous findings demonstrating the module formation of PSMC4 (Rpt3)-PSMC5 (Rpt6) and associated chaperones as the rate-limiting step for overall proteasome assembly (Hanssum et al., 2014; Saeki et al., 2009; Li et al., 2017). The gene expression pattern of PSMC2 (Rpt1), PSMC6 (Rpt4), and PSMC3 (Rpt5) showed more dynamic two-phase behavior, with higher overall induction and peaks in expression at 3–7 and 14 days after denervation (Fig. 2 B).
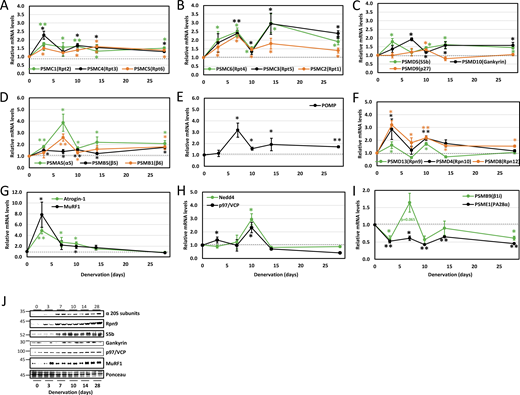
Two-phase differential expression of proteasome genes in atrophying mouse muscle in vivo. (A–I) Time course of induction of selected proteasome and chaperone genes and UPS components was determined by RT-PCR analysis of mRNA preparations from TA muscles at 3, 7, 10, 14, and 28 days after denervation. Means ± SEM are presented as a ratio to innervated muscles. N = 7 mice per time point. *, P < 0.05; **P < 0.001 versus innervated by one-tailed unpaired Student’s t test. (J) Increased protein levels were confirmed for representative genes by analysis of soluble fractions from innervated and denervated muscles by SDS-PAGE and immunoblotting. Source data are available for this figure: SourceData F2.
Two-phase differential expression of proteasome genes in atrophying mouse muscle in vivo. (A–I) Time course of induction of selected proteasome and chaperone genes and UPS components was determined by RT-PCR analysis of mRNA preparations from TA muscles at 3, 7, 10, 14, and 28 days after denervation. Means ± SEM are presented as a ratio to innervated muscles. N = 7 mice per time point. *, P < 0.05; **P < 0.001 versus innervated by one-tailed unpaired Student’s t test. (J) Increased protein levels were confirmed for representative genes by analysis of soluble fractions from innervated and denervated muscles by SDS-PAGE and immunoblotting. Source data are available for this figure: SourceData F2.
The Rpt subunits are first assembled into dimers before incorporation into the hexameric Rpt ring that forms the base of the 19S cap. PSMC2 (Rpt1) and PSMC1 (Rpt2) are assembled into a heterodimer by the chaperone PSMD5 (S5b); PSMC4 (Rpt3) and PSMC5 (Rpt6) by the chaperone gankyrin; and PSMC6 (Rpt4) and PSMC3 (Rpt5) by p27 (Takagi et al., 2012). Genes for PSMD5 (S5b), PSMD10 (gankyrin), and PSMD9 (p27) were induced by day 10 after denervation (Fig. 2 C). This implies that chaperones present in denervated muscle before this time should sustain basal proteasome biogenesis, adequate for carrying out the muscle loss at this early phase of atrophy (3–7 days after denervation). Then, chaperone levels are elevated at 7 days, most likely to induce proteasome assembly, just when myofibril disassembly and destruction is accelerated (10–14 days after denervation) (Cohen et al., 2009; Volodin et al., 2017; Aweida and Cohen, 2021).
To assess the induction of other proteasome subunits in the delayed phase of atrophy, we examined the expression of 20S subunits PSMA5 (α5), PSMB5 (β5), and PSMB1 (β6), which were all elevated in denervated muscle by day 7 (Fig. 2 D). POMP, a 20S chaperone, peaked at 7 days after denervation (Fig. 2 E), most likely to boost proteasome biogenesis just before protein degradation is accelerated (Volodin et al., 2017; Cohen et al., 2009). Additionally, Rpn subunits [PSMD13 (Rpn9), PSMD4 (Rpn10), and PSMD8 (Rpn12)] showed initial induction at 3 days after denervation, with a subsequent rise at 10 days (Fig. 2 F).
Expression of most genes approached baseline at 14 days after denervation but remained significantly elevated until 28 days (Fig. 2, A–F). Accordingly, RNA sequencing (RNA-Seq) of TA muscles at 14 days post-denervation showed that only nine subunits were notably induced in denervated muscles (14 days) compared with innervated controls, including PSMA7 (α4), PSMA5 (α5), PSMB5 (β5), PSMB4 (β7), PSMB3 (β3), PSMB1 (β6), PSMD8 (Rpn12), PSMD13 (Rpn9), and PSMD4 (Rpn10) (Fig. S1 A).
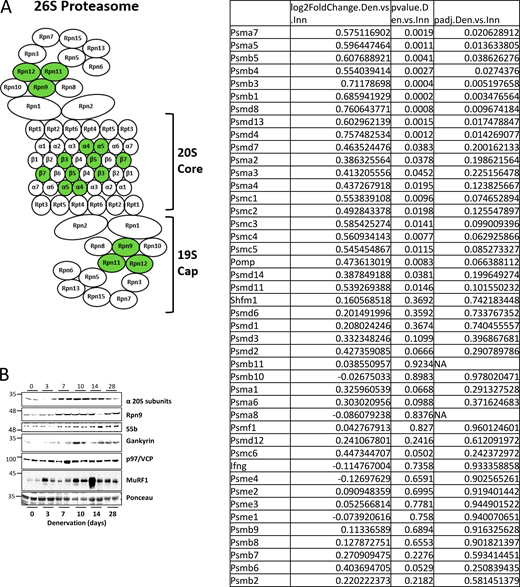
Expression of most proteasome genes’ return to basal levels in muscle at 14 days after denervation. (A) To gain a broad view of transcriptional changes in the late phase of atrophy, 14-day denervated TA muscles were compared with innervated muscles by RNA-seq. Transcripts of several proteasome subunits and one proteasome chaperone were identified, and only nine subunits were significantly induced in denervated compared to innervated muscles (induced subunits shown in green). (B) Increased protein levels were confirmed for representative genes by analysis of soluble fractions from innervated and denervated muscles by SDS-PAGE and immunoblotting. Source data are available for this figure: SourceData FS1.
Expression of most proteasome genes’ return to basal levels in muscle at 14 days after denervation. (A) To gain a broad view of transcriptional changes in the late phase of atrophy, 14-day denervated TA muscles were compared with innervated muscles by RNA-seq. Transcripts of several proteasome subunits and one proteasome chaperone were identified, and only nine subunits were significantly induced in denervated compared to innervated muscles (induced subunits shown in green). (B) Increased protein levels were confirmed for representative genes by analysis of soluble fractions from innervated and denervated muscles by SDS-PAGE and immunoblotting. Source data are available for this figure: SourceData FS1.
Further studies determined expression patterns of key UPS components promoting proteolysis in muscle atrophy. The ubiquitin ligases MuRF1 and atrogin-1, which are required for atrophy, peaked at 3 days and returned to basal levels (Sacheck et al., 2007; Bodine et al., 2001) (Fig. 2 G). Distinctly, Nedd4 and p97/VCP expression peaked at a delayed phase (10 days) (Fig. 2 H), as previously shown (Piccirillo and Goldberg, 2012; Volodin et al., 2017). These findings extend our prior studies on PSMC2 (Rpt1) (Volodin et al., 2017), revealing that a global transcriptional program induces proteasome and UPS component genes in early (certain Rpt and Rpn subunits, MuRF1, and atrogin-1) and delayed (20S, certain Rpt and Rpn subunits, Nedd4, and p97/VCP) phases of atrophy.
Notably, the transcript levels of the alternate regulatory particle PSME1 (PA28α) decreased by ∼50% after denervation (Fig. 2 I). Additionally, expression of the catalytic subunit of immunoproteasomes, PSMB9 (β1i), decreased or remained unchanged (Fig. 2 I), despite the increased proteasome chaperones (Fig. 2, C and E) and assembly (see below, Fig. 3). These findings indicate a selective induction of constitutive proteasome holoenzyme biogenesis.
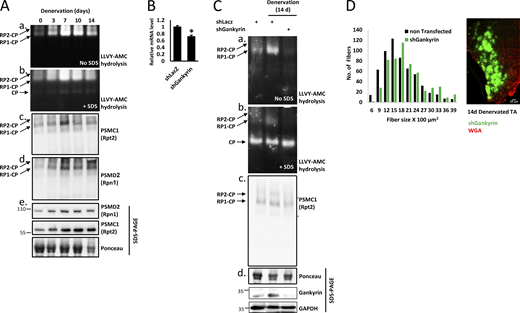
Increased proteasome assembly is a delayed response to muscle denervation. (A) Innervated and denervated muscle homogenates were analyzed by native polyacrylamide gel electrophoresis and in-gel LLVY-AMC (β5 proteasome substrate) hydrolysis. The native gel was then photographed and visualized under UV light to detect the activities of proteasome holoenzyme complexes (RP2-CP, RP1-CP); 20S activity was detected by the addition of SDS (panel b). The native gel was then subjected to immunoblotting for PSMC1(Rpt2) and PSMD2 (Rpn1) in native (panels c and d) and denaturing (panel e) gels. (B) shGankyrin downregulates gankyrin in NIH-3T3 cells. mRNA preparations from cells transfected with shLacz control or shGankyrin were analyzed by RT-PCR and specific primers to gankyrin. Means ± SEM are presented as a ratio to shLacz. N = 3 wells of cells per shRNA. *, P < 0.05 versus shLacz by one-tailed paired Student’s t test. (C) Gankyrin is required for proteasome assembly in atrophying mouse muscles. Innervated and denervated TA muscles expressing shGankyrin or scrambled shLacz (control) were analyzed by native gel and in-gel LLVY-AMC hydrolysis assay. (D) Downregulation of gankyrin in denervated muscles attenuates fiber atrophy. Measurements of cross-sectional areas of 590 fibers expressing shGankyrin (green fibers, also express GFP) and adjacent 590 non-transfected fibers. N = 5 mice. Statistics in Table 1. A representative image of electroporated muscle is shown. Fiber membrane staining (red) using wheat germ agglutinin (WGA). Scale bar: 50 μm. Source data are available for this figure: SourceData F3.
Increased proteasome assembly is a delayed response to muscle denervation. (A) Innervated and denervated muscle homogenates were analyzed by native polyacrylamide gel electrophoresis and in-gel LLVY-AMC (β5 proteasome substrate) hydrolysis. The native gel was then photographed and visualized under UV light to detect the activities of proteasome holoenzyme complexes (RP2-CP, RP1-CP); 20S activity was detected by the addition of SDS (panel b). The native gel was then subjected to immunoblotting for PSMC1(Rpt2) and PSMD2 (Rpn1) in native (panels c and d) and denaturing (panel e) gels. (B) shGankyrin downregulates gankyrin in NIH-3T3 cells. mRNA preparations from cells transfected with shLacz control or shGankyrin were analyzed by RT-PCR and specific primers to gankyrin. Means ± SEM are presented as a ratio to shLacz. N = 3 wells of cells per shRNA. *, P < 0.05 versus shLacz by one-tailed paired Student’s t test. (C) Gankyrin is required for proteasome assembly in atrophying mouse muscles. Innervated and denervated TA muscles expressing shGankyrin or scrambled shLacz (control) were analyzed by native gel and in-gel LLVY-AMC hydrolysis assay. (D) Downregulation of gankyrin in denervated muscles attenuates fiber atrophy. Measurements of cross-sectional areas of 590 fibers expressing shGankyrin (green fibers, also express GFP) and adjacent 590 non-transfected fibers. N = 5 mice. Statistics in Table 1. A representative image of electroporated muscle is shown. Fiber membrane staining (red) using wheat germ agglutinin (WGA). Scale bar: 50 μm. Source data are available for this figure: SourceData F3.
Western Blot analysis of representative genes showed that the increased mRNA levels largely correlated with protein levels, rising at 7 days and persisting till 28 days (Fig. 2 J and Fig. S1 B). Rpn9 gene expression pattern followed two waves of induction, with protein levels notably rising only by 7 days (Fig. 2 J and Fig. S1 B), preceding the accelerated proteolysis in muscle. Moreover, MuRF1 mRNA peaked at 3 days and returned to baseline, yet its protein levels remained elevated til 28 days (Fig. 2 J and Fig. S1 B). Additionally, p97/VCP peaked at 10 days, while its protein levels showed a moderate, steady increase (Fig. 2 J and Fig. S1 B).
Increased proteasome assembly is a delayed response to muscle denervation
Since PSMD9 (p27), the chaperone for PSMC6 (Rpt4) and PSMC3 (Rpt5), was induced later (10 days, Fig. 2 C), proteasome biogenesis was expected in a delayed phase, when new assembly modules were formed via gene expression. Consequently, chaperones and assembly modules present in muscle between 3 and 7 days after denervation were probably sufficient to meet cellular demand. To determine if the increased proteasome gene and protein expression was coordinated with proteasome assembly, we assayed proteasome activity in innervated and denervated muscles by native gel electrophoresis and in-gel proteasome activity assay using the fluorogenic substrate, LLVY-AMC (Elsasser et al., 2005). Most changes in gene expression occurred between 3 and 14 days; thus, denervated muscle homogenates from 3–14 days after denervation and innervated controls were analyzed. As shown in Fig. 3 A, total activities of singly- and doubly-capped proteasome holoenzyme complexes (RP1-CP, RP2-CP) increased by 3 days and were dramatically elevated at 7–10 days (Fig. 3, A, a and b), aligning with elevated expression of most proteasome subunits and chaperones (Fig. 2, A–F), just before myofibril breakdown is accelerated (Cohen et al., 2009). Conversely, changes in the activity of the 20S core particle (CP) were minimal, suggesting that excessive proteolysis in atrophying muscle was carried out by the proteasome holoenzyme complexes, rather than 20S CP alone (Fig. 3 A; RP2-CP and RP1-CP versus CP). Increased proteasome activity partly stemmed from higher abundance of assembled proteasome holoenzymes, as confirmed by immunoblotting of native and SDS gels for representative proteasome subunits, PSMC1 (Rpt2) and PSMD2 (Rpn1) (Fig. 3, A, c–e).
We then tested if induction of proteasome chaperones POMP, PSMD5 (S5b), PSMD10 (gankyrin), and PSMD9 (p27) in denervated muscles (Fig. 2, C and E) was required for boosting proteasome biogenesis during muscle atrophy. For this purpose, we downregulated gankyrin via electroporation of a specific shRNA (shGankyrin) into TA muscles, which reduced gankyrin mRNA levels below shLacz expressing controls (Fig. 3 B). This in vivo electroporation method determines transient gene effects on proteolysis and cell size within days (Gilda et al., 2021; Goldbraikh et al., 2020). To assess the cumulative effects of chaperone downregulation, we analyzed transfected muscles at 14 days after denervation using in-gel proteasome activity (Fig. 3 C). We observed dramatically reduced proteasome assembly in denervated muscles expressing shGankyrin below baseline levels of assembled proteasome holoenzymes in innervated controls (expressing shLacz) (Fig. 3 C, see RP2-CP and RP1-CP). Decreased proteasome activity in shGankyrin-expressing muscles was partly due to disrupted proteasome assembly (Fig. 3, C and c). This reduction in assembled proteasomes significantly attenuated protein breakdown and atrophy, as evident by the larger cross-sectional area of 14 days denervated muscle fibers expressing shGankyrin (also express GFP) compared with adjacent non-transfected fibers (Fig. 3 D, statistics in Table 1). Thus, a second wave of gene induction (7–10 days post-denervation), when most proteasome genes and assembly chaperons (e.g., gankyrin) are elevated, appears essential to boost proteasome biogenesis and meet the physiological demand for accelerated proteolysis.
PAX4 induces proteasome subunit genes in vivo
We previously showed that PAX4 is required for inducing the proteasome subunit PSMC2 (Rpt1) and the atrophy-related genes MuRF1, p97/VCP, and Nedd4 at 10 days after denervation (Volodin et al., 2017). To determine if PAX4 regulates other proteasome subunits and/or chaperones, we searched the promoter regions of these genes for potential PAX4 binding sites using the FIMO (Find Individual Motif Occurrences) algorithm (Grant et al., 2011), using the human PAX4 motif (MA0068.2). We identified 13 proteasome genes that contain potential PAX4 binding sites (Table S4 A), indicating that PAX4 likely stimulates their induction in denervated muscle. To clarify PAX4’s role in vivo, we transiently suppressed its expression by electroporation of a specific shRNA plasmid (shPAX4, validated in Volodin et al. [2017]) into denervated mouse TA. At 10 days after denervation, all 13 analyzed proteasome genes and the ubiquitin ligases MuRF1 and atrogin-1 significantly increased (Fig. 4 A); however, PAX4 downregulation with shPAX4 resulted in marked decreases in PSMA5 (α5), PSMC2 (Rpt1), PSMC1 (Rpt2), PSMC3 (Rpt5), PSMD13 (Rpn9), MuRF1, and atrogin-1 expression, indicating that PAX4 is required for their induction (Fig. 4 A). Consequently, PAX4 is required for the induction of genes that promote ubiquitylation and proteolysis. Accordingly, PAX4 downregulation significantly attenuated muscle fiber atrophy at 10 days after denervation (Fig. 4 B, statistics in Table 1), indicating a beneficial effect on muscle that results from reduced proteolysis (Gilda et al., 2021).
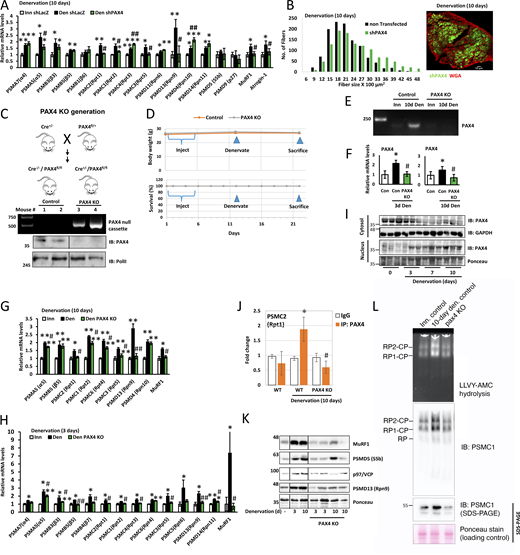
PAX4 induces proteasome genes in vivo. (A) Proteasome gene expression was measured by RT-PCR analysis of mRNA preparations from innervated and 10-day denervated muscles expressing shPAX4 or shLacz control. Means ± SEM are presented as a ratio to innervated. N = 5 mice per condition. *, P < 0.05, **, P < 0.005, ***, P < 0.0005 versus innervated shLacz; #, P < 0.05 and ##, P < 0.005 versus denervated shLacz by one-tailed unpaired Student’s t test. (B) PAX4 downregulation with shPAX4 reduces fiber atrophy on denervation. Measurement of cross-sectional areas of 1,178 fibers from 10-day denervated fibers expressing shPAX4 (green fibers, also express GFP) vs. 1,178 adjacent non-transfected fibers. N = 3 mice. Statistics in Table 1. Right: representative image of transfected muscle. Fiber membrane staining (red) using WGA. Scale bar: 50 μm. (C) Top: Strategy for generating PAX4 conditional KO mice. Middle: DNA was isolated from tail snippings and analyzed by PCR genotyping. Following tamoxifen injections of Cre+/−/PAX4fl/fl mice, removal of PAX4 from the genome was verified using the P1/P3 primers (Table S3). Bottom: nuclear extracts from WT and KO mice were analyzed by immunoblotting using PAX4 antibody. (D) Body weight (g) and survival (%) of PAX4 KO and WT mice are presented, following tamoxifen injections and muscle denervation. (E and F) PAX4 mRNA levels increase on denervation of WT mouse muscle but are absent in muscles from PAX4 KO mice. Mice were injected with tamoxifen and their muscles denervated. PCR (E) or RT-PCR (F) using primers for PAX4 was performed on mRNA preparations from innervated and denervated muscles. Means ± SEM are presented as a ratio to WT innervated. N = 5 mice per condition. *, P < 0.05 versus innervated in WT; #, P < 0.05 versus denervated in WT by one-tailed unpaired Student’s t test. (G and H) Proteasome gene expression was measured by RT-PCR analysis of mRNA preparations from innervated and 10 days (G) or 3 days (H) denervated muscles from WT and PAX4 KO mice. Means ± SEM are presented as ratio to WT innervated. N = 5 mice per condition. *, P < 0.05 and **P < 0.005 vs. innervated in WT; #, P < 0.05 and ##, P < 0.005 versus denervated in WT by one-tailed unpaired Student’s t test. (I) PAX4 enters the nucleus at 3 days after denervation. Cytosolic and the corresponding nuclear fractions from innervated and denervated (at 3, 7, 10 days) muscles were analyzed by SDS-PAGE and immunoblotting. (J) PAX4 binds the promoter region of PSMC2 gene. ChIP was performed on innervated and denervated (10 days) muscles from WT or PAX4 KO mice using PAX4 antibody or non-specific IgG control, and primers for the PSMC2 gene. Data are plotted as mean fold change relative to IgG control ± SEM and represents three independent experiments. N = 3 mice per condition. *, P < 0.05 versus IgG in WT; #P < 0.05 versus denervated in WT by one-tailed unpaired Student’s t test. (K) Correlative reduction in protein levels was confirmed for representative genes by analysis of soluble fractions from innervated and denervated muscles from WT or PAX4 KO mice by SDS-PAGE and immunoblotting. (L) The content of active assembled proteasomes increase in denervated muscles, but not in muscles lacking PAX4. Measurement of proteasome content by native gels and immunoblotting and proteasome peptidase activity by LLVY-AMC hydrolysis. Source data are available for this figure: SourceData F4.
PAX4 induces proteasome genes in vivo. (A) Proteasome gene expression was measured by RT-PCR analysis of mRNA preparations from innervated and 10-day denervated muscles expressing shPAX4 or shLacz control. Means ± SEM are presented as a ratio to innervated. N = 5 mice per condition. *, P < 0.05, **, P < 0.005, ***, P < 0.0005 versus innervated shLacz; #, P < 0.05 and ##, P < 0.005 versus denervated shLacz by one-tailed unpaired Student’s t test. (B) PAX4 downregulation with shPAX4 reduces fiber atrophy on denervation. Measurement of cross-sectional areas of 1,178 fibers from 10-day denervated fibers expressing shPAX4 (green fibers, also express GFP) vs. 1,178 adjacent non-transfected fibers. N = 3 mice. Statistics in Table 1. Right: representative image of transfected muscle. Fiber membrane staining (red) using WGA. Scale bar: 50 μm. (C) Top: Strategy for generating PAX4 conditional KO mice. Middle: DNA was isolated from tail snippings and analyzed by PCR genotyping. Following tamoxifen injections of Cre+/−/PAX4fl/fl mice, removal of PAX4 from the genome was verified using the P1/P3 primers (Table S3). Bottom: nuclear extracts from WT and KO mice were analyzed by immunoblotting using PAX4 antibody. (D) Body weight (g) and survival (%) of PAX4 KO and WT mice are presented, following tamoxifen injections and muscle denervation. (E and F) PAX4 mRNA levels increase on denervation of WT mouse muscle but are absent in muscles from PAX4 KO mice. Mice were injected with tamoxifen and their muscles denervated. PCR (E) or RT-PCR (F) using primers for PAX4 was performed on mRNA preparations from innervated and denervated muscles. Means ± SEM are presented as a ratio to WT innervated. N = 5 mice per condition. *, P < 0.05 versus innervated in WT; #, P < 0.05 versus denervated in WT by one-tailed unpaired Student’s t test. (G and H) Proteasome gene expression was measured by RT-PCR analysis of mRNA preparations from innervated and 10 days (G) or 3 days (H) denervated muscles from WT and PAX4 KO mice. Means ± SEM are presented as ratio to WT innervated. N = 5 mice per condition. *, P < 0.05 and **P < 0.005 vs. innervated in WT; #, P < 0.05 and ##, P < 0.005 versus denervated in WT by one-tailed unpaired Student’s t test. (I) PAX4 enters the nucleus at 3 days after denervation. Cytosolic and the corresponding nuclear fractions from innervated and denervated (at 3, 7, 10 days) muscles were analyzed by SDS-PAGE and immunoblotting. (J) PAX4 binds the promoter region of PSMC2 gene. ChIP was performed on innervated and denervated (10 days) muscles from WT or PAX4 KO mice using PAX4 antibody or non-specific IgG control, and primers for the PSMC2 gene. Data are plotted as mean fold change relative to IgG control ± SEM and represents three independent experiments. N = 3 mice per condition. *, P < 0.05 versus IgG in WT; #P < 0.05 versus denervated in WT by one-tailed unpaired Student’s t test. (K) Correlative reduction in protein levels was confirmed for representative genes by analysis of soluble fractions from innervated and denervated muscles from WT or PAX4 KO mice by SDS-PAGE and immunoblotting. (L) The content of active assembled proteasomes increase in denervated muscles, but not in muscles lacking PAX4. Measurement of proteasome content by native gels and immunoblotting and proteasome peptidase activity by LLVY-AMC hydrolysis. Source data are available for this figure: SourceData F4.
Our findings reveal novel regulation of proteasome content, adapting cells to respond to catabolic stimuli. To verify PAX4’s essential role in the increased proteasome abundance upon denervation in vivo, we generated an inducible PAX4 knockout (KO) mouse. PAX4 is crucial in pancreatic islet differentiation during development, and mice lacking PAX4 die within days of birth due to severe diabetes, requiring the generation of inducible PAX4 KO animals (Xu et al., 2018; Sosa-Pineda et al., 1997). For this purpose, PAX4floxed (PAX4fl) mice (described in Kordowich et al. [2012]) were crossed with Cre+ transgenic mice to produce homozygous floxed PAX4 mice positive for Cre (Fig. 4 C). The Cre+ transgenic mice carry a tamoxifen-inducible Cre-mediated recombination system controlled by the chicken beta-actin promoter/enhancer and cytomegalovirus (CMV) immediate-early enhancer. Breeding these Cre mice with PAX4fl resulted in tamoxifen-induced Cre-mediated recombination and PAX4 deletion across various cells and tissues within the offspring. PCR analysis confirmed PAX4 deletion and recombination of lox sites in the PAX4 gene (Fig. 4 C). These mice showed no abnormalities and resembled wild type (WT) littermates (PAX4fl/fl). They were used for experiments at 3–4 mo of age, with body weight ranging from 26 to 30 g. No difference in body weight or survival was observed before or after tamoxifen injection for age-matched PAX4 KO and controls (Fig. 4 D). Consistent with the shPAX4 data, muscle fibers from PAX4 null mice exhibited attenuated atrophy upon denervation (10 days) compared with denervated muscles from WT animals (Fig. S2, statistics in Table S1).
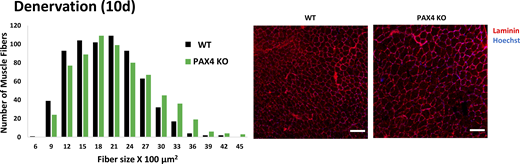
PAX4 deficiency attenuates muscle atrophy. Measurement of cross-sectional areas of 661 fibers from 10 days denervated muscles from WT versus 661 fibers from PAX KO mice. N = 3 mice. Statistics in Table S1. Right: Representative images of muscle cross sections. Fiber membrane staining (red) using laminin antibody, and nuclei staining using Hoechst. Scale bar: 50 μm.
PAX4 deficiency attenuates muscle atrophy. Measurement of cross-sectional areas of 661 fibers from 10 days denervated muscles from WT versus 661 fibers from PAX KO mice. N = 3 mice. Statistics in Table S1. Right: Representative images of muscle cross sections. Fiber membrane staining (red) using laminin antibody, and nuclei staining using Hoechst. Scale bar: 50 μm.
We have found by experience that PAX4 expression is low in muscles and therefore difficult to detect by standard PCR. To enhance sensitivity, we conducted two PCR reactions using nested primers. cDNA from innervated and 10-day denervated muscles was amplified with primers for PAX4, and this product was then further amplified using primers that were nested inside the first set of primers. We found that in innervated muscle from mice expressing PAX4 normally, PAX4 levels were barely detectable, while denervated muscle showed a dramatic increase (Fig. 4 E), indicating that PAX4 is induced in atrophying muscles. Conversely, PAX4 mRNA was absent in innervated and 10-day denervated muscles from PAX4 null mice, confirming successful knockout (Fig. 4 E). For quantitative analysis, RT-PCR on mRNA preparations from innervated and 3- and 10-day denervated muscles with specific PAX4 primers (Table S2) showed elevated PAX4 expression at 3 and 10 days after denervation (2.2-fold and 1.6-fold, respectively) (Fig. 4 F), but not in muscles from PAX4 KO mice.
Similar to our shPAX4 observations via in vivo electroporation (Fig. 4 A), PAX4 deficiency in muscles from PAX4 KO mice hindered the induction of various proteasome genes and MuRF1 at 10 days after denervation (Fig. 4 G). As PAX4 was induced at 3 days after denervation (Fig. 4 F), we investigated if it was essential for proteasome gene induction also at this early stage. Among the 10 proteasome subunit genes tested, induction of eight (including α, β, Rpt, and Rpn subunits) and MuRF1 was blocked in 3-day denervated muscles from PAX4 null mice (Fig. 4 H), indicating that PAX4 promotes proteasome gene expression also in the early phase of atrophy. These effects on gene expression coincided with a shift in PAX4 cellular localization as PAX4 relocated to the nucleus (Fig. 4 I) (Volodin et al., 2017).
To verify the impact of PAX4 deficiency on proteasome gene expression and confirm that PAX4 binds their promoter regions, we focused on a representative proteasome gene, PSMC2 (Rpt1). We conducted chromatin immunoprecipitation (ChIP) on innervated and denervated muscles from WT and PAX4 KO mice using a PAX4-specific antibody or a non-specific IgG as a control. RT-PCR analysis of immunoprecipitated DNA using specific primers for a predicted PAX4 motif within the mouse PSMC2 (Rpt1) promoter (Volodin et al., 2017) confirmed enhanced binding to this gene upon denervation compared with innervated controls (Fig. 4 J). This binding was absent in control samples containing non-specific IgG or in muscles lacking PAX4 (from PAX4 KO mice) (Fig. 4 J). Thus, PAX4 induces various proteasome genes and UPS components that promote the accelerated proteolysis and atrophy in vivo.
Consequently, we tested more directly if this PAX4-dependent induction of proteasome genes triggers the increased cellular content of assembled proteasomes during adaptation to catabolic conditions in vivo. However, it was initially important to confirm if changes in gene expression were reflected in the protein products. We focused on representative proteasome genes and UPS components, MuRF1, PSMD5, p97/VCP, and PSMD13, which were induced in atrophying muscles (Fig. 2). Analysis of muscle homogenates by immunoblotting with specific antibodies revealed that protein abundance correlated well with the transcript levels (Fig. 4 K). Moreover, the substantial increase in protein levels of MuRF1, PSMD5 (S5b), p97/VCP, and PSMD13 (Rpn9) due to muscle denervation was completely abolished in denervated muscles lacking PAX4 (from PAX4 KO mice) (Fig. 4 K).
Measurement of proteasome content by native gels and immunoblotting and proteasome peptidase activity via LLVY-AMC hydrolysis confirmed increased active assembled proteasomes in mouse muscle at 10 days after denervation, but not in atrophying muscles lacking PAX4 (Fig. 4 L). This elevated proteasomal content boosts cellular capacity for proteolysis and therefore is critical in muscle wasting. The inhibition of proteasome production due to PAX4 deficiency likely contributes to the attenuation in muscle wasting (Fig. 4 B and Fig. S2).
α-PALNRF-1 is a novel transcription factor required for proteasome gene induction in vivo
Because PAX4 regulated some but not all proteasome genes in denervation-induced atrophy, we investigated the roles of additional transcription factors. FOXO3 controls multiple atrophy-related genes in the early phase of atrophy (Milan et al., 2015); however, its role in promoting proteasome gene induction during the late phase of atrophy is unclear. To test this, we electroporated TA muscles with a plasmid encoding a dominant negative inhibitor of FOXO3 (FOXO3ΔC) and analyzed the effects on proteasome gene induction by RT-PCR. HA-FOXO3ΔC lacks the C-terminal transactivation domain, which is required for target gene transactivation (Tran et al., 2002). At 3 days after denervation, FOXO3ΔC blocked MuRF1 induction, consistent with prior reports (Sandri et al., 2004), but not proteasome subunits (Fig. 5 A) (as previously shown [Milan et al., 2015]). Although several proteasome genes contain potential FOXO3 binding sites (Table S4 B), FOXO3 inhibition in denervated muscles (10 days) by HA-FOXO3ΔC blocked the induction of only two proteasome subunit genes, PSMD11 (Rpn6) and PSMD13 (Rpn9), as well as of MuRF1 and atrogin-1 (Fig. 5 B), but had no effect on proteasome content or activity (Fig. 5, C and D). Hence, FOXO3 appears to promote muscle loss primarily by regulating other atrophy-related targets besides proteasome subunits.

α-PALNRF-1is required for proteasome gene induction in vivo. (A and B) Proteasome gene expression was measured by RT-PCR analysis of mRNA preparations from innervated and 3 days (A) or 10 days (B) denervated muscles expressing a dominant negative form of FOXO3 (FOXO3ΔC) or shLacz. FOXO3ΔC expression blocked the induction of two proteasome subunit genes (Rpn6 and Rpn9) at 10 days but had no effect on proteasome gene induction at 3 days. Means ± SEM are presented as a ratio to WT innervated. N = 4 mice per condition. *, P < 0.05 versus innervated shLacz; #P < 0.05 versus denervated shLacz by one-tailed unpaired Student’s t test. (C and D) Whether or not FOXO3 is inhibited, the content of active assembled proteasomes does not change in denervated muscles. Measurement of proteasome content by native gels and immunoblotting, and proteasome peptidase activity by LLVY-AMC hydrolysis. Innervated muscles and ones denervated for 3 days (C) or 10 days (D) expressing shLacz or FOXO3-DN were analyzed. (E and F) TA muscles were electroporated with a plasmid encoding α-PALNRF-1-dominant negative (α-PALNRF-1-DN) or shLacz and mRNA preparations from transfected muscles were analyzed by RT-PCR and specific primers at 10 days (E) or 3 days (F) after denervation. Means ± SEM are presented as a ratio to innervated. N = 5 mice per condition. *P < 0.05 versus innervated; #, P < 0.05 and ##, P < 0.001 versus denervated shLacz by one-tailed unpaired Student’s t test. Blots show FLAG-α-PALNRF-1-DN expression in transfected muscles using anti-flag. (G) Inhibition of α-PALNRF-1 by the overexpression of α-PALNRF-1-DN reduces atrophy of denervated muscles. Mean ± SEM weights of denervated TA muscles are depicted as percent of innervated. N = 5 mice per time point. *, P < 0.05 and **, P < 0.005 versus innervated shLacz; #, P < 0.05 versus denervated shLacz by one-tailed unpaired Student’s t test. Source data are available for this figure: SourceData F5.
α-PALNRF-1is required for proteasome gene induction in vivo. (A and B) Proteasome gene expression was measured by RT-PCR analysis of mRNA preparations from innervated and 3 days (A) or 10 days (B) denervated muscles expressing a dominant negative form of FOXO3 (FOXO3ΔC) or shLacz. FOXO3ΔC expression blocked the induction of two proteasome subunit genes (Rpn6 and Rpn9) at 10 days but had no effect on proteasome gene induction at 3 days. Means ± SEM are presented as a ratio to WT innervated. N = 4 mice per condition. *, P < 0.05 versus innervated shLacz; #P < 0.05 versus denervated shLacz by one-tailed unpaired Student’s t test. (C and D) Whether or not FOXO3 is inhibited, the content of active assembled proteasomes does not change in denervated muscles. Measurement of proteasome content by native gels and immunoblotting, and proteasome peptidase activity by LLVY-AMC hydrolysis. Innervated muscles and ones denervated for 3 days (C) or 10 days (D) expressing shLacz or FOXO3-DN were analyzed. (E and F) TA muscles were electroporated with a plasmid encoding α-PALNRF-1-dominant negative (α-PALNRF-1-DN) or shLacz and mRNA preparations from transfected muscles were analyzed by RT-PCR and specific primers at 10 days (E) or 3 days (F) after denervation. Means ± SEM are presented as a ratio to innervated. N = 5 mice per condition. *P < 0.05 versus innervated; #, P < 0.05 and ##, P < 0.001 versus denervated shLacz by one-tailed unpaired Student’s t test. Blots show FLAG-α-PALNRF-1-DN expression in transfected muscles using anti-flag. (G) Inhibition of α-PALNRF-1 by the overexpression of α-PALNRF-1-DN reduces atrophy of denervated muscles. Mean ± SEM weights of denervated TA muscles are depicted as percent of innervated. N = 5 mice per time point. *, P < 0.05 and **, P < 0.005 versus innervated shLacz; #, P < 0.05 versus denervated shLacz by one-tailed unpaired Student’s t test. Source data are available for this figure: SourceData F5.
The transcription factor NRF-1NFE2L1 is known to regulate proteasome gene induction in cultured cells (Radhakrishnan et al., 2010), yet its role in a whole organism in vivo or in atrophy remains understudied. Searching proteasome gene promoters, we found nine proteasome genes that contain potential NRF-1NFE2L1 binding sites (Table S4 C). To assess NRF-1NFE2L1’s influence on proteasome gene induction in vivo, we downregulated it in TA muscle using a specific shRNA, which efficiently reduced the NFE2L1 gene (Fig. S3 A). Downregulation of NRF-1NFE2L1 showed reduced induction of proteasome genes at 10 days after denervation (Fig. S3 B), but not MuRF1 or atrogin-1 (Fig. S3 C), which was not sufficient to attenuate muscle wasting (Fig. S3 D).

NRF-1 NFE2L1 downregulation reduces the expression of some proteasome genes in denervated muscle. (A) shNFE2L1 downregulates NFE2L1 in NIH-3T3 cells. mRNA preparations from cells transfected with shLacz control or shNFE2L1 were analyzed by RT-PCR and specific primers to NFE2L1. Means ± SEM are presented as ratio to shLacz. N = 5 wells of cells per shRNA. *, P < 0.05 versus shLacz by one-tailed paired Student’s t test. (B and C) Expression of proteasome genes (B) and UPS components (C) was measured by RT-PCR analysis of mRNA preparations from innervated and 10-day denervated muscles expressing shNFE2L1 or shLacz. Means ± SEM are presented as a ratio to innervated. N = 4 mice per condition. *, P < 0.05 and **, P < 0.005 versus innervated shLacz; #, P < 0.05 versus denervated shLacz by one-tailed unpaired Student’s t test. (D) Downregulation of NFE2L1 by shNFE2L1 does not attenuate the atrophy of denervated muscles (10 days). Graph depicts mean weights (mg) ± SEM of denervated TA muscles. N = 6 mice per condition. **, P < 0.005 versus innervated shLacz by one-tailed unpaired Student’s t test.
NRF-1 NFE2L1 downregulation reduces the expression of some proteasome genes in denervated muscle. (A) shNFE2L1 downregulates NFE2L1 in NIH-3T3 cells. mRNA preparations from cells transfected with shLacz control or shNFE2L1 were analyzed by RT-PCR and specific primers to NFE2L1. Means ± SEM are presented as ratio to shLacz. N = 5 wells of cells per shRNA. *, P < 0.05 versus shLacz by one-tailed paired Student’s t test. (B and C) Expression of proteasome genes (B) and UPS components (C) was measured by RT-PCR analysis of mRNA preparations from innervated and 10-day denervated muscles expressing shNFE2L1 or shLacz. Means ± SEM are presented as a ratio to innervated. N = 4 mice per condition. *, P < 0.05 and **, P < 0.005 versus innervated shLacz; #, P < 0.05 versus denervated shLacz by one-tailed unpaired Student’s t test. (D) Downregulation of NFE2L1 by shNFE2L1 does not attenuate the atrophy of denervated muscles (10 days). Graph depicts mean weights (mg) ± SEM of denervated TA muscles. N = 6 mice per condition. **, P < 0.005 versus innervated shLacz by one-tailed unpaired Student’s t test.
Because ChIP-sequencing data from cultured SK-N-SH human neuroblastoma cells have identified proteasome subunits as potential target genes of α-PALNRF-1 (Bhawe and Roy, 2018), we investigated if α-PALNRF-1 can induce proteasome genes in vivo. We searched the promoter regions of proteasome subunits for potential α-PALNRF-1 (gene name: NRF1) binding sites using FIMO algorithm from the MEME suit (Grant et al., 2011) (Table S4). Sites were chosen based on significant similarity (P < 0.05) to the human α-PALNRF-1 motif (MA0506.1) (Grant et al., 2011). Among all proteasome genes and UPS components, 13 contained potential binding sites for α-PALNRF-1 (Table S4 D). Intriguingly, 12 of these 13 genes also contained binding sites for PAX4 (Table S4 A).
To determine α-PALNRF-1 role in atrophying muscle, we suppressed its function in denervated muscle by electroporating a plasmid encoding FLAG-α-PALNRF-1 dominant negative (α-PALNRF-1-DN) into TA muscles. The protein α-PALNRF-1 binds DNA as a homodimer and the dominant negative lacks the transactivation domain, thereby preventing dimerization and inhibiting the endogenous enzyme (Morrish et al., 2003; Wu et al., 1999). Proteasome genes were induced at 10 days after denervation in muscles expressing shLacz control (Fig. 5 E). However, expression of the α-PALNRF-1-DN blocked the induction of nine proteasome subunits (out of 15 genes that were tested), and atrogin-1, Nedd4, and p97/VCP (Fig. 5 E).
The transcription factor α-PALNRF-1 seems to be important to sustain proteasome gene expression throughout atrophy, as its inhibition with α-PALNRF-1-DN blocked the induction of PSMC4 (Rpt3), PSMD11 (Rpn6), and PSMD13 (Rpn9) even at the early phase (3 days after denervation) (Fig. 5 F). However, MuRF1 and atrogin-1 were induced in a 3-day denervated muscle regardless of α-PALNRF-1 inhibition (Fig. 5 F), likely due to their regulation primarily by FOXO3 in this early phase (Sandri et al., 2004). Consequently, α-PALNRF-1 is essential for proteasome gene induction in denervated muscle, which promotes most of the accelerated proteolysis in atrophying muscles. In fact, denervation caused a gradual decrease in mean weights of TA muscles over time, but overexpression of α-PALNRF-1-DN markedly attenuated this wasting (Fig. 5 G), indicating that α-PALNRF-1 function is important for proteolysis and loss of muscle mass. Thus, α-PALNRF-1 emerges as a novel transcription factor required for proteasome gene expression and overall proteolysis in vivo.
Proteasome gene expression is dependent on both PAX4 and α-PALNRF-1
Our findings demonstrate that the induction of several genes that promote proteolysis on denervation relies on multiple transcription factors. For instance, (1) downregulation of either α-PALNRF-1 or PAX4 blocked PSMC1 (Rpt2) expression (Fig. 4 and Fig. 5), (2) downregulation of either α-PALNRF-1 or FOXO3 blocked PSMD11 (Rpn6) and PSMD13 (Rpn9) expression (Fig. 5), and (3) induction of the bona fide atrophy markers, both MuRF1 and atrogin-1, required multiple transcription factors: MuRF1 expression was controlled by PAX4 and FOXO3, and atrogin-1 by PAX4, FOXO3, and α-PALNRF-1 (Fig. 4 and Fig. 5). Thus, the gene induction of proteasome subunits and UPS components in catabolic states in vivo appears to occur through the cooperative functions of multiple transcription factors.
To study the potential cooperativity between PAX4 and α-PALNRF-1, we generated an inducible PAX4/α-PALNRF-1 double whole-body knockdown (KD) mouse (Fig. 6 A). Initially, we generated an α-PALNRF-1 KO mouse, which exhibited significantly lower body weight and smaller muscles and died shortly after birth (40% of progeny) (Fig. 6, B and C). Therefore, α-PALNRF-1 likely serves a critical function in vital organs. We, therefore, produced a heterozygous Cre+/α-PALNRF-1(fl/+) KD mouse, which effectively reduced α-PALNRF-1 expression in denervated (10 days) skeletal muscle (Fig. 6 D). This mouse was then bred with PAX4 KO mice to generate PAX4/α-PALNRF-1 double KD mouse (Fig. 6 A). Cre+/α-PALNRF-1(fl/+) KD and PAX4/α-PALNRF-1 double KD mice exhibited normal body weights and survival (Fig. 6, B and C) with no gross abnormalities compared with WT littermates.

Proteasome gene expression is dependent on both PAX4 and α-PALNRF-1. (A) Strategy for generating α-PALNRF-1 and PAX4/α-PALNRF-1 double conditional KD mice. Following tamoxifen injections, removal of α-PALNRF-1 from one allele in the genome was verified using the U3/U5 primers (Table S3). (B and C) Mean body weights (g) (B) and percent survival (C) ± SEM of PAX4 KO, α-PALNRF-1 KD, PAX4/α-PALNRF-1 double conditional KD, and WT control mice are presented, following tamoxifen injections and muscle denervation. N = 10 mice per condition. **, P < 0.005 and ***, P < 0.0005 versus WT by one-tailed unpaired Student’s t test. (D) α-PALNRF-1 mRNA levels increase at 7–10 days after denervation, but not in denervated muscles from α-PALNRF-1 KD mice. Mice were injected with tamoxifen and their muscles were denervated (3, 7, or 10 days). RT-PCR using primers for α-PALNRF-1 was performed on mRNA preparations from innervated and denervated muscles. Means ± SEM are presented as a ratio to WT innervated. N = 4 mice per condition. *, P < 0.05 versus innervated in WT; #, P < 0.05 versus denervated (10 days). (E) α-PALNRF-1 accumulates in the nucleus at 7 days after denervation. Nuclear fractions from innervated and denervated (at 3, 7, and 10 days) muscles were analyzed by SDS-PAGE and immunoblotting. (F) Venn diagrams depicting the overlap between differentially expressed genes in muscles from α-PALNRF-1 KD and PAX4 KO mice following tamoxifen injections and muscle denervation. A significant overlap was detected for downregulated (P = 2.5e-29, Fisher Exact test) and upregulated (P = 3.3e-266, Fisher’s exact test) genes compared with denervated in WT. (G) Denervated muscles (10 days) were compared to innervated muscles by RNA sequencing. Presented are proteasome subunits whose induction was blocked in α-PALNRF-1 KD (yellow) and PAX4/α-PALNRF-1 double KD (green) mice, with the latter group of genes being fully contained within the first. (H) A heatmap representing the calculated fold changes for expression of proteasome genes in denervated (10 days) muscles from PAX4/α-PALNRF-1 double KD (left column), α-PALNRF-1 KD (middle column) and PAX4 KO (right column) mice versus innervated in WT. Asterisks denote significant fold changes (* Padj range 0.05–0.01, ** Padj 0.01–0.001, *** Padj < 0.001). (I) PAX4 and α-PALNRF-1 bind the promoter region of PSMB3 gene. ChIP was performed on denervated (10 days) muscles from WT mice using PAX4 or α-PALNRF-1 antibodies, or non-specific IgG control, and primers for PSMB3 gene. Data is plotted as mean fold change relative to IgG control ± SEM and represents three independent experiments. N = 3 mice per condition. *, P < 0.05 versus IgG by one-tailed unpaired Student’s t test. (J) The content of active assembled proteasomes increase in denervated (10 days) muscles, but not in muscles lacking both PAX4 and α-PALNRF-1. Measurement of proteasome content by native gels and immunoblotting, and proteasome peptidase activity by LLVY-AMC hydrolysis. Source data are available for this figure: SourceData F6.
Proteasome gene expression is dependent on both PAX4 and α-PALNRF-1. (A) Strategy for generating α-PALNRF-1 and PAX4/α-PALNRF-1 double conditional KD mice. Following tamoxifen injections, removal of α-PALNRF-1 from one allele in the genome was verified using the U3/U5 primers (Table S3). (B and C) Mean body weights (g) (B) and percent survival (C) ± SEM of PAX4 KO, α-PALNRF-1 KD, PAX4/α-PALNRF-1 double conditional KD, and WT control mice are presented, following tamoxifen injections and muscle denervation. N = 10 mice per condition. **, P < 0.005 and ***, P < 0.0005 versus WT by one-tailed unpaired Student’s t test. (D) α-PALNRF-1 mRNA levels increase at 7–10 days after denervation, but not in denervated muscles from α-PALNRF-1 KD mice. Mice were injected with tamoxifen and their muscles were denervated (3, 7, or 10 days). RT-PCR using primers for α-PALNRF-1 was performed on mRNA preparations from innervated and denervated muscles. Means ± SEM are presented as a ratio to WT innervated. N = 4 mice per condition. *, P < 0.05 versus innervated in WT; #, P < 0.05 versus denervated (10 days). (E) α-PALNRF-1 accumulates in the nucleus at 7 days after denervation. Nuclear fractions from innervated and denervated (at 3, 7, and 10 days) muscles were analyzed by SDS-PAGE and immunoblotting. (F) Venn diagrams depicting the overlap between differentially expressed genes in muscles from α-PALNRF-1 KD and PAX4 KO mice following tamoxifen injections and muscle denervation. A significant overlap was detected for downregulated (P = 2.5e-29, Fisher Exact test) and upregulated (P = 3.3e-266, Fisher’s exact test) genes compared with denervated in WT. (G) Denervated muscles (10 days) were compared to innervated muscles by RNA sequencing. Presented are proteasome subunits whose induction was blocked in α-PALNRF-1 KD (yellow) and PAX4/α-PALNRF-1 double KD (green) mice, with the latter group of genes being fully contained within the first. (H) A heatmap representing the calculated fold changes for expression of proteasome genes in denervated (10 days) muscles from PAX4/α-PALNRF-1 double KD (left column), α-PALNRF-1 KD (middle column) and PAX4 KO (right column) mice versus innervated in WT. Asterisks denote significant fold changes (* Padj range 0.05–0.01, ** Padj 0.01–0.001, *** Padj < 0.001). (I) PAX4 and α-PALNRF-1 bind the promoter region of PSMB3 gene. ChIP was performed on denervated (10 days) muscles from WT mice using PAX4 or α-PALNRF-1 antibodies, or non-specific IgG control, and primers for PSMB3 gene. Data is plotted as mean fold change relative to IgG control ± SEM and represents three independent experiments. N = 3 mice per condition. *, P < 0.05 versus IgG by one-tailed unpaired Student’s t test. (J) The content of active assembled proteasomes increase in denervated (10 days) muscles, but not in muscles lacking both PAX4 and α-PALNRF-1. Measurement of proteasome content by native gels and immunoblotting, and proteasome peptidase activity by LLVY-AMC hydrolysis. Source data are available for this figure: SourceData F6.
To investigate the coordinated functions of PAX4 and α-PALNRF-1 in controlling proteasome gene expression, we first examined whether α-PALNRF-1 cellular distribution changes after denervation. α-PALNRF-1 was induced at 7 and 10 days after denervation (Fig. 6 D) and translocated into the nucleus at 7 days (Fig. 6 E) just before it promotes proteasome gene induction (Fig. 5, E and F). Next, we conducted RNA-seq analysis on WT and PAX4 KO mouse muscles 10 days after denervation when most proteasome genes and related chaperones were induced (Fig. 2), proteasome assembly was high (Fig. 3 A), and myofibrils disassembled (Cohen et al., 2009; Volodin et al., 2017; Aweida and Cohen, 2021). For rigorous statistical analysis, we employed P-adjusted values accounting for false discovery rate to assess significance (Padj < 0.05). Among the 38 proteasome genes detected by RNA-Seq, 22 were upregulated in denervated muscles versus innervated controls (Table S5). The upregulated genes included multiple α and β 20S subunits, Rpn subunits, and Rpt subunits, consistent with our findings above. Notably, genes such as PSMC1-6 (all Rpt subunits), PSMD4/8/11/13/14, PSMA5/7, and PSMB1/3/5 (Fig. 2) showed upregulation, while PSME1 (PA28α) was downregulated, consistent with Fig. 2 I. Although the remaining 16 proteasome subunit genes showed no statistically significant change (Padj > 0.05), two of them (PSMA2 and PSMD7) displayed a similar trend toward higher levels in denervated muscles (P value < 0.05). Other UPS and atrophy-related genes were also detected, including proteasome activity regulators (PA28β, PA28γ, PA28G, PA200, PI31), proteasome assembly chaperons (PAC1, PAC2, PAC3, PAC4, POMP), MuRF1 and atrogin-1. As expected, MuRF1 and POMP were induced (padj < 0.05), while atrogin-1 showed a similar trend (P < 0.05, but Padj > 0.05). PAX4 deficiency in muscles from PAX4 KO mice exhibited a trend of reduction (P < 0.05, though Padj > 0.05) in the expression of several proteasome genes including PSMD4 (Rpn10), PSMD6 (Rpn7), PSMD12 (Rpn5), PSMC3 (Rpt5), PSMC5 (Rpt6), PSMA3 (α7), PSMB7 (β7), PSMA2 (α2), and of MuRF1 and atrogin1 (Table S5).
Genome-wide comparison using RNA-seq of differentially expressed genes in muscles from PAX4 KO and α-PALNRF-1 KD mice revealed that α-PALNRF-1 controls the expression of hundreds of genes at 10 days after denervation, whereas PAX4 influences only a few dozens of genes (Fig. 6 F and Table S6). Interestingly, 27 genes were downregulated and 69 genes were upregulated by both PAX4 and α-PALNRF-1 (Fig. 6 F and Table S6). In addition, the 27 genes that were induced by both transcription factors represent 50% of the genes controlled by PAX4, while the 69 genes that were downregulated by both transcription factors represent 64% of the genes controlled by PAX4 (Fig. 6 F and Table S6). Given the presence of binding sites for both α-PALNRF1 and PAX4 in 12 of the 13 proteasome genes, these two transcription factors may collaborate to coregulate proteasome gene expression.
When we compared RNA-seq data from α-PALNRF-1 KD or PAX4/α-PALNRF-1 double KD muscles to control muscles (all at 10 days denervation), we found a decrease in the expression of 30 proteasome genes in α-PALNRF-1 KD muscles compared with denervated muscles from WT littermates (Table S7). PSMB1 showed a similar trend (P < 0.05, but Padj > 0.05). In PAX4/α-PALNRF-1 double KD mouse muscles, the expression of 12 proteasome genes decreased (Padj < 0.05), and an additional 12 genes similarly decreased (P < 0.05, but Padj > 0.05). As expected, the group of genes affected by PAX4/α-PALNRF-1 double KD was fully contained within the group of genes affected by α-PALNRF-1 KD alone (Table S7; and Fig. 6, G and H). Overall, PAX4 KO moderately influences α-PALNRF-1 KD regulation of proteasome genes (Table S7 and Fig. 6 H).
Together, our analyses revealed a significant overlap between genes that were significantly downregulated and those that were upregulated upon PAX4 KO, α-PALNRF-1 KD, or PAX4/α-PALNRF-1 double KD (Fisher Exact test; P = 2.3e–29 and P = 3.3e–66 for downregulated and upregulated, respectively) (Fig. 6, F–H). These findings suggest that the two transcription factors may act together to regulate the same set of genes, which was validated for a representative gene, PSMB (β3), by ChIP (Fig. 6 I). Moreover, when proteasome activity and assembly were analyzed using innervated and 10-day denervated muscle homogenates, both proteasome activity and assembly failed to increase in PAX4/α-PALNRF-1 KD mice as compared with α-PALNRF-1 KD alone (Fig. 6 J). This result suggests that loss of PAX4 is sufficient to effectively block accumulation of active, assembled proteasomes. Although knock-down of α-PALNRF-1 reduced proteasome gene expression (Fig. 6 H), it did not block the increase in active proteasomes on denervation (Fig. 6 J), probably because PAX4 was still present in those samples, and the presence of both transcription factors is necessary to boost proteasome content in atrophying muscle.
Discussion
Here, we discovered a novel mechanism that regulates proteasome gene expression in mouse muscle in vivo involving an unprecedented functional cooperativity between two transcription factors, PAX4 and α-PALNRF-1. The structure, regulation, and assembly of the proteasome have been extensively studied in vitro in yeast and mammalian cell cultures (Budenholzer et al., 2017; Bard et al., 2018), but significantly less so in vivo in mammals (Argilés et al., 2016; Rousseau and Bertolotti, 2018). Our studies help fill this gap by uncovering a previously unknown mode of regulation of proteasome gene expression in vivo using denervated adult mouse muscle as a model system.
Muscle atrophy is a valuable physiological system to study protein degradation by the proteasome in a whole organism in vivo. It has long been known that this catabolic condition is associated with severe maladies such as denervation, cancer, chronic inflammation, aging, neurodegeneration, and malnutrition (Cohen et al., 2015). The inevitable loss of muscle mass and strength results from protein breakdown outstripping synthesis, leading to frailty, disability, morbidity, and mortality. During times of scarcity or illness, this survival process is designed to guarantee the continued availability of amino acids for energy production by the liver to nurture vital tissues such as the brain and heart (Argilés et al., 2016).
Proteolysis upon muscle denervation appears to take place at two stages, which may be readily observed due to its relatively slow pace compared to starvation or inflammation-driven atrophy (Volodin et al., 2017). In the first stage, the major atrophy-related genes MuRF1 and atrogin1 are induced, and in the latter stage other genes that promote proteolysis (e.g., NEDD4, RPT1, p97/VCP) are increased to support the accelerated degradation of myosin and actin and associated myofibrillar proteins (Cohen et al., 2009; Piccirillo and Goldberg, 2012; Volodin et al., 2017). Our findings here support this concept of coordinated early and late phases of gene induction in atrophy; in the early phase (3–7 days after denervation), genes encoding 20S and Rpt subunits, POMP, atrogin-1, MuRF1, and Rpn subunits are induced. In the later phase (10–14 days after denervation), Nedd4, p97/VCP, Rpt and Rpn subunits (again) are induced. Thus, initially, basal proteasome levels appear sufficient to carry out the muscle loss (3–7 days after denervation). Then, proteasome subunits and chaperones are elevated at 7 days prior to the rapid myofibril disassembly that occurs in the more delayed phase (Cohen et al., 2009). By 14 days after denervation, levels of most genes returned to baseline (see RT-PCR and RNA-seq data), aligning with a slower loss of muscle and myofibril content (Sacheck et al., 2007).
Many of the major atrophy-related genes were induced by FOXO family of transcription factors (Milan et al., 2015), although several other transcription factors also play a role including SMAD2 and SMAD3 (Sartori et al., 2009), glucocorticoids receptors (Menconi et al., 2007), nuclear factor-κB (Cai et al., 2004; Mourkioti et al., 2006), and Twist1 (Parajuli et al., 2018). FOXOs’ roles are well established in the early atrophy stages (1-day fasting or 3 days denervation), and activation of FOXO3 alone is sufficient to trigger skeletal muscle atrophy (Sandri et al., 2004). However, their roles in the later stages of atrophy (i.e., 10 days denervation), where further induction of many proteasome genes is observed concomitantly with accelerated proteolysis, remain unclear. Here, we show that FOXO3 induces PSMD11 (Rpn6), PSMD13 (Rpn9), and MuRF1 (Fig. 5 B), but does not influence proteasome content (Fig. 5, C and D). This highlights the involvement of additional transcription factors, such as PAX4, which we recently identified as a regulator of PSMC2 (Rpt1) during late atrophy stages (Volodin et al., 2017). Here, we discovered global coordination of proteasome gene expression by PAX4 and multiple other transcription factors.
NRF-1NFE2L1 is one of the few known transcription factors regulating proteasome gene expression in cultured cells (Xu et al., 2012), notably targeting STAT3 and several β proteasome subunits (Bonetto et al., 2011). Its downregulation dramatically reduced muscle wasting (Fig. 5 G) not only by reducing proteasome gene expression but also possibly due to inhibition of STAT3 expression (STAT3 has been linked to muscle wasting caused by denervation [Madaro et al., 2018] and cancer cachexia [Bonetto et al., 2011]). Our in vivo studies in mouse muscle show that NRF-1NFE2L1 downregulation blocks the induction of the proteasome genes PSMA7 (α4), PSMB4 (β7), PSMC1 (Rpt2), PSMC4 (Rpt3) (Fig. S3 B), in line with prior investigations in cultured MEF cells (Radhakrishnan et al., 2010). We now provide evidence for additional proteasome genes that are controlled by this transcription factor in vivo, including PSMC3 (Rpt5) and PSMC5 (Rpt6). However, α-PALNRF-1, when inhibited (by a dominant negative) or knocked down in transgenic mice, strongly suppresses the expression of most proteasome genes and attenuates atrophy (Fig. 5 G). α-PALNRF-1 role in inducing proteasome genes is novel, supported by potential binding sites that we identified for this transcription factor in many proteasome genes, and validated for a representative gene by ChIP (Fig. 6 I). Moreover, RNA-seq confirmed a global effect of α-PALNRF-1 KD on proteasome and UPS gene expression (Fig. 6, G and H) (experiments involving transfection might have overlooked certain effects due to incomplete gene downregulation, but the heightened sensitivity of RNA-seq and analyses in transgenic mice ensured statistical significance). These findings indicate a physiological role for α-PALNRF-1 in promoting muscle loss after denervation possibly by inducing proteasome subunits and UPS components. α-PALNRF-1 may contribute to atrophy also by promoting mitochondria biogenesis and function (Scarpulla, 2002; Kelly and Scarpulla, 2004), consequently facilitating ATP supply for protein degradation.
PAX4 induction at 3 days after denervation coincides with the increased expression of proteasome genes and MuRF1, although the mechanism for PAX4 induction remains elusive. STAT3, which is activated after denervation (Madaro et al., 2018), may play a role in PAX4 induction, as suggested by previous microarray and ChIP studies in cultured NIH3T3 cells, identifying PAX4 as STAT3 target gene (Snyder et al., 2008). This transcription factor regulates the expression of several proteasome genes and PSMD5 assembly chaperone, with protein levels largely correlating with transcript levels (Fig. 4). The substantial rise in protein levels compared with mRNA levels after denervation suggests potential enhanced protein translation due to PAX4 or α-PALNRF-1 loss, which may indirectly also regulate protein synthesis in vivo. Furthermore, the precise mode of coordination between α-PALNRF-1, PAX4, NRF-1NFE2L1, and FOXO3, alongside other transcription factors and cofactors, in promoting proteasome gene expression remains unclear and is an important question for future research.
Our findings indicate a complex regulatory mechanism for proteasome gene induction in muscle atrophy, governed by multiple transcription factors. Both PAX4 and α-PALNRF-1 play crucial roles in controlling the expression of several proteasome subunit genes, and their actions are not redundant as the loss of one transcription factor is sufficient to prevent the induction of various proteasome genes. While both transcription factors can induce proteasome subunit genes, PAX4 KO predominantly affected proteasome assembly (Fig. 6 J), possibly due to its regulation of PSMD5 assembly chaperone (S5b) expression (Fig. S4, A and B). Even with decreased expression of specific proteasome subunit genes, induced expression and enhanced activity of PSMD5 can facilitate efficient proteasome assembly, as observed with α-PALNRF-1 KD. Our data highlight the complexity of the transcriptional regulation of proteasome and assembly chaperone genes in vivo.

PAX4 controls the expression of the proteasome assembly chaperon PSMD5 at 3 days after denervation. (A and B) mRNA preparations from denervated (3 and 10 days) muscles from WT, PAX4 KO, α-PALNRF-1 KD, and PAX4/α-PALNRF-1 KD mice were analyzed by RT-PCR. Means ± SEM are presented as a ratio to WT innervated. N = 4 mice per condition. *, P < 0.05, **, P < 0.005, and ***, P < 0.0005 versus innervated in WT; #, P < 0.05 versus denervated in WT by one-tailed unpaired Student’s t test.
PAX4 controls the expression of the proteasome assembly chaperon PSMD5 at 3 days after denervation. (A and B) mRNA preparations from denervated (3 and 10 days) muscles from WT, PAX4 KO, α-PALNRF-1 KD, and PAX4/α-PALNRF-1 KD mice were analyzed by RT-PCR. Means ± SEM are presented as a ratio to WT innervated. N = 4 mice per condition. *, P < 0.05, **, P < 0.005, and ***, P < 0.0005 versus innervated in WT; #, P < 0.05 versus denervated in WT by one-tailed unpaired Student’s t test.
Because common proteolytic pathways are activated in diverse types of atrophy, targeting key factors of these common mechanisms should be beneficial in treating many diseases. It remains to be determined whether the new transcriptional regulation of proteasome gene expression by multiple transcription factors is important in other types of atrophy, including cancer, aging, or diabetes. Moreover, it remains uncertain if PAX4 also functions in the basal expression of proteasome genes in normal muscle and/or in other tissues. Clearly, the depletion of PAX4 or α-PALNRF-1 in catabolic conditions of accelerated proteolysis (e.g., after denervation) significantly reduces atrophy in muscle. Consequently, these transcription factors represent potential novel therapeutic targets to treat muscle wasting.
Materials and methods
Animal experiments and plasmids
All animal procedures were performed in accordance with the ethics guidelines of the Israel Council on Animal Experiments and the Technion Inspection Committee on the Constitution of the Animal Experimentation. Specialized staff provided animal care in the institutional-specific pathogen-free animal facility. For experiments on WT mice, adult, Hsd:ICR male mice (26–30 g; Envigo) were used, and TA or GA muscles were analyzed. Muscle denervation was performed by sectioning the sciatic nerve. At the same time, electroporation of TA muscles was performed as described (Gilda et al., 2021; Goldbraikh et al., 2020). For electroporation, a plasmid encoding a specific shRNA (20 μg) (Table S2) or α-PALNRF-1 dominant negative (30 μg) in 0.9 wt/vol % NaCl was injected into TA muscle, and five electric pulses (12 V, 200 ms intervals) were applied. The FLAG-tagged α-PALNRF-1 dominant negative plasmid used for electroporation, also encodes amino acids 281–599 of mouse estrogen receptor with a G525R mutation and was a kind gift from Dr. David Hockenberry at the Fred Hutchinson Cancer Research Center, Seattle, WA, USA. HA-FOXO3ΔC used to inhibit FOXO3 was a gift from Michael Greenberg (# 1796; Addgene plasmid; http://n2t.net/addgene:1796; RRID:Addgene_1796).
Generation of transgenic mice
PAX4 KO, α-PALNRF-1 knock-down (KD), and PAX4/α-PALNRF-1 double KD mice were generated according to the breeding schemes in Fig. 4 C and Fig. 6 A. α-PALNRF-1fl/fl mice were kindly provided by Dr. Chai-An Mao, Department of Ophthalmology and Visual Science, the University of Texas, Houston, TX, USA. PAX4fl/+ mice were generously provided by Dr. Ahmed Mansouri at The Max Planck Institute for Biophysical Chemistry, Gottingen, Germany (Kordowich et al., 2012). Cag-Cre mice were purchased from The Jackson Laboratory (Strain B6.Cg-Tg(CAG-cre/Esr1*)5Amc/J, Stock #004682). DNA was extracted from tail snips taken at weaning or at sacrifice for PCR genotyping (Taq DNA Polymerase, Cat. #A180301; Ampliqon). Genotyping primers are shown in Table S3. When male mice were 26–30 g (3–4 mo old), gene KO was induced by injecting 50 μl 20 mg/ml tamoxifen in corn oil per 10 g body weight every day for 5 days, followed by a 1 wk wait period before conducting experiments.
Muscle homogenization and fractionation
Muscles were homogenized in cold homogenization buffer (20 mM Tris pH 7.6, 5 mM EGTA, 100 mM KCl, 1% Triton X-100, 1 mM PMSF, 10 mM sodium pyrophosphate, 100 mM sodium fluoride, 2 mM sodium orthovanadate, 10 μg/ml aprotinin, 10 μg/ml leupeptin, 3 mM benzamidine hydrochloride) using an Omni Tissue Homogenizer incubated with rotation at 4°C for 1 h and centrifuged at 6,000 × g for 20 min at 4°C. The supernatant was stored as the soluble fraction. The pellet (insoluble fraction, Fig. 1 C) was washed once with homogenization buffer and twice with suspension buffer (20 mM Tris pH 7.2, 100 mM KCl, 1 mM DTT, 1 mM PMSF) and then resuspended in storage buffer (20 mM Tris pH 7.2, 100 mM KCl, 1 mM DTT, 20% glycerol). Protein concentration was determined using Bradford Assay.
To obtain cytosolic and nuclear extracts, whole TA muscles were homogenized in 19 volumes (vol/wt) of buffer C (20 mM Tris, pH 7.6, 100 mM KCl, 5 mM EDTA, 1 mM DTT, 1 mM PMSF, 3 mM benzamidine, 10 μg/ml leupeptin, 50 mM NaF, and 1 mM sodium orthovanadate). Following centrifugation at 2,900 × g for 20 min at 4°C, the supernatant was collected and subjected to centrifugation at 18,000 × g for 90 min at 4°C to remove membranes. The obtained supernatant was stored as the cytosolic fraction. In parallel, the 2,900 × g pellet was washed twice in buffer C and was then thoroughly resuspended in buffer N (20 mM HEPES pH 7.9, 1.5 mM MgCl2, 0.5 M NaCl, 5 mM EDTA/NAOH pH 7.4, 20% glycerol, 1% Triton X-100, 1 mM sodium orthovanadate, 10 μg/ml leupeptin, 3 mM benzamidine, 1 mM PMSF, 50 mM NaF) (200 μl buffer N per 50 mg muscle tissue). After short vortex and incubation on ice for 30 min, the resuspension was centrifuged at 9,000 ×g for 30 min at 4°C and the obtained supernatant was stored at −80°C as the nuclear fraction. All procedures were performed at 4°C.
Immunofluorescent staining and fiber size analysis
Frozen TA muscle cross-sections (30 μm) were fixed in 4% PFA in PBS, pH 7.4 for 20 min, washed, and incubated overnight at 4°C with laminin antibody (Cat. #L9393, 1:100; Sigma-Aldrich) to stain fiber membranes, then washed and incubated in secondary antibody (anti-Rabbit IgG Alexa Fluor 568, Cat. #A-11011, 1:500; Thermo Fisher Scientific) at room temperature, followed by Hoechst staining for 5 min (Cat. #H60241, 1:2,500; Sigma-Aldrich). For WGA (Texas Red-X Conjugate, Cat. #W21405, 1:100; Invitrogen), incubation was for 1 h at room temperature, with no secondary antibody. Confocal images were collected at room temperature using an inverted LSM 710 laser scanning confocal microscope (Zeiss) with a Plan-Apochromat 63× oil objective (1.4 NA) and acquired using ZEN imaging software (Zeiss) version 2014. The signals for Alexa fluor 488, Alexa fluor 594, and Alexa fluor 647 were excited with 488, 543, and 633 nm lasers, and emission was collected by GaAsp detector through 500–550, 570–616, and 640–797 band-pass filters, respectively. Data processing was performed using Imaris (Bitplane) software version 9.31. The fiber size area in muscle cross-sections was determined manually or using Imaris Image Analysis Software (Gilda et al., 2021). For each condition that is compared, an equal number (>500) of muscle fibers were analyzed.
Real-time PCR
Total RNA was extracted from TA muscle using TRIzol reagent (Cat. #T9424; Sigma-Aldrich) and served as a platform for cDNA synthesis using qPCRBIO cDNA Synthesis Kit (Cat. #PB30.11-10; PCR Biosystems). Real-time PCR was performed with primers to mouse genes (Table S2) using PerfeCTa SYBR Green FastMix ROX (Cat. #95073; Quanta), qPCRBIO SyGreen Blue Mix Hi-ROX (Cat. #PB20.16-05; PCR Biosystems), or Azuraview GreenFast qPCR Blue Mix LR (Cat. #AZ2305; Azura genomics) according to the manufacturer’s protocol. The gene Mrps7 was used as a reference. To amplify PAX4, which is very lowly expressed in muscle, RT-PCR was performed using one set of PAX4 primers (Table S2, set #1), and then 1 μl of the product from this PCR reaction was amplified using a second set of PAX4 primers (Table S2, set #2) that is nested inside the first set. To reach the detection threshold for PAX4, 40 cycles were used.
Chromatin immunoprecipitation (ChIP) assay
Due to the low abundance of PAX4 in muscle, ChIP was performed on PAX4 precipitates from nuclear extracts that were prepared by tissue fractionation (see muscle homogenization and fractionation). The ChIP assay was performed using the Millipore ChIP Assay Kit (Cat. #17-295). For each experimental condition, one GA muscle was lysed in a nuclear extraction buffer (10 mM HEPES pH 7.4, 10 mM KCl, 5 mM MgCl2, 0.5 mM DTT, protease and phosphatase inhibitors) using an Omni Tissue Homogenizer. Due to the low abundance of PAX4 in muscle, ChIP was performed on PAX4 precipitates from nuclear extracts that were prepared by tissue fractionation (see muscle homogenization and fractionation). Samples were crosslinked with formaldehyde (1% vol/vol final concentration, 10 min, 4°C), quenched with 1.25 mM glycine for 5 min at room temperature, and centrifuged (1,000 × g, 4°C, 5 min). Pellets were resuspended in SDS lysis buffer (Cat. #20-163; Millipore) and subsequently sonicated with the Covaris E220 ultrasonicator (Peak Power 75, Duty Factor 26, Cycles/Burst 200, Temperature 6°C, 840 s) to fragment DNA. The samples were then centrifuged at 1,000 × g, 4°C for 5 min, and the supernatant was diluted with ChIP Dilution Buffer (Cat. # 20-153; Millipore), precleared for 1 h at 4°C with 5 μl Protein A Agarose/Salmon Sperm DNA (Cat. #16-157C; Millipore), and incubated with Protein A Agarose/Salmon Sperm DNA and 5 μg human IgG (Cat. #I4506; Sigma-Aldrich), PAX4 Antibody (Cat. #MBS542431; MyBioSource.com), or α-PALNRF-1 antibody (DSHB Hybridoma Product PCRP-NRF-1-3H1. This antibody was deposited to the DSHB by Common Fund—Protein Capture Reagents Program) overnight at 4°C. The beads were washed with the buffers supplied in the kit in the following order for 7 min each: Low Salt Immune Complex Wash Buffer (Cat. #20-154; Millipore), High Salt Immune Complex Wash Buffer (Cat. #20-155; Millipore), LiCl Immune Complex Wash Buffer (Cat. #20-156; Millipore), and TE Buffer (Cat. #20-157; Millipore). DNA was eluted in an elution buffer (1% SDS, 0.1 M NaHCO3, 0.2 mg/ml Proteinase K) for 5 h with shaking at 1,200 rpm, 65°C. Eluted DNA was purified by isopropanol precipitation and subjected to RT-PCR analysis. Fold enrichment was calculated by dividing Cq values from the PAX4 or α-PALNRF-1 immunoprecipitation by IgG signal.
Computational analysis
The promoter regions (1 Kb upstream to the annotated Transcription Strat Sites) of the mouse proteasome genes and atrophy-related genes were searched for potential transcription factor binding sites using the FIMO motif search algorithm from the MEME suit (Grant et al., 2011). The Position Specific Scoring Matrices (PSSMs) used to search the transcription factor binding site in the FIMO search tool were extracted from the JASPAR database of transcription factor binding profiles (Castro-Mondragon et al., 2022). Genes in which a significant hit (P < 0.05) was identified within its defined promoter region were considered target genes.
RNA sequencing
We trimmed low-quality reads and removed ilumina adaptor and polyA sequences, using Cutadapt (Martin, 2011). Reads were mapped against GRCm39 genome (Ensembl) using STAR package (Dobin et al., 2013) to create Bam files. We used Samtools to convert BAM to SAM file and index the files. Then, the reads were annotated and counted using htseq-count package (Anders et al., 2015). Using Deseq package (Love et al., 2014), we identified genes that were differentially expressed. R package was used to plot significant gene expression heatmaps and Venn.
Denaturing gel electrophoresis and Western blotting
Muscle homogenates were separated on 10 or 12.5% SDS polyacrylamide gels and transferred to PVDF membranes (2 h, 200 mA, 4°C). Membranes were blocked for 1 h in 3% BSA/PBST, then incubated in primary antibodies overnight at 4°C, washed in PBST, and incubated in secondary antibody for 1 h at room temperature. Membranes were then incubated for 1 min in luminol ECL reagent and imaged using the Bio-Rad ChemiDoc. Antibodies and dilutions used were PAX4: Abcam, Cat. #ab101721, 1:1,000, goat polyclonal; PAX4 for ChIP assay: MyBioSource.com, Cat. #MBS542431, rabbit polyclonal; Gankyrin (3A6C2): Santa Cruz, Cat. #sc-101498, 1:300, mouse monoclonal; PSMD5 (S5b): Santa Cruz, Cat. #sc-390751, 1:100, mouse monoclonal; Proteasome 20S α1, 2, 3, 5, 6 and 7 subunits (MCP231): Enzo, Cat. #BML-PW8195, 1:2,500, mouse monoclonal; PSMD13 (Rpn9): Proteintech, Cat. #15261-1-AP, 1:2,000, rabbit polyclonal; MuRF1: a kind gift from Regeneron Pharmaceuticals, p97/VCP (Clone 18/VCP): BD Biosciences, Cat. #612182, 1:1,000, mouse monoclonal; Laminin: Sigma-Aldrich, Cat. #L9393, 1:50, rabbit polyclonal; Rpt2: Bethyl laboratories, #A303-821A, 1:1,000, rabbit polyclonal; Rpn1: Santa Cruz, #sc-271775, 1:1,000, mouse monoclonal; PolII: Santa Cruz, Cat. #sc-47701, 1:1,000, mouse monoclonal; THE HA Tag Antibody, GenScript, Cat. #A01244, 1:3,000, mouse monoclonal; GAPDH: Sigma-Aldrich, Cat. #G8795, 1:10,000, mouse monoclonal; Peroxidase Goat Anti-Rabbit IgG (H+L): Jackson ImmunoResearch, Cat. #111-035-144, 1:10,000; Peroxidase Goat Anti-Mouse IgG (H+L): Jackson ImmunoResearch, Cat. #115-035-003, 1:5,000; and Peroxidase Donkey Anti-Goat IgG (H+L): Jackson ImmunoResearch, Cat. #705-035-147, 1:5,000.
Native-PAGE analysis of proteasome assembly and activity
Muscles were ground with mortar and pestle in the presence of liquid nitrogen. The ground cryo-powders were hydrated for 10 min on ice using buffer A (50 mM Tris-HCl pH 7.5, 5 mM MgCl2, 75 mM NaCl, 0.5% NP-40, 10% glycerol) supplemented with 1 mM ATP and protease inhibitors. This buffer was added to the cryo-powders at a 1:1 ratio. The resulting cell lysates were centrifuged at 1,500 × g for 20 min at 4°C to remove cell debris and insoluble proteins. The supernatant was centrifuged at 15,000 × g for 15 min twice at 4°C. The cleared lysates (100 mg) were loaded onto 3.5% discontinuous native gel. Native gels were electrophoresed for 3.5 h at 100 V in the cold room. In-gel peptidase assays were conducted using the fluorogenic peptide substrate LLVY-AMC at 100 mM (Cat. #I-1395.0100; Bachem) by soaking the native gels in buffer containing 25 mM Tris-HCl (pH 7.4), 10 mM MgCl2, and 1 mM ATP for 25 min. Native gels were photographed under UV light Bio-Rad Gel Doc EZ Imager to detect AMC fluorescence. To visualize the activity of free CP, 0.02% SDS was added to the native gels for an additional 20 min incubation and photography. Following the in-gel peptidase assays, native-PAGE gels were transferred to PVDF membranes for analysis of proteasome assembly by immunoblotting. The PVDF membrane was incubated in 20 ml of blocking buffer, (TBST; Tris-buffered saline containing 0.1% Tween-20), which was supplemented with 5% non-fat dry milk for 1 h at room temperature. The membrane was washed twice for 10 min using TBST. The membrane was incubated with primary antibodies, which were diluted at 1:3,000 in blocking buffer, overnight at 4°C. Two washes were conducted using TBST as above. The HRP-conjugated secondary antibody was diluted at 1:3,000 in blocking buffer (Cat. #NA934, anti-Rabbit IgG HRP-linked antibody; Cytiva) for incubation with the membranes for 1 h at room temperature, followed by two washes using TBST. Membranes were then subjected to enhanced chemiluminescence (Western Blot Chemiluminescence Reagents Plus, Cat. #NEL105001EA; Perkin Elmer), were imaged using Bio-Rad ChemiDoc MP Imager, and corrected for brightness or contrast with Adobe Photoshop 2021, version 22.4.2.
Statistical analysis and image acquisition
All data are presented as means ± SEM. The statistical significance was accessed with one-tailed unpaired or paired Student’s t test (as indicated in figure legends). Muscle sections used for fiber size analysis were imaged at room temperature with an inverted LSM 710 laser scanning confocal microscope (Zeiss) with a Plan-Apochromat 63× oil objective (1.4 NA) and acquired using ZEN imaging software (Zeiss) version 2014. The signals for Alexa fluor 488, Alexa fluor 594, and Alexa fluor 647 were excited with 488, 543, and 633 nm lasers, and emission was collected by GaAsp detector through 500-550, 570-616, and 640-797 band-pass filters, respectively. Data processing was performed using Imaris (Bitplane) software version 9.31. Black and white images were processed with Adobe Photoshop 2021, version 22.4.2.
Online supplemental material
Fig. S1 shows that expression of most proteasome genes return to basal levels in muscle at 14 days after denervation. Fig. S2 shows that PAX4 deficiency attenuates muscle atrophy. Fig. S3 shows that NRF-1NFE2L1 downregulation reduces the expression of some proteasome genes in denervated muscle. Fig. S4 shows that PAX4 controls the expression of the proteasome assembly chaperon PSMD5 at 3 days after denervation. Table S1 shows the summary statistics of fiber size analyses presented in Fig. S2 based on our recent methodology paper (Gilda et al., 2021). Table S2 shows the primers used for RT-PCR and ChIP assay. Table S3 shows the primers used for the genotyping of PAX4 and NRF1 KO mice. Table S4 shows potential binding sites for PAX4 (A), FOXO3 (B), NRF-1NFE2L1 (C), and α-PALNRF-1 (D) in mouse genes for proteasome subunits. Table S5 shows RNA-seq data statistics for proteasome and UPS genes in innervated versus denervated muscles (10 day) from WT or PAX4 KO mice. Table S6 shows differentially expressed genes in innervated versus denervated muscles (10 day) from PAX4 KO or α-PALNRF-1 KD mice. Table S7 shows RNA-seq data statistics for proteasome and UPS genes in WT denervated (10 day) versus α-PALNRF-1 KD or PAX4/ α-PALNRF-1 double KD muscles.
Data availability
The datasets generated and analyzed in this paper have been deposited to GEO and can be accessed at https://www.ncbi.nlm.nih.gov/geo/query/acc.cgi?acc=GSE232348.
Acknowledgments
We are extremely thankful to Thi Thuy Linh Le and Suganya Sekaran (University of Colorado, Boulder, CO, United States) for their assistance with analyses of assembled proteasomes, and the LS&E Microscopy Center at Technion for their assistance with the confocal microscope.
This project was supported by grants from the Israel Science Foundation (grant no. 1068/19) to S. Shemer (Cohen), and the National Institutes of Health (grant no. R01GM127688 and R35GM153336) to S. Park. Additional funds were received from the Russell Berrie Nanotechnology Institute, Technion to S. Shemer, and the Zuckerman STEM postdoctoral fellowship to J.E. Gilda.
Author contributions: J.E. Gilda: Conceptualization, Formal analysis, Funding acquisition, Investigation, Methodology, Project administration, Validation, Visualization, Writing–original draft, Writing–review and editing; A. Nahar: Data curation, Formal analysis; D. Kasiviswanathan: Data curation, Formal analysis, Investigation, Methodology, Validation, Visualization; N. Tropp: Investigation; T. Gilinski: Formal analysis, Software; T. Lahav: Formal analysis, Visualization; D. Alexandrovich: Data curation, Software; Y. Mandel-Gutfreund: Data curation, Supervision, Validation; S. Park: Conceptualization, Funding acquisition, Investigation, Methodology, Project administration, Supervision, Validation, Visualization, Writing–review and editing; and S. Shemer: Conceptualization, Data curation, Formal analysis, Funding acquisition, Investigation, Methodology, Project administration, Resources, Supervision, Validation, Visualization, Writing–original draft, Writing–review and editing.

