


Correct cell number generation is central to tissue development. However, in vivo roles of coordinated proliferation of individual neural progenitors in regulating cell numbers of developing neural tissues and the underlying molecular mechanism remain mostly elusive. Here, we showed that wild-type (WT) donor retinal progenitor cells (RPCs) generated significantly expanded clones in host retinae with G1-lengthening by p15 (cdkn2a/b) overexpression (p15+) in zebrafish. Further analysis showed that cell adhesion molecule 3 (cadm3) was reduced in p15+ host retinae, and overexpression of either full-length or ectodomains of Cadm3 in p15+ host retinae markedly suppressed the clonal expansion of WT donor RPCs. Notably, WT donor RPCs in retinae with cadm3 disruption recapitulated expanded clones that were found in p15+ retinae. More strikingly, overexpression of Cadm3 without extracellular ig1 domain in RPCs resulted in expanded clones and increased retinal total cell number. Thus, homophilic interaction of Cadm3 provides an intercellular mechanism underlying coordinated cell proliferation to ensure cell number homeostasis of the developing neuroepithelia.
Introduction
The central nervous systems originate from the pseudostratified neuroepithelia (Gotz and Huttner, 2005) where neural progenitor cells exhibit highly dynamic proliferation rates (He et al., 2012; Homem et al., 2015). To generate correct numbers of neurons, the developing neuroepithelia must evolve an adaptive mechanism to coordinate the proliferative behaviors of neural progenitor cells with different proliferation rates; that is, one neuroepithelial cell could adjust its proliferation rate and the size of its derived clone in response to the proliferative status of neighboring counterparts (Homem et al., 2015; Jam et al., 2020; Kim and Jain, 2020; Lanet et al., 2013). We used the developing vertebrate retina as a neuroepithelial structure to explore this. Earlier clonal studies showed that individual retinal progenitor cells (RPCs) generate lineage clones that vary greatly in cell number and type composition (He et al., 2012). Each RPC proliferates and produces about 12 differentiated cells on average during retinal development (He et al., 2012). Over the past two decades, many intrinsic factors or environmental cues that could reduce RPCs’ proliferative rates and clone sizes have been identified (Agathocleous and Harris, 2009; Cayouette et al., 2003; Kay et al., 2001; Novorol et al., 2013). However, there is no documented case of any environmental factor that could trigger clonal expansion. Cell competition often occurs in the epithelial structure, where cell–cell contacts constrain epithelial cells (Baker, 2020). Thus, we hypothesized that RPCs with different proliferation rates could compete with each other to coordinate their proliferation rates and clone sizes to achieve the stable cell number of total differentiated cells.
Cell competition is a fundamental surveillance mechanism for normal tissue integrity, tumor development, and neuroplasticity (Claveria and Torres, 2016; Gogna et al., 2015; Miguel-Aliaga and Thor, 2009). Cell competition occurs among neighboring cells with the difference in the expression of ribosome protein genes (Kongsuwan et al., 1985; Morata and Ripoll, 1975; Simpson and Morata, 1981), tumor-related genes (Bondar and Medzhitov, 2010; Bowling et al., 2018; Claveria et al., 2013; Moreno and Basler, 2004; Zhang et al., 2017), epithelial polarity genes (Agrawal et al., 1995; Brumby and Richardson, 2003), and signaling-pathway-related genes (Liu et al., 2019; Price et al., 2021). Recent studies demonstrated the marked influence of mechanical forces between two cell populations on cell competition (Matamoro-Vidal and Levayer, 2019). This intercellular difference leads to the elimination of unfitted cells (“loser cells”) and compensatory proliferation of fitted cells (“winner cells”; Penzo-Mendez and Stanger, 2014). Previous studies have gained extensive knowledge of eliminating loser cells, including the Flower-SPARC-Azot model (Portela et al., 2010; Rhiner et al., 2010) and Toll receptor-NF-κB model (Meyer et al., 2014) in Minute or Myc-induced cell competition; Slit-Robo2 system (Vaughen and Igaki, 2016) and Sas-Ptp10D system (Yamamoto et al., 2017) in Scrib−/− cell elimination from Drosophila imaginal epithelium. One study demonstrated a mechanism of compensatory growth, which showed that rapid cell expansion of oncogenic mutants occupied the space made available following normal cell apoptosis through cell-intercalation-driven topological change (Tsuboi et al., 2018). However, knowledge of the mechanism underlying winner cells’ overproliferation remains limited.
In this study, we demonstrated p15-driven cell competition in the zebrafish developing retinal neuroepithelia, in which p15 (cdkn2a/b)-overexpressed (p15+) RPCs underwent slow proliferation and generated reduced clones in WT retinae, whereas WT RPCs underwent overproliferation and generated expanded clones in p15+ retinae. Furthermore, we showed that cell adhesion molecule 3 (Cadm3) mediated cell–cell interaction was required for regulating the clonal expansion of WT donor RPCs in p15+ host retinae. More remarkably, overexpression of Cadm3 without extracellular ig1 domain in RPCs was sufficient to result in expanded clones. Thus, our findings revealed the homophilic interaction of Cadm3 as an intercellular mechanism underlying coordinated proliferation in the developing neuroepithelia.
Results
p15 overexpression decreases the RPC proliferation rate
To explore the interaction among RPCs with different proliferation rates, we began to examine the influence of p15, an inhibitor of cyclin D-CDK4/6 complex essential for G1-S transition (Hardwick et al., 2015), on cell-cycle dynamics of RPCs using Tg(zFucci), a transgenic zebrafish line marking G1 and S/G2/M cells with fluorescent proteins mKO2-zCdt1 and mAG-zGem, respectively (Sugiyama et al., 2009). We found that p15 overexpression (p15+) significantly increased the proportion of G1 RPCs at 24 h post-fertilization (hpf; Fig. 1, A and B; 69 ± 9.8 and 7 ± 1.8% for p15+ retinae and WT retinae, respectively, P = 0.0013, n = 6 retinae). This result was further confirmed by cell-cycle analysis using flow cytometry (Fig. S1 A; details in Materials and methods).

p15 overexpression decreases RPC proliferation rate. (A) Representative images showing G1 RPCs (magenta) and S/G2/M RPCs (green) in the 24-hpf retina of Tg(zFucci). Areas within white dashed contour lines are the retinae. (B) The proportions of G1 cells (magenta) in total cells in the 24-hpf retinae of Tg(zFucci) with or without p15 overexpression. (C) Schematic procedure of time-lapse imaging to measure cell-cycle length of 12-hpf RPCs. (D) Representative cases showing the time-lapse tracing of single WT RPC (upper row) and single p15+ RPC (bottom row) from 12 hpf. The yellow arrowheads indicate the RPCs undergoing mitosis. The area of dashed white circles is the optic vesicle, and the area between two dashed white lines is the retina. (E) Frequency distribution of the cell-cycle length of individual 12-hpf WT RPCs (n = 25). (F) The proportion of 12-hpf p15+ RPCs with a cell-cycle length >12 h (n = 28). Scale bars, 10 µm.
p15 overexpression decreases RPC proliferation rate. (A) Representative images showing G1 RPCs (magenta) and S/G2/M RPCs (green) in the 24-hpf retina of Tg(zFucci). Areas within white dashed contour lines are the retinae. (B) The proportions of G1 cells (magenta) in total cells in the 24-hpf retinae of Tg(zFucci) with or without p15 overexpression. (C) Schematic procedure of time-lapse imaging to measure cell-cycle length of 12-hpf RPCs. (D) Representative cases showing the time-lapse tracing of single WT RPC (upper row) and single p15+ RPC (bottom row) from 12 hpf. The yellow arrowheads indicate the RPCs undergoing mitosis. The area of dashed white circles is the optic vesicle, and the area between two dashed white lines is the retina. (E) Frequency distribution of the cell-cycle length of individual 12-hpf WT RPCs (n = 25). (F) The proportion of 12-hpf p15+ RPCs with a cell-cycle length >12 h (n = 28). Scale bars, 10 µm.

p15 + hosts induce faster proliferation of WT donor RPCs at the early proliferative stage. (A) Cell-cycle analysis of WT and p15+ retinae by flow cytometry. The first row is the WT group (G1 to G2 ratio is 2.8), and the second row is the p15+ group (G1 to G2 ratio is 4.6). (B) Representative images showing neurogenesis wave in WT and p15+ retinae by SoFa fish line, in which RGCs are labeled by Tg(atoh7:gapRFP), ACs and HCs are labeled by Tg(ptf1α:GFP), and PRs and BCs were labeled by Tg(crx:CFPcaax). Areas within white dashed contour lines are retinae. (C) F-actin distribution visualized by GFP-Utrch mRNA injection in control (top) and p15 overexpression (bottom) retinae. Zoom-in images of retinal areas (dashed yellow rectangles) are shown in the right panels. Areas within white dashed contour lines are retinae. (D) Representative images showing the nuclei of all cell types labeled in blue by Tg(actin:H2BCFP) and ACs labeled in magenta by Tg(ptf1α:DsRed). Yellow arrowheads indicate an AC (blue and magenta double positive, n = 69) and a BC (blue single positive, n = 80). (E) Quantification of nuclear diameters of BCs and ACs. (F and G) Representative cases (F) and quantification of cell-cycle length (G) of single 12-hpf WT donor RPCs in WT (top, n = 30) and p15+ (bottom, n = 10) host retinae. Yellow arrowheads show RPCs at the M phase. (H and I) Representative images (H) and quantification of size (I) of WT donor clones derived from single 12-hpf RPCs in scramble-sg (n = 25) and slbp1-disrupted (n = 7) host retinae. (J and K) Representative images (J) and quantification of size (K) of WT donor clones derived from 12-hpf RPCs upon atoh7 expression indicated by Tg(atoh7:GFP) in WT host retinae (left, n = 28) and p15+ host retinae (right, n = 16). Inserts in J describe the schematic of transplantation. The white circles indicate the first cell to turn on atoh7-GFP in one clone. (L and M) Representative images (L) and quantification of clone size (M) of 72-hpf WT donor isolated atoh7+ clones in WT host retinae (left, n = 65) and p15+ host retinae (right, n = 38). The dashed white lines represent the OPL (up) and the IPL (down) of the retinae in L. Data in E, G, I, K, and M represent mean ± SEM. Scale bars, 10 µm. OPL, the outer plexiform layer; IPL, the inner plexiform layer.
p15 + hosts induce faster proliferation of WT donor RPCs at the early proliferative stage. (A) Cell-cycle analysis of WT and p15+ retinae by flow cytometry. The first row is the WT group (G1 to G2 ratio is 2.8), and the second row is the p15+ group (G1 to G2 ratio is 4.6). (B) Representative images showing neurogenesis wave in WT and p15+ retinae by SoFa fish line, in which RGCs are labeled by Tg(atoh7:gapRFP), ACs and HCs are labeled by Tg(ptf1α:GFP), and PRs and BCs were labeled by Tg(crx:CFPcaax). Areas within white dashed contour lines are retinae. (C) F-actin distribution visualized by GFP-Utrch mRNA injection in control (top) and p15 overexpression (bottom) retinae. Zoom-in images of retinal areas (dashed yellow rectangles) are shown in the right panels. Areas within white dashed contour lines are retinae. (D) Representative images showing the nuclei of all cell types labeled in blue by Tg(actin:H2BCFP) and ACs labeled in magenta by Tg(ptf1α:DsRed). Yellow arrowheads indicate an AC (blue and magenta double positive, n = 69) and a BC (blue single positive, n = 80). (E) Quantification of nuclear diameters of BCs and ACs. (F and G) Representative cases (F) and quantification of cell-cycle length (G) of single 12-hpf WT donor RPCs in WT (top, n = 30) and p15+ (bottom, n = 10) host retinae. Yellow arrowheads show RPCs at the M phase. (H and I) Representative images (H) and quantification of size (I) of WT donor clones derived from single 12-hpf RPCs in scramble-sg (n = 25) and slbp1-disrupted (n = 7) host retinae. (J and K) Representative images (J) and quantification of size (K) of WT donor clones derived from 12-hpf RPCs upon atoh7 expression indicated by Tg(atoh7:GFP) in WT host retinae (left, n = 28) and p15+ host retinae (right, n = 16). Inserts in J describe the schematic of transplantation. The white circles indicate the first cell to turn on atoh7-GFP in one clone. (L and M) Representative images (L) and quantification of clone size (M) of 72-hpf WT donor isolated atoh7+ clones in WT host retinae (left, n = 65) and p15+ host retinae (right, n = 38). The dashed white lines represent the OPL (up) and the IPL (down) of the retinae in L. Data in E, G, I, K, and M represent mean ± SEM. Scale bars, 10 µm. OPL, the outer plexiform layer; IPL, the inner plexiform layer.
Furthermore, we performed time-lapse imaging to evaluate the influence of p15 overexpression on proliferation rates. Considering that agarose embedding used for the time-lapse is detrimental to the zebrafish developing embryos during 12–20 hpf when the optic vesicle morphogenesis occurs (Kwan et al., 2012), we decided to start the time-lapse experiment at 20 hpf. Specifically, we injected nucleus-localized photoconvertible kaede (nls-kaede) mRNAs into WT and p15+ embryos at the 16- to 32-cell stage to achieve the mosaic expression of nls-Kaede in RPCs at 12 hpf. We then marked nls-kaede–expressing RPCs that were undergoing the mitosis with red fluorescent Kaede by UV photoconversion at ∼12–14 hpf, followed by raising the embryos freely in the embryonic medium and re-embedding the embryos into the agarose for live imaging starting at ∼20 hpf for following 12 h (Fig. 1 C). The results showed that the cell-cycle length of WT RPCs was 9.1 ± 0.2 h (Fig. 1, D and E, n = 25 cases from six animals). In contrast, none of the p15+ RPCs (n = 28 cases from seven animals) could finish a complete round of cell cycle within 12 h, the time-lapse period (Fig. 1, D and F). Thus, p15+ RPCs exhibited a longer cell cycle than WT RPCs.
Besides, we examined the effect of p15 overexpression on retinal differentiation. We used SoFa transgenic lines, in which all five major retinal cell types are distinguishable by being marked with different combinations of fluorescent proteins (Almeida et al., 2014). Despite a delayed onset of differentiation waves of p15+ retinae, p15 overexpression had little effect on the final layer formation in the fully differentiated retina at 72 hpf (Fig. S1 B).
Additionally, we wondered if there was a change in cell polarity of p15+ RPCs by examining the subcellular localization of F-actin, the protein abundant in the subapical region and the basal region (Norden et al., 2009), using GFP fused with calponin homology domain of utrophin (UtrCH), an F-actin binding domain (Burkel et al., 2007). The result showed that the subcellular distribution of F-actin was not changed in p15+ RPCs, suggesting little influence of p15 overexpression on RPC polarity (Fig. S1 C).
Imbalanced p15 expression results in RPC competition
Next, we performed an in vivo clonal analysis of single RPCs in different retinal environments. We transplanted nls-kaede–expressing WT donor cells into the animal pole of p15+ or WT host embryos at the 3-hpf blastula stage, allowing the incorporation of WT donor cells into the retinae of host embryos at later stages (Fig. 2 A). Single donor RPCs were subsequently marked with red fluorescent Kaede by UV photoconversion at 12 hpf and their progeny cells (marked by red fluorescence) could be analyzed at 72 hpf when all cells in the retinae were differentiated (Fig. 2 A). Remarkably, single 12-hpf WT donor RPCs produced significantly larger clones (66 ± 3 cells/clone, n = 33 clones from 33 animals) in p15+ retinae than in WT retinae (40 ± 2 cells/clone, n = 34 clones from 31 animals; Fig. 2, B and C). In contrast, the cell-type composition of clones was statistically indistinguishable (Fig. 2 D). We identified cell types according to their nuclear position and diameter (Fig. S1, D and E, details in Materials and methods). In vivo time-lapse showed that the cell-cycle length of 12-hpf WT donor RPCs was significantly shortened in p15+ retinae (7.1 ± 0.4 h, n = 10 cases from five animals) than in WT retinae (8.5 ± 0.2 h, n = 30 cases from 16 animals; Fig. S1, F and G).

Imbalanced p15 expression results in RPC competition. (A) Schematic of clonal analysis of single 12-hpf RPCs by combining cell transplantation and photoconversion. (B and C) Representative images (B) and quantification of clone size (C) of 72-hpf clones in different retinal environments. WT → WT (n = 34) and WT → p15+ (n = 33) represent WT RPCs in WT and p15+ retinae, respectively. p15+ → WT (n = 35) and p15+ → p15+ (n = 32) represent p15+ RPCs in WT and p15+ retinae, respectively. Schematic inserts in B show the mosaicism of traced RPCs (magenta) surrounded by environmental RPCs (gray). OPL, the outer plexiform layer; IPL, the inner plexiform layer. (D) Proportions of each retinal cell type of 72-hpf clones in WT → WT, p15+ → p15+, and WT → p15+ groups. (E) Proportions of major clone types derived from single 12-hpf p15+ RPCs in WT retinae. (F and G) Representative images (F) and quantification of clone size (G) of clones derived from single 12-hpf WT (n = 29, 17, 21, 16, 12) and p15+ (n = 24, 21, 21, 20, 16) RPCs at 24, 36, 48, 60, and 72 hpf. In F, the area of dashed white circles represents the optic vesicle (12 hpf); the dashed white lines represent the apical (up) and basal (down) surfaces of the retinae (24, 36, 48, and 60 hpf), the OPL (up) and the IPL (down) of the retinae (72 hpf). Data in C and G represent mean ± SEM. Scale bars, 10 µm.
Imbalanced p15 expression results in RPC competition. (A) Schematic of clonal analysis of single 12-hpf RPCs by combining cell transplantation and photoconversion. (B and C) Representative images (B) and quantification of clone size (C) of 72-hpf clones in different retinal environments. WT → WT (n = 34) and WT → p15+ (n = 33) represent WT RPCs in WT and p15+ retinae, respectively. p15+ → WT (n = 35) and p15+ → p15+ (n = 32) represent p15+ RPCs in WT and p15+ retinae, respectively. Schematic inserts in B show the mosaicism of traced RPCs (magenta) surrounded by environmental RPCs (gray). OPL, the outer plexiform layer; IPL, the inner plexiform layer. (D) Proportions of each retinal cell type of 72-hpf clones in WT → WT, p15+ → p15+, and WT → p15+ groups. (E) Proportions of major clone types derived from single 12-hpf p15+ RPCs in WT retinae. (F and G) Representative images (F) and quantification of clone size (G) of clones derived from single 12-hpf WT (n = 29, 17, 21, 16, 12) and p15+ (n = 24, 21, 21, 20, 16) RPCs at 24, 36, 48, 60, and 72 hpf. In F, the area of dashed white circles represents the optic vesicle (12 hpf); the dashed white lines represent the apical (up) and basal (down) surfaces of the retinae (24, 36, 48, and 60 hpf), the OPL (up) and the IPL (down) of the retinae (72 hpf). Data in C and G represent mean ± SEM. Scale bars, 10 µm.
In addition, the further clonal analysis of 12-hpf WT donor RPCs in the retinae with the genetic disruption of stem loop binding protein 1 (slbp1), which was previously reported to lengthen cell-cycle S phase (Imai et al., 2014), also resulted in expanded WT donor clones (69 ± 6 cells/clone, Fig. S1, H and I). Thus, our analysis suggested that WT donor RPCs could produce expanded clones in the retina with a slower proliferation rate, independent of a particular cell-cycle phase.
Furthermore, we wondered whether this clonal expansion mainly occurred at the earlier proliferative or neurogenic stages. We then examined clones derived from single 12-hpf WT donor RPCs of Tg(atoh7:GFP) at the onset of atoh7 expression, a hallmark for the initiation of retinal neurogenesis (details in Materials and methods; Masai et al., 2003) in either p15+ retinae or WT retinae. We found that single 12-hpf WT donor RPCs produced more cells in p15+ retinae than in WT retinae at the time of the emergence of the first atoh7+ cells within clones, indicating that 12-hpf WT donor RPCs produced expanded clones at the earlier proliferative stage in p15+ retina (Fig. S1, J and K). Meanwhile, we analyzed 72-hpf clones derived from atoh7+ neurogenic donor RPCs in either p15+ retinae or WT retinae by injecting the BAC (bacterial artificial chromosome) plasmid pAtoh7-loxp-DsRed-loxp-GFP (details in Materials and methods). Interestingly, the size of atoh7+ clones was indistinguishable in p15+ retinae versus WT retinae, indicating that WT donor RPCs produced normal clones at the neurogenic stage in p15+ retinae (Fig. S1, L and M). Our results indicated that imbalanced p15 expression resulted in the clonal expansion of WT donor RPCs in p15+ retinae, mainly at the earlier proliferative stage rather than the neurogenic stage.
We next examined the clones derived from p15+ RPCs in WT or p15+ environmental retinae. We first found that p15+ RPCs produced small clones with only 5 ± 1 cells/clone (n = 35 clones from 30 animals) in WT environmental retinae (Fig. 2, B and C), indicating that the imbalanced p15 expression resulted in the clonal reduction of p15+ RPCs in WT retinae. Interestingly, most of these small clones (56.5%) comprised bipolar cells (BCs) or Müller glial cells according to their laminar positions (Fig. 2 E). In light of the critical influence of retina environment on RPC fate specification (Belliveau and Cepko, 1999), it raised the possibility that p15 overexpression-induced cell-cycle arrest results in the delayed differentiation timing of p15+ donor RPCs in WT retinae compared with host retinal cells, which could lead to the specification of p15+ donor RPCs into late-born cell types (BCs, photoreceptor cells [PRs], and Müller cells [MCs]) rather than early-born cell types (retinal ganglion cell [RGCs] and amacrine cells [ACs]; Cepko, 2014; Fig. 2 E). Thus, our results demonstrated that p15+ RPCs in WT retinae produced smaller clones that were dominant with the late-born cell types.
Meanwhile, p15+ RPCs in p15+ environmental retinae produced clones with cell numbers (38 ± 3 cells/clone, n = 32 clones from 31 animals; Fig. 2, B and C) similar to those WT RPCs in WT environmental retinae. To gain more insights into how slower-cycling p15+ RPCs could generate clones with the normal size in p15+ retinae, we examined clones derived from single p15+ RPCs (in p15+ retinae) and WT RPCs (in WT retinae) over time. Specifically, we injected p15 and nls-kaede mRNA into embryos at 1- and 32-cell stages, respectively. WT embryos were only injected with nls-kaede mRNA at 32-cell stage. Subsequently, we marked single nls-kaede–expressing RPCs (p15+ and WT) at 12 hpf by photoconversion and analyzed their derived clones at different developmental stages (24, 36, 48, 60, and 72 hpf). The result showed that the size of p15+ RPC-derived clones was significantly smaller than that of WT clones at 24 and 36 hpf. Interestingly, the clone size started to be indistinguishable from 48 hpf onward (Fig. 2, F and G), indicating that although p15+ RPCs in p15+ retinae divided slower, resulting in smaller clones until the early neurogenic stage (24 hpf and 36 hpf), they could produce the normal size clones starting at 48 hpf and onward. Thus, our results demonstrated that at the clonal level, p15+ RPCs in p15+ retinae produced normal clones as WT RPCs in WT retinae, indicating that the p15 overexpression per se did not result in clonal size change.
Taken together, imbalanced p15 expression drove RPC competition, leading to the clonal expansion of WT RPCs in p15+ retinae and the clonal reduction of p15+ RPCs in WT retinae.
Clonal reduction of p15+ donor RPCs in WT retinae is not due to apoptosis
Previous studies showed cell competition could lead to loser cell elimination via apoptosis (Claveria et al., 2013; Gogna et al., 2015). We thus wondered whether cell apoptosis accounted for the clonal reduction of p15+ cells in WT retinae. Cell apoptosis was detected by apoptosis-associated DNA breaks using whole mount TUNEL assay. The p15+ donor cells showed a significantly higher level of cell apoptosis in WT host retinae (44.6 ± 8.5%, n = 10 retinae) than in p15+ retinae (12.9 ± 2.7%, n = 11 retinae; Fig. 3, B and C). This result indicated that p15+ donor cells underwent a significantly higher level of cell apoptosis when encountering WT host RPCs. Meanwhile, the significantly lower level of cell apoptosis of p15+ donor cells encountering p15+ host RPCs ruled out the major contribution of p15 overexpression to RPC apoptosis induction. Consistently, our result showed that p15+ retinae had a relatively low level of cell apoptosis (4.6 ± 1.1%, n = 11 retinae; Fig. 3, A and C); it showed significantly lower apoptotic levels than those encountering WT RPCs. Moreover, the overexpression of bcl2a (bcl2a+) significantly reduced the number of apoptotic p15+ cells in WT retinae (Fig. 3, D and E, bcl2a+, 2.7 ± 0.9%, n = 13 retinae). Thus, p15+ cells in WT retinae underwent significant cell apoptosis.

Clonal reduction of p15 + RPCs in WT retinae is not due to apoptosis. (A) Representative image showing TUNEL signals (magenta) in 28-hpf p15 overexpression (p15+) retina (n = 11). The schematic insert shows TUNEL signals (magenta) in p15+ retinae (gray). Yellow arrowheads indicate TUNEL signals. (B) Whole mount GFP immunostaining (green) and TUNEL assay (magenta with yellow arrowheads) of 28-hpf p15+ host retinae (black box on the left, n = 11) and WT host retinae (black box on the right, n = 10) transplanted with gfp-expressing p15+ donor RPCs. Schematic inserts show TUNEL signals (magenta) in p15+ donor RPCs (green) in p15+ and WT host retinae (gray). In each group, zoom-in images of retinal areas (dashed yellow rectangles) at the merged and three separate channels are shown in the right panels. (C) The level of TUNEL signals. In the p15 mRNA group, the TUNEL level was determined by the ratio of TUNEL+ nuclear fragments to total nucleus number (DAPI+) in single retina sections (TUNEL+/DAPI+). In transplantation groups, the TUNEL level was determined by the ratio of the number of GFP+TUNEL+ (GFP and TUNEL double positive) nuclear fragments in p15+ donor RPCs to the total number of GFP+ (GFP positive) p15+ donor RPCs (GFP+TUNEL+/GFP+) in either p15+ or WT host retinae. (D) Whole mount GFP immunostaining (green) and TUNEL assay (magenta with yellow arrowheads) of 28-hpf WT host retinae transplanted with gfp-expressing p15+ (black box on the left, n = 10) or p15+/bcl2a+ (black box on the right, n = 13) donor RPCs. In each group, zoom-in images of retinal areas (dashed yellow rectangles) at the merged and three separate channels are shown in the right panels. Schematic inserts show TUNEL signals (magenta) in p15+ and p15+/bcl2a+ donor RPCs (green) in WT host retinae (gray). (E) The ratio of GFP+TUNEL+ nuclear fragments in p15+ and p15+/bcl2a+ donor RPCs to the total number of GFP+ donor RPCs in WT host retinae. (F and G) Representative images (F) and quantification of clone size (G) of 72-hpf clones derived from single 12-hpf p15+ (n = 35) and p15+/bcl2a+ (n = 41) donor RPCs in WT retinae. OPL, the outer plexiform layer; IPL, the inner plexiform layer. Areas within white dashed contour lines are retinae in A, B, and D. Data in C, E, and G represent mean ± SEM. Scale bars, 10 µm.
Clonal reduction of p15 + RPCs in WT retinae is not due to apoptosis. (A) Representative image showing TUNEL signals (magenta) in 28-hpf p15 overexpression (p15+) retina (n = 11). The schematic insert shows TUNEL signals (magenta) in p15+ retinae (gray). Yellow arrowheads indicate TUNEL signals. (B) Whole mount GFP immunostaining (green) and TUNEL assay (magenta with yellow arrowheads) of 28-hpf p15+ host retinae (black box on the left, n = 11) and WT host retinae (black box on the right, n = 10) transplanted with gfp-expressing p15+ donor RPCs. Schematic inserts show TUNEL signals (magenta) in p15+ donor RPCs (green) in p15+ and WT host retinae (gray). In each group, zoom-in images of retinal areas (dashed yellow rectangles) at the merged and three separate channels are shown in the right panels. (C) The level of TUNEL signals. In the p15 mRNA group, the TUNEL level was determined by the ratio of TUNEL+ nuclear fragments to total nucleus number (DAPI+) in single retina sections (TUNEL+/DAPI+). In transplantation groups, the TUNEL level was determined by the ratio of the number of GFP+TUNEL+ (GFP and TUNEL double positive) nuclear fragments in p15+ donor RPCs to the total number of GFP+ (GFP positive) p15+ donor RPCs (GFP+TUNEL+/GFP+) in either p15+ or WT host retinae. (D) Whole mount GFP immunostaining (green) and TUNEL assay (magenta with yellow arrowheads) of 28-hpf WT host retinae transplanted with gfp-expressing p15+ (black box on the left, n = 10) or p15+/bcl2a+ (black box on the right, n = 13) donor RPCs. In each group, zoom-in images of retinal areas (dashed yellow rectangles) at the merged and three separate channels are shown in the right panels. Schematic inserts show TUNEL signals (magenta) in p15+ and p15+/bcl2a+ donor RPCs (green) in WT host retinae (gray). (E) The ratio of GFP+TUNEL+ nuclear fragments in p15+ and p15+/bcl2a+ donor RPCs to the total number of GFP+ donor RPCs in WT host retinae. (F and G) Representative images (F) and quantification of clone size (G) of 72-hpf clones derived from single 12-hpf p15+ (n = 35) and p15+/bcl2a+ (n = 41) donor RPCs in WT retinae. OPL, the outer plexiform layer; IPL, the inner plexiform layer. Areas within white dashed contour lines are retinae in A, B, and D. Data in C, E, and G represent mean ± SEM. Scale bars, 10 µm.
Next, we examined the contribution of cell apoptosis to the clonal reduction of p15+ RPCs in WT host retinae. When blocking the apoptosis in p15+ cells by bcl2a overexpression, we found that p15+ RPCs in WT host retinae generated clones with the cell numbers that were statistically indistinguishable from those without bcl2a overexpression (6 ± 1 cells/clone, n = 41 clones from 23 animals, with bcl2a overexpression; 5 ± 1 cells/clone, n = 35 clones from 30 animals, without bcl2a overexpression; P = 0.2; Fig. 3, F and G). This result ruled out the major contribution of cell apoptosis to the clonal reduction of indicated p15+ RPCs in WT host retinae.
Clonal expansion of WT RPCs in p15+ retinae is not due to apoptotic signals
We further wondered about the contributor to the clonal expansion of WT donor RPCs in p15+ retinae. The previous study showed that in the cell cohort with imbalanced Myc expression, apoptotic elimination of low Myc-expressing cells was required for the expanded population of high Myc-expressing cells (Baker, 2020; Claveria et al., 2013; Moreno and Basler, 2004). We thus inquired whether a similar mechanism underlies the clonal expansion of WT donor RPCs in p15+ retinae. First, whole mount TUNEL assay showed higher levels of apoptosis-associated DNA breaks in p15+ host RPCs in the presence of WT donor RPCs (12.7 ± 2.8%, n = 10 retinae) than p15+ donor RPCs (2.3 ± 0.7%, n = 11 retinae; Fig. 4, A and B), indicating an increase in cell death in p15+ host RPCs encountering WT donor RPCs. We then examined the proportions of individual apoptotic p15+ host RPCs (TUNEL+) by their distance to WT donor RPC-derived clones. We found that most cell death (57.3 ± 8%) occurred near WT donor clones (Fig. S2, A and B), indicating that cell death increased near the region where the interaction of donor and host RPCs took place. Moreover, the overexpression of bcl2a (bcl2a+) could significantly reduce the number of apoptotic p15+ host cells in the presence of WT donor RPCs (Fig. 4, C and D, bcl2a+, 0.3 ± 0.2%, n = 12 retinae). Thus, in the presence of WT donor RPCs, p15+ host RPCs underwent a higher level of cell apoptosis.

Clonal expansion of WT RPCs in the p15 + retinae is not due to apoptotic signals. (A) Whole mount GFP immunostaining (green) and TUNEL assay (magenta with yellow arrowheads) of 28-hpf p15+ host retinae transplanted with gfp-expressing WT (n = 10) donor RPCs or p15+ (n = 11) donor RPCs. Schematic inserts show TUNEL signals (magenta) in p15+ host RPCs (gray) in the presence of WT donor RPCs or p15+ donor RPCs (green). In each group, zoom-in images of retinal areas (dashed yellow rectangles) at the merged and three separate channels are shown in the right panels. (B) The ratio of the number of GFP−TUNEL+ (GFP negative and TUNEL positive) nuclear fragments in p15+ host RPCs to the total number of GFP− (GFP negative) p15+ host RPCs in the presence of WT donor RPCs or p15+ donor RPCs. (C) Whole mount GFP immunostaining (green) and TUNEL assay (magenta with yellow arrowheads) of 28-hpf p15+ (n = 10) and p15+/bcl2a+ (n = 12) host retinae transplanted with gfp-expressing WT donor RPCs. Schematic inserts show TUNEL signals (magenta) in p15+ and p15+/bcl2a+ host RPCs (gray) in the presence of WT donor RPCs (green). In each group, zoom-in images of retinal areas (dashed yellow rectangles) at the merged and three separate channels are shown in the right panels. (D) The ratio of the number of GFP−TUNEL+ nuclear fragments in p15+ and p15+/bcl2a+ host RPCs to the total number of GFP− p15+ or p15+/bcl2a+ host RPCs in the presence of WT donor RPCs. (E and F) Representative images (E) and quantification of clone size (F) of 72-hpf clones derived from single 12-hpf WT donor RPCs in p15+ and p15+/bcl2a+ retinae, respectively. OPL, the outer plexiform layer; IPL, the inner plexiform layer. Areas within white dashed contour lines are retinae in A and C. Data in B, D, and F represent mean ± SEM. Scale bars, 10 µm.
Clonal expansion of WT RPCs in the p15 + retinae is not due to apoptotic signals. (A) Whole mount GFP immunostaining (green) and TUNEL assay (magenta with yellow arrowheads) of 28-hpf p15+ host retinae transplanted with gfp-expressing WT (n = 10) donor RPCs or p15+ (n = 11) donor RPCs. Schematic inserts show TUNEL signals (magenta) in p15+ host RPCs (gray) in the presence of WT donor RPCs or p15+ donor RPCs (green). In each group, zoom-in images of retinal areas (dashed yellow rectangles) at the merged and three separate channels are shown in the right panels. (B) The ratio of the number of GFP−TUNEL+ (GFP negative and TUNEL positive) nuclear fragments in p15+ host RPCs to the total number of GFP− (GFP negative) p15+ host RPCs in the presence of WT donor RPCs or p15+ donor RPCs. (C) Whole mount GFP immunostaining (green) and TUNEL assay (magenta with yellow arrowheads) of 28-hpf p15+ (n = 10) and p15+/bcl2a+ (n = 12) host retinae transplanted with gfp-expressing WT donor RPCs. Schematic inserts show TUNEL signals (magenta) in p15+ and p15+/bcl2a+ host RPCs (gray) in the presence of WT donor RPCs (green). In each group, zoom-in images of retinal areas (dashed yellow rectangles) at the merged and three separate channels are shown in the right panels. (D) The ratio of the number of GFP−TUNEL+ nuclear fragments in p15+ and p15+/bcl2a+ host RPCs to the total number of GFP− p15+ or p15+/bcl2a+ host RPCs in the presence of WT donor RPCs. (E and F) Representative images (E) and quantification of clone size (F) of 72-hpf clones derived from single 12-hpf WT donor RPCs in p15+ and p15+/bcl2a+ retinae, respectively. OPL, the outer plexiform layer; IPL, the inner plexiform layer. Areas within white dashed contour lines are retinae in A and C. Data in B, D, and F represent mean ± SEM. Scale bars, 10 µm.

Differential expressed genes in WT donor and p15 + host RPCs. (A) Slice GFP immunostaining (green) and TUNEL assay (magenta with yellow arrowheads) of p15+ host retinae at 28 hpf transplanted with gfp-expressing WT donor RPCs. Zoom-in images of retinal areas (dashed yellow rectangle) at three separate channels are shown in the right panels. Schematic inserts show TUNEL signals (magenta) in p15+ host RPCs (gray) neighboring to WT donor RPCs (green). Areas within white dashed contour lines are retinae. Scale bars, 10 µm. (B) Ratios of the number of TUNEL+ p15+ host RPCs per section with the location (distance, measured by soma numbers) relative to the closest GFP+ WT donor RPCs to total TUNEL+ cell number in p15+ retinae. Data represent mean ± SEM. (C) GO analysis of highly expressed genes (fold change of FPKM > 3) in p15+ host RPCs compared to WT donor RPCs. (D) GO analysis of highly expressed genes (fold change of FPKM > 3) in WT donor RPCs compared to p15+ host RPCs. (E) Heatmap of marker genes of four cell states in p15+ host (green bar) and WT donor (magenta bar) RPCs at 24 hpf.
Differential expressed genes in WT donor and p15 + host RPCs. (A) Slice GFP immunostaining (green) and TUNEL assay (magenta with yellow arrowheads) of p15+ host retinae at 28 hpf transplanted with gfp-expressing WT donor RPCs. Zoom-in images of retinal areas (dashed yellow rectangle) at three separate channels are shown in the right panels. Schematic inserts show TUNEL signals (magenta) in p15+ host RPCs (gray) neighboring to WT donor RPCs (green). Areas within white dashed contour lines are retinae. Scale bars, 10 µm. (B) Ratios of the number of TUNEL+ p15+ host RPCs per section with the location (distance, measured by soma numbers) relative to the closest GFP+ WT donor RPCs to total TUNEL+ cell number in p15+ retinae. Data represent mean ± SEM. (C) GO analysis of highly expressed genes (fold change of FPKM > 3) in p15+ host RPCs compared to WT donor RPCs. (D) GO analysis of highly expressed genes (fold change of FPKM > 3) in WT donor RPCs compared to p15+ host RPCs. (E) Heatmap of marker genes of four cell states in p15+ host (green bar) and WT donor (magenta bar) RPCs at 24 hpf.
We then examined the contribution of cell apoptosis of p15+ host cells to the clonal expansion of WT donor RPCs. Notably, while the overexpression of bcl2a in p15+ host RPCs significantly reduced TUNEL signals in p15+ host RPCs (Fig. 4, C and D), it had little influence on the clonal expansion of WT donor RPCs in p15+ retinae (62 ± 4 cells/clone, n = 29 clones from 23 animals, with bcl2a overexpression; 66 ± 3 cells/clone, n = 33 clones from 33 animals, without bcl2a overexpression; P = 0.48; Fig. 4, E and F). These results indicated that clonal expansion of WT RPCs in p15+ retinae was not due to apoptotic signals, suggesting an unknown mechanism other than apoptosis from neighboring p15+ RPCs accounting for the clonal expansion of WT donor RPCs in p15+ retinae.
Tempo-spatial expression and subcellular localization of Cadm3
To explore this unknown mechanism, we performed RNA-sequencing (RNA-seq) of isolated WT donor RPCs and p15+ host RPCs tagged with H2B-RFP and GFP at 24 hpf, respectively (Fig. 5 A). We showed Gene Ontology (GO) analysis of differentially expressed genes between WT donor and p15+ host RPCs (Fig. S2, C and D). Our earlier study showed that 24-hpf RPCs exhibited three developmental states, each expressing specific marker genes (State 1, fabp11a, npm1a, her9; State 2, fabp7a, her4.1, her4.4; and State 3, dla, dld, neurod1; Xu et al., 2020). By examining the expression of these state-specific genes in WT donor RPCs and p15+ host RPCs, we found that p15+ host RPCs expressed more State 1–specific genes, which essentially represented the features of cell stemness maintenance (fabp11a, npm1a, her9, and wls; Fig. S2 E). In contrast, WT donor RPCs expressed more State 2–specific genes, primarily representing the features of fast cell proliferation (her4.1, her4.4, her12, and tubb2b; Fig. S2 E). This analysis suggested that p15+ host RPCs were at the state of retinal development earlier than WT donor RPCs.

Tempo-spatial expression and subcellular localization of Cadm3. (A) The workflow of RNA-seq. (B) Heat-map of gene expression showing the top 20 highly expressed genes in WT donor compared with p15+ host RPCs. (C) The quantification of cadm3 expression in WT donor RPCs and p15+ host RPCs by real-time qPCR. Data represent mean ± SEM. (D) In situ hybridization showing the cadm3 expression in WT retinae at 24, 36, 48, and 72 hpf. At 72 hpf, the zoom-in image shows the ciliary marginal zone (CMZ). Areas within white dashed contour lines are retinae. (E) Images showing the localization of Cadm3 protein on cell membrane at 24 hpf in retinae by co-injecting cadm3-GFP and mCherry-UtrCH mRNAs. (F) The left panel shows a representative image of the asymmetric distribution of Cadm3 protein in WT donor RPCs in p15+ host retinae (n = 22) and the right panel shows a representative image of evenly distributed Cadm3 protein with ig1 domain deleted (Cadm3-ig1De) in WT donor RPCs in p15+ host retinae (n = 33). (G) Time-lapse of Cadm3-GFP in WT donor RPCs in p15+ host retinae. The dashed white lines in E–G represent apical and basal side of the retina. The yellow and white arrowheads in G respectively indicate the apical and basal terminals of Cadm3-GFP expression. (H) Summary schematic describing a proposed working model accounting for the distribution patterns of full-length (top) and ig1-deleted (bottom) Cadm3 proteins. Scale bars, 10 µm.
Tempo-spatial expression and subcellular localization of Cadm3. (A) The workflow of RNA-seq. (B) Heat-map of gene expression showing the top 20 highly expressed genes in WT donor compared with p15+ host RPCs. (C) The quantification of cadm3 expression in WT donor RPCs and p15+ host RPCs by real-time qPCR. Data represent mean ± SEM. (D) In situ hybridization showing the cadm3 expression in WT retinae at 24, 36, 48, and 72 hpf. At 72 hpf, the zoom-in image shows the ciliary marginal zone (CMZ). Areas within white dashed contour lines are retinae. (E) Images showing the localization of Cadm3 protein on cell membrane at 24 hpf in retinae by co-injecting cadm3-GFP and mCherry-UtrCH mRNAs. (F) The left panel shows a representative image of the asymmetric distribution of Cadm3 protein in WT donor RPCs in p15+ host retinae (n = 22) and the right panel shows a representative image of evenly distributed Cadm3 protein with ig1 domain deleted (Cadm3-ig1De) in WT donor RPCs in p15+ host retinae (n = 33). (G) Time-lapse of Cadm3-GFP in WT donor RPCs in p15+ host retinae. The dashed white lines in E–G represent apical and basal side of the retina. The yellow and white arrowheads in G respectively indicate the apical and basal terminals of Cadm3-GFP expression. (H) Summary schematic describing a proposed working model accounting for the distribution patterns of full-length (top) and ig1-deleted (bottom) Cadm3 proteins. Scale bars, 10 µm.
Further analysis showed that cadm3 was significantly downregulated in p15+ host RPCs (Fig. 5 B and Fig. S3 A), which was further confirmed by quantitative real-time PCR (Fig. 5 C). Cadm3 belongs to a family of calcium-independent cell adhesion molecule genes proposed as tumor suppressors in various cancers, such as glioma, prostate cancer, and colon cancer (Chang et al., 2010; Chen et al., 2021; Gao et al., 2009). Interestingly, cadm3 shows a brain-specific expression pattern (Kakunaga et al., 2005). In the nervous systems, heterophilic interaction of Cadm3 with other members has been reported to involve axon myelination (Elazar et al., 2019; Maurel et al., 2007; Park et al., 2008; Perlin and Talbot, 2007). However, the function of Cadm3 in the developing neuroepithelia structure remains largely unexplored. Our result raised the possibility that reduced Cadm3 in p15+ host RPCs might be responsible for the clonal expansion of WT donor RPCs in p15+ retinae.
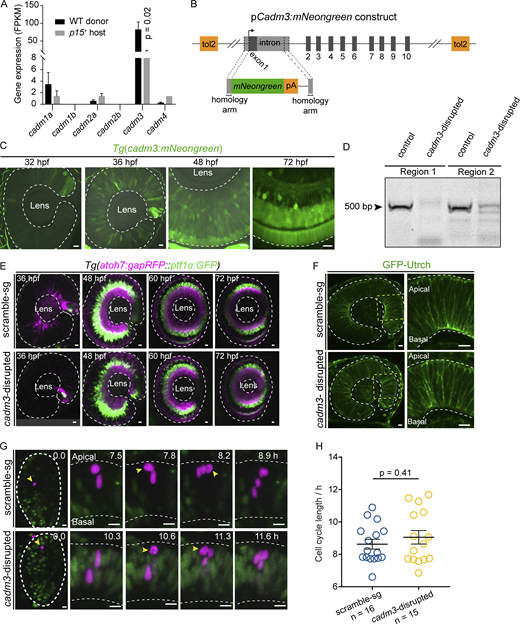
The expression of cadm3 and phenotypes of cadm3-disrupted retinae. (A) Quantification of expression (FPKM) of Cadm family genes (cadm1a, cadm1b, cadm2a, cadm2b, cadm3, and cadm4) in WT donor and p15+ host RPCs. (B) Design of BAC plasmid of cadm3:mNeongreen. (C)cadm3:mNeongreen transgenic fish line showing the expression patterns of cadm3 at 32, 36, 48, and 72 hpf. (D) Image showing gel electrophoresis of DNA fragments resulting from genomic editing by Cas9/cadm3 sgRNAs (region 1 covering sg-1 and sg-2; region 2 covering sg-3 and sg-4). (E) Representative images showing neurogenesis wave and retinal lamination in scramble-sg and cadm3-disrupted retinae by Tg(atoh7:gapRFP:: ptf1α:GFP) fish line, in which RGCs and PRs are labeled by Tg(atoh7:gapRFP), and ACs and HCs are labeled by Tg(ptf1α:GFP).(F) F-actin distribution visualized by GFP-Utrch mRNA injection in scramble-sg (top) and cadm3-disrupted (down) retinae. Zoom-in images of retinal areas (dashed yellow rectangles) are shown in the right panels. Areas within white dashed contour lines are retinae in C, E, and F. (G and H) Representative cases (G) and quantification of cell-cycle length (H) of single 12-hpf scramble-sg (top, n = 16) and cadm3-disrupted (bottom, n = 15) RPCs. Yellow arrowheads show RPCs at the M phase. The area of dashed white circles is the optic vesicle, and the area between two dashed white lines is the retina. Data in A and H represent mean ± SEM. Scale bars, 10 µm. Source data are available for this figure: SourceData FS3.
The expression of cadm3 and phenotypes of cadm3-disrupted retinae. (A) Quantification of expression (FPKM) of Cadm family genes (cadm1a, cadm1b, cadm2a, cadm2b, cadm3, and cadm4) in WT donor and p15+ host RPCs. (B) Design of BAC plasmid of cadm3:mNeongreen. (C)cadm3:mNeongreen transgenic fish line showing the expression patterns of cadm3 at 32, 36, 48, and 72 hpf. (D) Image showing gel electrophoresis of DNA fragments resulting from genomic editing by Cas9/cadm3 sgRNAs (region 1 covering sg-1 and sg-2; region 2 covering sg-3 and sg-4). (E) Representative images showing neurogenesis wave and retinal lamination in scramble-sg and cadm3-disrupted retinae by Tg(atoh7:gapRFP:: ptf1α:GFP) fish line, in which RGCs and PRs are labeled by Tg(atoh7:gapRFP), and ACs and HCs are labeled by Tg(ptf1α:GFP).(F) F-actin distribution visualized by GFP-Utrch mRNA injection in scramble-sg (top) and cadm3-disrupted (down) retinae. Zoom-in images of retinal areas (dashed yellow rectangles) are shown in the right panels. Areas within white dashed contour lines are retinae in C, E, and F. (G and H) Representative cases (G) and quantification of cell-cycle length (H) of single 12-hpf scramble-sg (top, n = 16) and cadm3-disrupted (bottom, n = 15) RPCs. Yellow arrowheads show RPCs at the M phase. The area of dashed white circles is the optic vesicle, and the area between two dashed white lines is the retina. Data in A and H represent mean ± SEM. Scale bars, 10 µm. Source data are available for this figure: SourceData FS3.
To examine the endogenous cadm3 expression in the developing retina, we performed in situ hybridization of cadm3 and found that it was broadly expressed at 24 and 36 hpf and was highly expressed at an apical half of the retina at 48 hpf and became abundant in the central (fast-cycling cells) but not peripheral (low-cycling cells) regions of the ciliary marginal zone at 72 hpf (Fig. 5 D; Tang et al., 2017). We also generated a transgenic line Tg(cadm3:mNeonGreen) (Fig. S3 B), in which the green fluorescence could be visualized starting at 32 hpf. We recapitulated the in situ result of a retina-wide expression at 36 hpf and an apically enriched expression at 48 hpf (Fig. S3 C). Thus, cadm3 exhibited a ubiquitous but dynamic expression in the developing retina.
We next examined the subcellular localization of Cadm3 protein, which contains three extracellular immunoglobulin-like (ig-like) domains and two intracellular binding domains (a PDZ and a protein 4.1B binding motif) and is known to mediate cell–cell adhesion through homo- or heterophilic interaction between ig1 ectodomains of the same or different family members on two cell surfaces, respectively (Dong et al., 2006; Zhou et al., 2005). Live imaging of the subcellular location of GFP-fused Cadm3 (Cadm3-GFP) showed that it was mainly distributed at the lateral membrane side and was excluded from the apical and basal regions with the dense distribution of F-actin visualized by mCherry fused with UtrCH (Burkel et al., 2007; Fig. 5 E). More interestingly, in p15+ retinae, Cadm3 was unilaterally distributed on the lateral membrane between two WT donor RPCs but was primarily absent from the lateral membrane between WT donor RPCs and p15+ host RPCs (Fig. 5, F and H). In vivo time-lapse of Cadm3-GFP showed the temporal dynamics of unilaterally distributed Cadm3 as cell-cycle progression (Fig. 5 G). However, GFP-fused Cadm3 with ig1 domain deleted (Cadm3-ig1De-GFP) was evenly distributed in the entire lateral membrane in WT donor RPCs in p15+ retinae (Fig. 5, F and H), although Cadm3-ig1De-GFP was partially expressed in the cytoplasm, which was likely due to a decrease in membrane anchoring as a result of ig1 domain deletion. These results suggested that the homophilic interaction of Cadm3 could reinforce its lateral cell–cell adhesion.
Downregulation of cadm3 in p15+ retinae is required for clonal expansion of WT donor RPCs
To directly examine whether cadm3 downregulation in the p15+ retinae was required for the clonal expansion of WT donor RPCs, we injected cadm3 mRNA together with p15 mRNA at one-cell stage to produce the host embryos. We found that the clones derived from WT donor RPCs in p15+/cadm3+ host retinae became significantly smaller (50 ± 3 cells/clone, n = 21 clones from 18 animals) than those in p15+ retinae (Fig. 6, A and B). Note that WT donor RPCs in cadm3+ host retinae produced normal clones (43 ± 3 cells/clone, n = 6 clones from five animals; Fig. S4, A and B). These results indicated that downregulated cadm3 expression due to p15 overexpression was required for the clonal expansion of WT donor RPCs in p15+ retinae. Besides, we also examined the influence of cadm3 overexpression on the apoptosis of p15+ donor RPCs in WT retinae and found cadm3 overexpression has little effect on cell apoptosis (Fig. S4, C and D).

Downregulation of cadm3 in p15 + retinae is required for clonal expansion of WT donor RPCs. (A) Representative clones derived from single 12-hpf WT donor RPCs in WT (n = 34), p15+ (n = 32), p15+/cadm3+ (n = 21), or p15+/cadm3-ect+ (n = 28) host retinae. (B) Quantification of the size of 72-hpf clones in A. (C) Representative clones derived from single 12-hpf WT donor RPCs in scramble-sg (n = 25) or cadm3-disrupted (n = 29) host retinae. Inserts (top) in A and C describe the patterns of Cadm3-mediated cell–cell interaction in different conditions. (D) Quantification of the size of 72-hpf clones in C. (E and F) Representative cases (E) and quantification of cell-cycle length (F) of single 12-hpf WT donor RPCs in scramble-sg (top, n = 17) and cadm3-disrupted (bottom, n = 12) host retinae. The area of dashed white circles is the optic vesicle, and the area between two dashed white lines is the retina. Yellow arrowheads show RPCs at the M phase. OPL, the outer plexiform layer; IPL, the inner plexiform layer. Data in B, D, and F represent mean ± SEM. Scale bars, 10 µm.
Downregulation of cadm3 in p15 + retinae is required for clonal expansion of WT donor RPCs. (A) Representative clones derived from single 12-hpf WT donor RPCs in WT (n = 34), p15+ (n = 32), p15+/cadm3+ (n = 21), or p15+/cadm3-ect+ (n = 28) host retinae. (B) Quantification of the size of 72-hpf clones in A. (C) Representative clones derived from single 12-hpf WT donor RPCs in scramble-sg (n = 25) or cadm3-disrupted (n = 29) host retinae. Inserts (top) in A and C describe the patterns of Cadm3-mediated cell–cell interaction in different conditions. (D) Quantification of the size of 72-hpf clones in C. (E and F) Representative cases (E) and quantification of cell-cycle length (F) of single 12-hpf WT donor RPCs in scramble-sg (top, n = 17) and cadm3-disrupted (bottom, n = 12) host retinae. The area of dashed white circles is the optic vesicle, and the area between two dashed white lines is the retina. Yellow arrowheads show RPCs at the M phase. OPL, the outer plexiform layer; IPL, the inner plexiform layer. Data in B, D, and F represent mean ± SEM. Scale bars, 10 µm.

cadm1a and cadm4 play few roles in coordinated RPC proliferation. (A) Representative clones derived from single 12-hpf WT donor RPCs in WT (n = 34), cadm3+ (n = 5), and cadm3-ect+ (n = 4) host retinae. (B) The quantification of the size of 72-hpf clones in A. (C) Whole mount GFP immunostaining (green) and TUNEL assay (magenta with yellow arrowheads) of 28-hpf WT host retinae transplanted with gfp-expressing p15+ (black box on the left, n = 10) or p15+/cadm3+ (black box on the right, n = 10) donor RPCs. In each group, zoom-in images of retinal areas (dashed yellow rectangles) at the merged and three separate channels are shown in the right panels. Schematic inserts show TUNEL signals (magenta) in p15+ and p15+/cadm3+ donor RPCs (green) in WT host retinae (gray). Areas within white dashed contour lines are retinae. (D) The ratio of the number of GFP+TUNEL+ nuclear fragments in p15+ and p15+/cadm3+ donor RPCs to the total number of GFP+ donor RPCs in WT host retinae. (E) Representative clones derived from single 12-hpf WT donor RPCs in WT, p15+, p15+/cadm1a+ (n = 29), or p15+/cadm4+ (n = 25) host retinae. (F) Quantification of the size of 72-hpf clones in E. (G) Representative clones derived from single 12-hpf WT donor RPCs in scramble-sg (n = 25), cadm1a-disrupted (n = 28), or cadm4-disrupted (n = 25) host retinae. (H) Quantification of the size of 72-hpf clones in G. Data in B, D, F, and H represent mean ± SEM. Scale bars, 10 µm. OPL, the outer plexiform layer; IPL, the inner plexiform layer.
cadm1a and cadm4 play few roles in coordinated RPC proliferation. (A) Representative clones derived from single 12-hpf WT donor RPCs in WT (n = 34), cadm3+ (n = 5), and cadm3-ect+ (n = 4) host retinae. (B) The quantification of the size of 72-hpf clones in A. (C) Whole mount GFP immunostaining (green) and TUNEL assay (magenta with yellow arrowheads) of 28-hpf WT host retinae transplanted with gfp-expressing p15+ (black box on the left, n = 10) or p15+/cadm3+ (black box on the right, n = 10) donor RPCs. In each group, zoom-in images of retinal areas (dashed yellow rectangles) at the merged and three separate channels are shown in the right panels. Schematic inserts show TUNEL signals (magenta) in p15+ and p15+/cadm3+ donor RPCs (green) in WT host retinae (gray). Areas within white dashed contour lines are retinae. (D) The ratio of the number of GFP+TUNEL+ nuclear fragments in p15+ and p15+/cadm3+ donor RPCs to the total number of GFP+ donor RPCs in WT host retinae. (E) Representative clones derived from single 12-hpf WT donor RPCs in WT, p15+, p15+/cadm1a+ (n = 29), or p15+/cadm4+ (n = 25) host retinae. (F) Quantification of the size of 72-hpf clones in E. (G) Representative clones derived from single 12-hpf WT donor RPCs in scramble-sg (n = 25), cadm1a-disrupted (n = 28), or cadm4-disrupted (n = 25) host retinae. (H) Quantification of the size of 72-hpf clones in G. Data in B, D, F, and H represent mean ± SEM. Scale bars, 10 µm. OPL, the outer plexiform layer; IPL, the inner plexiform layer.
To further determine whether the action of Cadm3 in regulating WT donor clonal expansion is entirely mediated by its ectodomain involved in cell–cell interaction (Dong et al., 2006), we overexpressed a mutated cadm3 with the ectodomain only (cadm3-ect) in together with p15. We also found that the clones derived from WT donor RPCs in p15+/cadm3-ect+ host retinae became significantly smaller (46 ± 2 cells/clone, n = 28 clones from 22 animals) than those in p15+ retinae (Fig. 6, A and B). Also, WT donor RPCs in cadm3-ect+ host retinae produced normal clones (47 ± 5 cells/clone, n = 4 clones from four animals; Fig. S4, A and B). Together, all results indicated that the overexpression of Cadm3 ectodomain in the neighboring p15+ RPCs was sufficient to provide the normal cell–cell interaction signal for triggering the normal proliferation of transplanted WT donor RPCs.
To further examine whether cadm3 downregulation alone in host retinae is sufficient for triggering the clonal expansion of WT donor RPCs, we genetically disrupted cadm3 expression using CRISPR/Cas9 editing in the host embryo by injecting the CRISPR/Cas9 with four cadm3-targeting small guide RNAs (sgRNAs) at one-cell stage (Fig. S3 D, see Materials and methods). Like p15+ retinae (Fig. S1 B), cadm3-disrupted retinae showed delayed neurogenesis onset but overall normal retinal development at 72 hpf (Fig. S3 E). Also, cadm3-disrupted retinae showed normal epithelial polarity visualized by F-actin distribution (Fig. S3 F). Remarkably, WT donor RPCs transplanted into cadm3-disrupted retinae generated larger clones (65 ± 4 cells/clone, n = 29 clones from 25 animals) with sizes similar to those found in p15+ retinae (Fig. 6, C and D). Consistently, the time-lapse imaging also showed that WT donor RPCs divided faster in cadm3-disrupted retinae (cell-cycle length, 7.2 ± 0.3 h, n = 12 cases from five animals) than in scramble-sgRNA-injected retinae (cell-cycle length, 9.7 ± 0.3 h, n = 17 cases from five animals; Fig. 6, E and F). Besides, cadm3-disrupted RPCs showed cell-cycle length (9.1 ± 0.4 h, n = 15 cases from six animals) that was statistically indistinguishable from that of scramble-sg-injected RPCs (cell-cycle length, 8.6 ± 0.3 h, n = 16 cases from five animals; Fig. S3, G and H). Thus, Cadm3 downregulation is required for clonal expansion of WT donor RPCs in p15+ retinae.
The previous study showed that Cadm3 could mediate cell–cell interaction via either homophilic interaction with Cadm3 or heterophilic interaction with Cadm1a and Cadm4 in zebrafish tissues (Hunter et al., 2011). To first test the contribution of heterophilic interaction of Cadm3 with Cadm1a or Cadm4 to clonal expansion of WT donor RPCs in p15+ retinae, we analyzed the WT donor clones in p15+/cadm1a+ (56 ± 3 cells/clone, n = 29 clones from 24 animals) and p15+/cadm4+ (67 ± 3 cells/clone, n = 25 clones from 18 animals) host retinae, respectively (Fig. S4, E and F). The results showed that while overexpression of cadm1a in p15+ host retinae slightly reduced WT donor clonal expansion, cadm4 had no effect. Moreover, we found that WT donor RPCs in cadm1a-disrupted or cadm4-disrupted host retinae produced clones (cadm1a-disrupted, 50 ± 2 cells/clone, n = 28 clones from 23 animals; cadm4-disrupted 47 ± 3 cell/clone, n = 25 clones from 19 animals), which were indistinguishable from those in scramble-disrupted host retinae (48.5 ± 3 cells/clone, n = 25 clones from 18 animals; Fig. S4, G and H). Together with the result that the expression level of cadm3 was more than 10-fold higher than that of other members of the gene family (cadm1a, 1b, 2a, 2b, 4; Fig. S3 A), we thus excluded a major contribution of heterophilic interaction to clonal expansion. The results above indicated that the reduction of Cadm3-mediated cell–cell homophilic interaction between WT donor RPCs and p15+ host RPCs was primarily responsible for triggering the clonal expansion of WT donor RPCs.
Cadm3 failed in homophilic interaction could drive the clonal expansion of RPCs
To further ask if Cadm3 failed in homophilic interaction drove the clonal expansion of RPCs, we overexpressed Cadm3-ig1De in the embryo, a negative dominant form that competes with endogenous Cadm3 proteins. We injected mRNA of cadm3-ig1De into WT embryos at one-cell stage, followed by nls-kaede mRNA injection at the 32-cell stage, which resulted in mosaic nls-kaede labeling of RPCs in retinae expressing cadm3-ig1De. Notably, the clonal analysis showed that RPCs expressing cadm3-ig1De generated expanded clones (56 ± 3 cells/clone, n = 27 clones from 25 animals) compared with those derived from RPCs in WT embryos with nls-kaede injection only (40 ± 3 cells/clone, n = 26 clones from 24 animals; Fig. 7, A and B). Meanwhile, time-lapse imaging showed that cadm3-ig1De–expressing RPCs had significantly shorter cell-cycle lengths than WT RPCs (cadm3-ig1De–expressing RPCs, 8.2 ± 0.2 h, n = 22 cases from seven animals; WT RPCs, 9.0 ± 0.2 h, n = 34 cases from eight animals). Consistently, transplanted RPCs with the overexpression of cadm3-ig1De but not full-length cadm3 produced expanded clones in WT retinae (Fig. S5, B and C). No clonal expansion by full-length cadm3 overexpression is not due to the failure in overexpressing Cadm3 on RPCs’ membrane (Fig. S5 F). Regarding why the cadm3-overexpression RPCs did not produce expanded clones in the WT retinae, our result showed that Cadm3-GFP was not evenly distributed on the lateral membrane of Cadm3-GFP–overexpressing RPCs in the WT retina (Fig. S5, D and E). Specifically, there was a higher Cadm3 expression level at the cell membrane between two Cadm3-GFP–overexpressing RPCs than between one Cadm3-GFP–overexpressing RPC and one WT RPC. This result suggested that Cadm3 of cadm3-overexpressing RPCs could interact mainly with Cadm3 of neighboring cadm3-overexpressing RPCs, while the remaining ones could interact with that of neighboring WT RPCs. Thus, most overexpressed Cadm3 is likely to interact with those of neighboring cells, thereby preventing the clonal expansion of cadm3-overexpressing RPCs in the WT retinae.

Cadm3 failed in homophilic interaction could drive the clonal expansion of RPCs. (A and B) Representative images (A) and quantification of clone size (B) of 72-hpf clones in WT retinae (n = 26) or retinae with cadm3-ig1De expression (n = 27). Inserts (top) in A describe the patterns of Cadm3-mediated cell–cell interaction in different conditions. OPL, the outer plexiform layer; IPL, the inner plexiform layer. (C and D) Representative cases (C) and quantification of cell-cycle length (D) of single 12-hpf WT (top, n = 34) and cadm3-ig1De+ (bottom, n = 22) RPCs. The area of dashed white circles is the optic vesicle, and the area between two dashed white lines is the retina. Yellow arrowheads show RPCs at the M phase. (E) Representative DAPI staining images showing the most central coronal sections with the optic nerve of 72-hpf WT (gfp mRNA injection control, top, n = 13) and cadm3-ig1De+ (bottom, n = 18) retinae. Yellow dashed contour lines show 30° sectors centered around the center of the lens beside the optic nerve. Areas within white dashed contour lines are the retinae. (F) Quantification of total cell number (DAPI+) per 30° sector in the coronal sections of WT and cadm3-ig1De+ retinae. (G) Summary schematic describing Cadm3-mediated cell competition model. Data in B, D, and F represent mean ± SEM. Scale bars, 10 µm.
Cadm3 failed in homophilic interaction could drive the clonal expansion of RPCs. (A and B) Representative images (A) and quantification of clone size (B) of 72-hpf clones in WT retinae (n = 26) or retinae with cadm3-ig1De expression (n = 27). Inserts (top) in A describe the patterns of Cadm3-mediated cell–cell interaction in different conditions. OPL, the outer plexiform layer; IPL, the inner plexiform layer. (C and D) Representative cases (C) and quantification of cell-cycle length (D) of single 12-hpf WT (top, n = 34) and cadm3-ig1De+ (bottom, n = 22) RPCs. The area of dashed white circles is the optic vesicle, and the area between two dashed white lines is the retina. Yellow arrowheads show RPCs at the M phase. (E) Representative DAPI staining images showing the most central coronal sections with the optic nerve of 72-hpf WT (gfp mRNA injection control, top, n = 13) and cadm3-ig1De+ (bottom, n = 18) retinae. Yellow dashed contour lines show 30° sectors centered around the center of the lens beside the optic nerve. Areas within white dashed contour lines are the retinae. (F) Quantification of total cell number (DAPI+) per 30° sector in the coronal sections of WT and cadm3-ig1De+ retinae. (G) Summary schematic describing Cadm3-mediated cell competition model. Data in B, D, and F represent mean ± SEM. Scale bars, 10 µm.

cadm3-ig1De + but not cadm3 + RPCs produce expanded clones in WT host retinae. (A) Representative images showing neurogenesis wave in WT and cadm3-ig1De+ retinae by SoFa fish line. Areas within white dashed contour lines are retinae. (B) Representative clones derived from single 12-hpf WT, cadm3-ig1De+ (n = 24), or cadm3+ (n = 19) donor RPCs in WT host retinae. OPL, the outer plexiform layer; IPL, the inner plexiform layer. (C) Quantification of the size of 72-hpf clones in B. Data in C represent mean ± SEM. (D) A representative image showing the distribution of Cadm3-GFP fusion protein on the membrane of cadm3-overexpressing donor RPCs in WT host retinae. The orange dashed rectangle circles a region (1) of the membrane between one cadm3-overexpressing donor RPC and one WT host RPC. The yellow dashed rectangle circles a region (2) of the membrane between two cadm3-overexpressing RPCs. Zoom-in images of region 1 and region 2 are shown in the under panel. (E) Quantification of the mean gray value of membrane GFP in region 1 and region 2 using ImageJ software. (F) Images showing Cadm3-GFP expression on the cell membrane in the 28- and 34-hpf retinae. Areas between two dashed white lines are retinae in D and F. Scale bars, 10 µm.
cadm3-ig1De + but not cadm3 + RPCs produce expanded clones in WT host retinae. (A) Representative images showing neurogenesis wave in WT and cadm3-ig1De+ retinae by SoFa fish line. Areas within white dashed contour lines are retinae. (B) Representative clones derived from single 12-hpf WT, cadm3-ig1De+ (n = 24), or cadm3+ (n = 19) donor RPCs in WT host retinae. OPL, the outer plexiform layer; IPL, the inner plexiform layer. (C) Quantification of the size of 72-hpf clones in B. Data in C represent mean ± SEM. (D) A representative image showing the distribution of Cadm3-GFP fusion protein on the membrane of cadm3-overexpressing donor RPCs in WT host retinae. The orange dashed rectangle circles a region (1) of the membrane between one cadm3-overexpressing donor RPC and one WT host RPC. The yellow dashed rectangle circles a region (2) of the membrane between two cadm3-overexpressing RPCs. Zoom-in images of region 1 and region 2 are shown in the under panel. (E) Quantification of the mean gray value of membrane GFP in region 1 and region 2 using ImageJ software. (F) Images showing Cadm3-GFP expression on the cell membrane in the 28- and 34-hpf retinae. Areas between two dashed white lines are retinae in D and F. Scale bars, 10 µm.
Finally, we wondered whether cadm3-ig1De expression could increase the total cell number of 72-hpf retinae. We quantified the total cell number in an area of a 30° sector within the most central coronal section with the optic nerve of 72-hpf retinae. Notably, we found that cadm3-ig1De expression significantly increased the total cell number in a unit area (Fig. 7, E and F, 225 ± 4 cells/unit, n = 18 sections from 18 animals, cadm3-ig1De+; 181 ± 7 cells/unit, n = 13 sections from 13 animals, WT; P < 0.0001). We note that the increase in cell numbers at the tissue level was not as high as at the clonal level. The possible reason was the heterogeneous expression of cadm3-ig1De because of mRNA injection. Specifically, Cadm3-ig1De-high RPCs may generate larger clones than Cadm3-ig1De-low RPCs. At the clonal level, we collected those clones derived from Cadm3-ig1De-high RPCs according to the intensity of fluorescent proteins. However, at the tissue level, the area of a 30° sector contained clones derived from both Cadm3-ig1De-high and -low RPCs. Additionally, the Sofa fish line showed that expression of cadm3-ig1De had little influence on overall retina development (Fig. S5 A). Thus, the increased level of Cadm3 failed in homophilic interaction could lead to clonal expansion of RPCs, thereby resulting in an increased total cell number at the retinal tissue level.
Discussion
As a fundamental surveillance mechanism, cell competition is critical for the development and integrity of normal tissues and tumors (Baker, 2020; Penzo-Mendez and Stanger, 2014). However, whether a cell competition mechanism is at work in maintaining cell number homeostasis of the developing neuroepithelia has yet to be documented. In this study, we explicitly demonstrated the cell competition among RPCs with different proliferation rates due to mosaic p15 overexpression in the developing retina. When transplanted donor cells and environmental host cells had similar proliferation rates (WT-to-WT or p15+-to-p15+), transplanted donor cells generated normal clones. However, when donor cells and host cells differed in proliferation rates, donor cells became either winners that underwent overproliferation and generated expanded clones (WT-to-p15+) or became losers that underwent slower proliferation and generated reduced clones (p15+-to-WT). In most previously demonstrated cell competition scenarios, loser cells were eliminated through cell death programs, thereby leading to the compensatory proliferation of winner cells (Levayer and Moreno, 2013; Penzo-Mendez and Stanger, 2014). The term compensatory proliferation has been thus used to describe the proliferative behavior of winner cells triggered by loser cell-derived death signaling. However, we demonstrated that p15-driven cell competition was cell death independent. To avoid confusion, we used the term overproliferation to describe the proliferation behavior of winner cells in p15-driven RPC competition. Markedly, we further demonstrated that homophilic interaction of Cadm3-mediated cell competition of RPCs with different proliferation rates driven by imbalanced p15 expression. Specifically, the cell-cycle lengthening of a PRC by p15 overexpression decreased the surface Cadm3, resulting in increased proliferation and clonal expansion of neighbor RPCs due to the loss of Cadm3-mediated homophilic interaction (Fig. 7 G).
How Cadm3 homophilic interaction possibly regulates cell proliferation
It remains unknown how the homophilic interaction of Cadm3 regulates RPC proliferation. Previous studies showed that altering cell–cell adhesion could have pronounced mechanical consequences, particularly in an epithelial structure where cellular organizations are heavily constrained by cell adhesion (Baker, 2020; Bielmeier et al., 2016; Mao et al., 2013). Moreover, a previous study revealed that the interaction between transmembrane proteins Capricious and Tartan regulated apoptosis of loser cells in the Drosophila wing imaginal disc. Interestingly, only the extracellular domains of Capricious and Tartan are required (Milán et al., 2002). Besides, Capricious and Tartan were also expressed in Drosophila retinae (Mao et al., 2008), suggesting a potential mechanism regulated by adhesion proteins underlying cell competition in the retinae. In the case of WT donor in p15+ retinae, a mechanical force that promotes cell proliferation could emerge at least at two levels: the decrease in a compression force due to the reduction in the homophilic binding of Cadm3 expressed in neighboring cells, as well as a force possibly generated by asymmetric stiffness of lateral membrane due to the unilaterally homophilic interaction of Cadm3 in WT donor RPCs in p15+ retinae. Alternatively, Cadm3 without homophilic interaction may directly activate the intracellular partners, such as Dlg3 and Cask (Dong et al., 2006; Kakunaga et al., 2005), triggering signaling cascades that promote cell proliferation. Further studies on these questions will gain deeper insights into the mechanistic control of neuroepithelial cell competition.
The coordinated proliferation and stochastic proliferation
In the developing zebrafish retina, individual RPCs marked at 24 hpf when the retinal neurogenesis is about to begin generated clones highly variable in cell number (He et al., 2012). Interestingly, the sizes of these clones exhibit an approximately normal distribution with an average size of about 12, consistent with the increased folds of total retinal cell numbers from 24 to 72 hpf (He et al., 2012). Further modeling analysis incorporated with stochastic choices of proliferative versus differentiation divisions showed that individual RPCs conformed to a unifying rule of stochastic choices to generate clonal size distribution that recapitulated the one obtained experimentally (He et al., 2012). This normal distribution of clone size statistically ensures the robustness of the stable total cell number in the retina. However, the finding of Cadm3-mediated RPC competition appears to argue against the possibility that individual RPCs proliferate independently, an assumption proposed in the previous stochastic model. When we consider this inconsistency, we should be aware of two facts. First, our result indicated that Cadm3-mediated RPC competition was restricted mainly at the early proliferative rather than neurogenic stages (Fig. S1, H–K). However, the previous modeling analysis focused on the stochastic choices of proliferative versus differentiation divisions, mainly occurring at neurogenic stages. Second, our data showed that the cell-cycle length of sister RPCs at the early proliferative stage was significantly more similar than that of non-sisters (data not shown), suggesting that at least at the early proliferative stage, the proliferation of sister RPCs is not entirely independent, but is constrained by lineage. It raises an outstanding question regarding how much Cadm3-mediated interaction is lineage-restricted, which is undoubtedly worth investigating in the future.
Materials and methods
Zebrafish
Zebrafish lines were maintained and bred at 27°C on 14-h light/10-h dark cycles. Zebrafish embryos were obtained from the natural spawning of fish lines and raised in embryo medium (NaCl 5.03 mM, KCl 0.17 mM, CaCl2 • 2H2O 0.33 mM, MgSO4 • 7H2O 0.33 mM, and methylene blue 0.0002% [wt/vol]) at 28.5°C. The embryos were staged by hpf as previously described (Kimmel et al., 1995). Embryos for imaging were treated with 0.003% phenylthiourea (P7629; Sigma-Aldrich) at 12 hpf to avoid pigmentation. The Animal Use Committee of the Institute of Neuroscience, Chinese Academy of Sciences (NA-045-2019) approved all animal procedures performed in this study.
The following published transgenic lines were used: Tg(zFucci) (ZFIN ID: ZDB-FISH-150901-26701), Tg(ptf1α:DsRed) (ZFIN ID: ZDB-FISH-150901-3594), Tg(actin:H2BCFP) (ZFIN ID: ZDB-TGCONSTRCT-170913-1), SoFa lines Tg(atoh7:gapRFP::ptf1α:GFP::crx:CFPcaax) (ZFIN ID: ZDB-FISH-150901-13478), Tg(atoh7:GFP) (ZFIN ID: ZDB-TGCONSTRCT-070117-141), Tg(atoh7:gapRFP) (ZFIN ID: ZDB-TGCONSTRCT-070129-2), and Tg(ptf1α:GFP) (ZFIN ID: ZDB-ALT-070531-2).
Tg(zFucci), Tg(ptf1α:dsRed), Tg(actin:H2BCFP), and SoFa lines were gifted from William A. Harris lab, University of Cambridge, Cambridge, UK. Tg(cadm3:mNeongreen) was generated in this study by coinjecting 10 ng/µl plasmid with 50 ng/µl tol2 mRNA into WT embryos at one-cell stage. Injected embryos were screened at 72 hpf to pick up those with green signals and were raised to adulthood. These fish were crossed with WT fish to find the founders with germline transmission. Founders were crossed with WT fish to generate this stable transgenic line.
Plasmid construction
BAC plasmid
Cadm3:mNeongreen was generated according to the previous protocol (Suster et al., 2011). The BAC plasmid containing the cadm3 gene was ordered from commercial companies (DKEY-5C3; Source BioScience).
First, the original cadm3 BAC plasmid was electroporated into the SW105 bacteria strain. The iTol2 cassette with 50-bp homologies on each end targeting the BAC backbone was amplified by PCR and inserted into the BAC plasmid via recombineering in SW105. Next, the cassette, including the mNeongreen reporter gene and a kanamycin-resistance gene (neo) flanked by FRT sites (FRT-neo-FRT), was inserted into the start codon of cadm3 gene via recombineering. The FRT-neo-FRT cassette was then excised by L-arabinose induction (A3256; Sigma-Aldrich). Following the manufacturer’s protocol, the final BAC plasmid was extracted using the commercial kit NucleoBond BAC 100 (740579; MACHEREY-NAGEL).
Atoh7-loxp-DsRed-loxp-GFP BAC plasmid was generated in our lab previously (Wang et al., 2020).
Conventional plasmids
For the plasmids of pCS2-p15, pCS2-p15-p2a-GFP, pCS2-nls-kaede, pCS2-bcl2a, pCS2-cadm3-GFP, pCS2-cadm3-ig1De-GFP, pCS2-cadm3-ig1De-mRuby, pCS2-cadm3-ect-mRuby, pCS2-cadm1a-RFP, and pCS2-cadm4-RFP, DNA fragments for each plasmid were inserted into pCS2 vector via homolog recombination using the ClonExpressMultiS One Step Cloning Kit (C113-02; Vazyme). The coding fragments of p15, bcl2a, cadm3, cadm1a, and cadm4 were amplified from the cDNA library of 33 hpf zebrafish. pCS2-H2B-RFP, pCS2-GFP, pCS2-mCherry-UtrCH, and pCS2-GFP-UtrCH were gifts from William A. Harris lab, University of Cambridge, UK.
mRNA injection
The pCS2 plasmids were linearized by NotI-HF (R3189S; NEB) digestion, and capped mRNA was transcribed in vitro using SP6 mMessenger mMachine kit (AM1340; Invitrogen). Interested mRNAs were injected into embryos at desired stages (one-cell or 32-cell stage) with 80 ng/µl (p15, p15-p2a-gfp, or h2b-rfp,), 100–120 ng/µl (gfp, bcl2a, mcherry-Utrch, gfp-Utrch, cadm3-gfp, cadm3-ig1De-gfp, cadm3-ig1De-mruby, cadm3-ect-mruby, cadm1a-rfp, or cadm4-rfp), or 150 ng/µl (nls-kaede).
In vivo confocal imaging
Live embryos at desired stages were anesthetized with 0.04% MS-222 and then embedded with 1% low-melting agarose (111860; Biowest). Embryos were mounted with one retina against the coverslip for imaging under the Olympus FV1200 inverted confocal microscope with 30× (oil, NA = 1.05) or 60× (water, NA = 1.20) objectives. After imaging, embryos were immediately released from the agarose and were allowed to develop in the embryo medium with 0.003% phenylthiourea until 72 hpf.
Photoconversion
To trace the lineage of individual 12-hpf RPCs, we randomly selected spatially isolated RPCs at 20–40 μm depth from the superficial surface of the lateral layer in the optic vesicle, the region eventually developed into the neural retina (Tang et al., 2017). We labeled single RPCs using photoconversion. The RPCs with nls-Kaede fluorescent protein were photoconverted to Kaede-red by 3- to 4-s trains of 405 nm laser pulses using the confocal microscope (FV1200; Olympus). To ensure single RPCs were labeled, we examined all sections and photobleached other red RPCs with 559 nm laser pulses.
In vivo time-lapse and quantification of cell-cycle length
For in vivo time-lapse, single photoconverted 12-hpf RPCs undergoing mitosis were traced every 20–25 min from 20 to 32 hpf. The temperature was maintained throughout the entire time-lapse at 28°C using a heating block (TPiE-SQH 26P; TOKAI HIT). Image analysis was performed using FV10-ASW 4.0 software (Olympus). The imaging z stacks were obtained (scanning speed, 12.5 μs/pixel; image resolution, 1,024 pixels × 1,024 pixels; step-size, 2 μm). The time from the first to the second mitosis point was defined as one cell-cycle length.
Blastula transplantation
WT embryos with the injection of desired mRNAs at one-cell stage were used as donors. WT embryos injected with desired mRNAs at desired stages were used as hosts. At the blastula stage (3 hpf), both donors and hosts were dechorionated by 1 mg/ml pronase (P8811; Sigma-Aldrich) and placed in the transplantation mold made by 1% agarose (111860; Biowest). In each experiment, 20–50 cells from donor embryos were transplanted to the animal pole of the hosts, where the cells were expected to develop into retinal cells. After the transplantation, host embryos were recovered at 32°C until 12 hpf when the optic vesicle was visible.
Clone collection
After transplantation or sparse injection, 12-hpf single RPCs with nls-Kaede fluorescent protein were photoconverted to Kaede-red. Then we collected clones at desired developmental stages (24, 36, 48, 60, or 72 hpf) using z stacks containing all progeny cells marked by Kaede-red by confocal microscope (scanning speed, 12.5 μs/pixel; image resolution, 1,024 pixels × 1,024 pixels; step-size, 2 μm). Note that we excluded those clones with non-retinal cells.
Clone size quantification and cell type identification
72-hpf zebrafish retina comprises six major cell types (PR, horizontal cell [HC], BC, AC, RGC, and MC), which could be roughly identified according to cell morphology and their laminar positions (He et al., 2012). In this study, to distinguish cells in a large clone, we chose to label cells using nls-Kaede, a nuclear localization Kaede, which could not tell us the information of cell morphology. We, therefore, developed a strategy to identify retinal fates solely according to nuclear information.
PRs had elongated nuclei in the photoreceptor layer, while HCs had plat nuclei along the apical edge of the inner nuclear layer. Thus, both cell types could be identified clearly. BCs, MCs, and ACs are all located in the inner nuclear layer. Although ACs located closer to the inner plexiform layer and BCs and MCs located closer to the outer plexiform layer, it was still hard to accurately identify them as BCs close to the inner plexiform layer from ACs solely according to the nuclear information. Therefore, we decided to characterize the nuclear diameters of these cell types using Tg(actin:H2B-CFP::ptf1α:DsRed), in which ACs were specifically labeled in magenta and all nuclear were labeled in blue (Fig. S1 D). Our analysis showed that the nuclear diameters of BCs appeared significantly smaller than ACs (Fig. S1 E). Moreover, it was challenging to distinguish dACs (displaced amacrine cells) and RGCs, both of which are located in the RGC layer. Also, BCs and MCs were challenging to be distinguished based on their nuclei position since they were intermingled in space. Note that MCs and dACs were much less than BCs and RGCs. Thus, we analyzed BC+MC and dAC+RGC as groups. Based on the laminar positions and nuclear diameters, we identified retinal cells into five groups, PR, HC, BC, AC, and RGC. Then we confirmed that p15 mRNA injection delayed embryonic development but not affected lamination of 72-hpf mature retinae using SoFa lines, in which the RGC layer was labeled in magenta, the AC layer was labeled in green, and the PR layer was labeled in blue (Fig. S1 B). Thus, cell type identification by laminar positions and nuclear diameters was also suitable for the p15+ condition.
To quantify the size of 72-hpf clones from single 12-hpf PRCs, the number of progeny cells in one clone containing all cell types was counted using FV10-ASW 4.0 software.
Clone collection using Tg(atoh7:GFP)
To analyze the clones upon atoh7 expression in WT or p15+ host, donor embryos with atoh7-GFP background were injected with nls-kaede mRNA at one-cell stage. After transplantation and photoconversion, clones from single 12-hpf RPCs were collected when the first cell in the clones began to express atoh7 (atoh7-GFP positive).
Clone collection using atoh7-loxp-dsred-loxp-gfp BAC plasmid
The 10 ng/µl atoh7-loxp-dsred-loxp-gfp BAC plasmid and 50 ng/µl tol2 mRNA were injected into WT donor embryos. The cells from donor embryos were transplanted into WT or p15+ host embryos. Due to BAC sparse expression and transplantation, atoh7-positive isolated clones were collected and analyzed at 72 hpf.
Whole mount immunostaining and TUNEL assay
The embryos, with or without transplantation, were fixed in 4% PFA (Electron Microscopy Services) at 28 hpf at 4°C overnight. The fixed embryos were sequentially treated with 1× PBST (0.25% Triton X-100 in 1× PBS; Triton X-100, Amresco 069; BIOSHARP), 0.05% Trypsin-EDTA, Antigen Retrieval Solution (P0090; Beyotime), and 5% BSA. The embryos were then incubated with chicken-anti-GFP (ab13970; Abcam) diluted (1:1,000) in 4% BSA and 0.1% Triton X-100 in 1× PBS at 4°C for over 16 h, washed with 1× PBS, and incubated with Alexa Fluor 488 donkey anti-chicken (1:1,000 dilution; 34606ES60; Yeasen) for 2 h in the dark at room temperature. Then the embryos per tube were incubated with 50 μl TUNEL detection solution (45 μl red fluorescent labeling solution and 5 μl TdT enzyme; C1090; Beyotime) for 1 h at 37°C protected from light. The embryos were then incubated with DAPI (2 μg/ml) for 15 min. Finally, the embryos were washed in 1× PBS and images were acquired on a confocal microscope (FV1200; Olympus) under 60× (water, NA = 1.20) objective.
To determine the levels of TUNEL signals, we calculated the ratio of the number of TUNEL+ (TUNEL positive) nuclear fragments to the total cell number. Specifically, in the p15 mRNA-injection group, the TUNEL level was determined by the ratio of TUNEL+ nuclear fragments to total nucleus number (DAPI+, DAPI positive) in single retinal sections (TUNEL+/DAPI+). The TUNEL levels in donor RPCs after transplantation was determined by the ratio of the number of GFP+TUNEL+ (GFP and TUNEL double positive) nuclear fragments in donor RPCs to the total number of GFP+ (GFP positive) donor RPCs (GFP+TUNEL+/GFP+) in 10 sections with a 2 μm step-size. The TUNEL levels in host RPCs after transplantation was determined by the ratio of the number of GFP−TUNEL+ (GFP negative and TUNEL positive) nuclear fragments in host RPCs to the total number of GFP− (GFP negative) host RPCs (GFP−TUNEL+/GFP−) in five sections with 2 μm step-size.
Slice immunostaining and TUNEL assay
The p15+ embryos at 28 hpf, transplanted with WT donor RPCs labeled by GFP through mRNA injection, were fixed with 4% PFA and cryosectioned with 14 µm thickness. The slices were sequentially treated with 1× PBS, 0.5% Triton X-100 (Amresco 0694; BIOSHARP), Antigen Retrieval Solution (P0090; Beyotime), and 5% BSA. The slices were incubated with chicken-anti-GFP (ab13970; Abcam), 1:1,000 diluted in 4% BSA and 0.1% Triton X-100 in 1× PBS, at 4°C for over 16 h, washed with 1× PBS, and incubated with Alexa Fluor 488 donkey anti-chicken for 2 h at room temperature. Each slice was incubated with 50 μl TUNEL detection solution (45 μl red fluorescent labeling solution and 5 μl TdT enzyme; C1090; Beyotime) for 1 h at 37°C protected from light. The slices were then washed with 1× PBS, air-dried, and mounted with a coverslip. The signals were checked on a confocal microscope (FV1200; Olympus) under 60× (water, NA = 1.20) objective.
To determine the distribution of TUNEL levels of p15+ host RPCs, we grouped TUNEL+ p15+ host RPCs per section with the location (distance, measured by soma numbers) relative to the closest GFP+ WT donor RPCs, and calculated the ratio of the number of TUNEL+ p15+ host RPCs to the total number of TUNEL+ RPCs in each group.
Sample preparation for RNA-seq
After transplantation of cells from WT donor embryos injected with h2b-rfp mRNA at one-cell stage into host embryos injected with p15-p2a-gfp mRNA at one-cell stage, embryos were screened using FV1200 to select those with light magenta (H2B-RFP) signals in retinae but not in lens. Then, selected embryonic retinae at 24 hpf were dissected according to the earlier literature (Lopez-Ramirez et al., 2016) with tungsten needles under the stereomicroscope. As previously described, the dissected retinae were then dissociated into a single-cell solution (Xu et al., 2020). Specifically, the dissected retinae were treated using 200 μl papain solution (4 μl papain [LS003126; Worthington], 4 μl DNase I [1%; DN25; Sigma-Aldrich], and 8 μl L-cysteine [12 mg/ml; sc-286072; Santa Cruz] into 184 μl of DMEM/F12 [11330057; Invitrogen]) at 37°C for 15 min. Within the 15 min, cells were further dissociated via gentle up-and-down pipetting every 2–3 min. The dissociation was terminated using 800 μl washing buffer (100 ml of washing buffer was prepared by adding 650 μl glucose [G8769; Sigma-Aldrich], 500 μl Hepes [1 M; H4034; Sigma-Aldrich] and 5 ml fetal bovine serum [10091148; Gibco] into 93.85 ml DPBS [14190144; Gibco]). The single-cell suspension was filtered using a 40 μm cell strainer (352340; BD Falcon) and then centrifuged at 500 g for 5 min at 4°C. The supernatant was discarded, and pellets were resuspended with 1× PBS with 0.04% BSA. Subsequently, 50–200 RFP-positive donor RPCs and GFP-positive host RPCs were sorted into 1 μl sample buffer (0.1 μl RNase Inhibitor into 0.9 μl lysis buffer; N712; Vazyme), respectively, on MoFlo XDP (Beckman Coulter).
cDNA library building of a small number of cells and RNA-seq
According to the manufacturer’s protocol, reverse transcription and amplification of cDNA were performed using Single-Cell Full Length mRNA-Amplication Kit (N712; Vazyme). cDNA product was purified using VAHTSTM DNA Clean Beads (N411; Vazyme) according to the manufacturer’s protocol. Moreover, quantification and quality assessment were performed by Qubit fluorometric assay (Invitrogen) with a dsDNA High Sensitivity Assay Kit (Thermo Fisher Scientific) and the fragment analysis with a High Sensitivity Large Fragment 50 kb Analysis Kit (Advanced Analytical Technologies; AATI) separately. The peak of the library was about 2,500 bp.
The cDNA library was prepared using 1 ng cDNA product by TruePrep DNA Library Prep Kit V2 for Illumina (TD503; Vazyme) and was added index by TruePrep Index Kit V2 for Illumina (TD202; Vazyme). The indexed library was sequenced using the Illumina HiseqXten-PE150 platform (Novogene).
RNA-seq data analysis
After sequencing, reads were filtered by FastQC and aligned with the zebrafish genome (GRCz10) using Tophat. Aligned reads were quantified as FPKM (Fragments Per Kilobase of transcript per Million fragments mapped) value using Cufflinks. Differentially expressed genes between the WT donor and p15+ host were determined by fold change of FPKM value. GO analysis of differentially expressed genes was performed using an online tool (Zhou et al., 2019; http://metascape.org/). The conclusion was drawn based on three independent replicates.
Real-time quantitative PCR (qPCR) of WT donor RPCs and p15+ host RPCs
We created WT donor embryos by injection of H2BRFP mRNA and p15+ host embryos by injection of p15-p2aGFP mRNA at the one-cell stage. After transplantation, the 24-hpf retinae were dissected and dissociated into single-cell suspension using the same procedure as above. Subsequently, 100–200 RFP-positive WT donor RPCs and GFP-positive p15+ host RPCs were sorted into 0.2 ml tubes containing lysis buffer (20 mg/ml Proteinase K [V900887; Sigma-Aldrich] in TE buffer [10 mM Tris and 1 mM EDTA in water]) on MoFlo XDP (Beckman Coulter), respectively. Total RNA was isolated using the lysis buffer. cDNA synthesis and amplification were performed using the protocol in our lab (Jin et al., 2022) by adding RT mix (200 U Superscript II reverse transcriptase [18064-014; Invitrogen], 1× First-strand buffer [18064-014; Invitrogen], 5 mM DTT [18064-014; Invitrogen], 20 U Recombinant RNase inhibitor [2313A; Clontech], 6 mM MgCl2 [M8266; Sigma-Aldrich], 1 µM TSO [Picelli et al., 2013], and 8% PEG8000 [P1458; Sigma-Aldrich]).
Real-time qPCR reactions were prepared using TB Green Premix Ex Taq mix (RR420A; Takark) on a LightCycler 480 Ⅱ real-time PCR detection system (Roche). qPCR primers are listed in Table 1. The ΔΔCt method was used to determine the relative expression of mRNAs in WT donor RPCs and p15+ host RPCs and normalized to b-actin mRNA levels.
In situ hybridization
The digoxigenin (DIG)-labeled cadm3 antisense probe was prepared using the T7 RNA Polymerase kit and DIG RNA Labeling kit (P2077; Promega). The primers used for synthesizing the probe are listed in Table 2. Zebrafish embryos (24, 36, 48, and 72 hpf) were fixed in 4% PFA (Electron Microscopy Services) at 4°C overnight. These fixed embryos were dehydrated in 30% sucrose and then 14-μm-thick slices were sectioned coronally. In situ hybridization was performed as described previously (Tang et al., 2017). Each slice was treated with 200 ng cadm3 probes at 60°C overnight and incubated in TNB buffer (0.5% blocking reagent in TN buffer [0.1 M Tris and 0.15 M NaCl in water]) with anti–DIG-AP (1:500; 11093274910; Roche) at 4°C overnight. Then the signal was detected by Fast Red TR/Naphthol AS-MX Tablets (F4648; Sigma-Aldrich). Following staining, slices were imaged under an inverted confocal microscope (FV1200; Olympus) with a 60× (water, NA = 1.20) objective.
Gene disruption via CRISPR/cas9 system
Four sgRNAs targeting the coding sequence of cadm3, cadm1a, cadm4, slbp1, and scramble sequence were designed using the CRISPRscan online tool (Moreno-Mateos et al., 2015; https://www.crisprscan.org/). The DNA fragments for in vitro transcription of each sgRNA were amplified respectively with each forward primer and one reverse primer. Forward primers consist of the T7 promoter sequence, sgRNA-targeting sequence, and scaffold-targeting sequence. The primers used are listed in Table 3.
Primers used to synthesize sgRNAs
| Primer name | Sequence (5′ to 3′) |
|---|---|
| cadm3-F1 | 5′-TAATACGACTCACTATAGGTGACCCAAGATGAGACGGGTTTTAGAGCTAGAA-3′ |
| cadm3-F2 | 5′-TAATACGACTCACTATAGGGCCGTGTTGGACCACTGGGTTTTAGAGCTAGAA-3′ |
| cadm3-F3 | 5′-TAATACGACTCACTATAGGGAGATAACCGTATCCAGTGTTTTAGAGCTAGAA-3′ |
| cadm3-F4 | 5′-TAATACGACTCACTATAGGGGCTCGTGCGGTCCGTACGTTTTAGAGCTAGAA-3′ |
| cadm1a-F1 | 5′-TAATACGACTCACTATAGGTGCTCGTGTTCGCCATGTGTTTTAGAGCTAGAA-3′ |
| cadm1a-F2 | 5′-TAATACGACTCACTATAGGCAACGTCTCAGTAGTGGAGTTTTAGAGCTAGAA-3′ |
| cadm1a-F3 | 5′-TAATACGACTCACTATAGGGCGTAGGCTTCCTGTGGAGTTTTAGAGCTAGAA-3′ |
| cadm1a-F4 | 5′-TAATACGACTCACTATAGGCGGCGGGTTTGCTGCCCAGTTTTAGAGCTAGAA-3′ |
| cadm4-F1 | 5′-TAATACGACTCACTATAGGAGAACGTGACCGTGCTGGGTTTTAGAGCTAGAA-3′ |
| cadm4-F2 | 5′-TAATACGACTCACTATAGGAAGAGCGTCTGTCTGCGTGTTTTAGAGCTAGAA-3′ |
| cadm4-F3 | 5′-TAATACGACTCACTATAGGAAGTGTGTCAGACGAGGGGTTTTAGAGCTAGAA-3′ |
| cadm4-F4 | 5′-TAATACGACTCACTATAGGCCCCGGAGGTACCCAGCGGTTTTAGAGCTAGAA-3′ |
| slbp1-F1 | 5′-TAATACGACTCACTATAGGGGAGCAGATGGTATTCTGGTTTTAGAGCTAGAA-3′ |
| slbp1-F2 | 5′-TAATACGACTCACTATAGGAGACAGAAAAATCTCATCGTTTTAGAGCTAGAA |
| slbp1-F3 | 5′-TAATACGACTCACTATAGGGGGTCAAACTTCATGCATGTTTTAGAGCTAGAA-3′ |
| slbp1-F4 | 5′-TAATACGACTCACTATAGGTCGACCTTGGTGAAATTAGTTTTAGAGCTAGAA-3′ |
| Scramble-F1 | 5′-TAATACGACTCACTATAGGCAGGCAAAGAATCCCTGCCGTTTTAGAGCTAGAAATAGC-3′ |
| Scramble-F2 | 5′-TAATACGACTCACTATAGGTACAGTGGACCTCGGTGTCGTTTTAGAGCTAGAAATAGC-3′ |
| Scramble-F3 | 5′-TAATACGACTCACTATAGGCTTCATACAATAGACGATGGTTTTAGAGCTAGAAATAGC-3′ |
| Scramble-F4 | 5′-TAATACGACTCACTATAGGTCGTTTTGCAGTAGGATCGGTTTTAGAGCTAGAAATAGC-3′ |
| Reverse primer | 5′-AAAAAAAGCACCGACTCGGTGCCAC-3′ |
The sgRNAs were then transcribed in vitro by a mixture of four DNA fragments and purified using the ethanol precipitation approach (MEGAshortscript T7 Transcription Kit, AM1354; Invitrogen). To disrupt the coding sequences of targeted genes, a mixture with 200 ng/µl sgRNAs and 400 ng/µl cas9 protein (E365-01A; Novoprotein) was co-injected into the cell of WT embryos at the one-cell stage.
To quantify cadm3 sgRNA efficiency, five WT embryos and embryos injected with cadm3 sgRNAs and Cas9 protein were treated with NaOH to extract the genomic DNA. Cadm3 DNA fragments were amplified with primers flanking the sgRNA target sites (the primers’ sequences are listed in Table 4). Gel electrophoresis of DNA fragments of region 1 (covering sg-1 and sg-2) and region 2 (covering sg-3 and sg-4) showed large fragment deletion near sgRNAs targeting sites in the cadm3-disrupted genome (Fig. S3 C).
Slice DAPI staining
The embryos injected with gfp (control) or cadm3-ig1De-p2aGFP mRNAs (cadm3-ig1De+) at one-cell stage were fixed at 72 hpf in 4% PFA at 4°C overnight. These fixed embryos were dehydrated in 30% sucrose and then 14 μm-thick slices were sectioned coronally using a freezing microtome. The slices were sequentially treated with 1× PBS and 0.5% Triton X-100 and then incubated with DAPI solution for 15 min. The slices were washed with 1× PBS, air-dried, and mounted with the coverslip. The signals were checked on a confocal microscope (FV1200; Olympus) under 60× (water, NA = 1.20) objective.
Cell number quantification of slices
After imaging sections from 72-hpf control and cadm3-ig1De+retinae with DAPI staining, we quantified the total cell number in an area of a 30° sector within the most central coronal section with the optic nerve. Specifically, we drew a 30° sector next to the optic nerve on each section, and each sector’s center was the lens’s center. Then, we counted the total number of DAPI+ nuclei in the selected area of this sector. All these operations were completed in ImageJ.
Cell-cycle analysis by flow cytometry
The retinae of 24-hpf WT embryos injected with or without p15 mRNA at one-cell stage were dissected and dissociated into the single-cell suspension described above. The single cells were stained by Hochest 33342 (1:500; C10340; Life Tech) for 15 min at 37°C protected from light. After staining, fluorescence stimulated by UV was collected using MoFlo XDP (Beckman Coulter) and analyzed using Summit software.
Statistical analysis
Statistical analysis was performed using GraphPad Prism v7.0.0 for Windows (GraphPad Software). We used the chi-squared test in Fig. 2 D. We performed one-way ANOVA with Tukey’s multiple comparisons test in multigroup comparations (Fig. 2 C, Fig. 3 B, Fig. 6 B, Fig. S2 B, Fig. S4, B, F, and H, and Fig. S5 B). We used paired two-tailed t test in Fig. S5 E, and an unpaired two-tailed t test was used in other statistical analysis. In the t test, the data distribution was assumed to be normal, but this was not formally tested. For individual value plots, data were displayed as mean ± SEM. P values were indicated in the figures.
Online supplemental material
Fig. S1 shows that p15+ hosts induce faster proliferation of WT donor RPCs at the early proliferative stage. Fig. S2 shows differentially expressed genes in WT donor and p15+ host RPCs. Fig. S3 shows the expression of cadm3 and phenotypes of cadm3-disrupted retinae. Fig. S4 shows that cadm1a and cadm4 play few roles in coordinated RPC proliferation. Fig. S5 shows that cadm3-ig1De+ but not cadm3+ RPCs produce expanded clones in WT host retinae.
Acknowledgments
The authors thank Dr. Muming Poo for the discussion and manuscript editing. We thank Haiyan Wu, Songlin Qian, and Lijuan Quan from the Flow Cytometry Facility of Institute of Neuroscience, Center for Excellence in Brain Science and Intelligence Technology, Chinese Academy of Sciences. We also thank Prof. William A. Harris for kindly providing the pCS2-H2B-RFP, pCS2-GFP, pCS2-mCherry-UtrCH, and pCS2-GFP-UtrCH plasmids. We thank Ms. Xinling Jia for the help in the preparation of immunostaining slices. We thank Mr. Peibo Xu for screening of G1 phase regulators.
This study was funded by grants from the National Key Research and Development Program of China (2020YFA0112700), Shanghai Municipal Science and Technology Major Project (2018SHZDZX05), the Strategic Priority Research Program of the Chinese Academy of Sciences (XDB32000000), Ministry of Science and Technology of the People's Republic of China STI2030-Major Projects (2021ZD0204500), the National Natural Science Foundation of China (31871035), and the State Key Laboratory of Neuroscience.
Author contributions: Y. Li performed the experiments, including mRNA injection, clone collection, cell number quantification, cell-cycle length measure, whole mount immunostaining, TUNEL assay, RNA-seq analysis, and fish line construction. B. Xu performed atoh7-related clone collection and nuclear diameter identification. Y. Li and B. Xu prepared samples for RNA-seq. Y. Li, H. Zhang, and B. Xu performed cytometry cell-cycle analysis. Y. Li and M. Jin performed real-time qPCR and in situ hybridization experiments. Y. Li, M. Jin, N. Ren, and J. Hu performed slice immunostaining experiments. Y. Li, N. Ren, and J. Hu constructed plasmids and synthesized mRNAs. Y. Li and J. He performed experiments to identify Cadm3 distribution. B. Xu, H. Zhang, and J. Hu provided advice on manuscript preparation. Y. Li and J. He wrote and revised the paper.

