Skip to article sections

Membrane contact sites, where organelle membranes come into close proximity, function as dynamic hubs for lipid metabolism in response to metabolic and stress signals. In yeast, the nucleus–vacuole junction (NVJ) expands during glucose starvation (GS) through the recruitment of stress-specific proteins; however, the underlying mechanisms and physiological significance have remained unclear. Here, we identify the aspartyl protease Ypf1 and the yeast INSIG homologs Nsg1 and Nsg2 as NVJ-localized proteins specifically recruited during GS. Ypf1 promotes the recruitment of Nsg1, Nsg2, and the HMG-CoA reductases Hmg1 and Hmg2 to the NVJ, likely in association with changes in nuclear membrane lipid composition caused by suppression of fatty acid elongases. This remodeling destabilizes Nsg1, thereby activating Hmg1, while stabilizing Nsg2, which suppresses Hmg1 to fine-tune sterol synthesis. Loss of both Nsg1 and Nsg2 leads to hyperactivation of Hmg1 and accumulation of squalene, a sterol biosynthetic intermediate. We propose that suppression of fatty acid elongases drives GS-dependent NVJ remodeling to regulate ergosterol synthesis.

Membrane contact sites (MCSs), where different biological membranes are in close proximity, have garnered significant attention as critical hubs for lipid and ion transport between adjacent organelles (Eisenberg-Bord et al., 2016; Dimmer and Rapaport, 2017; Tamura et al., 2019; Xu and Huang, 2020; Wenzel et al., 2022; Casas and Dickson, 2024; Diokmetzidou and Scorrano, 2025). Recent studies have revealed that MCSs play important roles in metabolic regulation and cellular stress responses through dynamic changes in their number and size. For instance, the ER–mitochondria encounter structure (ERMES) complex, which forms MCSs between the ER and mitochondria in yeast (Kornmann et al., 2009), undergoes structural remodeling in response to nutrient availability and ER stress (Elbaz-Alon et al., 2014; Kakimoto-Takeda et al., 2022; Casler et al., 2025). Furthermore, the number of ERMES foci and vCLAMPs, the mitochondria-vacuole MCS, is reciprocally regulated in response to carbon source availability and the activity of either ERMES or vCLAMP (Elbaz-Alon et al., 2014; Hönscher et al., 2014; González Montoro et al., 2018). These findings suggest that these MCSs are dynamically regulated in response to metabolic signals.

The nucleus–vacuole junction (NVJ), an MCS between the nuclear and vacuolar membranes, is also highly responsive to nutritional conditions (Malia and Ungermann, 2016; Henne and Hariri, 2018; Wood et al., 2020; Kohler and Büttner, 2021). The NVJ is formed through the direct interaction of the nuclear membrane protein Nvj1 and the vacuolar membrane protein Vac8 (Pan et al., 2000; Jeong et al., 2017). Several proteins, including Osh1, Tsc13, and Nvj2, accumulate at the NVJ in an Nvj1-dependent manner (Kvam, 2004; Kohlwein et al., 2001; Toulmay and Prinz, 2012). Given that Osh1 and Nvj2 contain lipid transport-related domains such as an oxysterol-binding domain and an SMP domain, respectively and that Tsc13 is involved in the elongation of very long-chain fatty acids (VLCFAs) (Kohlwein et al., 2001; Toulmay and Prinz, 2012; Manik et al., 2017), the NVJ serves as a crucial site for lipid metabolism. In addition, the NVJ facilitates piecemeal microautophagy of the nucleus (PMN), a type of selective autophagy in which portions of the nucleus are directly engulfed by the vacuole upon nitrogen starvation or rapamycin treatment (Roberts et al., 2003; Kvam et al., 2005; Krick et al., 2008). Moreover, Mdm1 and its paralog Nvj3 localize to the NVJ in an Nvj1-independent manner (Henne et al., 2015). Mdm1 recruits Faa1, a fatty acid-metabolizing enzyme, to the NVJ and is involved in lipid droplet (LD) synthesis (Hariri et al., 2018).

The NVJ also plays a critical role in the cellular response to glucose starvation (GS). During GS, Snd3, a factor involved in ER membrane protein transport (Aviram et al., 2016), accumulates at the NVJ, contributing to NVJ expansion (Tosal-Castano et al., 2021). Additionally, Hmg1, the rate-limiting enzyme in sterol biosynthesis, accumulates at the NVJ in a GS-dependent manner, where it oligomerizes to enhance ergosterol synthesis (Rogers et al., 2021).

In mammalian cells, sterol synthesis is controlled by the insulin induced gene (INSIG)–SCAP–sterol regulatory element–binding protein (SREBP) regulatory axis (Brown and Goldstein, 1997; Goldstein et al., 2006). SREBP is a membrane-bound transcription factor that activates genes required for cholesterol and fatty acid synthesis (Horton et al., 2002). Under low-sterol conditions, SCAP escorts SREBP from the ER to the Golgi, where proteolytic processing releases its N-terminal transcription factor domain, allowing it to enter the nucleus and drive lipid biosynthetic programs. When sterol levels are sufficient, INSIG proteins bind SCAP to retain the SCAP–SREBP complex in the ER and also promote the degradation of HMG-CoA reductase, thereby suppressing sterol synthesis (Yang et al., 2002; Sever et al., 2003). These mechanisms highlight a broadly conserved eukaryotic strategy in which metabolic cues are translated into changes in enzyme localization, stability, and activity. Such parallels raise the possibility that yeast cells may likewise regulate sterol synthesis by dynamically controlling the spatial organization and activity of key biosynthetic enzymes. However, the mechanisms by which these factors sense GS and relocate from the ER or nuclear membrane to the NVJ remain largely unknown. Furthermore, the physiological significance of the NVJ remodeling under GS conditions remains to be elucidated.

Here, we report that the yeast homologs of mammalian INSIG proteins, Nsg1 and Nsg2 (Flury et al., 2005), along with the intramembrane aspartyl protease Ypf1 (Weihofen et al., 2002), accumulate at the NVJ in a GS-dependent manner and play a crucial role in regulating ergosterol synthesis. Ypf1 appears to mediate the recruitment of Nsg1, Nsg2, Hmg1, and Hmg2 to the NVJ through its GS-dependent structural changes. We demonstrate that GS leads to the destabilization of Nsg1 and the stabilization of Nsg2. Importantly, our results reveal that both Nsg1 and Nsg2 function as negative regulators of Hmg1 and that their opposing stabilities under GS conditions enable coordinated regulation of Hmg1 activity to maintain proper ergosterol levels. Consistently, simultaneous deletion of Nsg1 and Nsg2 leads to a dramatic accumulation of ergosterol esters and squalene, indicating that the loss of both negative regulators results in hyperactivation of Hmg1 and excessive sterol biosynthesis. Notably, we also show that these NVJ remodeling events are driven by GS-dependent changes in VLCFA metabolism. Together, these findings provide novel insights into the molecular mechanisms underlying metabolic adaptation to GS, mediated by the dynamic NVJ reorganization, and also highlight the potential of this regulatory system for applications in yeast-based production of commercially valuable lipids.

Searching for novel NVJ-localized factors using complementation assay using fusion of split-GFP and TurboID

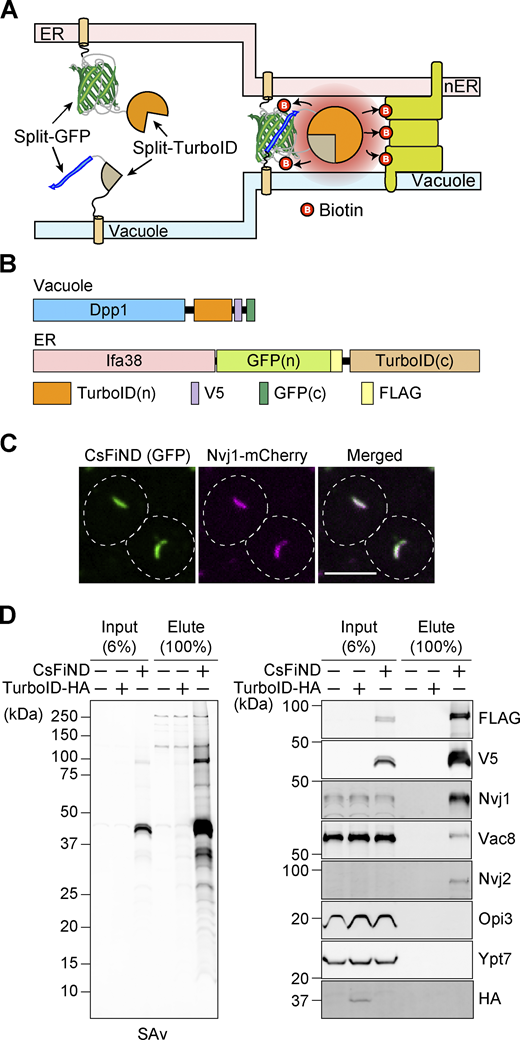
We previously developed complementation assay using fusion of split-GFP and TurboID (CsFiND), a proximity labeling technique that specifically targets MCSs (Fujimoto et al., 2023). In this system, fusion proteins composed of tandemly linked split fragments of GFP and TurboID are expressed on different organelle membranes. When the two membranes come into close proximity at MCSs, complete GFP and TurboID are reconstituted, enabling both visualization of the MCS and biotinylation of MCS-localized proteins (Fig. 1 A). To identify novel proteins localized at the NVJ, we adapted the CsFiND system to this MCS. Specifically, we constructed two CsFiND proteins: one consisting of full-length Dpp1, the N-terminal fragment of TurboID, a V5 tag, and the C-terminal fragment of GFP (GFP11); and the other consisting of full-length Ifa38, the N-terminal fragment of GFP (GFP1–10), a FLAG tag, and the C-terminal fragment of TurboID (Fig. 1 B). Dpp1 and Ifa38 have been successfully used in our previous studies to localize split-GFP fragments to the ER and vacuolar membranes for visualizing the MCSs (Tashiro et al., 2020; Kakimoto et al., 2018). Confocal microscopy revealed that the reconstituted GFP signals generated by CsFiND were colocalized with Nvj1-mCherry, a known NVJ marker, indicating that the CsFiND components were successfully reassembled specifically at the NVJ (Fig. 1 C).

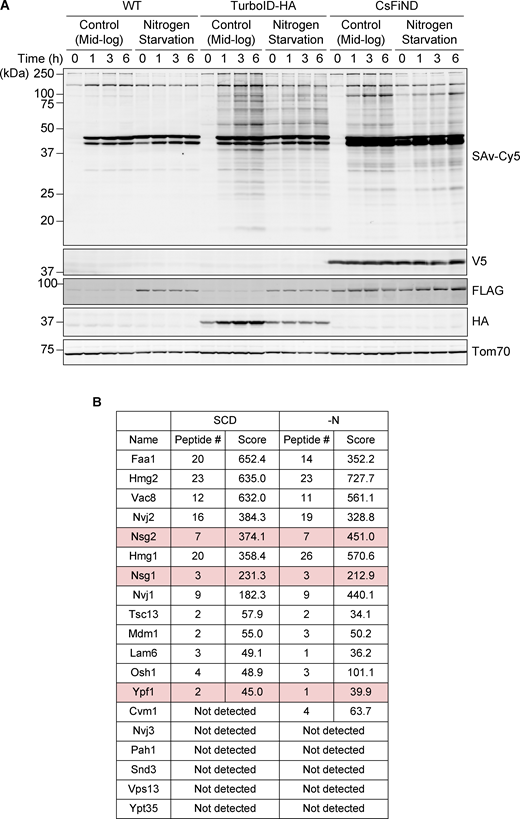
Next, we examined whether NVJ-localized proteins were biotinylated by CsFiND. WT cells were cultured in the presence of biotin, with or without expression of either CsFiND or cytosolic TurboID-HA. Membrane fractions were isolated to remove soluble endogenous biotinylated proteins, which could interfere with subsequent mass spectrometry–based protein identification (Fig. 1 D and Fig. S1 A). The membrane fractions were solubilized and subjected to streptavidin-based purification. Purified proteins were detected using streptavidin-Cy5 and antibodies against known NVJ proteins (Fig. 1 D). We found that biotinylated proteins were barely detectable in membrane fractions from cells lacking CsFiND or expressing TurboID-HA alone (Fig. 1 D). In contrast, membranes from cells expressing CsFiND showed numerous biotinylated proteins visualized by streptavidin-Cy5. Notably, CsFiND proteins containing FLAG and V5 tags, as well as known NVJ-localized proteins such as Nvj1, Vac8, and Nvj2, were enriched in streptavidin-purified samples, whereas ER-localized Opi3 and the vacuolar membrane protein Ypt7 were not (Fig. 1 D). These results indicate that CsFiND selectively biotinylates proteins localized at the NVJ.

We then subjected the purified biotinylated proteins to LC-MS/MS analysis, which identified several previously reported NVJ-localized proteins, including Nvj1, Nvj2, Vac8, Tsc13, Osh1, Mdm1, Lam6, Hmg1, Hmg2, and Faa1 (Fig. S1 B). We examined the previously reported subcellular localizations of the identified proteins using databases, such as YeastRGB (Yofe et al., 2016) and LoQAtE (Breker et al., 2014), and selected proteins showing even faint NVJ-like localization for further analysis. These included Nsg1 and Nsg2, the yeast homologs of mammalian INSIG proteins (Flury et al., 2005), as well as Ypf1, an asparagine-processing peptidase (Weihofen et al., 2002).

Nsg1, Nsg2, and Ypf1 accumulate at the NVJ in response to GS

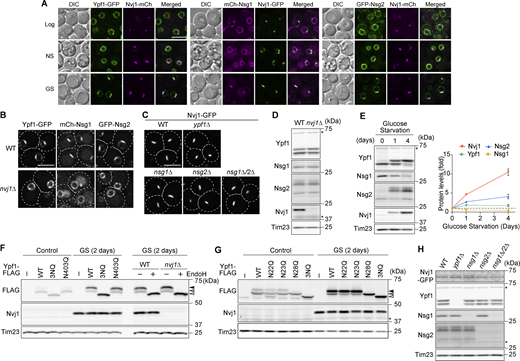
To analyze subcellular localizations of Ypf1, Nsg1, and Nsg2, we chromosomally expressed Ypf1-GFP, mCherry-Nsg1, or GFP-Nsg2 together with GFP or mCherry-fused Nvj1 as an NVJ marker. Our microscopy analyses revealed that Ypf1, Nsg1, and Nsg2 were primarily localized to the nuclear membrane under nutrient-rich conditions and did not accumulate at the NVJ labeled with Nvj1 (Fig. 2 A, Log). Under a nitrogen starvation condition, Ypf1, Nsg1, and Nsg2 did not show NVJ localization, while the NVJ region labeled with Nvj1 expanded (Fig. 2 A, NS). Interestingly, Ypf1, Nsg1, and Nsg2 clearly accumulated at the expanded NVJ during GS. These results indicate that Ypf1, Nsg1, and Nsg2 are GS-specific NVJ factors (Fig. 2 A, GS).

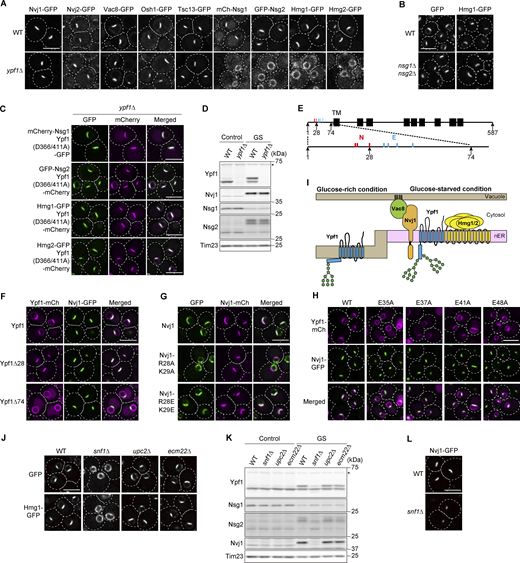
How do these factors accumulate at the NVJ in a GS-dependent manner? It has been reported that Nvj1 is critical for the NVJ partitioning of Hmg1, which is known as a GS-specific NVJ factor (Rogers et al., 2021). We thus analyzed the localizations of Ypf1, Nsg1, and Nsg2 in nvj1Δ cells. Similar to the case of Hmg1, the loss of Nvj1 abolished the NVJ partitioning of Nsg1, Nsg2, and Ypf1, indicating that the GS-induced NVJ localization of Ypf1, Nsg1, and Nsg2 depends on Nvj1 (Fig. 2 B). In contrast, loss of Ypf1, Nsg1, or Nsg2 did not affect the NVJ localization of Nvj1 (Fig. 2 C).

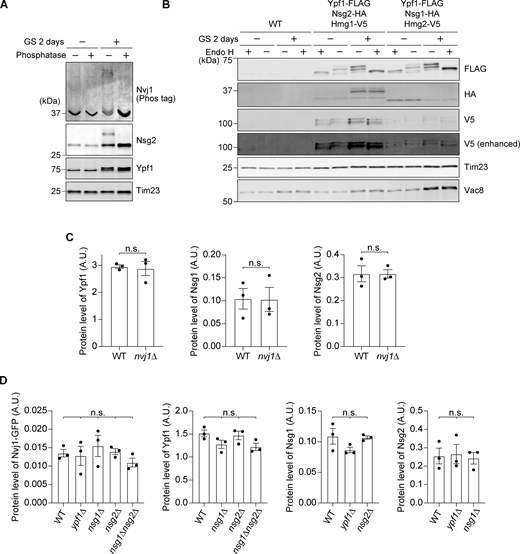
We next examined whether the loss of Nvj1 affected the steady-state levels of Ypf1, Nsg1, and Nsg2. To this end, we performed immunoblotting of total cell lysates prepared from WT and nvj1Δ cells grown in GS conditions. The immunoblotting showed that the loss of Nvj1 did not affect the expression levels of Ypf1, Nsg1, and Nsg2 (Fig. 2 D and Fig. S2 C). However, we noticed that GS greatly changed the steady-state levels and apparent molecular weights of Nvj1, Nsg1, Nsg2, and Ypf1 (Fig. 2 E). Specifically, during GS, the level of Nsg1 decreased while those of Nvj1 and Nsg2 increased, indicating contrasting stability regulation. Moreover, GS led to an increase in the apparent molecular weight of Nvj1, Nsg2, and Ypf1, suggesting that they undergo GS-dependent modifications. Previous phosphoproteome studies indicated that Nvj1 and Nsg2 were phosphorylated (MacGilvray et al., 2020; Lanz et al., 2021; Leutert et al., 2023). Phos-tag gel electrophoresis revealed that the apparent molecular weight of Nvj1 increased markedly during GS, and this shift was reversed to the prestress mobility upon phosphatase treatment (Fig. S2 A). Similarly, a higher molecular weight band of Nsg2 observed during GS was no longer detectable after phosphatase treatment (Fig. S2 A). These results indicate that both Nvj1 and Nsg2 are specifically phosphorylated in response to GS. Since the apparent size of Ypf1 was not changed upon phosphatase treatment (Fig. S2 A) and it has been reported to be N-glycosylated (Avci et al., 2014), we performed immunoblotting of total lysates prepared from Ypf1-FLAG–expressing cells with or without Endo H treatment. The results showed that Ypf1 appeared as a doublet under both glucose-rich and -depleted conditions, with the upper band exhibiting a stronger signal during GS. Upon Endo H treatment, both bands merged into a single band with a lower molecular weight than the original bands, whereas Nvj1 and Nsg2 were unaffected (Fig. 2 F and Fig. S2 B). The molecular weight of Endo H–treated Ypf1 was identical to that of the Ypf1-3NQ mutant, in which all potential N-glycosylation sites (N22, N23, and N28) in the N-terminal region were substituted with glutamine. These findings indicate that the N-terminal region of Ypf1 undergoes additional N-glycosylation in a GS-dependent manner. To identify the glycosylation site, we generated Ypf1-N22Q, -N23Q, and -N28Q mutants and analyzed their migration patterns. We found that GS-dependent glycosylation was abolished in the N28Q mutant, demonstrating that Asn28 is specifically glycosylated in response to GS. This suggests that under normal conditions, Asn28 is not exposed to the luminal space where glycosylation can occur, whereas under glucose-starved condition, it becomes accessible and undergoes glycosylation, implying a GS-induced structural rearrangement in the N-terminal region of Ypf1. The N22Q mutation partially suppressed glycosylation under nutrient-rich conditions, but not under glucose-starved conditions (Fig. 2 G). The N23Q mutation did not affect the migration pattern of Ypf1 under both normal and glucose-starved conditions (Fig. 2 G). Given that the 3NQ mutations completely abolish glycosylation (Fig. 2 F), Asn22 is the primary site for glycosylation, while Asn23 can also be glycosylated. Furthermore, we confirmed that the absence of Ypf1, Nsg1, or Nsg2 did not affect the steady-state levels or modification patterns of Nvj1, Ypf1, Nsg1, and Nsg2 under GS condition (Fig. 2 H and Fig. S2 D). Collectively, these results suggest that GS induces a structural rearrangement in the N-terminal region of Ypf1, increasing the accessibility of residues such as Asn28 to glycosylation enzymes.

Ypf1 and Snf1 mediate NVJ remodeling during GS

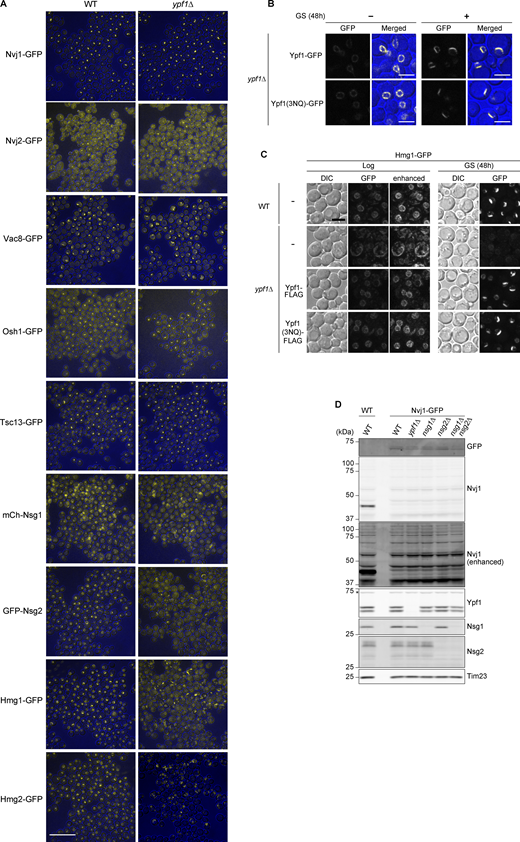
Among the GS-dependent NVJ factors, we found that Ypf1 played a central role in recruiting other components to the NVJ. Loss of Ypf1 impaired the NVJ partitioning of Nsg1, Nsg2, Hmg1, and Hmg2 but not that of Nvj1, Nvj2, Vac8, Osh1, and Tsc13 (Fig. 3 A and Fig. S3 A). In contrast, Nsg1 and Nsg2 were not required for the NVJ partitioning of Ypf1 and Hmg1 (Fig. 3 B). Notably, although Ypf1 is an intramembrane aspartyl protease previously shown to mediate ERAD regulatory by degrading nutrient transporters in coordination with Dfm1 and Doa10 (Avci et al., 2014), our results demonstrated that its enzymatic activity is entirely dispensable for its role at the NVJ. Specifically, the NVJ partitioning of both Ypf1 and Hmg1 was maintained in the catalytically inactive mutant (Ypf1-D366,411A) and glycosylation-deficient mutant (Ypf1-3NQ) (Fig. 3 C; and Fig. S3, B and C). Furthermore, the loss of Ypf1 did not alter the steady-state levels or posttranslational modification patterns of Nvj1, Nsg1, and Nsg2 (Fig. 3 D). These findings strongly suggest that Ypf1, independently of its protease activity, acts as a structural scaffold that facilitates the recruitment of Nsg1/2 and Hmg1/2 to the NVJ.

We next investigated the role of the Ypf1 N-terminal region in GS-dependent NVJ partitioning (Fig. 3 E). Truncation of residues 1–74 (Ypf1Δ74), but not 1–28 (Ypf1Δ28), abolished Ypf1 localization to the NVJ, identifying this region as essential for its recruitment (Fig. 3 F). Since the positively charged residues R28/K29 of Nvj1 are required for Hmg1 recruitment (Rogers et al., 2021), we examined whether Ypf1 targeting relies on a similar mechanism. Although Ypf1 failed to localize to the NVJ in Nvj1-R28A/K29A cells, it remained correctly targeted in the charge-inverted Nvj1-R28E/K29E mutant (Fig. 3 G). Furthermore, among the acidic residues in the Ypf1 N terminus (Fig. 3 E), the E35A substitution disrupted its NVJ accumulation (Fig. 3 H). These results indicate that while the luminal domains of both Nvj1 and Ypf1 are indispensable for NVJ remodeling, their association is likely not mediated by electrostatic interactions. Taken together, our findings suggest that GS-induced structural rearrangements allow the N-terminal region of Ypf1 to serve as a physical scaffold for the recruitment of Nsg1/2 and Hmg1/2, independently of its canonical intramembrane protease activity (Fig. 3 I).

We next investigated upstream regulators of Ypf1. Previous studies reported that the ergosterol-responsive transcription factor Upc2 (Vik and Rine, 2001) is important for the localization of Hmg1 to the NVJ (Rogers et al., 2021). However, our experiments showed that the deletion of UPC2 or its paralog ECM22 (Vik and Rine, 2001) did not affect the NVJ localization of Ypf1 and Hmg1 (Fig. 3 J). In contrast, deletion of Snf1, an AMP-activated S/T protein kinase that is important for glucose-responsive transcriptional regulation (Lin, 2021), prevented the NVJ partitioning of Ypf1 and Hmg1 (Fig. 3 J). Moreover, Snf1 deficiency markedly impaired the GS-dependent glycosylation of Ypf1, reduced the phosphorylation levels of Nvj1 and Nsg2, and destabilized Nvj1 (Fig. 3 K). Based on these results, two possible mechanisms could explain why Ypf1 and Hmg1 fail to localize to the NVJ in the absence of Snf1. One possibility is that the GS-dependent structural change of Ypf1, as indicated by its glycosylation, does not occur without Snf1. Another possibility is that reduced Nvj1 levels caused by Snf1 deletion impair the NVJ partitioning of Ypf1 and Hmg1. Nvj1 remains localized to the NVJ even in the absence of Snf1 (Fig. 3 L), and Ypf1/Hmg1 can still partition to the NVJ in cells expressing lower levels of Nvj1-GFP (Fig. 2 A and Fig. S3 D). However, these two possibilities are not mutually exclusive, and both likely cooperate to ensure proper NVJ remodeling during GS. Therefore, we propose that the failure of Ypf1 and Hmg1 partitioning in snf1Δ cells is likely attributed to a combination of both structural changes in Ypf1 and the quantitative availability of the Nvj1 scaffold.

Ypf1 participates in GS-induced NVJ remodeling, potentially associated with suppression of fatty acid elongases

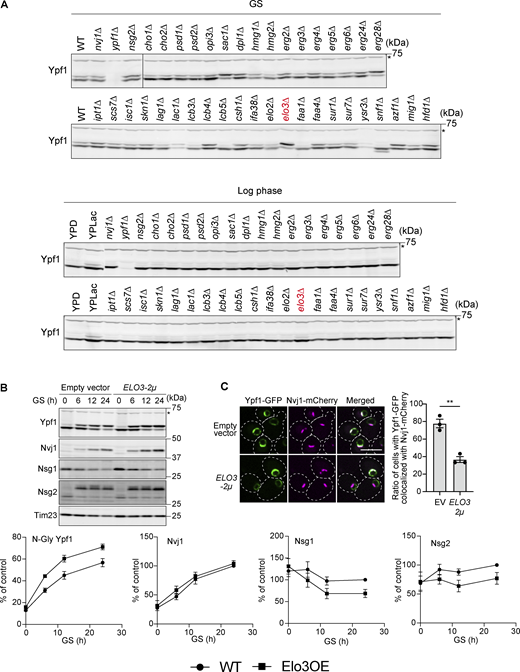
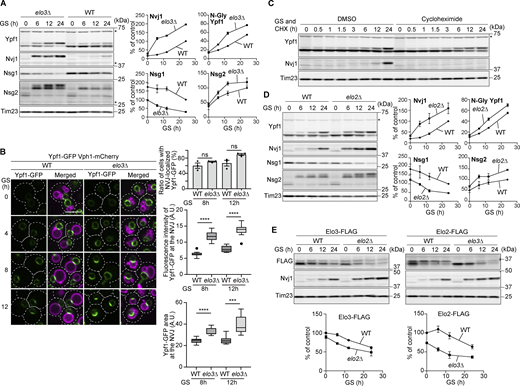
What does Ypf1 sense during GS to trigger NVJ remodeling? Since Asn28 of Ypf1 is glycosylated in a GS-dependent manner, it is likely that the N-terminal region of Ypf1 undergoes a conformational change. We hypothesized that alterations in the lipid composition of the nuclear membrane during GS may alter the membrane topology of the N-terminal region of Ypf1. To test this hypothesis, we performed a lipid-focused screen to identify genes whose deletion affects Ypf1 glycosylation. Specifically, we analyzed the GS-dependent glycosylation of Ypf1 in yeast strains lacking genes involved in phospholipid, sphingolipid, ergosterol, or fatty acid metabolism. Ypf1 glycosylation was enhanced under both nutrient-rich and glucose-starved conditions in cells lacking ELO3, which encodes a fatty acid elongase responsible for the synthesis of VLCFAs (Oh et al., 1997) (Fig. S4 A). We therefore examined whether loss of Elo3 also influenced other GS-dependent NVJ phenotypes. Intriguingly, Elo3 deficiency markedly promoted the phosphorylation and stabilization of Nvj1 and Nsg2, as well as the destabilization of Nsg1 (Fig. 4 A). In addition, NVJ partitioning of Ypf1 was accelerated and enhanced in elo3Δ cells (Fig. 4 B). To test whether Ypf1 simply follows NVJ expansion driven by increased Nvj1 levels, we examined Ypf1 glycosylation in the presence of cycloheximide to block de novo protein synthesis. Under these conditions, new synthesis of Nvj1 was effectively inhibited; however, GS-dependent glycosylation of Ypf1 still occurred (Fig. 4 C). These results indicate that Ypf1 responds to GS independently of increased Nvj1 expression or NVJ expansion. Together, these findings suggest that depletion of VLCFA synthesis facilitates GS-induced NVJ remodeling. To further test this idea, we performed the same analyses in cells lacking Elo2, another fatty acid elongase that functions in VLCFA synthesis. Notably, deletion of ELO2 phenocopied the effects observed in elo3Δ cells. Compared with WT cells, GS more strongly enhanced Ypf1 glycosylation, increased the phosphorylation and stabilization of Nvj1 and Nsg2, and promoted the destabilization of Nsg1 in elo2Δ cells (Fig. 4 D). We then asked whether overexpression of Elo3 would have the opposite effect. Expression of Elo3 from the 2 µ multi-copy plasmid slightly enhanced GS-dependent glycosylation of Ypf1 but did not substantially affect the stability of Nvj1 and Nsg2 or the destabilization of Nsg1 (Fig. S4 B). Nevertheless, NVJ partitioning of Ypf1 was inhibited in cells overexpressing Elo3 (Fig. S4 C). Together, these findings indicate that GS-dependent NVJ factor dynamics are sensitive to perturbations in fatty acid elongation and led us to hypothesize that VLCFA synthesis is suppressed during GS. Consistent with this idea, the protein levels of both Elo2 and Elo3 progressively declined during GS (Fig. 4 E). Furthermore, Elo2 and Elo3 were mutually required for their stability, as deletion of either gene resulted in destabilization of the other protein (Fig. 4 E). These findings suggest that Elo2 and Elo3 form a functionally interdependent unit whose integrity is compromised during GS. Collectively, these findings support a model in which GS promotes destabilization of the fatty acid elongases Elo2 and Elo3, potentially reducing VLCFA synthesis. Such changes may contribute to alterations in membrane lipid composition that facilitate Ypf1-dependent NVJ remodeling.

Simultaneous loss of Nsg1 and Nsg2 leads to LD accumulation during GS

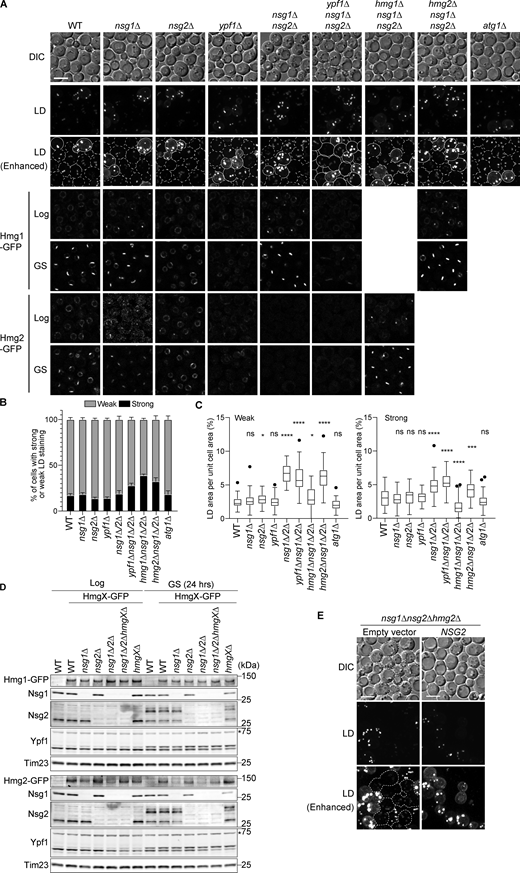
We next sought to address the physiological role of GS-dependent NVJ remodeling. Previously, the GS-dependent Hmg1 NVJ partitioning was reported to activate mevalonate pathway flux. In addition, Nsg1 and Nsg2 have been reported to be important for stability of Hmg2 (Flury et al., 2005; Theesfeld and Hampton, 2013; Wangeline and Hampton, 2021). However, the significance of reciprocal effects on the stabilities of Nsg1 and Nsg2 remains unknown. We thus created yeast strains lacking Nsg1, Nsg2, Ypf1, Hmg1, and Hmg2 and examined their phenotypes. We first noted the accumulation of LD-like spherical structures in DIC images of nsg1Δnsg2Δ cells (Fig. 5 A). LipiBlue, a dye that stains LDs, and LD-marker Erg6-GFP labeled these spherical structures, confirming that they are LDs (Fig. 5 A and Fig. S5). In WT, nsg1Δ, nsg2Δ, ypf1Δ, and nsg1Δnsg2Δ cells, ∼20% of the cells contained LDs that were strongly stained with LipiBlue, while the remaining 80% harbored only weakly stained LDs (Fig. 5 B). In ypf1Δnsg1Δnsg2Δ, hmg1Δnsg1Δnsg2Δ, and hmg2Δnsg1Δnsg2Δ cells, the proportion of cells with strongly stained LDs was slightly increased (Fig. 5 B). These differences in staining intensity with LipiBlue suggest variations in the lipid composition of the LDs. Regardless of whether the cells contained strongly or only weakly stained LDs, a pronounced accumulation of LDs was observed in nsg1Δnsg2Δ cells (Fig. 5 C). To examine whether LD accumulation was due to defective lipophagy, we observed LDs in cells lacking Atg1, a core component of macroautophagy that also plays a role in lipophagy (Mizushima et al., 2011; Seo et al., 2017; Álvarez-Guerra et al., 2024; Diep et al., 2024). LDs did not accumulate in atg1Δ cells, as in WT cells, indicating that the LD accumulation seen in nsg1Δnsg2Δ cells is not attributable to impaired lipophagy. (Fig. 5, A and C). Interestingly, the LD accumulation observed in nsg1Δnsg2Δ cells was abolished by deletion of HMG1, but not by deletion of HMG2 or YPF1, highlighting the importance of Hmg1 activity for LD accumulation in nsg1Δnsg2Δ cells.

We then examined Hmg1 localization in these gene-deletion mutant cells. Hmg1 did not accumulate at the NVJ in WT cells under glucose-rich conditions. However, in the absence of Nsg1, Hmg1 partly relocated to the NVJ even under glucose-rich conditions (Fig. 5 A, nsg1Δ, nsg1Δnsg2Δ, and nsg1Δnsg2Δhmg2Δ). Under the GS condition, the Hmg1 NVJ partitioning was partially compromised in nsg2Δ cells, whereas it was restored when Nsg1 was additionally deleted (Fig. 5 A, nsg1Δsng2Δ). As shown in Fig. 2 E, Nsg1 is stably present under glucose-rich conditions but decreases dramatically during GS. These findings suggest that Nsg1 suppresses Hmg1 NVJ partitioning in the presence of glucose, while the GS-dependent destabilization of Nsg1 allows Hmg1 to accumulate at the NVJ for Hmg1 activation. However, we observed LD accumulation in nsg1Δnsg2Δ but not nsg1Δ cells, indicating that enhanced Hmg1 NVJ partitioning is not the sole factor responsible for LD accumulation. Consistent with this notion, while deletion of YPF1 abolished the NVJ localization of Hmg1, it did not suppress LD accumulation in nsg1Δnsg2Δ cells, as ypf1Δnsg1Δnsg2Δ cells displayed LD phenotypes indistinguishable from those of nsg1Δnsg2Δ cells (Fig. 5, A and C). Notably, in ypf1Δnsg1Δnsg2Δ cells, Hmg1 no longer localized to the NVJ but instead accumulated in subdomains of the ER, suggesting that Hmg1 accumulation per se, rather than its precise localization at the NVJ, may be sufficient to promote LD accumulation.

We also observed the localization of Hmg2, another HMG-CoA reductase. Similar to Hmg1, Hmg2 was not localized to the NVJ under glucose-rich conditions, whereas it accumulated there under GS conditions. In nsg1Δ cells, Hmg2-GFP relocated to the NVJ under GS as in WT cells, although the amount of Hmg2-GFP was lower, as the stability of Hmg2 is dependent on Nsg1 (Flury et al., 2005) (Fig. 5, A and D). Similar to the case of Hmg1-GFP, the NVJ partitioning of Hmg2-GFP was partially impaired in nsg2Δ cells. Deletion of YPF1 similarly abolished NVJ partitioning of Hmg2 under GS conditions, and as the loss of Nsg1 and Ngs2 destabilized Hmg2 (Fig. 5 D), we no longer detected Hmg2-GFP signal in nsg1Δnsg2Δ cells. In contrast, loss of Hmg1 partly restored the decreased levels of Hmg2-GFP, enabling us to observe clear NVJ partitioning of Hmg2-GFP in nsg1Δnsghmg1Δ cells (Fig. 5, A and D). This suggests that Hmg1 negatively regulates the stability and NVJ partitioning of Hmg2. Taken together, these results indicate that LD accumulation occurs only when Nsg1 and either Nsg2 or Hmg2 are nonfunctional.

We thus asked whether Nsg2 or Hmg2 deficiency, when combined with the loss of Nsg1, leads to LD accumulation. To address this, we introduced a CEN plasmid expressing Nsg2 into nsg1Δnsg2Δhmg2Δ and observed LDs. The result showed that re-expression of Nsg2 in nsg1Δnsg2Δhmg2Δ cells markedly reduced the number of cells containing LDs that are only weakly stained by LipiBlue (Fig. 5 E). This result was also confirmed by DIC images, which showed a clear reduction in LD accumulation upon Nsg2 expression (Fig. 5 E, dotted line). These results indicate that the loss of Nsg2, but not Hmg2, in addition to the absence of Nsg1, cause the LD accumulation. These findings strongly suggest that both Nsg1 and Nsg2 not only play a role in stabilizing Hmg2 but also function as suppressors of Hmg1 activity. Specifically, in the presence of glucose, Nsg1 remains stable, preventing Hmg1 NVJ partitioning, while the expression level of Nsg2 is kept low, maintaining basal levels of HMG-CoA reductase activity. During GS, Nsg1 becomes unstable, promoting Hmg1 accumulation at the NVJ and activating its activity. Conversely, GS stabilizes Nsg2, which could in turn suppress HMG-CoA reductase activity. Together, these findings support the idea that Nsg2 contributes to a negative feedback mechanism that limits ergosterol synthesis and maintains sterol homeostasis during GS.

Loss of Nsg1 and Nsg2 drives excessive ergosterol synthesis

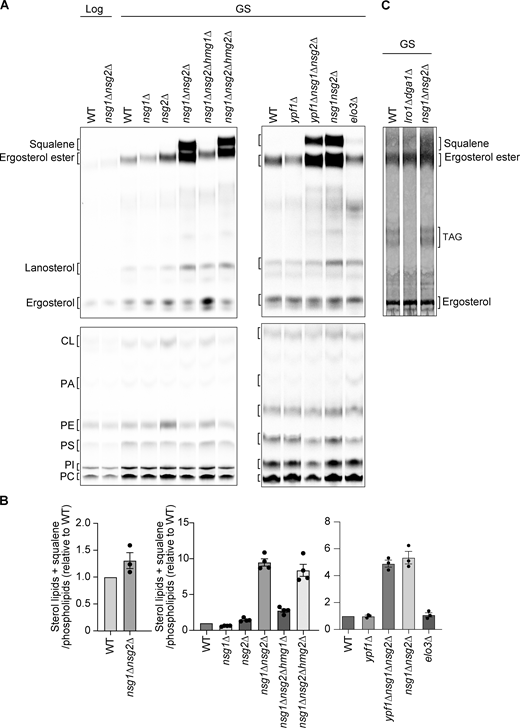
To test the idea above that Nsg1 and Nsg2 regulate the HMG-CoA reductase activity as suppressors, we investigated ergosterol synthesis. Specifically, we metabolically labeled yeast cells with 14C-acetate and analyzed radioisotope (RI)-labeled sterol lipids by thin-layer chromatography. As a control, we also analyzed phospholipids using non-saponified samples and normalized levels of sterol and its precursor lipids to phospholipid content for comparison. Under glucose-rich conditions, there was no significant difference in RI-labeled sterol and its precursor lipid levels between WT and nsg1Δnsg2Δ cells (Fig. 6, A and B). However, intriguingly, under GS, ergosterol esters and squalene, a triterpene intermediate in sterol biosynthesis were drastically accumulated in nsg1Δnsg2Δ cells, strongly suggesting hyperactivation of HMG-CoA reductase in the absence of Nsg1 and Nsg2 (Fig. 6, A and B). In contrast, triacylglycerol (TAG) levels were not significantly different between WT and nsg1Δnsg2Δ cells (Fig. 6 C). lro1Δdga1Δ cells were used as a control, as they are impaired in TAG synthesis and fail to accumulate TAG (Oelkers et al., 2002). The drastic increase in ergosterol ester and squalene was also observed in hmg2Δnsg1Δnsg2Δ and ypf1Δnsg1Δnsg2Δ cells, which exhibit abnormal LD accumulation. Notably, the levels of squalene and ergosterol ester accumulation in ypf1Δnsg1Δnsg2Δ cells were indistinguishable from those in nsg1Δnsg2Δ cells, despite the lack of Hmg1 localization to the NVJ in the absence of Ypf1. These observations suggest that while Nsg1 and Nsg2 are critical determinants of Hmg1 activity, the precise NVJ localization of Hmg1 is dispensable for sterol overproduction under GS conditions. In contrast, we did not observe such lipid accumulation in hmg1Δnsg1Δnsg2Δ cells, where LD accumulation was not detected. Although the loss of Nsg1, Nsg2, Ypf1, or Elo3 alone did not drastically affect sterol synthesis, we observed a slight inhibition in sterol synthesis in nsg1Δ cells and a slight increase in nsg2Δ mutants. Consistent with the notion that loss of Elo3 promotes NVJ remodeling, a small amount of squalene was detected in elo3Δ cells, suggesting a modest enhancement of sterol biosynthetic flux upstream of ergosterol synthesis. These findings suggest that when both Nsg1 and Nsg2 are lacking, Hmg1 becomes hyperactive, leading to the excessive accumulation of ergosterol esters and squalene, which in turn drives abnormal LD formation. Thus, we propose that the INSIG proteins Nsg1 and Nsg2 are not only involved in regulating Hmg2 stability but also play a critical role in repressing Hmg1 activity (Fig. 7). This Hmg1 suppression may constitute a negative feedback mechanism that prevents excessive sterol accumulation under GS conditions.

In summary, our findings reveal a novel stress-response mechanism in which GS triggers membrane remodeling of the NVJ, potentially associated with changes in nuclear membrane lipid composition linked to the suppression of fatty acid elongases, thereby contributing to the regulation of Hmg1 activity (Fig. 7). Moreover, beyond its fundamental biological implications, this study provides a foundation for the development of yeast-based strategies to enhance the industrial production of commercially valuable lipids such as ergosterol and squalene.

MCSs are dynamic inter-organelle interfaces that play central roles in coordinating lipid metabolism and stress adaptation. In this study, we focused on the dynamic nature of the NVJ and demonstrated that NVJ remodeling is associated with the suppression of fatty acid elongases Elo2 and Elo3 (Fig. 7). We identified the INSIG homologs Nsg1 and Nsg2, along with the aspartyl protease Ypf1, as NVJ-localized factors that accumulate in a GS-dependent manner (Fig. 2). Our results show that Ypf1 promotes the recruitment of Nsg1, Nsg2, Hmg1, and Hmg2 to the NVJ under GS (Fig. 3), and that Nsg1 and Nsg2 act as negative regulators of Hmg1 (Figs. 5 and 6). These two INSIG homologs exhibit opposing stabilities during GS: Nsg1 is destabilized, while Nsg2 is stabilized (Fig. 2 E). We propose that this reciprocal regulation is central to a two-step regulatory mechanism that orchestrates Hmg1 activation while preventing excessive metabolic flux. In this model, Nsg1 serves as a primary “brake” under nutrient-rich conditions; its GS-dependent destabilization is required to release Hmg1 from its inhibited state at the ER, thereby facilitating its partitioning to the NVJ. Conversely, the stabilization of Nsg2 during GS ensures that it co-localizes with Hmg1 at the NVJ to act as a “fine-tuner.” This allows for the moderation of Hmg1 activity within the NVJ, preventing hyperactivation once the Nsg1-mediated suppression is relieved. Supporting this, Hmg1 becomes hyperactivated only when both regulators are absent, as evidenced by the striking accumulation of ergosterol intermediates in nsg1Δnsg2Δ cells (Fig. 6). Thus, the dynamic interplay between the destabilization of Nsg1 and the concomitant stabilization of Nsg2 ensures a balanced and tuned metabolic response to GS. (Fig. 7). While this manuscript was under review, a parallel study identified Nsg1 and Nsg2 as GS-specific NVJ residents (Hugenroth et al., 2025). That study further uncovered a role for Pex31 in uncoupling NVJ remodeling from glucose availability. These complementary studies reveal that NVJ remodeling is controlled by multiple, mechanistically distinct regulatory layers.

Our data suggest that these regulatory events are driven by GS-dependent suppression of VLCFA synthesis. Although deletion of either Elo2 or Elo3 clearly promotes NVJ phenotypes associated with GS (Fig. 4), the precise biophysical consequences of Elo2/3 deficiency remain to be clarified. It is currently unknown whether the loss of Elo2 or Elo3 leads to decreased membrane thickness or alters other membrane properties such as fluidity, tension, or curvature. A recent study reported that proteins with short transmembrane domains preferentially accumulate at the NVJ under GS conditions (Prokisch and Büttner, 2024). This observation highlights the potential role of membrane thickness in NVJ-specific protein recruitment and also offers a new perspective on the well-known localization of Tsc13, an enoyl reductase that catalyzes the last step in each cycle of VLCFA elongation, at the NVJ. While Tsc13 is known to be required for PMN (Kvam et al., 2005), the physiological significance of its localization at the NVJ beyond this role has remained unclear. Our results suggest that local VLCFA synthesis at the NVJ contributes to defining membrane properties essential for the spatial recruitment of NVJ regulatory proteins in response to GS. Supporting this idea, Tsc13 is reported to be coimmunoprecipitated with Elo2 and Elo3 (Kohlwein et al., 2001; Kato et al., 2024). This coordination between lipid synthesis and protein recruitment provides a mechanistic framework for understanding how NVJ remodeling adapts to cellular metabolic demands.

Despite these advances, important mechanistic questions remain. Most notably, how Ypf1 recruits Nsg1, Nsg2, and Hmg1/2 to the NVJ remains unclear. We found that the luminal domains of both Nvj1 and Ypf1 are critical for NVJ localization (Fig. 3), but direct physical interaction between these proteins was not detected (data not shown). This suggests the existence of yet-to-be-identified bridging factors that may interact with the N-terminal domains of Nvj1 and Ypf1. Identification of such factors will be key to elucidating the molecular basis of NVJ remodeling. Besides, the upstream mechanism underlying the GS-dependent destabilization of the fatty acid elongases Elo2 and Elo3 remains unclear. Our results show that GS leads to a reduction in the levels of Elo2 and Elo3, strongly suggesting that VLCFA synthesis is suppressed through downregulation of these elongases (Fig. 4 E). However, it is not yet known whether the reduced levels of Elo2 and Elo3 result from increased protein turnover, transcriptional repression, or translational control. Furthermore, we have not directly assessed whether VLCFA levels are indeed decreased or whether sphingolipid composition is altered under these conditions, and thus these aspects remain to be clarified. Elucidating how fatty acid elongase stability and VLCFA metabolism are regulated in response to GS will be critical for fully understanding the link between membrane composition and metabolic stress adaptation.

We also found that Ypf1 likely undergoes structural changes during GS, as indicated by alterations in its N-glycosylation pattern (Fig. 2). While Ypf1 is conserved from yeast to humans, its N-terminal region is poorly conserved, implying that this GS-responsive remodeling mechanism may be specific to yeast. Nevertheless, regulation of membrane physical properties via VLCFA metabolism is likely relevant across species. In mammalian cells, for instance, late endosome/lysosomes (which functionally parallel yeast vacuoles) are known to extensively interact with the ER, forming ER-lysosome MCSs (Friedman et al., 2013). Investigating whether VLCFA-dependent changes in membrane composition regulate factor recruitment at these sites may uncover conserved MCS-based stress response mechanisms. Moreover, our findings raise the possibility that Ypf1 could act as a sensor of GS, potentially linked to changes in VLCFA metabolism. If the N-terminal domain of Ypf1 truly undergoes conformational changes in response to membrane properties, it may serve as a foundation for developing novel membrane-responsive biosensors.

Additional mechanistic questions also remain regarding the regulation of Nsg1 and Nsg2 stability. Previous studies have shown that Nsg1 stability depends on lanosterol availability and that it is degraded in the absence of this sterol intermediate (Theesfeld and Hampton, 2013). Given that GS stimulates ergosterol biosynthesis, the resulting depletion of lanosterol may contribute to Nsg1 destabilization. Conversely, Nsg2 stabilization during GS may be mediated by phosphorylation. Future analysis using phospho-deficient and phospho-mimetic mutants will be important to elucidate this regulatory mechanism. Furthermore, we observed that Hmg2 becomes stabilized upon Hmg1 deletion, even in cells lacking both Nsg1 and Nsg2 (Fig. 5, A and D). This suggests that additional, unidentified factors may regulate Hmg2 turnover, independent of the known INSIG homologs.

Beyond its fundamental biological significance, our findings have important implications for biotechnology. For example, squalene, a valuable lipid used as an adjuvant, in cosmetics and in dietary supplements, is still largely sourced from deep-sea shark liver oil (Mendes et al., 2022). Due to ethical and sustainability concerns, there is growing demand for alternative, nonanimal production systems (Mendes et al., 2022; Gohil et al., 2019). Although metabolic engineering strategies using yeast have achieved some success in boosting squalene production, primarily by enhancing acetyl-CoA supply (Meadows et al., 2016) or overexpressing sterol biosynthetic enzymes (Han et al., 2018; Paramasivan and Mutturi, 2022), these efforts often overlook endogenous negative feedback mechanisms that limit sterol accumulation. Our study reveals one such feedback circuit involving Nsg1 and Nsg2. Disrupting this regulatory loop could synergize with existing metabolic flux optimization strategies to achieve greater production yields. If the repression of this feedback circuit enables more efficient synthesis of squalene or its precursors such as farnesene, it could pave the way for more sustainable and ethically acceptable squalene production platforms.

Yeast strains and growth conditions

Saccharomyces cerevisiae strain FY833 (MATa ura3-52 his3-Δ200 leu2-Δ1 lys2-Δ202 trp1-Δ63) was used as background strains (Winston et al., 1995). The yeast cells used in this study are listed in Table S1. Yeast knockout strains used to screen for genes whose deletion affects the glycosylation pattern of Ypf1 are listed in Table S2. The C-terminal tagging, and gene disruptions were performed by homologous recombination using the appropriate gene cassettes amplified from the plasmids listed in Table S3 (Longtine et al., 1998). The primer pairs used in this study was summarized in Table S4. To introduce the GFP or mCherry tag for the N terminus of NSG1 and NSG2, CRISPR–Cas9 system was used as described previously (Okada et al., 2021). Briefly, we first selected guide RNA target sequences around the start codons of NSG1 and NSG2 using CRISPRdirect. After hybridizing the pair of oligonucleotides containing the target sequences (YU5281/YU5282 for NSG1 and YU5286/YU5287 for NSG2), they were introduced into the Cas9 expression plasmid 16-15 (National BioResource Project, Japan; NBRP ID BYP9747), which had been digested with BsaI. The resulting plasmids were introduced into yeast cells along with donor DNA fragments encoding GFP or mCherry, which were flanked by sequences homologous to the regions 50 bp upstream and downstream of the start codons of NSG1 and NSG2. The resulting transformants were cultured in SCGal-Ura medium, and the integration of the desired DNA fragments was confirmed by PCR using genomic DNA as a template. Finally, the Cas9 expression plasmid was eliminated by culturing the cells in SCD + FOA medium.

Yeast strains chromosomally expressing CsFiND proteins or TurboID-HA were generated as previously described (Fujimoto et al., 2023). Briefly, DNA fragments encoding Ifa38-GFP(n)-3xFLAG-TurboID(c)-natNT2, Dpp1-TurboID(n)-V5-GFP(c)-hphMX, or TurboID-HA-hphMX were PCR-amplified with flanking sequences homologous to the URA3 or LEU2 loci and integrated into the corresponding genomic regions. All plasmids used in this study and their construction procedures are summarized in Table S3.

Yeast cells were cultured in YPD (1% [wt/vol] yeast extract, 2% [wt/vol] polypeptone, and 2% [wt/vol] glucose), SCD (0.67% [wt/vol] yeast nitrogen base without amino acids, 0.5% [wt/vol] casamino acids, and 2% [wt/vol] glucose) or SCGal (0.67% [wt/vol] yeast nitrogen base without amino acids, 0.5% [wt/vol] casamino acids, and 2% [wt/vol] galactose) with appropriate supplements. To eliminate URA3-containing plasmids, 5-fluoroorotic acid was added to SCD medium at a final concentration of 1 µg/ml. To induce GS, YP or SC medium containing 0.01% (wt/vol) glucose was used. For nitrogen starvation, cells were cultured in SD-N medium containing 0.17% (wt/vol) yeast nitrogen base without amino acids and ammonium sulfate and 2% (wt/vol) glucose.

Antibodies

Polyclonal antibodies against Nvj1, Nvj2, Vac8, Ypf1, Nsg1, and Nsg2 were generated by immunizing rabbits with N-terminally His-tagged recombinant proteins expressed in Escherichia coli. The antigens corresponded to the following amino acid regions: Nvj1 (residues 229–321), Nvj2 (residues 218–492), Vac8 (residues 10–515), Ypf1 (residues 497–587), Nsg1 (residues 1–90), and Nsg2 (residues 1–100). Among these, only Nsg1 was purified as a soluble protein, while the other recombinant proteins were isolated from inclusion bodies. Data validating the specificity of these antibodies are summarized in Fig. S6. The anti-Opi3 polyclonal antibody was previously generated against a peptide corresponding to residues 190–206 of Opi3 (Kojima et al., 2016). Tim23 and Tom70 antibodies were kindly provided by Prof. Toshiya Endo (Kyoto Sangyo University, Kyoto, Japan) (Sakaue et al., 2019). The following primary and secondary antibodies were used in this study: Living Colors A.v. monoclonal antibody (JL-8) (#632380; Takara Bio, RRID: AB_10013427), anti-FLAG M2 (#F1804; Sigma-Aldrich), anti-V5 (#M215-3; MBL), anti-HA (#M180-3; MBL), Cy5-streptavidin (#GEPA45001; Cytiva), Cy5-conjugated goat anti-rabbit IgG (#111-175-144; Jackson ImmunoResearch, RRID: AB_2338013), and DyLight 800-conjugated rabbit IgG (#611-145-122; Rockland, RRID: AB_1057618).

Purification of biotinylated proteins by CsFiND

Yeast cells expressing CsFiND proteins were inoculated into 200 ml of SCD at an initial OD600 of 0.02. Once the OD600 reached between 0.8 and 1.2, biotin was added to a final concentration of 50 μM, followed by an additional 3-h incubation. To induce nitrogen starvation, logarithmically growing cells were collected and washed with SD-N medium twice and transferred to SD-N medium for 3 h. Biotin was then added to a final concentration of 50 μM, followed by an additional 3-h incubation. Cells corresponding to 200 OD600 units were harvested and incubated in 20 ml of alkaline buffer (0.1 M Tris-HCl, pH 9.5, and 10 mM DTT) at 30°C for 10 min. After washing with spheroplast buffer (20 mM Tris-HCl, pH 7.5, and 1.2 M sorbitol), the cells were treated with 2 units/ml of Zymolyase 20T (Nacalai Tesque, Inc.) in 25 ml of spheroplast buffer and incubated for 30 min at 30°C. The resulting spheroplasts were washed with ice-cold spheroplast buffer and lysed by vortexing for 1 min in 1 ml of ice-cold breaking buffer (20 mM Tris-HCl, pH 7.5, 0.6 M mannitol, 1 mM EDTA, and 1 mM PMSF) containing 0.5 ml of glass beads. An additional 5 ml of breaking buffer was added, and the mixture was centrifuged at 2,000 × g for 5 min to remove unbroken cells, nuclei, and beads. The supernatant was collected and centrifuged at 100,000 × g for 15 min to isolate membrane fractions, which were then washed and resuspended in SEM buffer (10 mM MOPS-KOH, pH 7.2, 250 mM sucrose, and 1 mM EDTA).

To purify biotinylated proteins, membrane fractions (2 mg of protein) were solubilized in 250 μl of RIPA buffer (50 mM Tris-HCl, pH 7.5, 150 mM NaCl, 1% [vol/vol] Triton X-100, 0.5% [wt/vol] sodium deoxycholate, 0.1% [wt/vol] SDS, and 2 mM PMSF) on ice for 20 min. After centrifugation at 12,000 × g for 10 min, 200 μl of the supernatant was transferred to 2-ml tubes containing 1.8 ml of RIPA buffer and 20 μl of Pierce streptavidin magnetic beads (Thermo Fisher Scientific). For LC-MS/MS analysis, this procedure was scaled up fourfold using 8 mg of membrane protein. The mixtures were incubated at 4°C for 4 h with gentle rotation. The beads were collected with a magnetic rack and sequentially washed once with RIPA buffer, 1 M KCl, 0.1 M Na2CO3, and urea buffer (20 mM HEPES-KOH, pH 7.5, and 2 M urea), followed by two additional washes with RIPA buffer and three washes with D-PBS (−) (Fujifilm Wako Pure Chemical). For immunoblotting, bound proteins were eluted with 3× SDS sample buffer (0.375 M Tris-HCl, pH 6.8, 6.3% [wt/vol] SDS, 30% [wt/vol] sucrose, and 0.01% [wt/vol] bromophenol blue) supplemented with 2 mM biotin. For LC-MS/MS, the beads were stored in methanol until further processing. After removing the methanol, proteins on the beads were digested in 200 μl of trypsin digestion buffer (1% [wt/vol] sodium deoxycholate, 1 M urea [Thermo Fisher Scientific], 50 mM NH4HCO3, and 0.25 μg of sequencing-grade modified trypsin [Promega]) at 37°C for 24 h. Following digestion, 40 μl of 5% (vol/vol) formic acid was added, and the samples were vortexed and centrifuged at 20,000 × g for 10 min at room temperature. The resulting supernatant (200 μl) was extracted with 200 μl of ethyl acetate by vigorous vortexing, followed by centrifugation at 20,000 × g for 5 min. The upper organic phase was removed, and the aqueous phase was dried using a vacuum concentrator (Eppendorf) at 40°C. Dried peptides were dissolved in 20 μl of 0.1% (vol/vol) formic acid. After desalting with a C-Tip (nikkyo-tec: NTCR-KT200-C18), the samples were analyzed by LC-MS/MS using an EASY-nLC 1000 system (Thermo Fisher Scientific) coupled to a Q Exactive mass spectrometer (Thermo Fisher Scientific). Full-scan spectra were acquired in the m/z range of 380–1500 in data-dependent acquisition mode. Raw data were searched against the Swiss-Prot S. cerevisiae protein database using Proteome Discoverer software (version 1.4, Thermo Fisher Scientific) with Mascot (version 2.8, Matrix Science) as the search engine. Mass tolerances for precursor and fragment ions were set to 10 ppm and 0.8 Da, respectively. Trypsin was specified as the digestion enzyme with up to one missed cleavage allowed. Methionine oxidation was set as a variable modification. The search results were filtered using Percolator with a false discovery rate threshold of 1%. The LC-MS/MS data are summarized in Table S5.

Fluorescence microscopy

Yeast cells in the logarithmic growth phase, cultured in YPD or SCD medium, or cells subjected to glucose starvation or nitrogen starvation by transfer to YP or SC medium containing 0.01% (wt/vol) glucose or SD-N medium, were observed using a model IX83 microscope (Olympus) equipped with a CSU-X1 confocal unit (Yokogawa), a 100× and 1.4 numerical aperture objective lens (UPlanSApo; Olympus), and an Evolve 512 EM-CCD camera (Photometrics). Image acquisition was performed using MetaMorph software (Molecular Devices). LipiBlue, GFP, or mCherry were excited using a 405-nm, 488-nm, or 561-nm laser (OBIS; Coherent), respectively. The confocal fluorescent sections were collected every 0.2 µm from the upper to the bottom surface of yeast cells. ImageJ software (NIH) was used to create maximum projection images.

For LD staining, LipiBlue (0.1 mM stock solution, Dojindo) was added to the cell culture at a final concentration of 75 nM, and the cells were incubated for 30 min. Cells were then washed twice with Milli-Q water prior to imaging.

Phosphatase treatment

Membrane fractions were resuspended in assay buffer (300 mM sucrose, 50 mM HEPES, pH 7.5, 100 mM NaCl, 2 mM DTT, and 0.01% [wt/vol] Brij 35) to a final protein concentration of 2 mg/ml. The suspension was treated with 200 units of Lambda Protein Phosphatase (NEB, P0753S) at 30°C for 15 min to dephosphorylate 100 µg of membrane protein. The reaction was terminated by adding an equal volume of 20% (vol/vol) TCA, followed by incubation on ice for 20 min and centrifugation at 20,000 × g for 10 min. The resulting pellet was washed with ice-cold acetone, resuspended in SDS sample buffer, and subjected to Phos-tag or SDS-PAGE.

Immunoblotting

For immunoblotting, whole-cell extracts were prepared as follows. Yeast cells in logarithmic phase or after GS treatment were harvested at 2 OD600 units and resuspended in 300 μl of 10% (vol/vol) TCA, followed by incubation on ice for 10 min. The cells were then centrifuged at 13,200 × g for 5 min at 4°C. The pellet was resuspended in 100 μl of 10% (vol/vol) TCA along with 100 μl of glass beads (φ0.35–0.50 mm), and disrupted by vortexing (30 s on, 60 s off, eight cycles). After disruption, 900 μl of 10% (vol/vol) TCA was added to the sample and vortexed, and 800 μl of the supernatant was transferred to a new tube. The supernatant was centrifuged at 13,200 × g for 5 min at 4°C. The resulting pellet was resuspended in 800 μl of ice-cold acetone, followed by centrifugation at 20,000 × g for 5 min at 4°C. The final pellet was resuspended in 160 μl of SDS sample buffer, incubated at 37°C for 15 min, and used for SDS-PAGE. For SDS-PAGE, either homemade gels or precast gels (SuperSep Ace, 10–20%, Wako) were used, while Phos-tag SDS-PAGE was performed using Phos-tag precast gels (SuperSep Phos-tag [50 μmol/l], 10%, Wako). After SDS-PAGE, proteins were transferred to polyvinylidene fluoride Immobilon-FL or Immobilon-P membranes (Millipore). For streptavidin blotting, PVDF membranes were blocked for 6 h in 3% BSA blocking buffer (10 mM Tris-HCl, pH 7.5, 150 mM NaCl, 0.05% [vol/vol] Tween 20, and 3% [wt/vol] BSA; cat# 01281-26; Nacalai Tesque). For standard immunoblotting, membranes were blocked for 1 h in 1% skim milk blocking buffer (10 mM Tris-HCl, pH 7.5, 150 mM NaCl, 0.05% [vol/vol] Tween 20, and 1% [wt/vol] skim milk; cat# 0652842; Morinaga). The transferred proteins were detected by fluorophore-conjugated to secondary antibodies or streptavidin, such as Cy5 AffiniPure Goat Anti-Rabbit IgG (H + L) (AB_2338013; Jackson ImmunoResearch Laboratories), Rabbit IgG (H&L) Antibody DyLight 800 Conjugated Pre-Adsorbed (AB_1057618; Rockland), and Streptavidin-Cy5, (GEPA45001; Cytiva), and analyzed with Amersham Typhoon scanner (Cytiva). Band intensities were quantified by densitometric analysis using ImageJ software (NIH).

Lipid analysis

Metabolic labeling of the mevalonate pathway and analysis of the resulting radiolabeled lipids were performed essentially as described previously (Gardner et al., 2001). Briefly, 1 μl of a saturated yeast culture was inoculated into 5 ml of YPD medium and cultivated at 30°C until the culture reached an OD600 of 1.5. 7 OD units of cells were harvested by centrifugation and washed twice with YP medium containing 0.01% (wt/vol) glucose. The cells were then resuspended in 5 ml of the same medium supplemented with 1 μCi/ml of [1–14C] acetic acid and sodium salt and incubated at 30°C for 24 h.

To analyze sterol lipids, 3.5 OD units of cells were collected into 2-ml safe-lock tubes (Eppendorf) and centrifuged to pellet the cells. The pellet was resuspended in 200 μl of methanol and vortexed vigorously for 5 min at room temperature. Subsequently, 200 μl of glass beads (φ0.35–0.50 mm) were added, and the mixture was vortexed again for 5 min. After the addition of 900 μl of methanol, the samples were rotated gently for 15 min at room temperature. The samples were centrifuged at 13,200 × g for 5 min, and 900 μl of the supernatant was transferred to a new 2-ml tube. For saponification, 600 μl of 10% (wt/vol) KOH was added to the methanolic extract, and the sample was rotated at room temperature for 24 h. After saponification, 400 μl of petroleum ether was added, and the sample was vortexed for 5 min. The mixture was centrifuged at 13,200 × g for 5 min, and 300 μl of the upper (organic) phase was collected into a new 2-ml tube. A second extraction was performed by adding another 400 μl of petroleum ether to the remaining aqueous phase, followed by vortexing and centrifugation under the same conditions. Then, 350 μl of the upper layer was collected and combined with the first extract. The combined organic phase was dried completely under a stream of nitrogen gas at 60°C. The dried lipids were dissolved in 30 μl of petroleum ether. 20 microliters of the sample were spotted onto a TLC plate (#810123; MACHEREY-NAGEL). The plate was developed in solvent A (benzene:ethyl acetate = 100:20) to a height of ∼10 cm from the bottom, air-dried for 10 min, and developed again in the same solvent to the same distance. After drying, the plate was further developed in solvent B (petroleum ether:diethyl ether:acetic acid = 95:5:1) to ∼15 cm and dried. Radiolabeled lipids were detected by autoradiography using an Amersham Typhoon scanner (Cytiva).

To analyze phospholipids, 3.0 OD600 units of cells were collected into 2-ml safe-lock tubes (Eppendorf) and centrifuged to pellet the cells. The pellet was resuspended in 300 μl of methanol and vortexed vigorously for 5 min at room temperature. Subsequently, 200 μl of glass beads (φ0.35–0.50 mm) were added, and the mixture was vortexed again for 20 min. After the addition of 600 μl of chloroform, the samples were vortexed for 5 min at room temperature. The samples were centrifuged at 13,200 × g for 5 min, and 750 μl of the supernatant was transferred to a new 2-ml tube. Then, 200 μl of 0.1M NaCl, 0.1 M HCl was added to the samples and further vortexed for 5 min at room temperature. After centrifugation at 210 × g for 5 min at room temperature, the upper phase was removed, and the lower phase was dried completely under a stream of nitrogen gas at 60°C. The dried lipids were dissolved in 30 μl of chloroform. 20 microliters of the sample were spotted onto a TLC plate (#810123; MACHEREY-NAGEL), which was developed in solvent C (chloroform:ethanol:triethylamine:water = 30:35:35:5) to a height of ∼15 cm from the bottom. Radiolabeled lipids were detected by autoradiography using an Amersham Typhoon scanner (Cytiva).

TAG was analyzed using a modified protocol based on a previously described HPTLC method (Meyer et al., 2024). Yeast cells were cultured in 5 ml of YPD medium to mid-log phase. GS was induced by washing the cells twice with YP medium containing 0.01% [wt/vol] glucose, followed by resuspension in the same medium and incubation for 24 h. After incubation, cells corresponding to 8 OD units were collected and pelleted by centrifugation at 13,200 × g for 5 min at room temperature. The cell pellet was resuspended in 500 μl of extraction solvent A (chloroform:methanol, 2:1, vol/vol), supplemented with 200 μl of glass beads, and vigorously vortexed for 30 min at room temperature. Subsequently, 600 μl of solvent A was added, and the mixture was vortexed again and centrifuged at 2,000 × g for 5 min. The organic phase (1 ml) was transferred to a new tube, mixed with 200 μl of Milli-Q water, vortexed for 5 min, and centrifuged at 2,000 × g for 5 min. The upper aqueous phase was removed. The remaining organic phase was washed by adding 400 μl of solvent B (methanol:water:chloroform, 48:47:3, vol/vol/vol), followed by vortexing for 5 min and centrifugation at 2,000 × g for 5 min. The upper phase was again removed. The lipid extract was dried under a stream of nitrogen gas at 60°C. The dried lipids were resuspended in 100 μl of solvent A and vortexed for 5 min. A 20 μl aliquot of each sample was applied onto a TLC plate (#810123; MACHEREY-NAGEL), followed by separation of lipids by thin-layer chromatography using a solvent system of n-hexane, n-heptane, diethyl ether, and acetic acid (63:18.5:18.5:1, vol/vol/vol/vol). Plates were developed to a distance of ∼15 cm, air-dried for 10 min at room temperature, and sprayed with 0.01% [wt/vol] primuline in 80% [vol/vol] acetone. After heating at 40°C for 2 min to evaporate the solvent, lipid bands were visualized using a Typhoon scanner (Cy2 channel).

Statistical analyses

Data are shown as mean with standard error of the mean as indicated in the figure legends. Statistical analyses were performed using the Mann–Whitney U test in Prism 11 (GraphPad).

Online supplemental material

Fig. S1 shows identification of NVJ-localized proteins using CsFiND. Fig. S2 shows that Nvj1 and Nsg2 are phosphorated in a GS-dependent manner. Fig. S3 shows that the glycosylation of Ypf1 is not required for GS-dependent remodeling of the NVJ. Fig. S4 shows that deletion of ELO3 promotes GS-dependent glycosylation of Ypf1. Fig. S5 shows that LDs accumulate in the absence of Nsg1 and Nsg2. Fig. S6 shows validation of antibody specificity used in this study. Table S1 lists the yeast strains used in this study. Table S2 lists the yeast knockout strains used to screen for genes whose deletion affects the glycosylation pattern of Ypf1. Table S3 lists the plasmids used for C-terminal tagging and gene disruption by homologous recombination (Longtine et al., 1998). Table S4 summarizes the primer pairs used in this study. Table S5 summarizes the LC-MS/MS data.

The data are available from the corresponding author upon reasonable request.

We thank M. Hashimoto for her great technical assistance. We are grateful to the members of the Tamura laboratory for helpful discussion. We thank Prof. Toshiya Endo (Kyoto Sangyo University) for kindly providing the antibodies against Tom70 and Tim23.

This work was supported by Japan Society for the Promotion of Science (JSPS) KAKENHI (grant numbers 20H05689, 22H02568, and 25K02220 to Y. Tamura), Japan Agency for Medical Research and Development (AMED)-Core Research for Evolutional Science and Technology (grant number JP20gm5910026) from Japan Agency for Medical Research and Development, the Takeda Science Foundation, Yamada Science Foundation, and KOSE Cosmetology Research Foundation to Y. Tamura. S. Fujimoto is a JSPS fellow.

Author contributions: Shintaro Fujimoto: conceptualization, data curation, formal analysis, funding acquisition, investigation, methodology, project administration, resources, validation, visualization, and writing, review, and editing. Yasushi Tamura: conceptualization, data curation, formal analysis, funding acquisition, investigation, methodology, project administration, resources, supervision, validation, visualization, and writing—original draft, review, and editing.

Álvarez-Guerra
,
I.
,
E.
Block
,
F.
Broeskamp
,
S.
Gabrijelčič
,
T.
Infant
,
A.
De Ory
,
L.
Habernig
,
C.
Andréasson
,
T.P.
Levine
,
J.L.
Höög
, and
S.
Büttner
.
2024
.
LDO proteins and Vac8 form a vacuole-lipid droplet contact site to enable starvation-induced lipophagy in yeast
.
Dev. Cell
.
59
:
759
775.e5
.
Avci
,
D.
,
S.
Fuchs
,
B.
Schrul
,
A.
Fukumori
,
M.
Breker
,
I.
Frumkin
,
C.Y.
Chen
,
M.L.
Biniossek
,
E.
Kremmer
,
O.
Schilling
, et al
.
2014
.
The yeast ER-Intramembrane protease Ypf1 refines nutrient sensing by regulating transporter abundance
.
Mol. Cell
.
56
:
630
640
.
Aviram
,
N.
,
T.
Ast
,
E.A.
Costa
,
E.C.
Arakel
,
S.G.
Chuartzman
,
C.H.
Jan
,
S.
Haßdenteufel
,
J.
Dudek
,
M.
Jung
,
S.
Schorr
, et al
.
2016
.
The SND proteins constitute an alternative targeting route to the endoplasmic reticulum
.
Nature
.
540
:
134
138
.
Breker
,
M.
,
M.
Gymrek
,
O.
Moldavski
, and
M.
Schuldiner
.
2014
.
LoQAtE--Localization and quantitation ATlas of the yeast proteomE. A new tool for multiparametric dissection of single-protein behavior in response to biological perturbations in yeast
.
Nucleic Acids Res.
42
:
D726
D730
.
Brown
,
M.S.
, and
J.L.
Goldstein
.
1997
.
The SREBP pathway: Regulation of cholesterol metabolism by proteolysis of a membrane-bound transcription factor
.
Cell
.
89
:
331
340
.
Casas
,
M.
, and
E.J.
Dickson
.
2024
.
Channels, transporters, and receptors at membrane contact sites
.
Contact
.
7
:
25152564241305593
.
Casler
,
J.C.
,
C.S.
Harper
, and
L.L.
Lackner
.
2025
.
Mitochondria-plasma membrane contact sites regulate the ER-mitochondria encounter structure
.
J. Cell Sci.
138
:
JCS263685
.
Diep
,
D.T.V.
,
J.
Collado
,
M.
Hugenroth
,
R.M.
Fausten
,
L.
Percifull
,
M.
Wälte
,
C.
Schuberth
,
O.
Schmidt
,
R.
Fernández-Busnadiego
, and
M.
Bohnert
.
2024
.
A metabolically controlled contact site between vacuoles and lipid droplets in yeast
.
Dev. Cell
.
59
:
740
758.e10
.
Dimmer
,
K.S.
, and
D.
Rapaport
.
2017
.
Mitochondrial contact sites as platforms for phospholipid exchange
.
Biochim. Biophys. Acta Mol. Cell Biol. Lipids
1862
:
69
80
.
Diokmetzidou
,
A.
, and
L.
Scorrano
.
2025
.
Mitochondria-membranous organelle contacts at a glance
.
J. Cell Sci.
138
:
jcs263895
.
Eisenberg-Bord
,
M.
,
N.
Shai
,
M.
Schuldiner
, and
M.
Bohnert
.
2016
.
A tether is a tether is a tether: Tethering at membrane contact sites
.
Dev. Cell
.
39
:
395
409
.
Elbaz-Alon
,
Y.
,
E.
Rosenfeld-Gur
,
V.
Shinder
,
A.H.
Futerman
,
T.
Geiger
, and
M.
Schuldiner
.
2014
.
A dynamic interface between vacuoles and mitochondria in yeast
.
Dev. Cell
.
30
:
95
102
.
Flury
,
I.
,
R.
Garza
,
A.
Shearer
,
J.
Rosen
,
S.
Cronin
, and
R.Y.
Hampton
.
2005
.
INSIG: A broadly conserved transmembrane chaperone for sterol-sensing domain proteins
.
EMBO J.
24
:
3917
3926
.
Friedman
,
J.R.
,
J.R.
Dibenedetto
,
M.
West
,
A.A.
Rowland
, and
G.K.
Voeltz
.
2013
.
Endoplasmic reticulum-endosome contact increases as endosomes traffic and mature
.
Mol. Biol. Cell
.
24
:
1030
1040
.
Fujimoto
,
S.
,
S.
Tashiro
, and
Y.
Tamura
.
2023
.
Complementation assay using fusion of Split-GFP and TurboID (CsFiND) enables simultaneous visualization and proximity labeling of organelle contact sites in yeast
.
Contact
.
6
:
251525642311536
.
Funakoshi
,
M.
, and
M.
Hochstrasser
.
2009
.
Small epitope-linker modules for PCR-based c-terminal tagging in Saccharomyces cerevisiae
.
Yeast
.
26
:
185
192
.
Gardner
,
R.G.
,
H.
Shan
,
S.P.T.
Matsuda
, and
R.Y.
Hampton
.
2001
.
An oxysterol-derived positive signal for 3-Hydroxy- 3-methylglutaryl-CoA reductase degradation in yeast
.
J. Biol. Chem.
276
:
8681
8694
.
Gohil
,
N.
,
G.
Bhattacharjee
,
K.
Khambhati
,
D.
Braddick
, and
V.
Singh
.
2019
.
Engineering strategies in microorganisms for the enhanced production of squalene: Advances, challenges and opportunities
.
Front. Bioeng. Biotechnol.
7
:
50
.
Goldstein
,
J.L.
,
R.A.
DeBose-Boyd
, and
M.S.
Brown
.
2006
.
Protein sensors for membrane sterols
.
Cell
.
124
:
35
46
.
González Montoro
,
A.
,
K.
Auffarth
,
C.
Hönscher
,
M.
Bohnert
,
T.
Becker
,
B.
Warscheid
,
F.
Reggiori
,
M.
van der Laan
,
F.
Fröhlich
, and
C.
Ungermann
.
2018
.
Vps39 interacts with Tom40 to establish one of two functionally distinct vacuole-mitochondria contact sites
.
Dev. Cell
.
45
:
621
636.e7
.
Han
,
J.Y.
,
S.H.
Seo
,
J.M.
Song
,
H.
Lee
, and
E.-S.
Choi
.
2018
.
High-level recombinant production of squalene using selected Saccharomyces cerevisiae strains
.
J. Ind. Microbiol. Biotechnol.
45
:
239
251
.
Hariri
,
H.
,
S.
Rogers
,
R.
Ugrankar
,
Y.L.
Liu
,
J.R.
Feathers
, and
W.M.
Henne
.
2018
.
Lipid droplet biogenesis is spatially coordinated at ER-vacuole contacts under nutritional stress
.
EMBO Rep.
19
:
57
72
.
Henne
,
W.M.
, and
H.
Hariri
.
2018
.
Endoplasmic reticulum-vacuole contact sites “Bloom” with stress-induced lipid droplets
.
Contact
.
1
:
2515256418756112
.
Henne
,
W.M.
,
L.
Zhu
,
Z.
Balogi
,
C.
Stefan
,
J.A.
Pleiss
, and
S.D.
Emr
.
2015
.
Mdm1/Snx13 is a novel ER-endolysosomal interorganelle tethering protein
.
J. Cell Biol.
210
:
541
551
.
Hönscher
,
C.
,
M.
Mari
,
K.
Auffarth
,
M.
Bohnert
,
J.
Griffith
,
W.
Geerts
,
M.
van der Laan
,
M.
Cabrera
,
F.
Reggiori
, and
C.
Ungermann
.
2014
.
Cellular metabolism regulates contact sites between vacuoles and mitochondria
.
Dev. Cell
.
30
:
86
94
.
Horton
,
J.D.
,
J.L.
Goldstein
, and
M.S.
Brown
.
2002
.
SREBPs: Activators of the complete program of cholesterol and fatty acid synthesis in the liver
.
J. Clin. Invest.
109
:
1125
1131
.
Hugenroth
,
M.
,
P.
Höhne
,
X.-T.
Zhao
,
M.
Wälte
,
D.T.V.
Diep
,
R.M.
Fausten
, and
M.
Bohnert
.
2025
.
Role of Pex31 in metabolic adaptation of the nucleus-vacuole junction
.
J. Cell Sci.
138
:
jcs264171
.
Jeong
,
H.
,
J.
Park
,
H.-I.
Kim
,
M.
Lee
,
Y.
Ko
,
S.
Lee
,
Y.
Jun
, and
C.
Lee
.
2017
.
Mechanistic insight into the nucleus-vacuole junction based on the Vac8p-Nvj1p crystal structure
.
Proc. Natl. Acad. Sci. USA
.
114
:
E4539
E4548
.
Kakimoto
,
Y.
,
S.
Tashiro
,
R.
Kojima
,
Y.
Morozumi
,
T.
Endo
, and
Y.
Tamura
.
2018
.
Visualizing multiple inter-organelle contact sites using the organelle-targeted split-GFP system
.
Sci. Rep.
8
:
6175
.
Kakimoto-Takeda
,
Y.
,
R.
Kojima
,
H.
Shiino
,
M.
Shinmyo
,
K.
Kurokawa
,
A.
Nakano
,
T.
Endo
, and
Y.
Tamura
.
2022
.
Dissociation of ERMES clusters plays a key role in attenuating the endoplasmic reticulum stress
.
iScience
.
25
:
105362
.
Kato
,
R.
,
Y.
Takenaka
,
Y.
Ohno
, and
A.
Kihara
.
2024
.
Catalytic mechanism of trans-2-enoyl-CoA reductases in the fatty acid elongation cycle and its cooperative action with fatty acid elongases
.
J. Biol. Chem.
300
:
105656
.
Kohler
,
V.
, and
S.
Büttner
.
2021
.
Remodelling of nucleus-vacuole junctions during metabolic and proteostatic stress
.
Contact
.
4
:
251525642110166
.
Kohlwein
,
S.D.
,
S.
Eder
,
C.-S.
Oh
,
C.E.
Martin
,
K.
Gable
,
D.
Bacikova
, and
T.
Dunn
.
2001
.
Tsc13p is required for fatty acid elongation and localizes to a novel structure at the nuclear-vacuolar interface in Saccharomyces cerevisiae
.
Mol. Cell. Biol.
21
:
109
125
.
Kojima
,
R.
,
T.
Endo
, and
Y.
Tamura
.
2016
.
A phospholipid transfer function of ER-mitochondria encounter structure revealed in vitro
.
Sci. Rep.
6
:
30777
.
Kornmann
,
B.
,
E.
Currie
,
S.R.
Collins
,
M.
Schuldiner
,
J.
Nunnari
,
J.S.
Weissman
, and
P.
Walter
.
2009
.
An ER-mitochondria tethering complex revealed by a synthetic biology screen
.
Science
325
:
477
481
.
Krick
,
R.
,
Y.
Muehe
,
T.
Prick
,
S.
Bremer
,
P.
Schlotterhose
,
E.-L.
Eskelinen
,
J.
Millen
,
D.S.
Goldfarb
, and
M.
Thumm
.
2008
.
Piecemeal microautophagy of the nucleus requires the core macroautophagy genes
.
Mol. Biol. Cell
.
19
:
4492
4505
.
Kvam
,
E.
, and
D.S.
Goldfarb
.
2004
.
Nvj1p is the outer-nuclear-membrane receptor for oxysterol-binding protein homolog Osh1p in Saccharomyces cerevisiae
.
J. Cell Sci.
117
:
4959
4968
.
Kvam
,
E.
,
K.
Gable
,
T.M.
Dunn
, and
D.S.
Goldfarb
.
2005
.
Targeting of Tsc13p to nucleus-vacuole junctions: A role for very-long-chain fatty acids in the biogenesis of microautophagic vesicles
.
Mol. Biol. Cell.
16
:
3987
3998
.
Lanz
,
M.C.
,
K.
Yugandhar
,
S.
Gupta
,
E.J.
Sanford
,
V.M.
Faça
,
S.
Vega
,
A.M.N.
Joiner
,
J.C.
Fromme
,
H.
Yu
, and
M.B.
Smolka
.
2021
.
In-depth and 3-dimensional exploration of the budding yeast phosphoproteome
.
EMBO Rep.
22
:e51121.
Leutert
,
M.
,
A.S.
Barente
,
N.K.
Fukuda
,
R.A.
Rodriguez-Mias
, and
J.
Villén
.
2023
.
The regulatory landscape of the yeast phosphoproteome
.
Nat. Struct. Mol. Biol.
30
:
1761
1773
.
Lin
,
X.
2021
.
The regulation of Saccharomyces cerevisiae Snf1 protein kinase on glucose utilization is in a glucose-dependent manner
.
Curr. Genet.
67
:
245
248
.
Longtine
,
M.S.
,
A.
Mckenzie
3rd
,
D.J.
Demarini
,
N.G.
Shah
,
A.
Wach
,
A.
Brachat
,
P.
Philippsen
, and
J.R.
Pringle
.
1998
.
Additional modules for versatile and economical PCR-based gene deletion and modification in Saccharomyces cerevisiae
.
Yeast
.
14
:
953
961
.
MacGilvray
,
M.E.
,
E.
Shishkova
,
M.
Place
,
E.R.
Wagner
,
J.J.
Coon
, and
A.P.
Gasch
.
2020
.
Phosphoproteome response to Dithiothreitol reveals unique versus shared features of Saccharomyces cerevisiae stress responses
.
J. Proteome Res.
19
:
3405
3417
.
Malia
,
P.C.
, and
C.
Ungermann
.
2016
.
Vacuole membrane contact sites and domains: Emerging hubs to coordinate organelle function with cellular metabolism
.
Biochem. Soc. Trans.
44
:
528
533
.
Manik
,
M.K.
,
H.
Yang
,
J.
Tong
, and
Y.J.
Im
.
2017
.
Structure of yeast OSBP-related protein Osh1 reveals key determinants for lipid transport and protein targeting at the nucleus-vacuole junction
.
Structure
.
25
:
617
629.e3
.
Meadows
,
A.L.
,
K.M.
Hawkins
,
Y.
Tsegaye
,
E.
Antipov
,
Y.
Kim
,
L.
Raetz
,
R.H.
Dahl
,
A.
Tai
,
T.
Mahatdejkul-Meadows
,
L.
Xu
, et al
.
2016
.
Rewriting yeast central carbon metabolism for industrial isoprenoid production
.
Nature
.
537
:
694
697
.
Mendes
,
A.
,
J.
Azevedo-Silva
, and
J.C.
Fernandes
.
2022
.
From sharks to yeasts: Squalene in the development of vaccine adjuvants
.
Pharmaceuticals
.
15
:
265
.
Meyer
,
T.
,
O.
Knittelfelder
,
M.
Smolnig
, and
P.
Rockenfeller
.
2024
.
Quantifying yeast lipidomics by high-performance thin-layer chromatography (HPTLC) and comparison to mass spectrometry-based shotgun lipidomics
.
Microb. Cell
.
11
:
57
68
.
Mizushima
,
N.
,
T.
Yoshimori
, and
Y.
Ohsumi
.
2011
.
The role of Atg proteins in autophagosome formation
.
Annu. Rev. Cell Dev. Biol.
27
:
107
132
.
Oelkers
,
P.
,
D.
Cromley
,
M.
Padamsee
,
J.T.
Billheimer
, and
S.L.
Sturley
.
2002
.
The DGA1 gene determines a second triglyceride synthetic pathway in yeast
.
J. Biol. Chem.
277
:
8877
8881
.
Oh
,
C.S.
,
D.A.
Toke
,
S.
Mandala
, and
C.E.
Martin
.
1997
.
ELO2 and ELO3, homologues of the Saccharomyces cerevisiae ELO1 gene, function in fatty acid elongation and are required for sphingolipid formation
.
J. Biol. Chem.
272
:
17376
17384
.
Okada
,
S.
,
G.
Doi
,
S.
Nakagawa
,
E.
Kusumoto
, and
T.
Ito
.
2021
.
Simple-to-use CRISPR-SpCas9/SaCas9/AsCas12a vector series for genome editing in Saccharomyces cerevisiae
.
G3
.
11
:
jkab304
.
Pan
,
X.
,
P.
Roberts
,
Y.
Chen
,
E.
Kvam
,
N.
Shulga
,
K.
Huang
,
S.
Lemmon
, and
D.S.
Goldfarb
.
2000
.
Nucleus-vacuole junctions in Saccharomyces cerevisiae are formed through the direct interaction of Vac8p with Nvj1p
.
Mol. Biol. Cell
.
11
:
2445
2457
.
Paramasivan
,
K.
, and
S.
Mutturi
.
2022
.
Recent advances in the microbial production of squalene
.
World J. Microbiol. Biotechnol.
38
:
91
.
Prokisch
,
S.
, and
S.
Büttner
.
2024
.
Partitioning into ER membrane microdomains impacts autophagic protein turnover during cellular aging
.
Sci. Rep.
14
:
13653
.
Roberts
,
P.
,
S.
Moshitch-Moshkovitz
,
E.
Kvam
,
E.
O’Toole
,
M.
Winey
, and
D.S.
Goldfarb
.
2003
.
Piecemeal microautophagy of nucleus in Saccharomyces cerevisiae
.
Mol. Biol. Cell
.
14
:
129
141
.
Rogers
,
S.
,
H.
Hariri
,
N.E.
Wood
,
N.O.
Speer
, and
W.M.
Henne
.
2021
.
Glucose restriction drives spatial reorganization of mevalonate metabolism
.
Elife
.
10
:e62591.
Sakaue
,
H.
,
T.
Shiota
,
N.
Ishizaka
,
S.
Kawano
,
Y.
Tamura
,
K.S.
Tan
,
K.
Imai
,
C.
Motono
,
T.
Hirokawa
,
K.
Taki
, et al
.
2019
.
Porin associates with Tom22 to regulate the mitochondrial protein gate assembly
.
Mol. Cell
.
73
:
1044
1055.e8
.
Seo
,
A.Y.
,
P.-W.
Lau
,
D.
Feliciano
,
P.
Sengupta
,
M.A.L.
Gros
,
B.
Cinquin
,
C.A.
Larabell
, and
J.
Lippincott-Schwartz
.
2017
.
AMPK and vacuole-associated Atg14p orchestrate μ-lipophagy for energy production and long-term survival under glucose starvation
.
Elife
.
6
:e21690.
Sever
,
N.
,
B.-L.
Song
,
D.
Yabe
,
J.L.
Goldstein
,
M.S.
Brown
, and
R.A.
DeBose-Boyd
.
2003
.
Insig-dependent ubiquitination and degradation of mammalian 3-hydroxy-3-methylglutaryl-CoA reductase stimulated by sterols and geranylgeraniol
.
J. Biol. Chem.
278
:
52479
52490
.
Sikorski
,
R.S.
, and
P.
Hieter
.
1989
.
A system of shuttle vectors and yeast host strains designed for efficient manipulation of DNA in Saccharomyces cerevisiae
.
Genetics
.
122
:
19
27
.
Tamura
,
Y.
,
S.
Kawano
, and
T.
Endo
.
2019
.
Organelle contact zones as sites for lipid transfer
.
J. Biochem.
165
:
115
123
.
Tashiro
,
S.
,
Y.
Kakimoto
,
M.
Shinmyo
,
S.
Fujimoto
, and
Y.
Tamura
.
2020
.
Improved Split-GFP systems for visualizing organelle contact sites in yeast and human cells
.
Front. Cell Dev. Biol.
8
:
571388
.
Theesfeld
,
C.L.
, and
R.Y.
Hampton
.
2013
.
Insulin-induced gene protein (INSIG)-dependent sterol regulation of Hmg2 endoplasmic reticulum-associated degradation (ERAD) in yeast
.
J. Biol. Chem.
288
:
8519
8530
.
Tosal-Castano
,
S.
,
C.
Peselj
,
V.
Kohler
,
L.
Habernig
,
L.L.
Berglund
,
M.
Ebrahimi
,
F.N.
Vögtle
,
J.
Höög
,
C.
Andréasson
, and
S.
Büttner
.
2021
.
Snd3 controls nucleus-vacuole junctions in response to glucose signaling
.
Cell Rep.
34
:
108637
.
Toulmay
,
A.
, and
W.A.
Prinz
.
2012
.
A conserved membrane-binding domain targets proteins to organelle contact sites
.
J. Cell Sci.
125
:
49
58
.
Vik
,
A.
, and
J.
Rine
.
2001
.
Upc2p and Ecm22p, dual regulators of sterol biosynthesis in Saccharomyces cerevisiae
.
Mol. Cell. Biol.
21
:
6395
6405
.
Wangeline
,
M.A.
, and
R.Y.
Hampton
.
2021
.
An autonomous, but INSIG-modulated, role for the sterol sensing domain in mallostery-regulated ERAD of yeast HMG-CoA reductase
.
J. Biol. Chem.
296
:
100063
.
Weihofen
,
A.
,
K.
Binns
,
M.K.
Lemberg
,
K.
Ashman
, and
B.
Martoglio
.
2002
.
Identification of signal peptide peptidase, a Presenilin-Type aspartic protease
.
Science
.
296
:
2215
2218
.
Wenzel
,
E.M.
,
L.A.
Elfmark
,
H.
Stenmark
, and
C.
Raiborg
.
2022
.
ER as master regulator of membrane trafficking and organelle function
.
J. Cell Biol.
221
:e202205135.
Winston
,
F.
,
C.
Dollard
, and
S.L.
Ricupero-Hovasse
.
1995
.
Construction of a set of convenient Saccharomyces cerevisiae strains that are isogenic to S288C
.
Yeast
.
11
:
53
55
.
Wood
,
N.E.
,
P.
Kositangool
,
H.
Hariri
,
A.J.
Marchand
, and
W.M.
Henne
.
2020
.
Nutrient signaling, stress response, and inter-organelle communication are non-canonical determinants of cell fate
.
Cell Rep.
33
:
108446
.
Xu
,
J.
, and
X.
Huang
.
2020
.
Lipid metabolism at membrane contacts: Dynamics and functions beyond lipid homeostasis
.
Front. Cell Dev. Biol.
8
:
615856
.
Yang
,
T.
,
P.J.
Espenshade
,
M.E.
Wright
,
D.
Yabe
,
Y.
Gong
,
R.
Aebersold
,
J.L.
Goldstein
, and
M.S.
Brown
.
2002
.
Crucial step in cholesterol homeostasis: Sterols promote binding of SCAP to INSIG-1, a membrane protein that facilitates retention of SREBPs in ER
.
Cell
.
110
:
489
500
.
Yofe
,
I.
,
U.
Weill
,
M.
Meurer
,
S.
Chuartzman
,
E.
Zalckvar
,
O.
Goldman
,
S.
Ben-Dor
,
C.
Schütze
,
N.
Wiedemann
,
M.
Knop
, et al
.
2016
.
One library to make them all: Streamlining the creation of yeast libraries via a SWAp-Tag strategy
.
Nat. Methods
13
:
371
378
.

Author notes

Disclosures: S. Fujimoto and Y. Tamura reported a patent to method for producing ergosterol derivatives or intermediates thereof, vector, and transformant pending.

This article is distributed under the terms as described at https://rupress.org/pages/terms102024/.

Data & Figures

Figure 1.
A multi-panel image of CsFiND protein biotinylation process and related experiments.Panel A: A schematic diagram shows the endoplasmic reticulum (ER) and vacuole with split-GFP and split-TurboID fusion proteins, leading to biotinylation at the NVJ. Panel B: A schematic representation of the CsFiND constructs detailing the components Dpp1, Ifa38, GFP(n), TurboID(c), TurboID(n), V5, GFP(c), and FLAG. Panel C: Confocal fluorescence microscopy images showing the localization of these proteins. The images include CsFiND (GFP), Nvj1-mCherry, and a merged view with a scale bar of 5 micrometers. Panel D: Western blot analysis of biotinylated proteins purified from membrane fractions of wild-type cells with or without the expression of CsFiND proteins or TurboID-HA, using streptavidin blotting and immunoblotting with specific antibodies.

CsFiND for identification of NVJ-localized proteins. (A) A schematic diagram illustrating how CsFiND proteins biotinylate NVJ-localized proteins. (B) Schematic representation of the CsFiND constructs used in this study. (C) Yeast cells expressing CsFiND proteins and Nvj1-mCherry were observed by confocal fluorescence microscopy. Scale Bar, 5 µm. (D) The biotinylated proteins were purified from membrane fractions isolated from WT cells with or without the expression of CsFiND proteins or TurboID-HA and subjected to streptavidin blotting and immunoblotting using the indicated antibodies. Source data are available for this figure: SourceData F1.

Figure 1.
A multi-panel image of CsFiND protein biotinylation process and related experiments.Panel A: A schematic diagram shows the endoplasmic reticulum (ER) and vacuole with split-GFP and split-TurboID fusion proteins, leading to biotinylation at the NVJ. Panel B: A schematic representation of the CsFiND constructs detailing the components Dpp1, Ifa38, GFP(n), TurboID(c), TurboID(n), V5, GFP(c), and FLAG. Panel C: Confocal fluorescence microscopy images showing the localization of these proteins. The images include CsFiND (GFP), Nvj1-mCherry, and a merged view with a scale bar of 5 micrometers. Panel D: Western blot analysis of biotinylated proteins purified from membrane fractions of wild-type cells with or without the expression of CsFiND proteins or TurboID-HA, using streptavidin blotting and immunoblotting with specific antibodies.

CsFiND for identification of NVJ-localized proteins. (A) A schematic diagram illustrating how CsFiND proteins biotinylate NVJ-localized proteins. (B) Schematic representation of the CsFiND constructs used in this study. (C) Yeast cells expressing CsFiND proteins and Nvj1-mCherry were observed by confocal fluorescence microscopy. Scale Bar, 5 µm. (D) The biotinylated proteins were purified from membrane fractions isolated from WT cells with or without the expression of CsFiND proteins or TurboID-HA and subjected to streptavidin blotting and immunoblotting using the indicated antibodies. Source data are available for this figure: SourceData F1.

Close Figure 1.
+ Expand view− Collapse view
Figure S1.
Figure S1. Refer to the image caption for details.Panel A shows a series of immunoblot image displaying protein bands at various molecular weights, indicated on the left in kilodaltons (kDa). The conditions are labeled at the top, including wild-type (WT), TurboID-HA, and CsFiND, with time points of 0, 1, 3, and 6 hours under control (mid-log) and nitrogen starvation. The proteins detected include SAv-Cy5, V5, FLAG, HA, and Tom70. Panel B presents a table summarizing protein scores from MASCOT analysis of LC-MS/MS data. The table lists proteins with their peptide numbers and scores under standard conditions (SCD) and nitrogen starvation (-N). The proteins include Faa1, Hmg2, Vac8, Nvj2, Nsg2, Hmg1, Nsg1, Nvj1, Tsc13, Mdm1, Lam6, Osh1, Ypf1, Cvm1, Nvj3, Pah1, Snd3, Vps13, and Ypt35.

Identification of NVJ-localized proteins using CsFiND. (A) WT yeast cells and yeast cells expressing CsFiND proteins or cytosolic TurboID-HA were cultured in SCD medium until logarithmic phase and then split into two halves. One is further cultivated in SCD medium containing biotin. Another half is shifted to SD-N medium containing biotin at a final concentration of 50 μM for the indicated hours. Total cell lysates were analyzed by streptavidin blotting or immunoblotting using the indicated antibodies. (B) Summary table showing protein scores obtained from MASCOT analysis of LC-MS/MS data for known NVJ proteins, as well as Ypf1, Nsg1, and Nsg2. Source data are available for this figure: SourceData FS1.

Figure S1.
A multi-panel image shows protein identification and biotinylation in yeast cells.Panel A shows a series of immunoblot image displaying protein bands at various molecular weights, indicated on the left in kilodaltons (kDa). The conditions are labeled at the top, including wild-type (WT), TurboID-HA, and CsFiND, with time points of 0, 1, 3, and 6 hours under control (mid-log) and nitrogen starvation. The proteins detected include SAv-Cy5, V5, FLAG, HA, and Tom70. Panel B presents a table summarizing protein scores from MASCOT analysis of LC-MS/MS data. The table lists proteins with their peptide numbers and scores under standard conditions (SCD) and nitrogen starvation (-N). The proteins include Faa1, Hmg2, Vac8, Nvj2, Nsg2, Hmg1, Nsg1, Nvj1, Tsc13, Mdm1, Lam6, Osh1, Ypf1, Cvm1, Nvj3, Pah1, Snd3, Vps13, and Ypt35.

Identification of NVJ-localized proteins using CsFiND. (A) WT yeast cells and yeast cells expressing CsFiND proteins or cytosolic TurboID-HA were cultured in SCD medium until logarithmic phase and then split into two halves. One is further cultivated in SCD medium containing biotin. Another half is shifted to SD-N medium containing biotin at a final concentration of 50 μM for the indicated hours. Total cell lysates were analyzed by streptavidin blotting or immunoblotting using the indicated antibodies. (B) Summary table showing protein scores obtained from MASCOT analysis of LC-MS/MS data for known NVJ proteins, as well as Ypf1, Nsg1, and Nsg2. Source data are available for this figure: SourceData FS1.

Close Figure S1.
Figure 2.
A multi-panel image shows microscopy, graphs, and immunoblotting analysis of yeast cells under different conditions.Panel A shows fluorescence images revealing NVJ accumulation during glucose starvation conditions. Panel B shows fluorescence images comparing protein localization in wild-type and nvj1 cells. Panel C shows fluorescence images of Nvj1-GFP localization across multiple mutant strains. Panel D shows immunoblots comparing protein accumulation between wild-type and nvj1 mutant cells. Panel E shows immunoblots and graph tracking protein accumulation during glucose starvation periods. Panel F shows immunoblots analyzing Ypf1 glycosylation changes under glucose starvation conditions. Panel G shows immunoblots examining glycosylation-site mutant effects on Ypf1 modification patterns. Panel H shows immunoblots comparing protein abundance across multiple mutant yeast strains.

Ypf1, Nsg1, and Nsg2 accumulate at the NVJ under glucose-starved conditions. (A) Yeast cells co-expressing Ypf1-GFP/Nvj1-mCherry, mCherry-Nsg1/Nvj1-GFP, or GFP-Nsg2/Nvj1-mCherry were observed by confocal microscopy under the indicated culture conditions. Log, NS, and GS refer to cells grown in logarithmic phase in YPD or subjected to nitrogen or GS for 24 h, respectively. (B) WT and nvj1Δ cells expressing Ypf1-GFP, mCherry-Nsg1, or GFP-Nsg2 were imaged by confocal fluorescence microscopy after a 24-h incubation in GS medium. (C) The indicated yeast cells expressing Nvj1-GFP were observed by confocal fluorescence microscopy after a 24-h incubation in GS medium. (D) Total cell lysates from WT and nvj1Δ cells after a 24-h incubation in GS medium were analyzed by immunoblotting using the indicated antibodies. (E) Total cell lysates were prepared from WT cells grown in GS medium for the indicated periods of time and analyzed by immunoblotting. Line graph shows protein levels relative to those in cells without GS treatment. Values are means ± SE (n = 3). (F and G) Glycosylation patterns of Ypf1-FLAG and its mutants were analyzed by immunoblotting using whole-cell lysates prepared from cells with or without a 2-day GS treatment. (H) Total cell lysates from the cells shown in C were analyzed by immunoblotting. All images shown in A–C are single focal plane. Scale bar, 5 μm. Asterisks indicate nonspecific bands. Source data are available for this figure: SourceData F2.

Figure 2.
A multi-panel image shows microscopy, graphs, and immunoblotting analysis of yeast cells under different conditions.Panel A shows fluorescence images revealing NVJ accumulation during glucose starvation conditions. Panel B shows fluorescence images comparing protein localization in wild-type and nvj1 cells. Panel C shows fluorescence images of Nvj1-GFP localization across multiple mutant strains. Panel D shows immunoblots comparing protein accumulation between wild-type and nvj1 mutant cells. Panel E shows immunoblots and graph tracking protein accumulation during glucose starvation periods. Panel F shows immunoblots analyzing Ypf1 glycosylation changes under glucose starvation conditions. Panel G shows immunoblots examining glycosylation-site mutant effects on Ypf1 modification patterns. Panel H shows immunoblots comparing protein abundance across multiple mutant yeast strains.

Ypf1, Nsg1, and Nsg2 accumulate at the NVJ under glucose-starved conditions. (A) Yeast cells co-expressing Ypf1-GFP/Nvj1-mCherry, mCherry-Nsg1/Nvj1-GFP, or GFP-Nsg2/Nvj1-mCherry were observed by confocal microscopy under the indicated culture conditions. Log, NS, and GS refer to cells grown in logarithmic phase in YPD or subjected to nitrogen or GS for 24 h, respectively. (B) WT and nvj1Δ cells expressing Ypf1-GFP, mCherry-Nsg1, or GFP-Nsg2 were imaged by confocal fluorescence microscopy after a 24-h incubation in GS medium. (C) The indicated yeast cells expressing Nvj1-GFP were observed by confocal fluorescence microscopy after a 24-h incubation in GS medium. (D) Total cell lysates from WT and nvj1Δ cells after a 24-h incubation in GS medium were analyzed by immunoblotting using the indicated antibodies. (E) Total cell lysates were prepared from WT cells grown in GS medium for the indicated periods of time and analyzed by immunoblotting. Line graph shows protein levels relative to those in cells without GS treatment. Values are means ± SE (n = 3). (F and G) Glycosylation patterns of Ypf1-FLAG and its mutants were analyzed by immunoblotting using whole-cell lysates prepared from cells with or without a 2-day GS treatment. (H) Total cell lysates from the cells shown in C were analyzed by immunoblotting. All images shown in A–C are single focal plane. Scale bar, 5 μm. Asterisks indicate nonspecific bands. Source data are available for this figure: SourceData F2.

Close Figure 2.
+ Expand view− Collapse view
Figure S2.
Figure S2. Refer to the image caption for details.Panel A: This panel shows immunoblot results. The first blot uses Phos-tag to detect phosphorylated Nvj1, with and without phosphatase treatment and glucose starvation (GS) for 2 days. The second blot detects Nsg2, the third detects Ypf1, and the fourth uses Tim23 as a loading control. Panel B: This panel shows multiple immunoblots. The first blot detects FLAG-tagged Ypf1, the second detects HA-tagged Nsg2, the third and fourth detect V5-tagged Hmg1 and Hmg2, respectively. The fifth blot uses Tim23 as a loading control, and the sixth uses Vac8. Samples are treated with or without GS for 2 days and with or without Endo H digestion. Panel C: This panel contains three bar graphs quantifying protein levels of Ypf1, Nsg1, and Nsg2 in wild-type (WT) and nvj1delta cells. The y-axes represent protein levels in arbitrary units (A.U.), and the x-axes compare WT and nvj1 delta. Panel D: This panel contains four bar graphs quantifying protein levels of Nvj1-GFP, Ypf1, Nsg1, and Nsg2 in various yeast strains (WT, ypf1 delta, nsg1 delta, nsg2 delta, nsg1delta nsg2 delta). The y-axes represent protein levels in A.U., and the x-axes compare different strains.

Nvj1 and Nsg2 are phosphorated in a GS-dependent manner. (A) Membrane fractions isolated from yeast cells with or without 2 days of GS treatment were treated with λ protein phosphatase. The samples were analyzed by Phos-tag or SDS-PAGE followed by immunoblotting. (B) Membrane fractions isolated from the indicated yeast cells cultured with or without 2 days of GS and those marked as Endo H+ were subjected to Endo H digestion before immunoblot analysis. (C and D) Bar graphs show quantification of protein levels from the immunoblots in Fig. 2, D and H, respectively. Source data are available for this figure: SourceData FS2.

Figure S2.
A multi-panel image showing protein levels and phosphorylation in yeast cells.Panel A: This panel shows immunoblot results. The first blot uses Phos-tag to detect phosphorylated Nvj1, with and without phosphatase treatment and glucose starvation (GS) for 2 days. The second blot detects Nsg2, the third detects Ypf1, and the fourth uses Tim23 as a loading control. Panel B: This panel shows multiple immunoblots. The first blot detects FLAG-tagged Ypf1, the second detects HA-tagged Nsg2, the third and fourth detect V5-tagged Hmg1 and Hmg2, respectively. The fifth blot uses Tim23 as a loading control, and the sixth uses Vac8. Samples are treated with or without GS for 2 days and with or without Endo H digestion. Panel C: This panel contains three bar graphs quantifying protein levels of Ypf1, Nsg1, and Nsg2 in wild-type (WT) and nvj1delta cells. The y-axes represent protein levels in arbitrary units (A.U.), and the x-axes compare WT and nvj1 delta. Panel D: This panel contains four bar graphs quantifying protein levels of Nvj1-GFP, Ypf1, Nsg1, and Nsg2 in various yeast strains (WT, ypf1 delta, nsg1 delta, nsg2 delta, nsg1delta nsg2 delta). The y-axes represent protein levels in A.U., and the x-axes compare different strains.

Nvj1 and Nsg2 are phosphorated in a GS-dependent manner. (A) Membrane fractions isolated from yeast cells with or without 2 days of GS treatment were treated with λ protein phosphatase. The samples were analyzed by Phos-tag or SDS-PAGE followed by immunoblotting. (B) Membrane fractions isolated from the indicated yeast cells cultured with or without 2 days of GS and those marked as Endo H+ were subjected to Endo H digestion before immunoblot analysis. (C and D) Bar graphs show quantification of protein levels from the immunoblots in Fig. 2, D and H, respectively. Source data are available for this figure: SourceData FS2.

Close Figure S2.
Figure 3.
A multi-panel image of yeast cells expressing various proteins after glucose starvation.Panel A shows confocal fluorescence microscopy images comparing NVJ protein localization in wild-type and ypf1 cells. Panel B shows confocal fluorescence microscopy images comparing Ypf1-GFP and Hmg1-GFP localization in mutant cells. Panel C shows confocal fluorescence microscopy images analyzing catalytically inactive Ypf1 mutant localization patterns. Panel D shows immunoblots comparing protein accumulation under control and glucose-starved conditions. Panel E shows schematic diagram illustrating Ypf1 transmembrane domains, glycosylation, and glutamic acid residues. Panel F shows confocal fluorescence microscopy images comparing localization of Ypf1 truncation mutants during glucose starvation. Panel G shows confocal fluorescence microscopy images examining localization of mutant Nvj1 proteins with Ypf1-GFP. Panel H shows confocal fluorescence microscopy images analyzing Ypf1 and Nvj1 mutant colocalization patterns. Panel I shows schematic model illustrating NVJ remodeling under glucose-starved cellular conditions. Panel J shows confocal fluorescence microscopy images comparing Ypf1-GFP and Hmg1-GFP localization in regulatory mutants. Panel K shows immunoblots analyzing protein accumulation in mutant cells during glucose starvation. Panel L shows confocal fluorescence microscopy images comparing Nvj1-GFP localization between wild-type and snf1 mutant cells.

GS-dependent NVJ partitioning depends on Ypf1 and Snf1. (A) WT and ypf1Δ cells expressing the indicated NVJ proteins fused to GFP or mCherry were observed by confocal fluorescence microscopy after a 24-h GS treatment. (B) WT and nsg1Δnsg2Δ cells expressing Ypf1-GFP or Hmg1-GFP were imaged by confocal fluorescence microscopy after a 24-h GS treatment. (C) A CEN plasmid encoding catalytically inactive Ypf1-D366A/D411A-GFP or -mCherry was introduced into ypf1Δ cells expressing mCherry-Nsg1, GFP-Nsg2, Hmg1-GFP, or Hmg2-GFP, and cells were analyzed by confocal fluorescence microscopy after 1 day of GS. (D) Immunoblotting of whole-cell extracts prepared from WT and ypf1Δ cells grown with or without a 24-h GS treatment. (E) A schematic diagram of Ypf1 showing its transmembrane domains (black boxes). Red lines indicate asparagine residues that undergo N-glycosylation, and blue lines indicate glutamic acid residues. (F–H) Yeast cells expressing C-terminally GFP or mCherry-fused Ypf1 and Nvj1 mutants were imaged by confocal fluorescence microscopy after 1 day of GS. (I) Schematic model of the NVJ remodeling under GS. Color differences in the nuclear ER (nER) indicate predicted changes in membrane properties. (J) The indicated cells expressing the Ypf1-GFP or Hmg1-GFP were imaged by confocal fluorescence microscopy after a 24-h GS treatment. All images shown in AC, FH, and J are single focal plane. Scale bar, 5 μm. (K) Immunoblotting of whole-cell extracts prepared from the indicated cells grown with or without a 24-h GS treatment. (L) WT and snf1Δ cells expressing Nvj1-GFP were observed by confocal fluorescence microscopy after a 24-h GS treatment. Maximum projection images reconstituted from z-stacks are shown. Scale bars, 5 µm. Asterisks indicate nonspecific bands. Source data are available for this figure: SourceData F3.

Figure 3.
A multi-panel image of yeast cells expressing various proteins after glucose starvation.Panel A shows confocal fluorescence microscopy images comparing NVJ protein localization in wild-type and ypf1 cells. Panel B shows confocal fluorescence microscopy images comparing Ypf1-GFP and Hmg1-GFP localization in mutant cells. Panel C shows confocal fluorescence microscopy images analyzing catalytically inactive Ypf1 mutant localization patterns. Panel D shows immunoblots comparing protein accumulation under control and glucose-starved conditions. Panel E shows schematic diagram illustrating Ypf1 transmembrane domains, glycosylation, and glutamic acid residues. Panel F shows confocal fluorescence microscopy images comparing localization of Ypf1 truncation mutants during glucose starvation. Panel G shows confocal fluorescence microscopy images examining localization of mutant Nvj1 proteins with Ypf1-GFP. Panel H shows confocal fluorescence microscopy images analyzing Ypf1 and Nvj1 mutant colocalization patterns. Panel I shows schematic model illustrating NVJ remodeling under glucose-starved cellular conditions. Panel J shows confocal fluorescence microscopy images comparing Ypf1-GFP and Hmg1-GFP localization in regulatory mutants. Panel K shows immunoblots analyzing protein accumulation in mutant cells during glucose starvation. Panel L shows confocal fluorescence microscopy images comparing Nvj1-GFP localization between wild-type and snf1 mutant cells.

GS-dependent NVJ partitioning depends on Ypf1 and Snf1. (A) WT and ypf1Δ cells expressing the indicated NVJ proteins fused to GFP or mCherry were observed by confocal fluorescence microscopy after a 24-h GS treatment. (B) WT and nsg1Δnsg2Δ cells expressing Ypf1-GFP or Hmg1-GFP were imaged by confocal fluorescence microscopy after a 24-h GS treatment. (C) A CEN plasmid encoding catalytically inactive Ypf1-D366A/D411A-GFP or -mCherry was introduced into ypf1Δ cells expressing mCherry-Nsg1, GFP-Nsg2, Hmg1-GFP, or Hmg2-GFP, and cells were analyzed by confocal fluorescence microscopy after 1 day of GS. (D) Immunoblotting of whole-cell extracts prepared from WT and ypf1Δ cells grown with or without a 24-h GS treatment. (E) A schematic diagram of Ypf1 showing its transmembrane domains (black boxes). Red lines indicate asparagine residues that undergo N-glycosylation, and blue lines indicate glutamic acid residues. (F–H) Yeast cells expressing C-terminally GFP or mCherry-fused Ypf1 and Nvj1 mutants were imaged by confocal fluorescence microscopy after 1 day of GS. (I) Schematic model of the NVJ remodeling under GS. Color differences in the nuclear ER (nER) indicate predicted changes in membrane properties. (J) The indicated cells expressing the Ypf1-GFP or Hmg1-GFP were imaged by confocal fluorescence microscopy after a 24-h GS treatment. All images shown in AC, FH, and J are single focal plane. Scale bar, 5 μm. (K) Immunoblotting of whole-cell extracts prepared from the indicated cells grown with or without a 24-h GS treatment. (L) WT and snf1Δ cells expressing Nvj1-GFP were observed by confocal fluorescence microscopy after a 24-h GS treatment. Maximum projection images reconstituted from z-stacks are shown. Scale bars, 5 µm. Asterisks indicate nonspecific bands. Source data are available for this figure: SourceData F3.

Close Figure 3.
+ Expand view− Collapse view
Figure S3.
Figure S3. Refer to the image caption for details.Panel A: A set of microscopy images showing the localization of various GFP-tagged proteins in wild-type (WT) and ypf1 delta yeast cells. The images are arranged in pairs, with WT on the left and ypf1 delta on the right. Each row represents a different protein, including Nvj1-GFP, Nvj2-GFP, Vac8-GFP, Osh1-GFP, Tsc13-GFP, mCh-Nsg1, GFP-Nsg2, Hmg1-GFP, and Hmg2-GFP. The scale bar is 20 micrometers. Panel B: Confocal fluorescence microscopy images of ypf1 cells expressing either Ypf1-GFP or Ypf1-3NQ-GFP after 2 days of GS treatment. The images show GFP and merged channels. The scale bar is 5 micrometers. Panel C: Confocal fluorescence microscopy images of wild-type and ypf1 cells expressing Hmg1-GFP and harboring either an empty vector, Ypf1-FLAG, or Ypf1-3NQ-FLAG-expressing plasmid after 2 days of GS treatment. The images show DIC and GFP channels, with an enhanced view of the GFP channel. The scale bar is 5 micrometers. Panel D: An immunoblotting analysis of total cell lysates from the indicated strains after 1 day of GS treatment. The blot shows bands corresponding to GFP, Nvj1, Ypf1, Nsg1, Nsg2, and Tim23 proteins.

The glycosylation of Ypf1 is not required for GS-dependent remodeling of the NVJ. (A) Uncropped microscopy images corresponding to those shown in Fig. 3 A. Maximum projection images reconstituted from z-stacks are shown. Scale bar, 20 μm. (B)ypf1Δ cells harboring a CEN plasmid expressing either Ypf1-GFP or the glycosylation-deficient mutant Ypf1-3NQ-GFP were observed by confocal fluorescence microscopy after 2 days of GS. (C) WT and ypf1Δ cells expressing Hmg1-GFP and harboring either an empty vector (−), Ypf1-FLAG, or Ypf1-3NQ-FLAG-expressing plasmid were observed by confocal fluorescence microscopy after 2 days of GS. (D) Total cell lysates from the indicated strains after 1 day of GS were analyzed by immunoblotting. All images in B and C are single focal plane. Scale bar, 5 μm. Source data are available for this figure: SourceData FS3.

Figure S3.
A multi-panel image shows microscopy images and immunoblotting analysis of yeast cells.Panel A: A set of microscopy images showing the localization of various GFP-tagged proteins in wild-type (WT) and ypf1 delta yeast cells. The images are arranged in pairs, with WT on the left and ypf1 delta on the right. Each row represents a different protein, including Nvj1-GFP, Nvj2-GFP, Vac8-GFP, Osh1-GFP, Tsc13-GFP, mCh-Nsg1, GFP-Nsg2, Hmg1-GFP, and Hmg2-GFP. The scale bar is 20 micrometers. Panel B: Confocal fluorescence microscopy images of ypf1 cells expressing either Ypf1-GFP or Ypf1-3NQ-GFP after 2 days of GS treatment. The images show GFP and merged channels. The scale bar is 5 micrometers. Panel C: Confocal fluorescence microscopy images of wild-type and ypf1 cells expressing Hmg1-GFP and harboring either an empty vector, Ypf1-FLAG, or Ypf1-3NQ-FLAG-expressing plasmid after 2 days of GS treatment. The images show DIC and GFP channels, with an enhanced view of the GFP channel. The scale bar is 5 micrometers. Panel D: An immunoblotting analysis of total cell lysates from the indicated strains after 1 day of GS treatment. The blot shows bands corresponding to GFP, Nvj1, Ypf1, Nsg1, Nsg2, and Tim23 proteins.

The glycosylation of Ypf1 is not required for GS-dependent remodeling of the NVJ. (A) Uncropped microscopy images corresponding to those shown in Fig. 3 A. Maximum projection images reconstituted from z-stacks are shown. Scale bar, 20 μm. (B)ypf1Δ cells harboring a CEN plasmid expressing either Ypf1-GFP or the glycosylation-deficient mutant Ypf1-3NQ-GFP were observed by confocal fluorescence microscopy after 2 days of GS. (C) WT and ypf1Δ cells expressing Hmg1-GFP and harboring either an empty vector (−), Ypf1-FLAG, or Ypf1-3NQ-FLAG-expressing plasmid were observed by confocal fluorescence microscopy after 2 days of GS. (D) Total cell lysates from the indicated strains after 1 day of GS were analyzed by immunoblotting. All images in B and C are single focal plane. Scale bar, 5 μm. Source data are available for this figure: SourceData FS3.

Close Figure S3.
+ Expand view− Collapse view
Figure S4.
Figure S4. Refer to the image caption for details.Panel A: Two sets of immunoblots show Ypf1 protein levels in various yeast knockout strains during logarithmic growth and after 1 day of glucose starvation (GS). The strains are listed horizontally, and Ypf1 levels are indicated vertically. Panel B: Immunoblots display protein levels in cells with an empty vector or a multi-copy plasmid encoding ELO3 after GS treatment for different time periods. Line graphs below show relative protein levels normalized to WT cells at 24 hours. Panel C: Confocal fluorescence microscopy images show yeast cells expressing Ypf1-GFP and Nvj1-mCherry with either an empty vector or a 2μ plasmid encoding ELO3 after 1 day of GS. A bar graph quantifies the percentage of cells with Ypf1-GFP localized to the NVJ marked by Nvj1-mCherry.

Deletion of ELO3 promotes GS-dependent glycosylation of Ypf1. (A) Glycosylation patterns of Ypf1 were analyzed by immunoblotting using total cell lysates prepared from the knockout strains listed in Table S5. Lysates were obtained from cells harvested either during logarithmic growth (Log) or after 1 day of GS. (B) Immunoblotting of whole-cell extracts prepared from cells carrying either an empty vector or a multi-copy plasmid encoding the ELO3 gene, following GS treatment for the indicated time periods. Line graphs show relative protein levels normalized to the protein abundance of the indicated protein in WT cells at 24 h, which was defined as 100%. For Ypf1, values indicate the proportion of the doubly glycosylated form. Data are means ± SEM (n = 5). Asterisks indicate nonspecific bands. (C) Yeast cells expressing Ypf1-GFP and Nvj1-mCherry and carrying either an empty vector or a 2 µm plasmid encoding ELO3 were observed by confocal fluorescence microscopy after 1 day of GS treatment. Bar graph shows the percentage of cells with Ypf1-GFP localized to the NVJ marked by Nvj1-mCherry. Values are means ± SE (n = 3). At least 30 cells were analyzed per biological replicate. ns: not significant, **P < 0.01. P values were obtained using the unpaired two-tailed t test. Source data are available for this figure: SourceData FS4.

Figure S4.
A multi-panel image analyzes Ypf1 glycosylation and localization in yeast cells.Panel A: Two sets of immunoblots show Ypf1 protein levels in various yeast knockout strains during logarithmic growth and after 1 day of glucose starvation (GS). The strains are listed horizontally, and Ypf1 levels are indicated vertically. Panel B: Immunoblots display protein levels in cells with an empty vector or a multi-copy plasmid encoding ELO3 after GS treatment for different time periods. Line graphs below show relative protein levels normalized to WT cells at 24 hours. Panel C: Confocal fluorescence microscopy images show yeast cells expressing Ypf1-GFP and Nvj1-mCherry with either an empty vector or a 2μ plasmid encoding ELO3 after 1 day of GS. A bar graph quantifies the percentage of cells with Ypf1-GFP localized to the NVJ marked by Nvj1-mCherry.

Deletion of ELO3 promotes GS-dependent glycosylation of Ypf1. (A) Glycosylation patterns of Ypf1 were analyzed by immunoblotting using total cell lysates prepared from the knockout strains listed in Table S5. Lysates were obtained from cells harvested either during logarithmic growth (Log) or after 1 day of GS. (B) Immunoblotting of whole-cell extracts prepared from cells carrying either an empty vector or a multi-copy plasmid encoding the ELO3 gene, following GS treatment for the indicated time periods. Line graphs show relative protein levels normalized to the protein abundance of the indicated protein in WT cells at 24 h, which was defined as 100%. For Ypf1, values indicate the proportion of the doubly glycosylated form. Data are means ± SEM (n = 5). Asterisks indicate nonspecific bands. (C) Yeast cells expressing Ypf1-GFP and Nvj1-mCherry and carrying either an empty vector or a 2 µm plasmid encoding ELO3 were observed by confocal fluorescence microscopy after 1 day of GS treatment. Bar graph shows the percentage of cells with Ypf1-GFP localized to the NVJ marked by Nvj1-mCherry. Values are means ± SE (n = 3). At least 30 cells were analyzed per biological replicate. ns: not significant, **P < 0.01. P values were obtained using the unpaired two-tailed t test. Source data are available for this figure: SourceData FS4.

Close Figure S4.
Figure 4.
A multi-panel image depicts protein levels and localization during glucose starvation.Panel A shows immunoblots and line graphs comparing glucose starvation-dependent protein accumulation in wild-type and elo3 mutant cells. Panel B shows confocal fluorescence microscopy images, bar graphs, and box plots analyzing Ypf1-GFP NVJ partitioning dynamics. Panel C shows immunoblots examining protein accumulation changes following cycloheximide treatment during prolonged glucose starvation conditions. Panel D shows immunoblots and line graphs comparing glucose starvation-dependent protein accumulation in wild-type and elo2 cells. Panel E shows immunoblots and line graphs analyzing Elo2-FLAG and Elo3-FLAG protein abundance changes during starvation.

Fatty acid biogenesis is involved in NVJ remodeling. (A) Immunoblotting of WT and elo3Δ cell extracts after GS treatments for the indicated durations. Line graphs show relative protein levels normalized to the protein abundance of the indicated protein in WT cells at 24 h, which was defined as 100%. For Ypf1, values indicate the proportion of the doubly glycosylated form. Data are means ± SEM (n = 3). (B) The progression of Ypf1-GFP NVJ partitioning was assessed in cells expressing Vph1-mCherry after GS treatment for the indicated time periods. Single focal plane images obtained by confocal fluorescence microscopy are shown. Bar graph shows the percentage of cells displaying NVJ-localized Ypf1-GFP. Values are means ± SE (n = 3). Box-and-whisker plots show the fluorescence intensity and area of Ypf1-GFP localized at the NVJ. The boxes indicate the median and interquartile range, and the whiskers extend to 1.5 times the interquartile range (Tukey method). A total of 25 cells pooled from three independent experiments were analyzed. ns: not significant, ∗∗∗: P < 0.001 ∗∗∗∗: P < 0.0001. P values were obtained using the Mann–Whitney U test. (C) Immunoblotting was performed using whole-cell extracts prepared from cells shifted to glucose-starvation medium containing either DMSO or 100 µg/ml cycloheximide and incubated for the indicated times. (D) Immunoblotting of WT and elo2Δ cell extracts after GS treatments for the indicated durations. Line graphs were generated as in A. (E) Immunoblotting of whole-cell extracts prepared from WT or elo2Δ cells expressing Elo3-FLAG and from WT or elo3Δ cells expressing Elo2-FLAG after GS treatments for the indicated durations. Line graphs show relative protein levels normalized to the abundance of Elo2-FLAG or Elo3-FLAG in WT cells before GS, which was defined as 100%. Data are means ± SEM (n = 3). Asterisks indicate nonspecific bands. Source data are available for this figure: SourceData F4.

Figure 4.
A multi-panel image depicts protein levels and localization during glucose starvation.Panel A shows immunoblots and line graphs comparing glucose starvation-dependent protein accumulation in wild-type and elo3 mutant cells. Panel B shows confocal fluorescence microscopy images, bar graphs, and box plots analyzing Ypf1-GFP NVJ partitioning dynamics. Panel C shows immunoblots examining protein accumulation changes following cycloheximide treatment during prolonged glucose starvation conditions. Panel D shows immunoblots and line graphs comparing glucose starvation-dependent protein accumulation in wild-type and elo2 cells. Panel E shows immunoblots and line graphs analyzing Elo2-FLAG and Elo3-FLAG protein abundance changes during starvation.

Fatty acid biogenesis is involved in NVJ remodeling. (A) Immunoblotting of WT and elo3Δ cell extracts after GS treatments for the indicated durations. Line graphs show relative protein levels normalized to the protein abundance of the indicated protein in WT cells at 24 h, which was defined as 100%. For Ypf1, values indicate the proportion of the doubly glycosylated form. Data are means ± SEM (n = 3). (B) The progression of Ypf1-GFP NVJ partitioning was assessed in cells expressing Vph1-mCherry after GS treatment for the indicated time periods. Single focal plane images obtained by confocal fluorescence microscopy are shown. Bar graph shows the percentage of cells displaying NVJ-localized Ypf1-GFP. Values are means ± SE (n = 3). Box-and-whisker plots show the fluorescence intensity and area of Ypf1-GFP localized at the NVJ. The boxes indicate the median and interquartile range, and the whiskers extend to 1.5 times the interquartile range (Tukey method). A total of 25 cells pooled from three independent experiments were analyzed. ns: not significant, ∗∗∗: P < 0.001 ∗∗∗∗: P < 0.0001. P values were obtained using the Mann–Whitney U test. (C) Immunoblotting was performed using whole-cell extracts prepared from cells shifted to glucose-starvation medium containing either DMSO or 100 µg/ml cycloheximide and incubated for the indicated times. (D) Immunoblotting of WT and elo2Δ cell extracts after GS treatments for the indicated durations. Line graphs were generated as in A. (E) Immunoblotting of whole-cell extracts prepared from WT or elo2Δ cells expressing Elo3-FLAG and from WT or elo3Δ cells expressing Elo2-FLAG after GS treatments for the indicated durations. Line graphs show relative protein levels normalized to the abundance of Elo2-FLAG or Elo3-FLAG in WT cells before GS, which was defined as 100%. Data are means ± SEM (n = 3). Asterisks indicate nonspecific bands. Source data are available for this figure: SourceData F4.

Close Figure 4.
Figure 5.
A multi-panel image showing lipid droplet accumulation in yeast cells under different conditions.Panel A: A series of microscopy images showing yeast cells under different genetic conditions and treatments. The images include differential interference contrast (DIC) and fluorescence microscopy images stained with LipiBlue to visualize lipid droplets (LDs). The cells express either Hmg1-GFP or Hmg2-GFP and are observed under glucose-rich (Log) and glucose-starved (GS) conditions. Panel B: A bar graph displaying that the y-axis represents the percentage of cells, and the x-axis lists different yeast strains. Panel C: A box plot showing the percentage of LD area relative to total cell area. The y-axis represents the percentage of LD area, and the x-axis lists different yeast strains. Panel D: Immunoblot images of whole-cell lysates from various yeast strains, with or without a 1-day glucose starvation treatment, analyzed for the presence of Hmg1-GFP, Hmg2-GFP, Nsg1, Nsg2, Ypf1, and Tim23. Panel E shows confocal fluorescence microscopy images of LipiBlue-stained nsg1 deletion nsg2 deletion hmg2 deletion cells expressing empty vector or Nsg2 after glucose starvation.

LDs accumulate in an Hmg1-dependent manner in nsg1Δnsg2Δ cells. (A) LDs in the indicated cells after a 1-day GS treatment were visualized using the LD-staining dye LipiBlue and imaged by confocal fluorescence microscopy. The indicated yeast cells expressing Hmg1-GFP or Hmg2-GFP were observed by confocal fluorescence microscopy under glucose-rich (Log) and glucose-starved (GS) conditions. Yeast cells with strongly and weakly stained LDs were outlined with solid and dotted lines, respectively. LDs are shown as maximum intensity projection images. Fluorescence images of Hmg1-GFP and Hmg2-GFP represent a single optical section. Scale bars, 5 µm. (B) Bar graph shows the populations of cells with weak and strong LD fluorescence intensity based on maximum projection images acquired in A. Values are means ± SE (n = 4). At least 100 cells were analyzed per biological replicate. (C) Box-and-whisker plot shows the percentage of LD area relative to total cell area (n = 40 cells pooled from three independent experiments, N = 3). The boxes indicate the median and interquartile range, and the whiskers extend to 1.5 times the interquartile range (Tukey method). ns: not significant, *P < 0.05, ***P < 0.001, and ****P < 0.0001. P values were obtained using the Mann–Whitney U test. (D) Whole-cell lysates prepared from the indicated yeast cells, with or without a 1-day GS treatment, were analyzed by immunoblotting. HmgX denotes either Hmg1 or Hmg2. Asterisks indicate nonspecific bands. (E) LDs in nsg1Δnsg2Δhmg2Δ cells carrying either an empty vector or a CEN-plasmid expressing Nsg2 were stained with LipiBlue and visualized by confocal fluorescence microscopy after a 1-day GS treatment. Yeast cells showing weak LD staining were outlined with dotted lines. LDs are shown as maximum intensity projection images. Scale bars, 5 µm. Source data are available for this figure: SourceData F5.

Figure 5.
A multi-panel image showing lipid droplet accumulation in yeast cells under different conditions.Panel A: A series of microscopy images showing yeast cells under different genetic conditions and treatments. The images include differential interference contrast (DIC) and fluorescence microscopy images stained with LipiBlue to visualize lipid droplets (LDs). The cells express either Hmg1-GFP or Hmg2-GFP and are observed under glucose-rich (Log) and glucose-starved (GS) conditions. Panel B: A bar graph displaying that the y-axis represents the percentage of cells, and the x-axis lists different yeast strains. Panel C: A box plot showing the percentage of LD area relative to total cell area. The y-axis represents the percentage of LD area, and the x-axis lists different yeast strains. Panel D: Immunoblot images of whole-cell lysates from various yeast strains, with or without a 1-day glucose starvation treatment, analyzed for the presence of Hmg1-GFP, Hmg2-GFP, Nsg1, Nsg2, Ypf1, and Tim23. Panel E shows confocal fluorescence microscopy images of LipiBlue-stained nsg1 deletion nsg2 deletion hmg2 deletion cells expressing empty vector or Nsg2 after glucose starvation.

LDs accumulate in an Hmg1-dependent manner in nsg1Δnsg2Δ cells. (A) LDs in the indicated cells after a 1-day GS treatment were visualized using the LD-staining dye LipiBlue and imaged by confocal fluorescence microscopy. The indicated yeast cells expressing Hmg1-GFP or Hmg2-GFP were observed by confocal fluorescence microscopy under glucose-rich (Log) and glucose-starved (GS) conditions. Yeast cells with strongly and weakly stained LDs were outlined with solid and dotted lines, respectively. LDs are shown as maximum intensity projection images. Fluorescence images of Hmg1-GFP and Hmg2-GFP represent a single optical section. Scale bars, 5 µm. (B) Bar graph shows the populations of cells with weak and strong LD fluorescence intensity based on maximum projection images acquired in A. Values are means ± SE (n = 4). At least 100 cells were analyzed per biological replicate. (C) Box-and-whisker plot shows the percentage of LD area relative to total cell area (n = 40 cells pooled from three independent experiments, N = 3). The boxes indicate the median and interquartile range, and the whiskers extend to 1.5 times the interquartile range (Tukey method). ns: not significant, *P < 0.05, ***P < 0.001, and ****P < 0.0001. P values were obtained using the Mann–Whitney U test. (D) Whole-cell lysates prepared from the indicated yeast cells, with or without a 1-day GS treatment, were analyzed by immunoblotting. HmgX denotes either Hmg1 or Hmg2. Asterisks indicate nonspecific bands. (E) LDs in nsg1Δnsg2Δhmg2Δ cells carrying either an empty vector or a CEN-plasmid expressing Nsg2 were stained with LipiBlue and visualized by confocal fluorescence microscopy after a 1-day GS treatment. Yeast cells showing weak LD staining were outlined with dotted lines. LDs are shown as maximum intensity projection images. Scale bars, 5 µm. Source data are available for this figure: SourceData F5.

Close Figure 5.
+ Expand view − Collapse view
Figure S5.
Figure S5. Refer to the image caption for details. The top row shows fluorescence microscopy images of Erg6-GFP, while the bottom row shows differential interference contrast (DIC) microscopy images. Each column represents a different yeast strain: wild-type (WT), nsg1 deletion, nsg2 deletion, nsg1 deletion nsg2 deletion, hmg1 deletion nsg1 deletion nsg2 deletion, hmg2 deletion nsg1 deletion nsg2 deletion, and atg1 deletion. The fluorescence images reveal the presence and distribution of Erg6-GFP, indicating lipid droplet accumulation. The DIC images provide a clear view of the cellular structure and the presence of lipid droplets within the cells. The scale bar in the DIC images represents 5 micrometers.

LDs accumulate in the absence of Nsg1 and Nsg2. WT and the indicated cells expressing Erg6-GFP were observed by confocal fluorescence microscopy after 4 days of GS. Maximum projection images reconstituted from z-stack are shown. Scale bars, 5 μm.

Figure S5.
An image showing Erg6-GFP fluorescence and DIC microscopy of various yeast strains. The top row shows fluorescence microscopy images of Erg6-GFP, while the bottom row shows differential interference contrast (DIC) microscopy images. Each column represents a different yeast strain: wild-type (WT), nsg1 deletion, nsg2 deletion, nsg1 deletion nsg2 deletion, hmg1 deletion nsg1 deletion nsg2 deletion, hmg2 deletion nsg1 deletion nsg2 deletion, and atg1 deletion. The fluorescence images reveal the presence and distribution of Erg6-GFP, indicating lipid droplet accumulation. The DIC images provide a clear view of the cellular structure and the presence of lipid droplets within the cells. The scale bar in the DIC images represents 5 micrometers.

LDs accumulate in the absence of Nsg1 and Nsg2. WT and the indicated cells expressing Erg6-GFP were observed by confocal fluorescence microscopy after 4 days of GS. Maximum projection images reconstituted from z-stack are shown. Scale bars, 5 μm.

Close Figure S5.
Figure 6.
A two-part image showing graphs and chromatograms depicts lipid analysis in yeast cells.Panel A: Thin-layer chromatograms show lipid profiles of yeast cells cultured in YPD or GS medium with 14C-acetate. The chromatograms display bands corresponding to squalene, ergosterol ester, lanosterol, ergosterol, CL, PA, PE, PS, PI, and PC. Panel B: Bar graphs show that the x-axis lists different yeast strains, and the y-axis shows relative levels. Wild-type value is set to 1, and values are means with standard error (n = 3 or 4). Panel C: Thin-layer chromatogram shows bands corresponding to squalene, ergosterol ester, TAG, and ergosterol.

Squalene and ergosterol esters accumulate in an Hmg1-dependent manner in nsg1Δnsg2Δ cells. (A) The indicated yeast cells were cultured for 1 day in YPD or GS medium containing 14C-acetate, after which total lipids were extracted. The extracted lipids were treated with or without saponification, separated by thin-layer chromatography, and visualized by autoradiography. (B) Bar graph shows the combined levels of sterol lipids and squalene, normalized to phospholipid content. WT value was set to 1. Values are means ± SE (n = 3 or 4). (C) TAG levels were analyzed by TLC in WT, nsg1Δnsg2Δ, and lro1Δdga1Δ cells after 24 h of GS. Lipids were extracted and separated by TLC, and lipids were visualized by primuline staining. Source data are available for this figure: SourceData F6.

Figure 6.
A two-part image showing graphs and chromatograms depicts lipid analysis in yeast cells.Panel A: Thin-layer chromatograms show lipid profiles of yeast cells cultured in YPD or GS medium with 14C-acetate. The chromatograms display bands corresponding to squalene, ergosterol ester, lanosterol, ergosterol, CL, PA, PE, PS, PI, and PC. Panel B: Bar graphs show that the x-axis lists different yeast strains, and the y-axis shows relative levels. Wild-type value is set to 1, and values are means with standard error (n = 3 or 4). Panel C: Thin-layer chromatogram shows bands corresponding to squalene, ergosterol ester, TAG, and ergosterol.

Squalene and ergosterol esters accumulate in an Hmg1-dependent manner in nsg1Δnsg2Δ cells. (A) The indicated yeast cells were cultured for 1 day in YPD or GS medium containing 14C-acetate, after which total lipids were extracted. The extracted lipids were treated with or without saponification, separated by thin-layer chromatography, and visualized by autoradiography. (B) Bar graph shows the combined levels of sterol lipids and squalene, normalized to phospholipid content. WT value was set to 1. Values are means ± SE (n = 3 or 4). (C) TAG levels were analyzed by TLC in WT, nsg1Δnsg2Δ, and lro1Δdga1Δ cells after 24 h of GS. Lipids were extracted and separated by TLC, and lipids were visualized by primuline staining. Source data are available for this figure: SourceData F6.

Close Figure 6.
Figure 7.
Diagram of NVJ remodeling under different nutrient conditions. The diagram shows the vacuole and cytosol with various proteins and complexes interacting. In nutrient-rich conditions, Elo2/3, Nsg1, Nsg2, and Hmg1/2 are present, with Hmg2 being stabilized. Ypf1 is also present, suppressing NVJ partitioning. In glucose-starvation conditions, Vac8 and Nvj1 are stabilized, and Hmg1/2 are oligomelized and activated. Nsg1 and Nsg2 are involved in suppressing HMG-CoA reductase activity and altering membrane properties. Elo2/3 and Hmg1/2 are destabilized, while Nsg2 is stabilized. The diagram illustrates the interactions and changes in protein stability and activity under different nutrient conditions.

A model for GS-dependent NVJ remodeling. Schematic model of NVJ remodeling under GS conditions. Color differences in the nuclear ER (nER) indicate predicted changes in membrane properties.

Figure 7.
Diagram of NVJ remodeling under different nutrient conditions. The diagram shows the vacuole and cytosol with various proteins and complexes interacting. In nutrient-rich conditions, Elo2/3, Nsg1, Nsg2, and Hmg1/2 are present, with Hmg2 being stabilized. Ypf1 is also present, suppressing NVJ partitioning. In glucose-starvation conditions, Vac8 and Nvj1 are stabilized, and Hmg1/2 are oligomelized and activated. Nsg1 and Nsg2 are involved in suppressing HMG-CoA reductase activity and altering membrane properties. Elo2/3 and Hmg1/2 are destabilized, while Nsg2 is stabilized. The diagram illustrates the interactions and changes in protein stability and activity under different nutrient conditions.

A model for GS-dependent NVJ remodeling. Schematic model of NVJ remodeling under GS conditions. Color differences in the nuclear ER (nER) indicate predicted changes in membrane properties.

Close Figure 7.
+ Expand view − Collapse view
Figure S6.
Figure S6. Refer to the image caption for details. Panel A shows western blot using anti-Nvj1 antibody comparing protein expression in wild type and nvj1 deletion strains during glucose starvation. Panel B shows western blot using anti-Nvj2 antibody comparing protein expression in wild type, nvj2 deletion, and Nvj2-GFP strains during glucose starvation. Panel C shows western blot using anti-Ypf1 antibody comparing protein expression in wild type and ypf1 deletion strains during glucose starvation. Panel D shows western blot using anti-Vac8 antibody comparing protein expression in wild type and vac8 deletion strains during glucose starvation. Panel E shows western blot using anti-Nsg1 antibody comparing protein expression in wild type, nsg1 deletion, and nsg1 deletion nsg2 deletion strains during glucose starvation. Panel F shows western blot using anti-Nsg2 antibody comparing protein expression in wild type, nsg1 deletion, and nsg1 deletion nsg2 deletion strains during glucose starvation.

Validation of antibody specificity used in this study. (A–F) Whole-cell lysates were prepared from the indicated cells under glucose-replete or glucose-starved (GS) conditions and analyzed by immunoblotting to validate the specificity of antibodies against Nvj1 (A), Nvj2 (B), Ypf1 (C), Vac8 (D), Nsg1 (E), and Nsg2 (F).

Figure S6.
Western blots showing protein expression in various yeast strains. Panel A shows western blot using anti-Nvj1 antibody comparing protein expression in wild type and nvj1 deletion strains during glucose starvation. Panel B shows western blot using anti-Nvj2 antibody comparing protein expression in wild type, nvj2 deletion, and Nvj2-GFP strains during glucose starvation. Panel C shows western blot using anti-Ypf1 antibody comparing protein expression in wild type and ypf1 deletion strains during glucose starvation. Panel D shows western blot using anti-Vac8 antibody comparing protein expression in wild type and vac8 deletion strains during glucose starvation. Panel E shows western blot using anti-Nsg1 antibody comparing protein expression in wild type, nsg1 deletion, and nsg1 deletion nsg2 deletion strains during glucose starvation. Panel F shows western blot using anti-Nsg2 antibody comparing protein expression in wild type, nsg1 deletion, and nsg1 deletion nsg2 deletion strains during glucose starvation.

Validation of antibody specificity used in this study. (A–F) Whole-cell lysates were prepared from the indicated cells under glucose-replete or glucose-starved (GS) conditions and analyzed by immunoblotting to validate the specificity of antibodies against Nvj1 (A), Nvj2 (B), Ypf1 (C), Vac8 (D), Nsg1 (E), and Nsg2 (F).

Close Figure S6.

References

Álvarez-Guerra
,
I.
,
E.
Block
,
F.
Broeskamp
,
S.
Gabrijelčič
,
T.
Infant
,
A.
De Ory
,
L.
Habernig
,
C.
Andréasson
,
T.P.
Levine
,
J.L.
Höög
, and
S.
Büttner
.
2024
.
LDO proteins and Vac8 form a vacuole-lipid droplet contact site to enable starvation-induced lipophagy in yeast
.
Dev. Cell
.
59
:
759
775.e5
.
Avci
,
D.
,
S.
Fuchs
,
B.
Schrul
,
A.
Fukumori
,
M.
Breker
,
I.
Frumkin
,
C.Y.
Chen
,
M.L.
Biniossek
,
E.
Kremmer
,
O.
Schilling
, et al
.
2014
.
The yeast ER-Intramembrane protease Ypf1 refines nutrient sensing by regulating transporter abundance
.
Mol. Cell
.
56
:
630
640
.
Aviram
,
N.
,
T.
Ast
,
E.A.
Costa
,
E.C.
Arakel
,
S.G.
Chuartzman
,
C.H.
Jan
,
S.
Haßdenteufel
,
J.
Dudek
,
M.
Jung
,
S.
Schorr
, et al
.
2016
.
The SND proteins constitute an alternative targeting route to the endoplasmic reticulum
.
Nature
.
540
:
134
138
.
Breker
,
M.
,
M.
Gymrek
,
O.
Moldavski
, and
M.
Schuldiner
.
2014
.
LoQAtE--Localization and quantitation ATlas of the yeast proteomE. A new tool for multiparametric dissection of single-protein behavior in response to biological perturbations in yeast
.
Nucleic Acids Res.
42
:
D726
D730
.
Brown
,
M.S.
, and
J.L.
Goldstein
.
1997
.
The SREBP pathway: Regulation of cholesterol metabolism by proteolysis of a membrane-bound transcription factor
.
Cell
.
89
:
331
340
.
Casas
,
M.
, and
E.J.
Dickson
.
2024
.
Channels, transporters, and receptors at membrane contact sites
.
Contact
.
7
:
25152564241305593
.
Casler
,
J.C.
,
C.S.
Harper
, and
L.L.
Lackner
.
2025
.
Mitochondria-plasma membrane contact sites regulate the ER-mitochondria encounter structure
.
J. Cell Sci.
138
:
JCS263685
.
Diep
,
D.T.V.
,
J.
Collado
,
M.
Hugenroth
,
R.M.
Fausten
,
L.
Percifull
,
M.
Wälte
,
C.
Schuberth
,
O.
Schmidt
,
R.
Fernández-Busnadiego
, and
M.
Bohnert
.
2024
.
A metabolically controlled contact site between vacuoles and lipid droplets in yeast
.
Dev. Cell
.
59
:
740
758.e10
.
Dimmer
,
K.S.
, and
D.
Rapaport
.
2017
.
Mitochondrial contact sites as platforms for phospholipid exchange
.
Biochim. Biophys. Acta Mol. Cell Biol. Lipids
1862
:
69
80
.
Diokmetzidou
,
A.
, and
L.
Scorrano
.
2025
.
Mitochondria-membranous organelle contacts at a glance
.
J. Cell Sci.
138
:
jcs263895
.
Eisenberg-Bord
,
M.
,
N.
Shai
,
M.
Schuldiner
, and
M.
Bohnert
.
2016
.
A tether is a tether is a tether: Tethering at membrane contact sites
.
Dev. Cell
.
39
:
395
409
.
Elbaz-Alon
,
Y.
,
E.
Rosenfeld-Gur
,
V.
Shinder
,
A.H.
Futerman
,
T.
Geiger
, and
M.
Schuldiner
.
2014
.
A dynamic interface between vacuoles and mitochondria in yeast
.
Dev. Cell
.
30
:
95
102
.
Flury
,
I.
,
R.
Garza
,
A.
Shearer
,
J.
Rosen
,
S.
Cronin
, and
R.Y.
Hampton
.
2005
.
INSIG: A broadly conserved transmembrane chaperone for sterol-sensing domain proteins
.
EMBO J.
24
:
3917
3926
.
Friedman
,
J.R.
,
J.R.
Dibenedetto
,
M.
West
,
A.A.
Rowland
, and
G.K.
Voeltz
.
2013
.
Endoplasmic reticulum-endosome contact increases as endosomes traffic and mature
.
Mol. Biol. Cell
.
24
:
1030
1040
.
Fujimoto
,
S.
,
S.
Tashiro
, and
Y.
Tamura
.
2023
.
Complementation assay using fusion of Split-GFP and TurboID (CsFiND) enables simultaneous visualization and proximity labeling of organelle contact sites in yeast
.
Contact
.
6
:
251525642311536
.
Funakoshi
,
M.
, and
M.
Hochstrasser
.
2009
.
Small epitope-linker modules for PCR-based c-terminal tagging in Saccharomyces cerevisiae
.
Yeast
.
26
:
185
192
.
Gardner
,
R.G.
,
H.
Shan
,
S.P.T.
Matsuda
, and
R.Y.
Hampton
.
2001
.
An oxysterol-derived positive signal for 3-Hydroxy- 3-methylglutaryl-CoA reductase degradation in yeast
.
J. Biol. Chem.
276
:
8681
8694
.
Gohil
,
N.
,
G.
Bhattacharjee
,
K.
Khambhati
,
D.
Braddick
, and
V.
Singh
.
2019
.
Engineering strategies in microorganisms for the enhanced production of squalene: Advances, challenges and opportunities
.
Front. Bioeng. Biotechnol.
7
:
50
.
Goldstein
,
J.L.
,
R.A.
DeBose-Boyd
, and
M.S.
Brown
.
2006
.
Protein sensors for membrane sterols
.
Cell
.
124
:
35
46
.
González Montoro
,
A.
,
K.
Auffarth
,
C.
Hönscher
,
M.
Bohnert
,
T.
Becker
,
B.
Warscheid
,
F.
Reggiori
,
M.
van der Laan
,
F.
Fröhlich
, and
C.
Ungermann
.
2018
.
Vps39 interacts with Tom40 to establish one of two functionally distinct vacuole-mitochondria contact sites
.
Dev. Cell
.
45
:
621
636.e7
.
Han
,
J.Y.
,
S.H.
Seo
,
J.M.
Song
,
H.
Lee
, and
E.-S.
Choi
.
2018
.
High-level recombinant production of squalene using selected Saccharomyces cerevisiae strains
.
J. Ind. Microbiol. Biotechnol.
45
:
239
251
.
Hariri
,
H.
,
S.
Rogers
,
R.
Ugrankar
,
Y.L.
Liu
,
J.R.
Feathers
, and
W.M.
Henne
.
2018
.
Lipid droplet biogenesis is spatially coordinated at ER-vacuole contacts under nutritional stress
.
EMBO Rep.
19
:
57
72
.
Henne
,
W.M.
, and
H.
Hariri
.
2018
.
Endoplasmic reticulum-vacuole contact sites “Bloom” with stress-induced lipid droplets
.
Contact
.
1
:
2515256418756112
.
Henne
,
W.M.
,
L.
Zhu
,
Z.
Balogi
,
C.
Stefan
,
J.A.
Pleiss
, and
S.D.
Emr
.
2015
.
Mdm1/Snx13 is a novel ER-endolysosomal interorganelle tethering protein
.
J. Cell Biol.
210
:
541
551
.
Hönscher
,
C.
,
M.
Mari
,
K.
Auffarth
,
M.
Bohnert
,
J.
Griffith
,
W.
Geerts
,
M.
van der Laan
,
M.
Cabrera
,
F.
Reggiori
, and
C.
Ungermann
.
2014
.
Cellular metabolism regulates contact sites between vacuoles and mitochondria
.
Dev. Cell
.
30
:
86
94
.
Horton
,
J.D.
,
J.L.
Goldstein
, and
M.S.
Brown
.
2002
.
SREBPs: Activators of the complete program of cholesterol and fatty acid synthesis in the liver
.
J. Clin. Invest.
109
:
1125
1131
.
Hugenroth
,
M.
,
P.
Höhne
,
X.-T.
Zhao
,
M.
Wälte
,
D.T.V.
Diep
,
R.M.
Fausten
, and
M.
Bohnert
.
2025
.
Role of Pex31 in metabolic adaptation of the nucleus-vacuole junction
.
J. Cell Sci.
138
:
jcs264171
.
Jeong
,
H.
,
J.
Park
,
H.-I.
Kim
,
M.
Lee
,
Y.
Ko
,
S.
Lee
,
Y.
Jun
, and
C.
Lee
.
2017
.
Mechanistic insight into the nucleus-vacuole junction based on the Vac8p-Nvj1p crystal structure
.
Proc. Natl. Acad. Sci. USA
.
114
:
E4539
E4548
.
Kakimoto
,
Y.
,
S.
Tashiro
,
R.
Kojima
,
Y.
Morozumi
,
T.
Endo
, and
Y.
Tamura
.
2018
.
Visualizing multiple inter-organelle contact sites using the organelle-targeted split-GFP system
.
Sci. Rep.
8
:
6175
.
Kakimoto-Takeda
,
Y.
,
R.
Kojima
,
H.
Shiino
,
M.
Shinmyo
,
K.
Kurokawa
,
A.
Nakano
,
T.
Endo
, and
Y.
Tamura
.
2022
.
Dissociation of ERMES clusters plays a key role in attenuating the endoplasmic reticulum stress
.
iScience
.
25
:
105362
.
Kato
,
R.
,
Y.
Takenaka
,
Y.
Ohno
, and
A.
Kihara
.
2024
.
Catalytic mechanism of trans-2-enoyl-CoA reductases in the fatty acid elongation cycle and its cooperative action with fatty acid elongases
.
J. Biol. Chem.
300
:
105656
.
Kohler
,
V.
, and
S.
Büttner
.
2021
.
Remodelling of nucleus-vacuole junctions during metabolic and proteostatic stress
.
Contact
.
4
:
251525642110166
.
Kohlwein
,
S.D.
,
S.
Eder
,
C.-S.
Oh
,
C.E.
Martin
,
K.
Gable
,
D.
Bacikova
, and
T.
Dunn
.
2001
.
Tsc13p is required for fatty acid elongation and localizes to a novel structure at the nuclear-vacuolar interface in Saccharomyces cerevisiae
.
Mol. Cell. Biol.
21
:
109
125
.
Kojima
,
R.
,
T.
Endo
, and
Y.
Tamura
.
2016
.
A phospholipid transfer function of ER-mitochondria encounter structure revealed in vitro
.
Sci. Rep.
6
:
30777
.
Kornmann
,
B.
,
E.
Currie
,
S.R.
Collins
,
M.
Schuldiner
,
J.
Nunnari
,
J.S.
Weissman
, and
P.
Walter
.
2009
.
An ER-mitochondria tethering complex revealed by a synthetic biology screen
.
Science
325
:
477
481
.
Krick
,
R.
,
Y.
Muehe
,
T.
Prick
,
S.
Bremer
,
P.
Schlotterhose
,
E.-L.
Eskelinen
,
J.
Millen
,
D.S.
Goldfarb
, and
M.
Thumm
.
2008
.
Piecemeal microautophagy of the nucleus requires the core macroautophagy genes
.
Mol. Biol. Cell
.
19
:
4492
4505
.
Kvam
,
E.
, and
D.S.
Goldfarb
.
2004
.
Nvj1p is the outer-nuclear-membrane receptor for oxysterol-binding protein homolog Osh1p in Saccharomyces cerevisiae
.
J. Cell Sci.
117
:
4959
4968
.
Kvam
,
E.
,
K.
Gable
,
T.M.
Dunn
, and
D.S.
Goldfarb
.
2005
.
Targeting of Tsc13p to nucleus-vacuole junctions: A role for very-long-chain fatty acids in the biogenesis of microautophagic vesicles
.
Mol. Biol. Cell.
16
:
3987
3998
.
Lanz
,
M.C.
,
K.
Yugandhar
,
S.
Gupta
,
E.J.
Sanford
,
V.M.
Faça
,
S.
Vega
,
A.M.N.
Joiner
,
J.C.
Fromme
,
H.
Yu
, and
M.B.
Smolka
.
2021
.
In-depth and 3-dimensional exploration of the budding yeast phosphoproteome
.
EMBO Rep.
22
:e51121.
Leutert
,
M.
,
A.S.
Barente
,
N.K.
Fukuda
,
R.A.
Rodriguez-Mias
, and
J.
Villén
.
2023
.
The regulatory landscape of the yeast phosphoproteome
.
Nat. Struct. Mol. Biol.
30
:
1761
1773
.
Lin
,
X.
2021
.
The regulation of Saccharomyces cerevisiae Snf1 protein kinase on glucose utilization is in a glucose-dependent manner
.
Curr. Genet.
67
:
245
248
.
Longtine
,
M.S.
,
A.
Mckenzie
3rd
,
D.J.
Demarini
,
N.G.
Shah
,
A.
Wach
,
A.
Brachat
,
P.
Philippsen
, and
J.R.
Pringle
.
1998
.
Additional modules for versatile and economical PCR-based gene deletion and modification in Saccharomyces cerevisiae
.
Yeast
.
14
:
953
961
.
MacGilvray
,
M.E.
,
E.
Shishkova
,
M.
Place
,
E.R.
Wagner
,
J.J.
Coon
, and
A.P.
Gasch
.
2020
.
Phosphoproteome response to Dithiothreitol reveals unique versus shared features of Saccharomyces cerevisiae stress responses
.
J. Proteome Res.
19
:
3405
3417
.
Malia
,
P.C.
, and
C.
Ungermann
.
2016
.
Vacuole membrane contact sites and domains: Emerging hubs to coordinate organelle function with cellular metabolism
.
Biochem. Soc. Trans.
44
:
528
533
.
Manik
,
M.K.
,
H.
Yang
,
J.
Tong
, and
Y.J.
Im
.
2017
.
Structure of yeast OSBP-related protein Osh1 reveals key determinants for lipid transport and protein targeting at the nucleus-vacuole junction
.
Structure
.
25
:
617
629.e3
.
Meadows
,
A.L.
,
K.M.
Hawkins
,
Y.
Tsegaye
,
E.
Antipov
,
Y.
Kim
,
L.
Raetz
,
R.H.
Dahl
,
A.
Tai
,
T.
Mahatdejkul-Meadows
,
L.
Xu
, et al
.
2016
.
Rewriting yeast central carbon metabolism for industrial isoprenoid production
.
Nature
.
537
:
694
697
.
Mendes
,
A.
,
J.
Azevedo-Silva
, and
J.C.
Fernandes
.
2022
.
From sharks to yeasts: Squalene in the development of vaccine adjuvants
.
Pharmaceuticals
.
15
:
265
.
Meyer
,
T.
,
O.
Knittelfelder
,
M.
Smolnig
, and
P.
Rockenfeller
.
2024
.
Quantifying yeast lipidomics by high-performance thin-layer chromatography (HPTLC) and comparison to mass spectrometry-based shotgun lipidomics
.
Microb. Cell
.
11
:
57
68
.
Mizushima
,
N.
,
T.
Yoshimori
, and
Y.
Ohsumi
.
2011
.
The role of Atg proteins in autophagosome formation
.
Annu. Rev. Cell Dev. Biol.
27
:
107
132
.
Oelkers
,
P.
,
D.
Cromley
,
M.
Padamsee
,
J.T.
Billheimer
, and
S.L.
Sturley
.
2002
.
The DGA1 gene determines a second triglyceride synthetic pathway in yeast
.
J. Biol. Chem.
277
:
8877
8881
.
Oh
,
C.S.
,
D.A.
Toke
,
S.
Mandala
, and
C.E.
Martin
.
1997
.
ELO2 and ELO3, homologues of the Saccharomyces cerevisiae ELO1 gene, function in fatty acid elongation and are required for sphingolipid formation
.
J. Biol. Chem.
272
:
17376
17384
.
Okada
,
S.
,
G.
Doi
,
S.
Nakagawa
,
E.
Kusumoto
, and
T.
Ito
.
2021
.
Simple-to-use CRISPR-SpCas9/SaCas9/AsCas12a vector series for genome editing in Saccharomyces cerevisiae
.
G3
.
11
:
jkab304
.
Pan
,
X.
,
P.
Roberts
,
Y.
Chen
,
E.
Kvam
,
N.
Shulga
,
K.
Huang
,
S.
Lemmon
, and
D.S.
Goldfarb
.
2000
.
Nucleus-vacuole junctions in Saccharomyces cerevisiae are formed through the direct interaction of Vac8p with Nvj1p
.
Mol. Biol. Cell
.
11
:
2445
2457
.
Paramasivan
,
K.
, and
S.
Mutturi
.
2022
.
Recent advances in the microbial production of squalene
.
World J. Microbiol. Biotechnol.
38
:
91
.
Prokisch
,
S.
, and
S.
Büttner
.
2024
.
Partitioning into ER membrane microdomains impacts autophagic protein turnover during cellular aging
.
Sci. Rep.
14
:
13653
.
Roberts
,
P.
,
S.
Moshitch-Moshkovitz
,
E.
Kvam
,
E.
O’Toole
,
M.
Winey
, and
D.S.
Goldfarb
.
2003
.
Piecemeal microautophagy of nucleus in Saccharomyces cerevisiae
.
Mol. Biol. Cell
.
14
:
129
141
.
Rogers
,
S.
,
H.
Hariri
,
N.E.
Wood
,
N.O.
Speer
, and
W.M.
Henne
.
2021
.
Glucose restriction drives spatial reorganization of mevalonate metabolism
.
Elife
.
10
:e62591.
Sakaue
,
H.
,
T.
Shiota
,
N.
Ishizaka
,
S.
Kawano
,
Y.
Tamura
,
K.S.
Tan
,
K.
Imai
,
C.
Motono
,
T.
Hirokawa
,
K.
Taki
, et al
.
2019
.
Porin associates with Tom22 to regulate the mitochondrial protein gate assembly
.
Mol. Cell
.
73
:
1044
1055.e8
.
Seo
,
A.Y.
,
P.-W.
Lau
,
D.
Feliciano
,
P.
Sengupta
,
M.A.L.
Gros
,
B.
Cinquin
,
C.A.
Larabell
, and
J.
Lippincott-Schwartz
.
2017
.
AMPK and vacuole-associated Atg14p orchestrate μ-lipophagy for energy production and long-term survival under glucose starvation
.
Elife
.
6
:e21690.
Sever
,
N.
,
B.-L.
Song
,
D.
Yabe
,
J.L.
Goldstein
,
M.S.
Brown
, and
R.A.
DeBose-Boyd
.
2003
.
Insig-dependent ubiquitination and degradation of mammalian 3-hydroxy-3-methylglutaryl-CoA reductase stimulated by sterols and geranylgeraniol
.
J. Biol. Chem.
278
:
52479
52490
.
Sikorski
,
R.S.
, and
P.
Hieter
.
1989
.
A system of shuttle vectors and yeast host strains designed for efficient manipulation of DNA in Saccharomyces cerevisiae
.
Genetics
.
122
:
19
27
.
Tamura
,
Y.
,
S.
Kawano
, and
T.
Endo
.
2019
.
Organelle contact zones as sites for lipid transfer
.
J. Biochem.
165
:
115
123
.
Tashiro
,
S.
,
Y.
Kakimoto
,
M.
Shinmyo
,
S.
Fujimoto
, and
Y.
Tamura
.
2020
.
Improved Split-GFP systems for visualizing organelle contact sites in yeast and human cells
.
Front. Cell Dev. Biol.
8
:
571388
.
Theesfeld
,
C.L.
, and
R.Y.
Hampton
.
2013
.
Insulin-induced gene protein (INSIG)-dependent sterol regulation of Hmg2 endoplasmic reticulum-associated degradation (ERAD) in yeast
.
J. Biol. Chem.
288
:
8519
8530
.
Tosal-Castano
,
S.
,
C.
Peselj
,
V.
Kohler
,
L.
Habernig
,
L.L.
Berglund
,
M.
Ebrahimi
,
F.N.
Vögtle
,
J.
Höög
,
C.
Andréasson
, and
S.
Büttner
.
2021
.
Snd3 controls nucleus-vacuole junctions in response to glucose signaling
.
Cell Rep.
34
:
108637
.
Toulmay
,
A.
, and
W.A.
Prinz
.
2012
.
A conserved membrane-binding domain targets proteins to organelle contact sites
.
J. Cell Sci.
125
:
49
58
.
Vik
,
A.
, and
J.
Rine
.
2001
.
Upc2p and Ecm22p, dual regulators of sterol biosynthesis in Saccharomyces cerevisiae
.
Mol. Cell. Biol.
21
:
6395
6405
.
Wangeline
,
M.A.
, and
R.Y.
Hampton
.
2021
.
An autonomous, but INSIG-modulated, role for the sterol sensing domain in mallostery-regulated ERAD of yeast HMG-CoA reductase
.
J. Biol. Chem.
296
:
100063
.
Weihofen
,
A.
,
K.
Binns
,
M.K.
Lemberg
,
K.
Ashman
, and
B.
Martoglio
.
2002
.
Identification of signal peptide peptidase, a Presenilin-Type aspartic protease
.
Science
.
296
:
2215
2218
.
Wenzel
,
E.M.
,
L.A.
Elfmark
,
H.
Stenmark
, and
C.
Raiborg
.
2022
.
ER as master regulator of membrane trafficking and organelle function
.
J. Cell Biol.
221
:e202205135.
Winston
,
F.
,
C.
Dollard
, and
S.L.
Ricupero-Hovasse
.
1995
.
Construction of a set of convenient Saccharomyces cerevisiae strains that are isogenic to S288C
.
Yeast
.
11
:
53
55
.
Wood
,
N.E.
,
P.
Kositangool
,
H.
Hariri
,
A.J.
Marchand
, and
W.M.
Henne
.
2020
.
Nutrient signaling, stress response, and inter-organelle communication are non-canonical determinants of cell fate
.
Cell Rep.
33
:
108446
.
Xu
,
J.
, and
X.
Huang
.
2020
.
Lipid metabolism at membrane contacts: Dynamics and functions beyond lipid homeostasis
.
Front. Cell Dev. Biol.
8
:
615856
.
Yang
,
T.
,
P.J.
Espenshade
,
M.E.
Wright
,
D.
Yabe
,
Y.
Gong
,
R.
Aebersold
,
J.L.
Goldstein
, and
M.S.
Brown
.
2002
.
Crucial step in cholesterol homeostasis: Sterols promote binding of SCAP to INSIG-1, a membrane protein that facilitates retention of SREBPs in ER
.
Cell
.
110
:
489
500
.
Yofe
,
I.
,
U.
Weill
,
M.
Meurer
,
S.
Chuartzman
,
E.
Zalckvar
,
O.
Goldman
,
S.
Ben-Dor
,
C.
Schütze
,
N.
Wiedemann
,
M.
Knop
, et al
.
2016
.
One library to make them all: Streamlining the creation of yeast libraries via a SWAp-Tag strategy
.
Nat. Methods
13
:
371
378
.

or Create an Account

Close subscription notice
Close access options