


Truncation mutations in cardiac myosin binding protein C (cMyBP-C) are common causes of hypertrophic cardiomyopathy (HCM). Heterozygous carriers present with classical HCM, while homozygous carriers present with early onset HCM that rapidly progress to heart failure. We used CRISPR-Cas9 to introduce heterozygous (cMyBP-C+/−) and homozygous (cMyBP-C−/−) frame-shift mutations into MYBPC3 in human iPSCs. Cardiomyocytes derived from these isogenic lines were used to generate cardiac micropatterns and engineered cardiac tissue constructs (ECTs) that were characterized for contractile function, Ca2+-handling, and Ca2+-sensitivity. While heterozygous frame shifts did not alter cMyBP-C protein levels in 2-D cardiomyocytes, cMyBP-C+/− ECTs were haploinsufficient. cMyBP-C−/− cardiac micropatterns produced increased strain with normal Ca2+-handling. After 2 wk of culture in ECT, contractile function was similar between the three genotypes; however, Ca2+-release was slower in the setting of reduced or absent cMyBP-C. At 6 wk in ECT culture, the Ca2+-handling abnormalities became more pronounced in both cMyBP-C+/− and cMyBP-C−/− ECTs, and force production became severely depressed in cMyBP-C−/− ECTs. RNA-seq analysis revealed enrichment of differentially expressed hypertrophic, sarcomeric, Ca2+-handling, and metabolic genes in cMyBP-C+/− and cMyBP-C−/− ECTs. Our data suggest a progressive phenotype caused by cMyBP-C haploinsufficiency and ablation that initially is hypercontractile, but progresses to hypocontractility with impaired relaxation. The severity of the phenotype correlates with the amount of cMyBP-C present, with more severe earlier phenotypes observed in cMyBP-C−/− than cMyBP-C+/− ECTs. We propose that while the primary effect of cMyBP-C haploinsufficiency or ablation may relate to myosin crossbridge orientation, the observed contractile phenotype is Ca2+-mediated.
Introduction
Cardiac myosin binding protein C (cMyBP-C), a key regulator of cardiac contractility (Barefield and Sadayappan, 2010), localizes to the sarcomeric C-zone where its C-terminal domains (C7–C10) bind to the thick filament backbone through interactions with light meromyosin and titin (Freiburg and Gautel, 1996; Miyamoto et al., 1999; Welikson and Fischman, 2002). The N-terminal region extends into the interfilament space to form regulatory interactions with either the S2 subunit of myosin or F-actin in the thin filament (Gruen et al., 1999; Shaffer et al., 2009). Under basal conditions, the C1C2 region of cMyBP-C forms an inhibitory interaction with S2 that reduces the probability of myosin–actin crossbridge formation. Upon increased demand for cardiac output, phosphorylation of serine residues in the MyBP-C-motif abolishes this inhibitory interaction (Kensler et al., 2017; Kunst et al., 2000). Additionally, the C1C2 region of cMyBP-C can then bind to the thin filament, shifting the troponin–tropomyosin inhibitory complex from the blocked to the closed position at low cytoplasmic Ca2+ concentrations (Bezold et al., 2013; Harris et al., 2016; Inchingolo et al., 2019; Kensler et al., 2011; Mun et al., 2014; Previs et al., 2016), thereby sensitizing the thin filament to the effects of Ca2+. In this mode, the net effect of cMyBP-C phosphorylation is increased crossbridge formation due to abolition of the S2 interaction (increased force and rate of contraction) and increasing thin filament Ca2+ sensitivity through its interaction with actin. Reduced phosphorylation of cMyBP-C is associated with human heart failure and likely contributes to both systolic and diastolic dysfunction.
Mutations in MYBPC3, encoding cMyBP-C, are a leading cause of hypertrophic cardiomyopathy (HCM; Carrier, 2021; Harris et al., 2011; Richard et al., 2003; Seidman and Seidman, 2011), a disease affecting up to 1:200 individuals worldwide (Semsarian et al., 2015). Of the 365 HCM-associated mutations in MYBPC3, the majority cause truncation of the protein (Carrier, 2021). These mutations are thought to cause HCM through a mechanism of haploinsufficiency due to nonsense-mediated mRNA decay and rapid proteasomal degradation (Andersen et al., 2004; Carrier et al., 2010; Maron and Maron, 2015; Seeger et al., 2019; Smelter et al., 2018; van Dijk et al., 2009; Vignier et al., 2009). The vast majority of cMyBP-C truncation mutations occur in the heterozygous state leading to classical HCM with adolescent or adult onset of disease. However, in several reported cases with either homozygous or compound heterozygous cMyBP-C truncation mutations, the presentation occurs during the neonatal period and rapidly progresses to heart failure within the first year of life (Richard et al., 2003a; Xin et al., 2007; Zahka et al., 2008).
Several mouse models of cMyBP-C ablation and truncation have been generated to gain insights into cMyBP-C function as a regulator of cardiac contraction and to study the effect of cMyBP-C haploinsufficiency as an HCM disease mechanism (Carrier et al., 2004; Harris et al., 2002; McConnell et al., 1999). Data from these mice provide key evidence that cMyBP-C exerts its influence on contractile force and kinetics through modulating the probability of crossbridge formation. Furthermore, these models shed light on the progression of HCM, as hearts from mice homozygous for cMyBP-C ablation develop severe myocardial hypertrophy, dilated ventricles, myocyte disarray, and fibrosis. These anatomical abnormalities are accompanied by both systolic and diastolic dysfunction (Carrier et al., 2004; Harris et al., 2002; McConnell et al., 1999). Extrapolating these data to the human condition, however, may have some limitations as mice carrying a heterozygous cMyBP-C knockout or truncation alleles show either no, or very mild, late-onset cardiac abnormalities (Carrier et al., 2004; Cheng et al., 2013; Harris et al., 2002; McConnell et al., 2001). The advent of human induced pluripotent stem cell-derived cardiomyocytes (hiPSC-CM) as a model system holds promise to provide an experimental bridge between mouse and human physiology. Thus far, many of the available studies however relied on hiPSC-CMs cultured in monolayers which have yielded variable and often contradictory results. Some showed evidence of hiPSC-CM hypertrophy and myofibrillar disarray, while others did not (Birket et al., 2015; Dambrot et al., 2014; Ojala et al., 2016; Prondzynski et al., 2017; Tanaka et al., 2014). Part of the discrepancy may lie with the relative immaturity at the molecular and functional levels found when hiPSC-CMs are grown in monolayers (Cai et al., 2019; de Lange et al., 2021), as well as the difficulty in obtaining high-resolution contractile measures from unloaded and poorly aligned cells, which all may be related to the absence of tissue-level signaling cues that influence maturation and potentially the pathologic hypertrophic remodeling (Marian, 2002; Marian and Roberts, 1998).
We have previously demonstrated that the in vitro integrated human cardiac tissue format promotes cardiomyocyte maturation and contractile performance and supports a tightly controlled and detailed analyses (de Lange et al., 2021). Here, we examined the effects of heterozygous and homozygous cMyBP-C frame-shift mutations on contractile function using isogenic CRISPR-Cas9 genome edited iPSC-CMs grown in both 2-D micropatterns and 3-D integrated human engineered cardiac tissues (ECT). We found that while cMyBP-C ablation causes early hypercontractility in the micropatterns, maximal force production decreases, and the rate of relaxation progressively slows with prolonged time in the integrated 3-D engineered tissue. The deteriorating contractile phenotype is primarily mediated through alterations in Ca2+ handling with a decrease in Ca2+ transient amplitude and slowing of Ca2+ release. Surprisingly, cMyBP-C haploinsufficiency did not alter sarcomeric Ca2+ sensitivity, while ablation caused a desensitization of the myofilament to the activating effect of Ca2+. RNA-seq analyses indicated programmatic changes in expression of Ca2+ handling and energy metabolism related genes that correlate with the observed phenotype. Together, these data highlight a central role of Ca2+ handling in the developing human cMyBP-C HCM functional phenotype, and suggest the presence of early transcriptional responses that may trigger the cellular hypertrophic response.
Materials and methods
Human iPSC culture
DF19-9-11T.H iPSCs, hereafter referred to as cMyBP-C+/+, were cultured similar to previously described (de Lange et al., 2021). In short, cryopreserved iPSCs were thawed, added to StemFlex media and plated onto Matrigel (GFR, BD Biosciences)-coated 6-well dishes. Cells were subsequently incubated at 37°C; 5% CO2 until they were 70–90% confluent with daily media changes with StemFlex (Gibco) prior to passaging. For passaging, iPSCs were dissociated using Versine (Gibco), resuspend in StemFlex media and plated onto on Matrigel (Corning)-coated plates.
MYBPC3 ablation by CRISPER-Cas9 gene editing in human iPSCs
CRISPR guide RNA (gRNA) sequences were designed to the genomic DNA sequences of exons 2 and 6 of the MYBPC3 gene (NCBI Reference Sequence: NG_007667.1) using the Optimized CRISPR Design Tool (http://crispr.mit.edu/guides; Table S1). Complimentary oligonucleotides encoding CRISPR1 gRNA and CRISPR8 gRNA targeting exons 6 and 2, respectively, were synthesized by Integrated DNA Technologies (IDT) and cloned into pSpCas9(BB)-2A-Puro (PX459) V2.0 (a gift from Feng Zhang, Broad Institute, Cambridge, MA, USA; plasmid# 62988; Addgene; Ran et al, 2013). Guide RNA-containing vectors were transfected into HEK293 cells and cutting efficiency assessed via Surveyor Assay from Transgenomic (for CRISPR8 gRNA) or Droplet Digital PCR (ddPCR, Bio-Rad). Guide-containing vectors were transfected into low passage non-modified DF19-9-11T.H hiPSCs using the Neon Transfection System (Invitrogen). Transfected iPSCs were cultured in StemFlex (Gibco) on Matrigel (Corning)-coated plates supplemented with 5µM Y-27632 (BD Biosciences) for 24 h, prior to selection with 100–400 ng/ml puromycin for 48 h to select iPSC clones with high Cas9 expression similar to previously described (Steyer et al., 2018). Puromycin-resistant clones were cultured for an additional 7 d in StemFlex prior to passaging and harvesting of DNA using QuickExtract DNA Extraction Solution (Epicentre). iPSC colonies in which one or both alleles were targeted by non-homologous end joining (NHEJ) were identified by sib-selection and a dual fluorescent probe droplet digital drop-off assay PCR assay (Bio-Rad) similar to that described (Findlay et al., 2016; Miyaoka et al., 2014), using primers and probes in Table S1 and Fig. S1. Following identification of clonal iPSC colonies in which one or both MYBPC3 alleles were disrupted by NHEJ, using sib-selection, exons 2 and 6 of MYBPC3 were PCR amplified with Platinum SuperFi DNA polymerase (Invitrogen) using the following primer pairs MYBPC3 Ex2F: 5′-AAGAAGCCACGGTCAG-3′; Ex2R: 5′-AACTTGACCTTGGAGGAG-3′; Ex6F: 5′-AATACAGGCCTGAGCCACCG-3′; Ex6R: 5′-AACTCACCTTCACCCATCG-3′. PCR products were cloned into pCR4-TOPO (Invitrogen) and Sanger sequencing performed to identify insertion/deletion mutations caused by NHEJ. Additionally, PCR were performed on the five coding loci with the highest off-target probability scores for CRISPR1 and CRISPR8 gRNAs as predicted by the Optimized CRISPR Design Tool (http://crispr.mit.edu/guides; Table S2), and Sanger sequencing performed to rule-out off-target effects at these loci. One iPSC line carrying MYBPC3 exon 6 frame-shift mutations in the heterozygous state (CR1 F2; designated MYBPC3+/−) and two lines carrying either two MYBPC3 exon 2 frame-shift mutations in trans and one carrying a homozygous frame-shift mutation (CR812-1 and CR8 18; designated MYBPC3−/−) were used in subsequent experiments as indicated. ECTs generated using CR812-1 and CR8 18 CM were functionally similar (Fig. S3).

CRISPR-Cas9 genome editing of exons 2 and 6 of MYBPC3. (A) sgRNA + Cas9-2A-PAC plasmid map. (B) Timeline of genome editing and selection of DF19-9-11T.H hiPSC cells. (C) Schematic representation of Cas9-mediated gene editing by NHEJ. (D) Schematic of droplet digital PCR design. (E) Schematic of droplet digital PCR results in a non-targeted (left), heterozygously targeted (center), and homozygously targeted (right) iPSC colony. (F) Partial DNA sequence of exon 6 of MYBPC3 of a wild type allele (top) and the 17 bp deletion allele in clone CR1F2, heterozygous for a cMyBP-C truncation mutation. (G) Partial DNA sequence of exon 2 of MYBPC3 of a 1-bp deletion allele (top) and a 5-bp deletion allele in clone CR8 12-1, homozygous for a cMyBP-C truncation mutations.
CRISPR-Cas9 genome editing of exons 2 and 6 of MYBPC3. (A) sgRNA + Cas9-2A-PAC plasmid map. (B) Timeline of genome editing and selection of DF19-9-11T.H hiPSC cells. (C) Schematic representation of Cas9-mediated gene editing by NHEJ. (D) Schematic of droplet digital PCR design. (E) Schematic of droplet digital PCR results in a non-targeted (left), heterozygously targeted (center), and homozygously targeted (right) iPSC colony. (F) Partial DNA sequence of exon 6 of MYBPC3 of a wild type allele (top) and the 17 bp deletion allele in clone CR1F2, heterozygous for a cMyBP-C truncation mutation. (G) Partial DNA sequence of exon 2 of MYBPC3 of a 1-bp deletion allele (top) and a 5-bp deletion allele in clone CR8 12-1, homozygous for a cMyBP-C truncation mutations.
Differentiation of human iPSCs into cardiomyocytes
Human iPSCs from the DF19-9-11T.H line (designated cMyBP-C+/+) as well as cMyBP-C+/−and cMyBP-C−/− iPSCs were differentiated into CMs using a small molecule-directed protocol similar to previously described (Lian et al., 2012; Lian et al., 2013; Zhang et al., 2012). In short, hiPSCs maintained on the StemFlex/Matrigel system were dissociated into single cells and seeded onto Matrigel-coated 6-well plates at 1.5–2.0 × 10⁶ cells/well in StemFlex medium. Cells were cultured for ∼3–5 d in StemFlex medium (1 d post-100% confluence, at which time differentiation was initiated [day 0]). On day 0, StemFlex medium was replaced with 2 ml/well RPMI supplemented with B27 without insulin (Gibco) supplemented with 9 µM CHIR99021 (GSK-3 inhibitor, Tocris Bioscience). Precisely 24 h later (day 1), medium was changed to 3 ml/well RPMI + B27 without insulin and cells were cultured in this medium for 48 h (day 3). On day 3, the medium was changed to 3 ml/well RPMI + B27 without insulin supplemented with 5 μM IWP-4 (Stemgent). 48 h later (day 5) the medium was changed to 3 ml RPMI + B27 without insulin. The medium was changed to RPMI + B27 complete supplement (with insulin; Gibco) on day 7, and the differentiated cells were maintained in this medium until day 15 with medium changes every 48–72 h. On day 15, cells from wells containing ≥30% beating cells by visual inspection were dissociated with 10× TrypLE (Thermo Fisher Scientific) according to the manufacturer’s protocol. Following resuspension in EB20 medium (Zhang et al., 2019), cells were replated on SyntheMax (Corning)-coated 6-well plates. 48 h after replating, hiPSC-CMs were purified using CDM3L media, made with RPMI 1640 no glucose (Life Technologies), 500 μg/ml recombinant human albumin, 213 μg/ml L–ascorbic acid 2–phosphate, and 4 mM L–lactic acid (Sigma–Aldrich; Burridge et al., 2015) for 7 d with media changes every 48–72 h. Following selection, CM were maintained in RPMI with B27 supplement until day 30 at which point hiPSC-CMs were dissociated for hiPSC-ECT generation.
hiPSC-CF culture
DF19-9-11T.H hiPSC-cardiac fibroblasts (CFs), a kind gift from Dr. Timothy Kamp (Zhang et al., 2019), were maintained in FibroGRO-LS media (Millipore Sigma) in uncoated 6-well culture plates (Corning) with passaging every 4–5 d. Low passage number CFs (<12) were used for hiPSC-ECT generation.
Generation of hiPSC-CM micropatterns
Microcontact printing and soft lithography were used to generate compliant substrates with patterned extracellular matrix proteins in a defined pattern as previously described (Napiwocki et al., 2021a; Napiwocki et al., 2021b). Patterns were fabricated on a master Si wafer (FlowJEM) and used to produce reusable polydimethylsiloxane (PDMS) stamps for microcontact printing. For experiment samples, PDMS was made to a Young’s modulus of 40 kPa by blending Sylgard 184 and Sylgard 527 (Dow Corning) at a ratio of 1:12 (Palchesko et al., 2012). PDMS was poured into a petri dish, cured overnight at 60°C, cut to the desired size with a razor blade, and attached to a 12-well plate using Sylgard 184, and allowed to cure overnight at 60°C. Substrates are UV sterilized prior to use. PDMS was poured onto the patterned wafer and cured at 60°C overnight, then removed and cut into individual stamps. Stamps were coated with the ECM Matrigel (Corning) overnight. A polyvinyl alcohol (PVA) film was made by dissolving 0.5 g of PVA (Sigma-Aldrich) in 10 ml of deionized water and dried overnight in a petri dish. The PVA film was removed from the petri dish and cut to size before the Matrigel-coated stamps are brought into contact. The stamps are allowed to transfer onto the PVA film in an incubator with a glass slide and 50 g weight placed on top to promote complete transfer. After 1 h, the PVA film was removed from the PDMS stamp and then brought into conformal contact with the soft PDMS substrate. After 20 min, the substrate was washed with PBS to dissolve the PVA film, leaving behind the patterned proteins which were then seeded with cMyBP-C+/+, cMyBP-C+/−, and cMyBP-C−/− hiPSCs at a concentration of 1 × 10⁵ CM/micropattern.
Strain analysis of hiPSC-CM micropatterns
Brightfield videos of cells spontaneously contracting were acquired on experiment day 6 using a Nikon Eclipse Ti microscope with a Plan Flour 10× NA 0.3 objective and Nikon DS-QiMc camera with samples maintained at 37°C. At least two spontaneous contractions were acquired for each sample with an acquisition rate of 18.9 fps. Mechanical analysis was performed using previously developed open source software, with custom add-ons and modifications (Napiwocki et al., 2021a; Napiwocki et al., 2021b; Notbohm et al., 2019). The random high contrast pattern from the phase contrast of the cells is sufficient to allow tracking of displacements using the open-source digital image correlation software, Fast Iterative Digital Image Correlation (FIDIC; Bar-Kochba et al., 2015). Subsequent frames were analyzed relative to the first frame, which contains cardiomyocytes in a relaxed state. Full-field 2-D displacements, Ux and Uy, were computed for each frame using the input parameters of a target subset size of 48 pixels and subset spacing of 12 pixels. From the displacements, x and y strains were calculated by taking the gradient of the displacement data, and ultimately principal strains, ε1 and ε2, were computed for each time point throughout the contraction event. A binary mask was created using edge detection techniques to eliminate data from areas not occupied by cells (Treloar and Simpson, 2013). Second principal strain (i.e., contractile strain) was used as the metric of mechanical function. Full-field contractile strain values were averaged for each frame of the video and the maximum of this averaged value (i.e., maximum contractile strain) was used as a measure for comparison between sample conditions.
hiPSC-ECT generation
hiPSC-ECTs were generated similar to previously described (de Lange et al., 2021; Melby et al., 2021). In short, day 30 cMyBPC+/+, cMyBPC+/−, and cMyBPC3−/− hiPSC-CMs were dissociated with 10× TrypLE (Thermo Fisher Scientific) according to the manufacturer’s protocol and counted using a hemocytometer. hiPSC-CMs were subsequently resuspended at 1–2 × 10⁶ CM/ml in fibrin ECT media (60.3% high-glucose DMEM; 20% F12 nutrient supplement; 1 mg/ml gentamicin; 8.75% FBS; 6.25% horse serum; 1% HEPES; 1× nonessential amino acid cocktail; 3 mM sodium pyruvate; 0.004% (wt/vol) NaHCO3; 1 µg/ml insulin; 400 µM tranexamic acid; and 17.5 µg/ml aprotinin; Cai et al., 2019) and incubated for 1 h on a rotating platform at 37°C to form small and uniform clusters of viable CMs. DF19-9-11T.H CFs were dissociated using 1× TrypLE (Thermo Fisher Scientific) according to the manufacturer’s protocol and counted using a hemocytometer. Following rotational culture, 2 × 10⁶ hiPSC-CMs were mixed with 2 × 10⁵ hiPSC-CFs in 200 µl fibrin ECT media per hiPSC-ECT, at a ratio similar to that previously used in the generation of 3-D cardiac constructs (Zhao et al., 2019). To this cell mixture, 1.25 mg/ml fibrinogen and 0.5 units of thrombin were added. This cell–matrix mixture was rapidly mixed and loaded onto a 20 × 3 mm cylindrical mold of FlexCell Tissue Train silicone membrane culture plate, followed by incubation under pre-programmed vacuum condition for 60 min at 37°C supplied with 5% CO2 to allow for attachment of the ECT constructs to the nylon tabs at each end of the Tissue Train well. Following polymerization of the fibrin matrix, ECT were fed with ECT media, carefully separated from the plate surface with a sterile pipette, and cultured for 14–60 d with media changes every 2–3 d.
Twitch force and Ca2+-transient measurements
Isometric twitch force (TF) and Ca2+-transients (CaTR) were measured in hiPSC-ECT using protocols similar to those previously described (de Lange et al., 2021; Melby et al., 2021). In brief, each hiPSC-ECT construct was transferred from the culture dish to a model 801B small intact fiber test apparatus (Aurora Scientific) in Krebs-Henseleit buffer (119 mmol/l NaCl; 12 mmol/l glucose; 4.6 mmol/l KCl; 25 mmol/l NaHCO3; 1.2 mmol/l KH2PO4; 1.2 mmol/l MgCl2; and 1.8 mmol/l CaCl2, gassed with 95% O2/5% CO2 [pH 7.4]). hiPSC-ECT constructs were attached with sutures between a model 403A force transducer (Aurora Scientific) and a stationary arm and perfused with 37°C Krebs-Henseleit buffer at a rate of 1 ml/min and field-stimulation initiated at 1 Hz (2.5 ms, 12.5 V). The longitudinal length of each construct was increased stepwise until maximal TF was achieved in order to establish the Frank-Starling relationship. Constructs were allowed to equilibrate for 20 min with constant perfusion. Following equilibration, TF production was measured with pacing at a frequency of 1.5 Hz both at baseline and following 5 min preincubation with 1 µM isoproterenol.
hiPSC-ECTs were subsequently loaded for 30 min at 37°C with a Fura-2 loading solution consisting of Krebs-Henseleit buffer supplemented with 5 μM Fura2-AM (Invitrogen) and 1% (v/v) Chremophor EL (Sigma-Aldrich) with constant oxygenation (95% O2, 5% CO2). Following Fura-2 loading, ECTs were allowed to recover for 40 min with perfusion with Krebs-Henseleit buffer at a rate of 1 ml/min and field-stimulation initiated at 1 Hz. Concurrent TF and CaTR transient data were recorded at pacing frequencies ranging from 0.5 to 2.5 Hz. Fura-2 fluorescence (a measure of intracellular calcium) was measured by alternately illuminating the preparation with 340- and 380-nm light (at a frequency of 250 Hz) while measuring the emission at 510 nm using IonOptix hardware and software (IonOptix). The emitted fluorescence and force data were stored for offline analysis as the 340- and 380-nm counts and as the ratio R = F340/F380. Data from force and intracellular free Ca2+-transient measurements were analyzed using IonWizard 6.0 software (IonOptix). Under each condition, force and/or intracellular-free calcium ion transients of 40 to 60 successive contractions were collected and averaged. These data were exported to Microsoft Excel, and the magnitude of force generated and/or calcium transients, as well as the kinetics of force generation and relaxation and/or calcium release and sequestration calculated.
Assessment of myofilament Ca2+ sensitivity in hiPSC-ECTs
ECTs were transferred to a model 801B small intact fiber test apparatus (Aurora Scientific) in Krebs-Henseleit buffer and sequentially stretched until maximal twitch force generation was achieved as described above. ECTs were then permeabilized similar to described previously (Giles et al., 2021; Patel et al., 2012). Krebs-Henseleit buffer was then replaced with room temperature relaxing solution and incubated for 10 min with buffer changes every 5 min. ECTs were then permeabilized for 30 min in relaxing solution containing 1% Triton X-100 and 0.25 mg/ml saponin before equilibration in fresh relaxing solution for 30 min with buffer changes every 10 min. ECTs were then incubated in a series of pre-activating and activating solutions until steady-state forces were achieved at 22°C as previously described (Giles et al., 2021). Solution compositions were calculated using the computer program of Fabiato (1988), and stability constants were corrected to pH 7.0 and 22°C for all solutions (Godt and Lindley, 1982). The composition of pre-activating solution was (in mM) 100 N,N-Bis(2-hydroxyethyl)-2-aminoethanesulfonic acid (BES), 15 creatine phosphate, 5 dithiothreitol (DTT), 4 MgATP, 1 free Mg2+, and 0.07 EGTA. Activating solution contained (in mM) 100 BES, 15 creatine phosphate, 7 EGTA, 5 DTT, 4 MgATP, and 1 free Mg2+, with [Ca2+]free (pCa) ranging from 1 nM (i.e., pCa 9.0) to 32 µM (i.e., pCa 4.5). A range of submaximal pCa solutions containing different [Ca2+]free were prepared by mixing pCa 9.0 and pCa 4.5 solutions. The ionic strength of the pre-activating and activating solutions was adjusted to 180 mM using potassium propionate.
Cryopreservation, sectioning, and immunohistochemistry
hiPSC-ECT were incubated in 30 mM 2,3-butanedione monoxime (BDM) in DPBS for 5 min to inhibit contraction and promote the relaxed state. Next, hiPSC-ECT were incubated in filtered 30% sucrose (in DPBS) solution for 1 h at room temperature, followed by a 1-h incubation in a 1:1 mixture of optimal cutting temperature (OCT) compound (Tissue-Tek) and 30% sucrose solution in DPBS. The sucrose solution was then removed and hiPSC-ECTs were covered with OCT compound before freezing. Cryopreserved hECTs were then sectioned lengthwise at 6 µm thickness (CM 1950UV; Leica), mounted onto charged slides (Superfrost+; Fisherbrand), fixed in 100% acetone for 15 min at 4°C, and dried. Slides were placed in a vertical washer and rinsed with running tap water for 10 min to remove residual OCT. Slides were then rehydrated in PBS, and incubated in blocking buffer (0.15% Triton-X-100, 5% normal goat serum, and 2 mg/ml BSA in PBS) for 1 h at room temperature or overnight at 4°C. Sections were incubated with primary antibodies overnight in a humidified chamber at 4°C with anti-cMyBP-C (1:1,000 rabbit polyclonal antibody; Harris et al., 2002), and α-actinin (1:1,000, A7811; Sigma-Aldrich). Slides were incubated with secondary antibodies (Alexa Fluor Plus 647 and 488; Invitrogen) at 5–8 µg/ml in blocking buffer for 1 h at room temperature in a humidified chamber. Following labeling, sections were coverslipped using Prolong Gold Antifade Reagent (Invitrogen) with 4′,6 diamidino-2-phenylindole (DAPI) to label nuclei. Imaging was performed at room temperature using Nikon Eclipse 90i photomicroscope using the S Fluor 40× objective, and NIS Elements imaging software (version 4.0; Nikon).
Western blot analysis
Proteins from monolayer hiPSC-CM and ECTs were harvested in RIPA buffer and quantified using BCA-assay (Bio-Rad). 7.5 μg of protein were electrophoresed on 4–15% TGX Criterion gels (Bio-Rad) and transferred to Immobilon-FL membranes (Millipore). Membranes were subsequently blocked for 1 h with Odyssey blocking buffer (Li-Cor) prior to overnight hybridization with primary specific antibodies. Membranes were incubated with a rabbit anti-cMyBP-C polyclonal antibody diluted at 1:10,000 (Harris et al., 2002), mouse anti-α-actinin monoclonal antibody diluted at 1:2,000 (A7811; Sigma-Aldrich), and a rabbit anti-GAPDH monoclonal antibody diluted at 1:2,000 (G9545; Sigma-Aldrich). Primary antibodies were subsequently visualized by incubating the membranes for 1 h in donkey anti-goat IgG (AlexaFluor 546; Life Technologies) or goat anti-rabbit IgG (AlexaFluor 647; Life Technologies) immunofluorescent secondary antibodies diluted at 1:10,000 using a ChemiDoc MP imaging system (Bio-Rad) according to the manufacturer’s protocols.
Capillary immunoassay
Capillary immunoassays were performed to assess the phosphorylation status of cMyBP-C at serines 284 and 304, as well as to quantify total cMyBP-C levels. Capillary immunoassays were performed on a Jess instrument (BioTechne) using a 12–230 kD kit according to the manufacturer’s RePlex protocol, allowing for quantification of phospho-cMyBP-C and total cMyBP-C in a single capillary. In short, 100 ng of protein were loaded per capillary. Phospho-Ser284 and 304 cMyBP-C were detected with rabbit anti-Ser284 and anti-Ser304 antibodies (Kuster et al., 2013) diluted 1:50, and visualized using an anti-rabbit HRP conjugated secondary antibody. Following stripping of the anti-Ser284 and anti-Ser304 antibodies using Replex reagent (BioTechne), total cMyBP-C was detected with a rabbit anti-cMyBP-C antibody (Harris et al., 2002) diluted 1:300 and visualized using an anti-rabbit near-infrared-conjugated secondary antibody.
RNA extraction and qRT-PCR
Whole hiPSC-ECTs were snap-frozen in liquid nitrogen post physiological testing and stored at −80°C until RNA was isolated as described previously (Farrell et al., 2017). hiPSC-ECT were homogenized using TRIzol reagent (Ambion) and an appropriate amount of chloroform (MP Biomedicals) was added, according to the manufacturer’s instructions. After mixing, incubation, and centrifugation, the aqueous phase containing RNA was collected and treated with RNase-free DNase I (Qiagen) for 30 min before being treated using the Mini Total RNA Kit (Blood/Cultured Cells; IBI Scientific). RNA was quantified and quality was assessed using a NanoDrop spectrophotometer (Thermo Fisher Scientific). 25–50 ng total RNA was reverse-transcribed into first-strand cDNA with the iScript Reverse Transcription Supermix for RT-qPCR (Bio-Rad) following manufacturer’s protocols. 2.5 ng of resulting cDNA was used for qPCR analysis. Primers for assayed genes and appropriate controls were arrayed in MicroAmp Optical 96-well Reaction Plates (Applied Biosystems) and the PCR performed using the TaqMan Gene Expression Master Mix (Applied Biosystems). Real-time monitoring of TaqMan fluorescence was performed on the Stratagene Mx3005P qPCR system (Agilent Technologies). An initial activation step of 2 min at 50 and 95°C for 10 min was followed by 40 cycles of 15 s of denaturation at 95°C and 60 s of annealing/extension at 60°C. Data were analyzed in Excel, using a modified ΔΔCT method as previously described (de Lange et al., 2011), with PPIA used as a housekeeping control gene. TaqMan assay IDs used were: MYBPC3 (Hs01076217_m1) and PPIA (Hs99999904_m1; Applied Biosystems).
RNA-seq analysis
Total RNA was extracted from day-14 ECTs using the Direct-zol RNA MiniPrep kit (Zymo Research) according to the manufacturer’s protocol. Total RNA submitted to the University of Wisconsin-Madison Biotechnology Center was assayed for purity and integrity via the NanoDrop One Spectrophotometer and Agilent 2100 Bioanalyzer, respectively. RNA libraries were prepared from samples that met the TruSeq Stranded Total RNA Sample Preparation Guide (15031048 E) input guidelines using the Illumina TruSeq Stranded Total (Gold) RNA Sample Preparation kit (Illumina Inc.). For each library preparation, cytoplasmic ribosomal RNA was removed using biotinylated target-specific oligos combined with paramagnetic beads tagged with streptavidin. Following purification, the reduced RNA was fragmented using divalent cations under elevated temperature. Fragmented RNA was copied into first-stranded cDNA using SuperScript II Reverse Transcriptase (Invitrogen) and random primers. Second strand cDNA was synthesized using a modified dNTP mix (dTTP replaced with dUTP), DNA Polymerase I, and RNase H. Double-stranded cDNA was cleaned up with AMPure XP Beads (1X; Agencourt, Beckman Coulter). The cDNA products were incubated with Klenow DNA Polymerase to add a single “A” nucleotide to the 3′ end of the blunt DNA fragments. Unique dual indexes (UDI) were ligated to the DNA fragments and cleaned up with two rounds of AMPure XP beads (0.8×). Adapter ligated DNA was amplified by PCR and cleaned up with AMPure XP beads (0.8×). Final libraries were assessed for size and quantity using an Agilent DNA1000 chip and Qubit dsDNA HS Assay Kit (Invitrogen), respectively. Libraries were standardized to 2 nM. Paired-end 150 bp sequencing was performed, using standard SBS chemistry on an Illumina NovaSeq6000 sequencer. Images were analyzed using bcl2fastq v2.20.0.422. All samples passed appropriate quality control and we obtained a minimum of 7 × 10⁷ reads per sample. Transcriptomic data in this publication have been deposited in NCBI’s Gene Expression Omnibus (Edgar et al, 2002) and are accessible through GEO Series accession number GSE224129.
Bioinformatic analysis of transcriptomic data
Bioinformatic analysis of transcriptomic data adhere to recommended ENCODE guidelines and best practices for RNA-Seq (Consortium, 2016). Alignment of adapter-trimmed (Skewer v0.1.123; Jiang et al., 2014) 2 × 150 (paired-end; PE) bp strand-specific Illumina reads to the Homo sapiens GRCh38 genome (assembly accession GCA_000001405.25) was achieved with the Spliced Transcripts Alignment to a Reference (STAR v2.5.3a) software (Dobin et al., 2013). Expression estimation was performed with RSEM v1.3.0 (RNASeq by Expectation Maximization; Li and Dewey, 2011). To test for differential gene expression among individual group contrasts, expected read counts obtained from RSEM were used as input into edgeR (v3.16.5; Robinson et al., 2010). Inter-sample normalization was achieved among samples with trimmed mean of M-values (TMM; Robinson and Oshlack, 2010). Statistical significance of the negative-binomial regression test was adjusted with a Benjamini-Hochberg FDR correction at the 5% level (Reiner et al., 2003). Prior to statistical analysis with edgeR, independent filtering was performed, requiring a threshold of least 1 transcript count per million reads in at least 2 samples, ignoring any prior group assignment. The validity of the Benjamini-Hochberg FDR multiple testing procedure was evaluated by inspection of the uncorrected P value distribution. Enrichment analysis of differentially expressed genes was performed with KEGG (Kyoto Encyclopedia of Genes and Genomes; Kanehisa, 2002) curated pathways and clusterProfiler v3.14.0 (Yu et al., 2012). We subsequently performed gene ontology analysis (http://amigo.geneontology.org/amigo) and grouped together the genes involved in hypertrophic remodeling and those encoding sarcomeric proteins, genes involved in Ca2+-handling and of Ca2+-response genes, as well as genes involved in glucose metabolism and fatty acid oxidation. The Ca2+-handling and response group was supplemented with the CACNB1, RRAD, ASPHD2, S100A1, STIM1, ORAI1, TMEM109, JPH1, SLN, and APLN genes after consultation with Dr. Francisco Alvarado at the University of Wisconsin-Madison.
Blinding and randomization
Assessment of contractility in cardiac micropatterns was performed blinded. While assignment of ECTs into early and late groups was completely randomized, blinding of the investigator to the genotypes of ECTs for functional testing was not attainable, since the same individual was responsible for iPSC culture, CM differentiation, ECT generation and maintenance, as well as functional assessment.
Statistical analysis
For comparison of functional parameters between two groups, Student’s unpaired t test with Welch’s correction was used. For assessing the effect of adrenergic stimulation on functional parameters within a particular group, P values were calculated by paired t test. Ordinary one-way ANOVA with Tukey’s multiple comparisons test was used when comparing multiple groups in cases where the data displayed a normal distribution. In cases where the data did not display a normal distribution, as assessed by Shapiro-Wilk test, Kruskal-Wallis ANOVA was used. All statistical analyses were performed in GraphPad Prism 8.0.1 software and P values <0.05 were considered statistically significant. Data are plotted as box and whisker plots in which all data points are shown.
Additional data regarding CRISPR-Cas9 gene targeting, supporting data, and detailed data tables can be found in the supplemental text at the end of the PDF.
Online supplemental material
Fig. S1 shows CRISPR-Cas9 genome editing of exons 2 and 6 of MYBPC3. Fig. S2 lists immunohistochemical analysis of day 30 hiPSC-CM. Fig. S3 lists comparison of contractile and Ca2+-handling characteristics in two independent cMyBP-C−/− hiPSC-ECT lines. Fig. S4 lists quantification of cMyBP-C phosphorylation at serines 284 and 304 in cMyBP-C+/+ and cMyBP-C+/− hiPSC-ECTs. Fig. S5 lists transcriptomic analysis assessing the effect of cMyBP-C ablation in hiPSC-ECT on genes involved in nonsense-mediated mRNA-decay (NMD). Table S1 lists drop-off droplet digital PCR assays to detect NHEJ events resulting from CRISPR1 in exon 6 of MYBPC3 and CRISPR8 in exon 2 of MYBPC3. Table S2 lists CRISPR gRNA sequences and potential protein encoding off-target loci. Table S3 lists cMyBP-C expression in 2-D hiPSC and hiPSC-ECT. Table S4 lists assessment of strain development and Ca2+-handling in micropatterns. Table S5 lists gross characteristics of hiPSC-ECTs deficient in cMyBP-C. Table S6 lists effect of cMyBP-C ablation on contractile function in hiPSC-ECT. Table S7 lists effect of cMyBP-C ablation on Ca2+-handling in hiPSC-ECT. Table S8 lists effect of cMyBP-C ablation on Ca2+-sensitivity in hiPSC-ECT. Table S9 lists expression patterns of sarcomeric and hypertrophic genes. Table S10 lists expression patterns of Ca2+-handling and response genes. Table S11 lists expression patterns of cardiac metabolic genes.
Results
Gene targeting of exons 2 and 6 of MYBPC3 in DF19-9-11T.H hiPSCs introduced frame-shift mutations by NHEJ generating heterozygous (cMyBP-C+/−) and homozygous (cMyBP-C−/−) hiPSC clones (see supplemental text at the end of the PDF for details) that was used to generate hiPSC-CM and ECT. It should be noted that while these specific mutations are not found in HCM patient populations, they cause frame-shifts in the MYBPC3 transcript, leading to cMyBP-C truncation and is therefore likely to affect contractility and downstream remodeling in a similar fashion to the numerous HCM-causing frame-shift mutations found in MYBPC3 patients.
cMyBP-C expression in day 30 hiPSC-CM and ECT
We assessed cMyBP-C protein levels in day 30 lactate-selected hiPSC-CMs and hiPSC-ECT constructed from lactate selected day 30 hiPSC-CMs and CFs. For hiPSC-ECT, the day of ECT construction was considered day 0 of ECT age. Neither full length nor truncated cMyBP-C protein were detected in cMyBP-C−/− CM (Fig. 1 A and Table S3) or cMyBP-C−/− hiPSC-ECT (Fig. 1 F and Table S3). Interestingly, while cMyBP-C protein levels were similar in cMyBP-C+/− and cMyBP-C+/+ in hiPSC-CM (Fig. 1 A and Table S3), cMyBP-C protein levels were significantly decreased in cMyBP-C+/− hiPSC-ECT compared to cMyBP-C+/+ ECT (Fig. 1 F and Table S3). This level of cMyBP-C reduction in hiPSC-ECTs carrying a heterozygous cMyBP-C frame-shift mutation is consistent with the ∼30% cMyBP-C protein reduction found in the myocardium of patients and animal models carrying heterozygous cMyBP-C truncation mutations (Barefield et al., 2014; Barefield et al., 2015; Carrier et al., 2004; van Dijk et al., 2009; Vignier et al., 2009). Immunohistochemical analysis showed appropriate cMyBP-C distribution in cMyBP-C+/+ and cMyBP-C+/−, as evidenced by the characteristic doublet staining pattern between Z-disks in day 30 hiPSC-CM in monolayer (Fig. 1, C and D; and Fig. S2) and hiPSC-ECTs (Fig. 1, H and I). This pattern was absent in cMyBP-C−/− hiPSC-CM (Fig. 1 E and Fig. S2) and hiPSC-ECTs (Fig. 1 J).

Expression of cMyBP-C in hiPSC-CMs in monolayer culture and hiPSC-ECT. (A and F) Western blot analysis of cMyBP-C, α-actinin (ACTN), and GAPDH in day 30 hiPSC-CM (A) and hiPSC-ECT (F). The center and right-hand panels in A and F show cMyBP-C protein levels normalized to ACTN and GAPDH, respectively, cMyBP-C+/+, cMyBP-C+/−, and cMyBP-C−/− in day 30 hiPSC-CM (A) and hiPSC-ECT (F). (B–E, and G–J) Box and whisker plot of qRT-PCR assessment of MYBPC3 transcript levels in cMyBP-C+/+, cMyBP-C+/−, and cMyBP-C−/− day 30 hiPSC-CM (B) and hiPSC-ECT (G). Immunocytochemistry preformed on day 30 hiPSC-CM (C–E) and immunohistochemistry performed on hiPSC-ECT (H–J) showing cMyBP-C (green), α-actinin (red), and DAPI (blue) in cMyBP-C+/+ (C and H), cMyBP-C+/− (D and I), and cMyBP-C−/− (E and J). n ≥ 6 biological replicates; *P < 0.05; **P < 0.01; ***P < 0.001 as calculated by one-way ANOVA with Tukey’s multiple comparisons test; see Table S3 for specific P values.
Expression of cMyBP-C in hiPSC-CMs in monolayer culture and hiPSC-ECT. (A and F) Western blot analysis of cMyBP-C, α-actinin (ACTN), and GAPDH in day 30 hiPSC-CM (A) and hiPSC-ECT (F). The center and right-hand panels in A and F show cMyBP-C protein levels normalized to ACTN and GAPDH, respectively, cMyBP-C+/+, cMyBP-C+/−, and cMyBP-C−/− in day 30 hiPSC-CM (A) and hiPSC-ECT (F). (B–E, and G–J) Box and whisker plot of qRT-PCR assessment of MYBPC3 transcript levels in cMyBP-C+/+, cMyBP-C+/−, and cMyBP-C−/− day 30 hiPSC-CM (B) and hiPSC-ECT (G). Immunocytochemistry preformed on day 30 hiPSC-CM (C–E) and immunohistochemistry performed on hiPSC-ECT (H–J) showing cMyBP-C (green), α-actinin (red), and DAPI (blue) in cMyBP-C+/+ (C and H), cMyBP-C+/− (D and I), and cMyBP-C−/− (E and J). n ≥ 6 biological replicates; *P < 0.05; **P < 0.01; ***P < 0.001 as calculated by one-way ANOVA with Tukey’s multiple comparisons test; see Table S3 for specific P values.

Immunohistochemical analysis of day 30 hiPSC-CM. cMyBP-C+/+ (left panels), cMyBP-C+/− (center panels), and cMyBP-C−/− (right panels) labeled with cMyBP-C (green in merge), α-actinin (red in merge), and DAPI (blue in merge).
Immunohistochemical analysis of day 30 hiPSC-CM. cMyBP-C+/+ (left panels), cMyBP-C+/− (center panels), and cMyBP-C−/− (right panels) labeled with cMyBP-C (green in merge), α-actinin (red in merge), and DAPI (blue in merge).
qRT-PCR analysis showed similar MYBPC3 transcript levels in hiPSC-CMs in monolayer, irrespective of genotype (Fig. 1 B and Table S3). Unlike hiPSC-CM, heterozygous or homozygous ablation of cMyBP-C in hiPSC-ECT resulted in a significant and dose-dependent reduction in MYBPC3 transcript levels. This finding suggests that nonsense-mediated mRNA-decay (NMD) plays a larger role in the more mature hiPSC-ECT than in monolayer hiPSC-CM (Fig. 1 G and Table S3) and may contribute to the observed cMyBP-C haploinsufficiency. RNA-seq analysis of 14-d-old hiPSC-ECT revealed genotype-dependent differential expression of genes involved in NMD that was more pronounced in cMyBP-C−/− than cMyBP-C+/− hiPSC-ECT. Strikingly, the expression of UPF3B and RBM8A, enhancers of NMD were significantly upregulated, while expression of PABC1, a negative regulator of NMD, was significantly downregulated in cMyBP-C−/− hiPSC-ECT (Fig. S5).

Comparison of contractile and Ca 2+ -handling characteristics in two independent cMyBP-C −/− hiPSC-ECT lines. (A–H) Box and whisker plots of maximum twitch force amplitude (TF; A); time to peak developed force (CT100; B); time from peak to 50% twitch force decay (RT50; C) and time from 50 to 90% twitch force decay (RT50-90; D); cytoplasmic Ca2+-transient amplitude as estimated by the ∆F340/F380 ratio (Ca2+TR; E); time to Ca2+-transient peak (Ca2+T100; F); time from Ca2+-transient peak to 50% decay (Ca2+DT50; G) and time from 50 to 75% Ca2+-transient decay (Ca2+DT50-75; H) in DF-CR8 12-1 (grey boxes; n ≥ 15 biological replicates) and DF-CR8-18 (hashed boxes; n ≥ 3 biological replicates) hiPSC-ECT carrying cMyBP-C compound heterozygous and homozygous frame-shift mutations. All experiments were performed at 37°C with pacing at 1.5 Hz. Absolute P values calculated by Student’s unpaired t test with Welch’s correction indicated in each panel.
Comparison of contractile and Ca 2+ -handling characteristics in two independent cMyBP-C −/− hiPSC-ECT lines. (A–H) Box and whisker plots of maximum twitch force amplitude (TF; A); time to peak developed force (CT100; B); time from peak to 50% twitch force decay (RT50; C) and time from 50 to 90% twitch force decay (RT50-90; D); cytoplasmic Ca2+-transient amplitude as estimated by the ∆F340/F380 ratio (Ca2+TR; E); time to Ca2+-transient peak (Ca2+T100; F); time from Ca2+-transient peak to 50% decay (Ca2+DT50; G) and time from 50 to 75% Ca2+-transient decay (Ca2+DT50-75; H) in DF-CR8 12-1 (grey boxes; n ≥ 15 biological replicates) and DF-CR8-18 (hashed boxes; n ≥ 3 biological replicates) hiPSC-ECT carrying cMyBP-C compound heterozygous and homozygous frame-shift mutations. All experiments were performed at 37°C with pacing at 1.5 Hz. Absolute P values calculated by Student’s unpaired t test with Welch’s correction indicated in each panel.

Quantification of cMyBP-C phosphorylation at serines 284 and 304 in cMyBP-C +/+ and cMyBP-C +/− hiPSC-ECTs. Digital lane view images capillary immunoassay assessing phosphorylation levels of serine 284 (first panel) and serine 304 (third panel). Digital lane view capillary immunoassay images showing total cMyBP-C in the corresponding capillaries are shown in the second and fourth panels. Quantification of serine 284 and serine 304 phosphorylation, normalized to total cMyBP-C are shown as box and whisker plots on the right. n = 4 biological replicates; absolute P values calculated by Student’s unpaired t test with Welch’s correction indicated in each panel.
Quantification of cMyBP-C phosphorylation at serines 284 and 304 in cMyBP-C +/+ and cMyBP-C +/− hiPSC-ECTs. Digital lane view images capillary immunoassay assessing phosphorylation levels of serine 284 (first panel) and serine 304 (third panel). Digital lane view capillary immunoassay images showing total cMyBP-C in the corresponding capillaries are shown in the second and fourth panels. Quantification of serine 284 and serine 304 phosphorylation, normalized to total cMyBP-C are shown as box and whisker plots on the right. n = 4 biological replicates; absolute P values calculated by Student’s unpaired t test with Welch’s correction indicated in each panel.

Transcriptomic analysis assessing the effect of cMyBP-C ablation in hiPSC-ECT on genes involved in NMD. (A and B) Log fold change vs. −log FDR volcano plots of cMyBP-C+/+ vs. cMyBP-C+/− (A), and cMyBP-C+/+ vs. cMyBP-C−/− (B), and a heat map comparing gene expression in cMyBP-C+/+, cMyBP-C+/−, and cMyBP-C−/− hiPSC-ECTs of genes involved in the NMD pathway. (C) In volcano plots, differentially expressed genes (FDR < 0.05) are plotted as red dots. In heat maps (C), red indicates upregulated genes, while blue indicates genes that are downregulated. Z-scores >15 are highlighted in bright red.
Transcriptomic analysis assessing the effect of cMyBP-C ablation in hiPSC-ECT on genes involved in NMD. (A and B) Log fold change vs. −log FDR volcano plots of cMyBP-C+/+ vs. cMyBP-C+/− (A), and cMyBP-C+/+ vs. cMyBP-C−/− (B), and a heat map comparing gene expression in cMyBP-C+/+, cMyBP-C+/−, and cMyBP-C−/− hiPSC-ECTs of genes involved in the NMD pathway. (C) In volcano plots, differentially expressed genes (FDR < 0.05) are plotted as red dots. In heat maps (C), red indicates upregulated genes, while blue indicates genes that are downregulated. Z-scores >15 are highlighted in bright red.
Assessment of strain development and Ca2+ handling in micropatterns
Day 30 cMyBP-C+/+, cMyBP-C+/−, and cMyBP-C−/− hiPSC-CM were seeded into Matrigel micropatterns on a 40 kPa substrate and cultured for 6 d. Immunohistochemical analysis revealed similar cell size and cell density of micropatterns between genotypes (Fig. 2, A–C). Contractile strain measurements on spontaneously contracting micropatterns revealed significantly increased maximal strain produced in cMyBP-C−/− micropatterns compared to either cMyBP-C+/+ or cMyBP-C+/− (Fig. 2 D and Table S4). We next analyzed Ca2+ handing in single hiPSC-CM in micropatterns paced at 0.5 Hz. Overall, resting Ca2+ concentrations, Ca2+ transient amplitudes, and Ca2+-handling kinetics were similar between the three genotypes, although Ca2+-release time (Ca2+T100) was slightly but significantly faster in cMyBP-C+/− CM than in the other two groups (Fig. 2, E–G; and Table S4). In order to assess SR Ca2+-load hiPSC-CM on micropatterns were exposed to caffeine. Although caffeine transients (CaffTR) were slightly but significantly lower in cMyBP-C+/− than in cMyBP-C+/+ micropatterned hiPSC-CM (Fig. 2 H and Table S3), fractional Ca2+-release Ca2+TR/CaffTR were not significantly different between the three groups (Fig. 2 I and Table S3). Overall, data collected from micropatterns are quite similar to that observed in mouse ECT lacking cMyBP-C, i.e., an increase in force production with no significant changes in Ca2+ handling (de Lange et al., 2011).

Effect of cMyBP-C ablation on strain and Ca2+-handling properties in hiPSC-CM plated on micropatterns. (A–C) Images of cMyBP-C+/+ (A), cMyBP-C+/− (B), and cMyBP-C−/− (C) hiPSC-ECT immune-stained for α-actinin (green fluorescence) and β-catenin (white fluorescence). (D–I) Box and whisker plots of maximum strain produced (D); cytoplasmic Ca2+-transient amplitude as estimated by the ∆F340/F380 ratio (Ca2+TR; E); time to Ca2+-transient peak (Ca2+T100; F); time from Ca2+-transient peak to 50% decay (Ca2+DT50; G); cytoplasmic Ca2+-transient amplitude following caffeine administration as estimated by the ∆F340/F380 ratio (CaffTR; H); and fractional SR Ca2+ release as estimated by the Ca2+TR/CaffTR ratio (H). n ≥ 21 biological replicates; *P < 0.05; **P < 0.01; ***P < 0.001 as calculated by one-way ANOVA with Tukey’s multiple comparisons test; see Table S4 for specific P values.
Effect of cMyBP-C ablation on strain and Ca2+-handling properties in hiPSC-CM plated on micropatterns. (A–C) Images of cMyBP-C+/+ (A), cMyBP-C+/− (B), and cMyBP-C−/− (C) hiPSC-ECT immune-stained for α-actinin (green fluorescence) and β-catenin (white fluorescence). (D–I) Box and whisker plots of maximum strain produced (D); cytoplasmic Ca2+-transient amplitude as estimated by the ∆F340/F380 ratio (Ca2+TR; E); time to Ca2+-transient peak (Ca2+T100; F); time from Ca2+-transient peak to 50% decay (Ca2+DT50; G); cytoplasmic Ca2+-transient amplitude following caffeine administration as estimated by the ∆F340/F380 ratio (CaffTR; H); and fractional SR Ca2+ release as estimated by the Ca2+TR/CaffTR ratio (H). n ≥ 21 biological replicates; *P < 0.05; **P < 0.01; ***P < 0.001 as calculated by one-way ANOVA with Tukey’s multiple comparisons test; see Table S4 for specific P values.
Effect of cMyBP-C ablation on morphology and contractile function of hiPSC-ECT
Morphologic and functional characteristics were assessed in cMyBP-C+/+, cMyBP-C+/−, and cMyBP-C−/− hiPSC-ECT at early (14–28 d in ECT culture) and late (40–54 d in ECT culture) stages as was done in previous studies (Cai et al., 2019; de Lange et al., 2021; Melby et al., 2021). There were no significant genotype-dependent differences in ECT age or baseline automaticity within the early and late hiPSC-ECT groups (Table S5). The cross-sectional area (CSA) of late cMyBP-C+/− ECTs were, however, significantly greater than that of either cMyBP-C+/+ or cMyBP-C−/− late hiPSC-ECTs (Table S5). Subsequent measures of contractile force were normalized to the CSA of the ECT.
Early and late hiPSC-ECTs were paced at 1.5 Hz to assess the effects of heterozygous and homozygous cMyBP-C ablation in a fully integrated and isogenic human culture model. Overall, cMyBP-C haploinsufficiency and ablation had only minor effects on contractile function in early hiPSC-ECTs, though maximal TF was significantly lower in cMyBP-C−/− as compared to cMyBP-C+/+ in early hiPSC-ECTs (Table S6). However, at the late timepoint the decrease in TF was pronounced, while cMyBP-C+/− ECTs produced intermediate TF (Fig. 3, A and C; and Table S6). These data stand in contrast to data from intact murine ECTs and murine permeabilized myocardium lacking endogenous cMyBP-C in which TF and power were increased (de Lange et al., 2013; de Lange et al., 2011; Korte et al., 2003), suggesting a progressive phenotype with a dose-dependent decrease in force production. Early relaxation kinetics (RT50) were marginally faster in cMyBP-C+/− compared to cMyBP-C+/+ hiPSC-ECTs at both early and late timepoints (Fig. 3, B, C, and G; and Table S6). Most strikingly, late relaxation (RT50-90) was significantly slowed in cMyBP-C−/− ECTs when compared to both cMyBP-C+/+ and cMyBP-C+/− ECTs at both timepoints (Fig. 3, B, D, and H; and Table S6). As cMyBP-C phosphorylation affects maximal force production and the rates of contraction and relaxation, we assessed phosphorylation of cMyBP-C at serines 284 and 304, but did not find cMyBP-C haploinsufficiency to significantly affect phosphorylation of either residue (Fig. S4). Although our data show that the ablation of cMyBP-C speeds contraction kinetics, these differences were relatively small when compared to the speeding of kinetics we observed in murine ECTs or others observed in permeabilized tissue in cMyBP-C−/− mouse models (de Lange et al., 2013; de Lange et al., 2011; Stelzer et al., 2006a; Stelzer et al., 2006b; Stelzer et al., 2007).

Effect of cMyBP-C ablation on contractile function in hiPSC-ECT. (A and B) Absolute (A) and normalized (B) averaged twitch force traces of 40–54 d old cMyBP-C+/+ (broken traces), cMyBP-C+/− (grey traces), and cMyBP-C−/− (black traces) hiPSC-ECTs. (C and D) Normalized average traces focusing on the time from peak to 50% (RT50; C) and from 50 to 90% twitch force decay (RT50-90; D). (E–H) Box and whisker plots of maximum twitch force amplitude (TF; E); time to peak twitch force (CT100; F); time from peak to 50% twitch force decay (RT50; G) and time from 50 to 90% twitch force decay (RT50-90; H). All experiments were performed at 37°C with pacing at 1.5 Hz. n ≥ 17 biological replicates; *P < 0.05; ***P < 0.001 as calculated by one-way ANOVA with Tukey’s multiple comparisons test; see Table S6 for specific P values.
Effect of cMyBP-C ablation on contractile function in hiPSC-ECT. (A and B) Absolute (A) and normalized (B) averaged twitch force traces of 40–54 d old cMyBP-C+/+ (broken traces), cMyBP-C+/− (grey traces), and cMyBP-C−/− (black traces) hiPSC-ECTs. (C and D) Normalized average traces focusing on the time from peak to 50% (RT50; C) and from 50 to 90% twitch force decay (RT50-90; D). (E–H) Box and whisker plots of maximum twitch force amplitude (TF; E); time to peak twitch force (CT100; F); time from peak to 50% twitch force decay (RT50; G) and time from 50 to 90% twitch force decay (RT50-90; H). All experiments were performed at 37°C with pacing at 1.5 Hz. n ≥ 17 biological replicates; *P < 0.05; ***P < 0.001 as calculated by one-way ANOVA with Tukey’s multiple comparisons test; see Table S6 for specific P values.
Effect of cMyBP-C ablation on Ca2+ handling in hiPSC-ECT
Since many of the contractile kinetic parameters were similar between the three groups of hiPSC-ECTs, we postulated that alterations in Ca2+-handling kinetics may modulate or mask the effect of cMyBP-C ablation on crossbridge kinetics. Following loading of hiPSC-ECTs with Fura2-AM, cytoplasmic Ca2+ was measured with pacing at 1.5 Hz. At the early timepoint, overall Ca2+-handling and kinetic measurements were similar between the three genotypes with the only statistically significant difference being a marginal decrease in Ca2+-transient amplitude (Ca2+TR) in cMyBP-C−/− hiPSC-ECT when compared to cMyBP-C+/+ hiPSC-ECT, and a trend toward slower Ca2+-release rates (Table S7). At the late timepoint, however, the Ca2+TR was severely depressed in cMyBP-C−/− hiPSC-ECTs when compared to either cMyBP-C+/+ or cMyBP-C+/− hiPSC-ECTs (Fig. 4, A and D; and Table S7). Additionally, the time to Ca2+ transient peak (Ca2+T100) was significantly prolonged in cMyBP-C−/− or cMyBP-C+/− hiPSC-ECTs and was correlated with cMyBP-C content, while Ca2+ transient decay times (Ca2+DT50 and Ca2+DT50-75) were similar between the three groups of hiPSC-ECTs (Fig. 4, B, E–G; and Table S7). Strikingly in concurrent twitch force and Ca2+-transient measurements, the time interval between the Ca2+ transient and force peaks was significantly shortened by cMyBP-C haploinsufficiency and ablation (Fig. 5 C and Table S7). Absolute and normalized twitch force–Ca2+ transient hysteresis loops provide further visualization of the force–Ca relationship (Fig. 5, A and B; Tong et al., 2015). Normalized hysteresis loops became “narrower” with decreased hysteresis areas by cMyBP-C haploinsufficiency or ablation (Fig. 5, B and D; and Table S7), suggesting underlying alterations in the force–Ca2+ relationship. We postulated that the decrease in time from Ca2+ peak to force peak, as well as the decrease in normalized hysteresis area, which was more pronounced in cMyBP-C−/− than in cMyBP-C+/− hiPSC-ECTs, were caused by an increase in myofilament Ca2+ sensitivity.

Effect of cMyBP-C ablation on Ca2+handling in hiPSC-ECT. (A and B) Absolute (A) and normalized (B) averaged Ca2+ transient (Ca2+TR) traces in day 40–54 cMyBP-C+/+ (broken traces), cMyBP-C+/− (grey traces), and cMyBP-C−/− (black traces) hiPSC-ECTs loaded with Fura2-AM. (C) Normalized average traces focusing on the time from Ca2+ peak to 50% Ca2+-transient decay (Ca2+DT50). (D–G) Box and whisker plots of cytoplasmic Ca2+-transient amplitude as estimated by the ∆F340/F380 ratio (Ca2+TR; D); time to Ca2+-transient peak (Ca2+T100; E); time from Ca2+-transient peak to 50% decay (Ca2+DT50; F) and time from 50 to 75% Ca2+-transient decay (Ca2+DT50-75; G) in hiPSC-ECT. All experiments were performed at 37°C with pacing at 1.5 Hz. n ≥ 11 biological replicates; *P < 0.05; **P < 0.01; ***P < 0.001 as calculated by one-way ANOVA with Tukey’s multiple comparisons test; see Table S7 for specific P values.
Effect of cMyBP-C ablation on Ca2+handling in hiPSC-ECT. (A and B) Absolute (A) and normalized (B) averaged Ca2+ transient (Ca2+TR) traces in day 40–54 cMyBP-C+/+ (broken traces), cMyBP-C+/− (grey traces), and cMyBP-C−/− (black traces) hiPSC-ECTs loaded with Fura2-AM. (C) Normalized average traces focusing on the time from Ca2+ peak to 50% Ca2+-transient decay (Ca2+DT50). (D–G) Box and whisker plots of cytoplasmic Ca2+-transient amplitude as estimated by the ∆F340/F380 ratio (Ca2+TR; D); time to Ca2+-transient peak (Ca2+T100; E); time from Ca2+-transient peak to 50% decay (Ca2+DT50; F) and time from 50 to 75% Ca2+-transient decay (Ca2+DT50-75; G) in hiPSC-ECT. All experiments were performed at 37°C with pacing at 1.5 Hz. n ≥ 11 biological replicates; *P < 0.05; **P < 0.01; ***P < 0.001 as calculated by one-way ANOVA with Tukey’s multiple comparisons test; see Table S7 for specific P values.
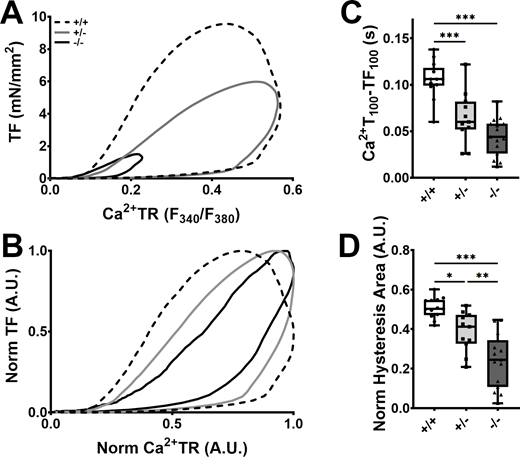
Effect of cMyBP-C ablation on the Ca2+–force relationship in hiPSC. (A and B) Averaged absolute (A) and normalized (B) twitch force (TF) vs. Ca2+ transient (Ca2+TR) hysteresis loop traces in day 40–54 cMyBP-C+/+ (broken traces), cMyBP-C+/− (grey traces), and cMyBP-C−/− (black traces) hiPSC-ECTs loaded with Fura2-AM (concurrent TF and Ca2+ measurements). (C and D) Box and whisker plots of the time interval from Ca2+ transient (Ca2+T100) peak to twitch force peak (CT100; C) and normalized hysteresis areas (D) in hiPSC-ECT. TF and Ca2+TR in B and D were normalized by expressing them as TF/TFmax and (F340/F380)/(F340/F380)Max. All experiments were performed at 37°C with pacing at 1.5 Hz. n ≥ 11 biological replicates; *P < 0.05; **P < 0.01; ***P < 0.001 as calculated by one-way ANOVA with Tukey’s multiple comparisons test; see Table S7 for specific P values.
Effect of cMyBP-C ablation on the Ca2+–force relationship in hiPSC. (A and B) Averaged absolute (A) and normalized (B) twitch force (TF) vs. Ca2+ transient (Ca2+TR) hysteresis loop traces in day 40–54 cMyBP-C+/+ (broken traces), cMyBP-C+/− (grey traces), and cMyBP-C−/− (black traces) hiPSC-ECTs loaded with Fura2-AM (concurrent TF and Ca2+ measurements). (C and D) Box and whisker plots of the time interval from Ca2+ transient (Ca2+T100) peak to twitch force peak (CT100; C) and normalized hysteresis areas (D) in hiPSC-ECT. TF and Ca2+TR in B and D were normalized by expressing them as TF/TFmax and (F340/F380)/(F340/F380)Max. All experiments were performed at 37°C with pacing at 1.5 Hz. n ≥ 11 biological replicates; *P < 0.05; **P < 0.01; ***P < 0.001 as calculated by one-way ANOVA with Tukey’s multiple comparisons test; see Table S7 for specific P values.
Effect of cMyBP-C ablation on Ca2+ sensitivity in hiPSC-ECT
Assessment of myofilament Ca2+ sensitivity using permeabilized hiPSC-ECTs allows control of intracellular Ca2+ concentration and dissociates the contractile characteristics from the observed Ca2+-handling abnormalities. We found maximal Ca2+-activated force to be similar between the three genotypes (Fig. 6, A and C; and Table S8). This finding stands in contrast to maximal twitch force in intact ECTs where homozygous cMyBP-C ablation resulted in a significant reduction in twitch force production, and suggests that twitch force reduction is primarily mediated by a reduction in Ca2+-transient amplitude, rather than at the crossbridge level. To our surprise, we found that the force–pCa curve was right-shifted, rather than left-shifted in cMyBP-C−/− hiPSC-ECT, with no difference between cMyBP-C+/+ and cMyBP-C+/− hiPSC-ECTs, indicating a decrease in Ca2+-sensitivity in the absence of cMyBP-C (Fig. 6, B, D, and F; and Table S8). Furthermore, the Hill coefficient was lower in cMyBP-C−/− hiPSC-ECT than in the other two groups (Fig. 6, B and E; and Table S8), indicating a reduction in cooperative activation of the thin filament in the absence of cMyBP-C. In addition to measuring Ca2+-sensitivity in permeabilized hiPSC-ECTs, we also calculated the maximal rate of force generation at various Ca2+ concentrations, and found that cMyBP-C ablation accelerates the rate of force generation at both submaximal (pCa 5.8) and maximal activating (pCa 4.5) Ca2+ concentrations (Fig. 6, G and H; and Table S8). These findings in our human cardiac model are consistent with what has been previously reported in permeabilized mouse heart tissue, where cMyBP-C ablation resulted in accelerated rates of force redevelopment (Stelzer et al., 2006b).

Effect of cMyBP-C ablation on myofilament Ca2+sensitivity in hiPSC-ECT. (A and B) Averaged absolute (A) and normalized (B) pCa vs. force traces in detergent permeabilized cMyBP-C+/+ (broken traces), cMyBP-C+/− (grey traces), and cMyBP-C−/− (black traces) hiPSC-ECTs. (C–H) Box and whisker plots of maximum Ca2+-activated force produced (C), pCa50 (D), and Hill coefficient (E), force at pCa 5.8 expressed as a fraction of maximum Ca2+-activated force (F), and the maximum velocities of force regeneration at pCa 5.8 (G) and pCa 4.5 (H). All experiments were performed at 37°C. n ≥ 11 biological replicates; *P < 0.05; **P < 0.01; ***P < 0.001 as calculated by one-way ANOVA with Tukey’s multiple comparisons test; see Table S8 for specific P values.
Effect of cMyBP-C ablation on myofilament Ca2+sensitivity in hiPSC-ECT. (A and B) Averaged absolute (A) and normalized (B) pCa vs. force traces in detergent permeabilized cMyBP-C+/+ (broken traces), cMyBP-C+/− (grey traces), and cMyBP-C−/− (black traces) hiPSC-ECTs. (C–H) Box and whisker plots of maximum Ca2+-activated force produced (C), pCa50 (D), and Hill coefficient (E), force at pCa 5.8 expressed as a fraction of maximum Ca2+-activated force (F), and the maximum velocities of force regeneration at pCa 5.8 (G) and pCa 4.5 (H). All experiments were performed at 37°C. n ≥ 11 biological replicates; *P < 0.05; **P < 0.01; ***P < 0.001 as calculated by one-way ANOVA with Tukey’s multiple comparisons test; see Table S8 for specific P values.
Transcriptomic analysis of hiPSC-ECT
To gain insight into the mechanisms underlying the contractile and Ca2+-handling abnormalities observed in late hiPSC-ECTs as a result of cMyBP-C haploinsufficiency and ablation, we performed RNA sequencing on 2-wk-old hiPSC-ECTs. Overall, we found expression levels of differentially expressed genes were often positively or negatively correlated with cMyBP-C levels with 1,360 genes differentially expressed when comparing cMyBP-C+/+ to cMyBP-C+/− hiPSC-ECT; 1,127 genes when comparing cMyBP-C+/− to cMyBP-C−/− hiPSC-ECT and 4,102 genes when comparing cMyBP-C+/+ to cMyBP-C−/− hiPSC-ECT (FDR < 0.05; Fig. 7 A). We subsequently performed gene ontology analysis (http://amigo.geneontology.org/amigo) and grouped together the genes involved in hypertrophic remodeling and those encoding sarcomeric proteins. When comparing cMyBP-C+/+ and cMyBP-C+/− hiPSC-ECT, we found 62/245 genes in this group to be differentially expressed, while 127/245 genes were differentially expressed when comparing cMyBP-C+/+ and cMyBP-C−/− hiPSC-ECT. Strikingly, many transcripts encoding components of the cardiac sarcomere, including NEB, ACTN2, ACTC1, and NEBL were significantly upregulated by cMyBP-C haploinsufficiency and ablation with expression levels inversely correlated with cMyBP-C levels. Interestingly, markers of cardiac hypertrophy, including upregulation of ACTA1, NPPA, FHL1, and XIRP2, as well as downregulation of MYH6 were only noted in cMyBP-C−/−, suggesting a differential hypertrophic response (Fig. 7 B and Table S9).

Transcriptomic analysis assessing the effect of cMyBP-C ablation in hiPSC-ECT. (A–D) Transcriptomic analysis of all genes expressed in hiPSC-ECTs (A), sarcomeric protein encoding and hypertrophic marker genes (B), genes involved in myocardial Ca2+ handling and signaling (C), and genes involved in glucose metabolism and fatty acid oxidation (D). In A–D, the leftmost panels show log-fold change vs. −log FDR volcano plots of cMyBP-C+/+ vs. cMyBP-C+/−; the center panels show log-fold change vs. −log FDR volcano plots of cMyBP-C+/+ vs. cMyBP-C−/−. In A, the rightmost plot shows a Venn diagram comparing gene expression in cMyBP-C+/+, cMyBP-C+/−, and cMyBP-C−/− hiPSC-ECTs, while in B–D they show heat maps comparing gene expression in cMyBP-C+/+, cMyBP-C+/−, and cMyBP-C−/− hiPSC-ECTs of genes in the respective GO pathways. In volcano plots, differentially expressed genes (FDR < 0.05) are plotted as red dots. In heat maps, red indicates upregulated genes, while blue indicates genes that are downregulated. Z-scores > 15 are highlighted in bright red.
Transcriptomic analysis assessing the effect of cMyBP-C ablation in hiPSC-ECT. (A–D) Transcriptomic analysis of all genes expressed in hiPSC-ECTs (A), sarcomeric protein encoding and hypertrophic marker genes (B), genes involved in myocardial Ca2+ handling and signaling (C), and genes involved in glucose metabolism and fatty acid oxidation (D). In A–D, the leftmost panels show log-fold change vs. −log FDR volcano plots of cMyBP-C+/+ vs. cMyBP-C+/−; the center panels show log-fold change vs. −log FDR volcano plots of cMyBP-C+/+ vs. cMyBP-C−/−. In A, the rightmost plot shows a Venn diagram comparing gene expression in cMyBP-C+/+, cMyBP-C+/−, and cMyBP-C−/− hiPSC-ECTs, while in B–D they show heat maps comparing gene expression in cMyBP-C+/+, cMyBP-C+/−, and cMyBP-C−/− hiPSC-ECTs of genes in the respective GO pathways. In volcano plots, differentially expressed genes (FDR < 0.05) are plotted as red dots. In heat maps, red indicates upregulated genes, while blue indicates genes that are downregulated. Z-scores > 15 are highlighted in bright red.
Assessment of genes involved in Ca2+ handling and of Ca2+-response genes revealed 31/123 genes to be differentially expressed, while 62/123 genes were differentially expressed between cMyBP-C+/+ and cMyBP-C−/− hiPSC-ECT. Many transcripts encoding proteins directly involved in Ca2+ handling and buffering, like TRDN, HRC, CASQ2, and SLC8A1 were significantly upregulated by cMyBP-C haploinsufficiency with expression levels often inversely correlated with cMyBP-C levels. Furthermore, expression of the genes encoding SLN and PLN, both encoding inhibitors of SERCA2a, were significantly upregulated specifically in cMyBP-C−/− hiPSC-ECTs. Together these findings suggest Ca2+-handling dysfunction characterized by impaired SR Ca2+ sequestration and increased intra-SR Ca2+ buffering, leading to decreased SR Ca2+ flux and greater reliance on extracellular Ca2+ exchange during excitation–contraction coupling. Finally, expression of the Ca2+-effector encoding genes, CAMK2D and MEF2C, were inversely correlated with cMyBP-C levels, suggesting an increased resting cytoplasmic Ca2+ concentration as the level of cMyBP-C decreased (Fig. 7 C and Table S10).
Assessment of genes involved in glucose metabolism and fatty acid oxidation identified 17/146 genes differentially expressed between cMyBP-C+/+ and cMyBP-C+/− hiPSC-ECT, while 52/146 genes were differentially expressed when compared to cMyBP-C−/− hiPSC-ECT. Interestingly, we observed an upregulation in metabolic/oxidative stress marker genes, including PRAKG2, HIF1A, and BNIP3, that were more pronounced in cMyBP-C−/− than in cMyBP-C+/− hiPSC-ECTs. Specifically, increased expression of PRAKG2, encoding the gamma 2 subunit of AMP activated protein kinase (AMPK), which acts as a low energy sensor in the cell, suggests energy depletion, potentially leading to upregulation of both glucose and fatty acid utilization. Furthermore, expression of a variety of peroxisome proliferator-activated receptors (PPARs) and PPAR co-activators is upregulated in response to cMyBP-C haploinsufficiency and ablation. PPAR activation causes upregulation of PDK4, encoding pyruvate dehydrogenase kinase 4, a key regulator of cardiac metabolism that stimulates fatty acid oxidation (Crewe et al., 2017). We found PDK4 to be the most upregulated of all metabolic genes in both cMyBP-C+/− and cMyBP-C−/− hiPSC-ECT (Fig. 7 D and Table S11).
Discussion
In humans, truncation mutations in MYBPC3 are common causes of HCM (Harris et al., 2011; O’Leary et al., 2019) and lead to disease due to haploinsufficiency, with heterozygous mutation carriers having 20–50% less cMyBP-C in the absence of detectable truncated cMyBP-C peptides (Marston et al., 2009; O’Leary et al., 2019; van Dijk et al., 2009). Haploinsufficiency develops in part through nonsense-mediated mRNA decay (Marston et al., 2009; van Dijk et al., 2009), as well as by clearance of the protein through the ubiquitin–proteasomal system (Marston et al., 2009; Sarikas et al., 2005). Since neither the precise mutation nor the location of the truncation mutation appear to influence cMyBP-C expression level or phenotypic presentation, MYBPC3 truncation mutations can be viewed as a single entity (O’Leary et al., 2019).
While cMyBP-C haploinsufficiency is well accepted as a disease mechanism in humans, recent studies using human cells have raised some doubts, since isogenic gene-edited iPSC-CM carrying heterozygous frame-shift mutations in MYBPC3 cultured in monolayer did not show evidence of reduced cMyBP-C protein (Helms et al., 2020; Seeger et al., 2019). Our data in monolayer cultures showed similar protein levels in day 30 cMyBP-C+/− and cMyBP-C+/+ hiPSC-CM. However, in 3-D-integrated hiPSC-ECTs, protein levels were 40–50% lower in cMyBP-C+/− than in cMyBP-C+/+ hiPSC-ECTs. These data are consistent with reduced cMyBP-C protein levels in human myectomy samples and support haploinsufficiency as a primary feature of the disease. While cMyBP-C transcribed from a single MYBPC3 allele may be sufficient to maintain normal protein levels in immature monolayer hiPSC-CM, perhaps by prolonging the half-life of full-length cMyBP-C (Helms et al., 2020), the same may not be true in more mature hiPSC-ECT that not only contain CM but also CFs (de Lange et al., 2021) or more mature monolayer cultures (Birket et al., 2015).
Functional effects of cMyBP-C haploinsufficiency in human cardiac tissue
In mice, heterozygous Mybpc3 truncation mutations manifest with varying levels of cMyBP-C in the myocardium but do not alter contractile function or Ca2+ handling at the whole organ level, and produces only mild, late-onset left ventricular hypertrophy in several models (Cheng et al., 2013; Glazier et al., 2019; Harris et al., 2002). However, in mouse permeabilized myocardium heterozygous cMyBP-C ablation marginally accelerates contraction kinetics at submaximal Ca2+ concentrations, thought to be due to reduced reliance on cooperative activation of the thin filament as a consequence of reduced binding of cMyBP-C to the thin filament (Cheng et al., 2013). In humans, MYBPC3 truncation mutations are associated with later onset HCM than mutations in MYH7 (Sedaghat-Hamedani et al., 2018), although age of presentation, disease severity, and progression are highly heterogeneous even within the same family (Field et al., 2021; Page et al., 2012). At the cellular level, permeabilized fibers obtained from patient samples carrying cMyBP-C truncation mutations show a significant reduction in maximal Ca2+-activated force (van Dijk et al., 2009). This decrease in force production was also noted in patient-derived iPSC-CMs with intact Ca2+-handling, and confirmed in control iPSC-CM subjected to RNAi knockdown of cMyBP-C (Birket et al., 2015; van Dijk et al., 2009). We show a similar decrease in maximal twitch force in isogeneic cMyBP-C+/− ECTs with a trend toward faster contraction kinetics, particularly in the relaxation phase. The absence of force decrease in cMyBP-C+/−CMs plated on micropatterns suggests a progressively developing contractile phenotype, rather than an immediate and direct result of cMyBP-C haploinsufficiency.
In human ECTs, the effect of cMyBP-C haploinsufficiency on contractility was relatively modest, but the rate of Ca2+-release was ∼34% slower in cMyBP-C+/− than in isogenic control hiPSC-ECTs. However, Ca2+ transient amplitude and the rate of Ca2+ transient decay were not affected. The slower Ca2+-release rate did not translate to slowing of the rate of contraction, suggesting that cMyBP-C haploinsufficiency alters the sarcomeric Ca2+–force relationship, which could potentially be explained by a left-shift in the force–pCa curve. Indeed, previous studies have shown a small but significant leftward shift in the force–pCa curve in patient samples, carrying cMyBP-C truncation mutations (van Dijk et al., 2009). We, however, found no difference in Ca2+ sensitivity in permeabilized cMyBP-C+/− ECTs. This discrepancy may reflect that patient samples were derived from individuals with advanced disease, resulting in differences in post-translational modifications of sarcomeric proteins, particularly decreased phosphorylation of cTnI that cause a leftward shift in myofilament Ca2+ sensitivity, rather than the direct effect of cMyBP-C haploinsufficiency (van Dijk et al., 2009). We therefore concluded that while cMyBP-C haploinsufficiency may cause an increase in Ca2+-sensitivity in advanced stages of disease, it does not primarily do so.
Functional effects of cMyBP-C ablation in human cardiac tissue
Although rare, individuals that either carry homozygous or compound heterozygous cMyBP-C truncation mutations present with early neonatal onset HCM that rapidly progress to heart failure (Xin et al., 2007; Zahka et al., 2008). In mice, homozygous ablation of cMyBP-C, or homozygous expression of cMyBP-C truncation mutations, results in a severely hypertrophied myocardium with myocyte disarray and fibrosis as well as dilated ventricles. These anatomical abnormalities are accompanied by both systolic and diastolic dysfunction (Carrier et al., 2004; de Lange et al., 2013; Harris et al., 2002; Korte et al., 2003; McConnell et al., 1999).
In permeabilized mouse ventricular preparations, however, cMyBP-C ablation resulted in accelerated rates of crossbridge formation without affecting maximal Ca2+-activated force (Stelzer et al., 2006a; Stelzer et al., 2006b), with no further acceleration upon phosphorylation by PKA (Stelzer et al., 2006c; Stelzer et al., 2007; Tong et al., 2008). These findings support the widely accepted conclusion that cMyBP-C acts as a brake on crossbridge formation, keeping a portion of the myosin heads sequestered tightly to the thick filament backbone, and that PKA-mediated phosphorylation releases this constraint. The relationship of myosin S2 to the thick filament backbone has significant implications for ATP consumption rate. Cardiac myosin molecules can be found in either an open state (DRX) that favors actin crossbridge formation and high intrinsic ATPase activity or a super-relaxed state (SRX), in which the myosin head is folded back on the thick filament backbone and is unable to form crossbridges with actin. The SRX state has low intrinsic ATPase activity and is facilitated by the interacting head motif that is stabilized by several inter- and intramolecular interactions between myosin and cMyBP-C (Nag et al., 2017; Trivedi et al., 2018). A large number of HCM-causing mutations, particularly in genes encoding the β myosin heavy chain and cMyBP-C, have been shown or are postulated to destabilize the SRX state, causing an increase in the number of DRX myosins (Alamo et al., 2017; McNamara et al., 2017; McNamara et al., 2016; Yadav et al., 2019). The resulting increase in the DRX/SRX ratio leads to a hyperdynamic contraction and significantly increased ATP consumption (Adhikari et al., 2016; Adhikari et al., 2019; Guhathakurta et al., 2017; Nag et al., 2017; Toepfer et al., 2020; Trivedi et al., 2018; Vander Roest et al., 2021; Zampieri et al., 2021). This has led to the unifying hypothesis that all thick filament and cMyBP-C HCM-causing mutations act in the same fashion and that carriers of these mutations may respond to reversible allosteric myosin ATPase inhibitors such as Mavacamten, which reduce both the probability of crossbridge formation and ATP turnover (Anderson et al., 2018). Mavacamten has shown promising results restoring contractile function in an animal model (Mamidi et al., 2018) and in providing symptomatic relief in clinical trials (Heitner et al., 2019), and is now approved for use in human HCM patients.
The notion that cMyBP-C ablation leads to hypercontractility due to increased DRX crossbridges is supported by data that show an increase in twitch force production in cMyBP-C−/− murine ECTs (de Lange et al., 2013; de Lange et al., 2011; Stöhr et al., 2013), as well as data presented here that micropatterned cMyBP-C−/− hiPSC-CMs produce more strain than cMyBP-C+/+ hiPSC-CMs. Surprisingly, cMyBP-C−/− hiPSC-ECTs present with a hypocontractile phenotype that more closely resembles that of the myocardium of humans and mice lacking cMyBP-C in vivo, where homozygous cMyBP-C truncation mutations, or cMyBP-C ablation, exhibited reduced ejection fraction (i.e., systolic dysfunction). Importantly, the hypercontractile phenotype associated with cMyBP-C ablation was only present in murine ECT (de Lange et al., 2013; de Lange et al., 2011; Stöhr et al., 2013) and human micropattern constructs displaying normal Ca2+ handling, while prominent Ca2+-handling abnormalities were present in hiPSC-ECTs. Ca2+-handling abnormalities appear to develop progressively over time in 3-D ECT culture. These data taken together suggest an evolving relationship between myofilament contractility and Ca2+ dynamics, which may be compensatory initially but ultimately does not prevent the hypertrophic remodeling that is the hallmark of severe disease in humans.
Progressive Ca2+ dysregulation as the driver of contractile dysfunction
In contrast to murine ECT and permeabilized fibers (de Lange et al., 2013; de Lange et al., 2011; Stelzer et al., 2006a; Stelzer et al., 2006b), contraction kinetics were not significantly affected by homozygous cMyBP-C ablation in hiPSC-ECT, with the exception of a significant prolongation of late relaxation (RT50-90), suggesting prolonged crossbridge dwell time. This slowing of late relaxation correlates with the prolongation in isovolumic relaxation time observed in cMyBP-C−/− mice and diastolic dysfunction observed in HCM patients with cMyBP-C truncation mutations, though the latter may be confounded by myocardial architecture remodeling (Harris et al., 2002; Michels et al., 2009). Although these findings may appear to contradict our understanding of cMyBP-C acting as an inhibitor of crossbridge formation and contractility by increasing the number of SRX crossbridges, they mimic the observed phenotype in human patients homozygous for cMyBP-C truncation mutations much more closely than either the murine ECT or hiPSC-CM plated on micropatterns.
Since we and others have shown that cMyBP-C phosphorylation or ablation can affect the Ca2+–force relationship (de Lange et al., 2011; Tong et al., 2015), we measured Ca2+ transients in intact hiPSC-ECT and Ca2+ sensitivity in permeabilized hiPSC-ECT. The reduction in Ca2+ transient amplitude by ∼59% in cMyBP-C−/− compared to cMyBP-C+/+ hiPSC-ECTs, corresponds well with the magnitude of twitch force reduction (∼62%). Interestingly, the low Ca2+ transient amplitude was accompanied by a significant slowing of the rate of Ca2+-release, while the rate of Ca2+ sequestration from the cytoplasm was not significantly different between the two groups. Unlike Ca2+-transient amplitude and twitch force magnitude, the slowing of Ca2+ release was not reflected in slower contraction kinetics, as the time to twitch force peak was unaffected by cMyBP-C ablation. These findings suggest that cMyBP-C ablation may indeed be associated with accelerated rates of crossbridge formation at submaximal Ca2+ concentrations, due to a decrease in SRX crossbridges, but that it fails to manifest as overall accelerated contraction kinetics due to a progressive slowing of the rate of Ca2+ release. Interestingly, when normalized twitch force are plotted against normalized Ca2+ transients, we observed a narrowing of the generated hysteresis loop with a significant decrease in hysteresis area in cMyBP-C−/− compared to cMyBP-C+/+ hiPSC-ECTs. Also, the time from the Ca2+ transient peak to peak developed twitch force is significantly shortened by cMyBP-C ablation. These two measures, both of which were less pronounced, but significantly altered by heterozygous ablation of cMyBP-C, suggest a shift in the Ca2+–force relationship at lower Ca2+ concentrations. Of note, a similar shift in the intact Ca2+–force relationship was also noted in cMyBP-C null murine ECTs (de Lange et al., 2013; de Lange et al., 2011), suggesting that while the contractile presentation may be varied between model systems, the net effect of cMyBP-C ablation on the Ca2+–force relationship is consistent.
Myofilament Ca2+-sensitivity is reduced by PKA-mediated phosphorylation of cTnI which causes a rightward shift in the pCa–force curve. The decrease in Ca2+ sensitivity is thought to speed myocardial relaxation in the setting of the increased Ca2+-transient amplitude and increased crossbridge formation that occur during adrenergic stimulation (Colson et al., 2010; Haworth et al., 2004). Both phosphorylation and ablation of cMyBP-C modulate myofilament Ca2+ sensitivity. We show that while cMyBP-C haploinsufficiency did not affect myofilament Ca2+ sensitivity, homozygous ablation caused a significant rightward shift in the pCa–force curve in cMyBP-C−/− hiPSC-ECT and a decrease in the Hill coefficient, suggesting a reduction in cooperative activation of the thin filament.
It is important to note that studies performed on human trabeculae obtained from patients carrying cMyBP-C truncation mutations show a leftward shift in the force–pCa relationship but a decrease in the Hill coefficient (Kresin et al., 2019; van Dijk et al., 2009). However, interpretations derived from these late-stage surgical myectomy samples may be confounded by undetected differences in posttranslational modification state of sarcomeric proteins, such as decreased cTnI phosphorylation, often seen in models of HCM and heart failure, may cause a leftward shift in myofilament Ca2+ sensitivity that may mask the pure effect of cMyBP-C ablation. Enhanced myocardial Ca2+ sensitivity in cMyBP-C mutation carriers is likely to be a secondary consequence of contractile dysfunction, adrenergic hyperactivation and desensitization, and impaired phosphorylation of Ca2+-handling proteins principally driven by decreased cTnI phosphorylation (van Dijk et al., 2009). Together, these data suggest that a leftward shift in the pCa–force relationship is not a primary feature of cMyBP-C ablation, nor HCM in general, as other HCM-causing mutations have also been associated with a rightward, rather than a leftward, shift in this relationship (Sewanan et al., 2021; Sweeney et al., 1998), but may rather be the downstream result of posttranslational modifications occurring in the hypertrophied or failing heart. Age, gender, and sarcomere length are implicated as factors that can also confound the effect of cMyBP-C ablation on sarcomeric Ca2+ sensitivity (Barefield et al., 2015). The human iPSC-ECT provides a platform that may mitigate some of these unavoidable patient-derived biosample confounders. All of the experiments here use isogeneic iPSC-ECT constructs as controls, with all tests performed in a narrow time window and at uniform, optimally stretched (long), sarcomere lengths. Furthermore, while the hiPSC-ECTs are relatively mature in their expression profile, function, and physiological responsiveness, we previously found that they predominantly express the unphosphorylatable slow skeletal isoform of TnI (Cai et al., 2019; de Lange et al., 2021; Melby et al., 2021), which significantly reduces the confounding effects of undetected variations in cTnI phosphorylation. Interestingly, a similar rightward shift was observed in cMyBP-C−/− mice co-expressing nonphosphorylatable cTnI (Chen et al., 2010).The observed rightward shift in the Ca2+–force relationship is supported by data showing that N-terminal cMyBP-C is able to activate the thin filament and increase Ca2+-sensitivity through displacement of the inhibitory complex from the blocked to the closed position (Herron et al., 2006; Razumova et al., 2006). Removal of this Ca2+ sensitization through cMyBP-C ablation would therefore desensitize the thin filament to Ca2+, leading to a rightward shift in the force–pCa curve.
Does the early transcriptional response to reduced cMyBP-C provide a clue on the path to HCM?
RNA-seq analysis of 2-wk-old hiPSC-ECTs shows differential expression of genes encoding components of the cardiac sarcomere and cardiac hypertrophy, myocardial Ca2+ handling/Ca2+ signaling, and myocardial energy production and metabolic stress, with the magnitude of differential expression of individual genes generally correlating with the amount of cMyBP-C present. The assessment of transcriptional changes at this early time, after the hiPSC-ECTs are well established, but before the development of significant functional abnormalities, was carried out intentionally to identify changes in the genes that regulate fundamental cellular processes in the setting of reduced levels of cMyBP-C.
Our findings suggest that cMyBP-C haploinsufficiency and ablation leads to metabolic stress as evidenced by upregulation of genes involved in substrate transport, glycolysis, and fatty acid oxidation. This response is consistent with an increase in DRX crossbridges in the setting of cMyBP-C haploinsufficiency or ablation, causing increased ATP demand (Toepfer et al., 2020). A cellular response through AMPK/PPAR-mediated upregulation of both glycolysis and fatty acid oxidation would seem plausible. Our observed upregulation of PLN and SLN, inhibitors of SERCA2a, may serve to reduce ATP consumption by SERCA2a in response to chronic ATP-depletion, leading to Ca2+-handling abnormalities that manifests as decreased SR–Ca2+ load (Gorski et al., 2015).
Expression of sarcolemmal Ca2+-channel encoding genes CACNA1D, CACNA1G, and SLC8A1 were all significantly upregulated by cMyBP-C haploinsufficiency and ablation, suggesting increased reliance on extracellular Ca2+ exchange. Over time, increased reliance on extracellular Ca2+ exchange would be expected to lead to increased diastolic Ca2+ concentrations, CaMKII activation, and aberrant phosphorylation of Ca2+-handling proteins such as PLN and RyR, further exacerbating Ca2+-handling defects (Robinson et al., 2018; Wu et al., 2019). Ca2+ dysregulation is known to lead to NFAT and ERK activation and translocation, potent mediators of hypertrophic signaling (Robinson et al., 2018). While we were unable to measure absolute resting cytoplasmic Ca2+ concentrations in our hiPSC-ECTs, findings of a decrease in the time from Ca2+ transient peak to force peak, and the reduction in hysteresis area, in the face of a rightward shift in Ca2+ sensitivity and decreased Ca2+ amplitude, suggests an increase in resting cytoplasmic Ca2+ concentrations.
Interestingly, similar to our findings, Seeger et al. (2019) found Ca2+-handling, sarcomeric, hypertrophic, and NMD pathways to be differentially regulated in a 2-D hiPSC-CM model carrying a cMyBP-C truncation mutation. Comparisons at the single-gene level between our data and that of Seeger et al. (2019) is, however, confounded by the fact that our ECT constructs contain CFs in addition to CMs. Additionally, while cMyBP-C frame-shifts, leading to cMyBP-C truncation, were caused by CRISPR-induced NHEJ events in our study, Seeger et al. (2019) differentiated their CMs from patient-derived iPSCs that carry a MYBPC3 frame-shift HCM-causing mutation. The fact that these 2-D hiPSC-CM were not cMyBP-C haploinsufficient (Seeger et al., 2019) suggests that some of the observed transcriptional dysregulation may be independent of cMyBP-C protein levels.
The observed transcriptional program response to reduced cMyBP-C, as well as the measured abnormalities in Ca2+ handling provide potential therapeutic targets as well as measurable indicators of the underlying pathophysiology. These measurable indicators of disease can be specifically interrogated when assessing the effectiveness of gene therapy approaches, HCM-targeted medical therapies such as Mavacamten, or when assessing the effectiveness of yet-to-be identified downstream mediators of the hypertrophic response.
Conclusions
Our data show hypercontractility as the primary phenotype at the sarcomere level in micropatterns and permeabilized hiPSC-ECTs in response to cMyBP-C haploinsufficiency and ablation. This is consistent with an increase in the DRX/SRX ratio, increasing the probability of actomyosin crossbridge formation. Progressive contractile dysfunction, accompanied by severe Ca2+-handling dysregulation suggests that secondary remodeling events, in which Ca2+-handling abnormalities play a prominent role, may be central to the developing HCM phenotype at the whole organ level. Currently, direct links between HCM-causing mutations and the progressive hypertrophic remodeling remain elusive. While signaling pathways are clearly implicated in linking mechanical stress at the Z-disk, Ca2+ dysregulation, and energy metabolism with the development of HCM, the driving mechanism(s) remains to be definitively identified. Our gene expression data suggest a transcriptional response to metabolic and Ca2+-handling abnormalities, and provide valuable mechanistic clues about how hypercontractility at the sarcomere level may lead to cardiac hypertrophy, hypocontractility, and failure at the whole organ level.
While use of novel medications, like Mavacamten, shows great promise for treatment of thick filament HCM, based on mechanisms that are supported by other studies (Ho et al., 2020; Olivotto et al., 2020; Toepfer et al., 2020; Zampieri et al., 2021) and here by our human ECT data, it is unclear whether this approach will be equally effective in treating thin filament and extra-sarcomeric HCM. Pharmaceutical interventions aimed at alleviating Ca2+-handling deficiencies, while not know to be effective in reversing established hypertrophic phenotypes, may warrant further consideration as potential adjunct therapies to prevent disease progression in early genotype-positive individuals. The advent and continued refinement of human in vitro cardiac tissue models should provide unique opportunities to advance discovery and lead to improvements in care.
Acknowledgments
Henk L. Granzier served as editor.
DF19-9-11T hiPSC-CFs was a kind gift from Dr. Timothy Kamp, University of Wisconsin-Madison, Madison, WI. The cMyBP-C phospho-Ser284 and phospho-Ser304 primary antibodies were kind gifts from Dr. Sakthivel Sadayappan, University of Cincinnati, Cincinnati, OH. The authors would like to thank Dr. Francisco Alvarado Guillen for fruitful discussions and suggestion of genes to add to the Ca2+-GO gene set. The authors utilized the University of Wisconsin—Madison Biotechnology Center’s Gene Expression Center Core Facility (RRID:SCR_017757) for RNA library preparation and the DNA Sequencing Facility (RRID:SCR_017759) for sequencing.
The authors also thank the University of Wisconsin Translational Research Initiatives in Pathology laboratory (TRIP), supported by the UW Department of Pathology and Laboratory Medicine, UWCCC (P30 CA014520) and the Office of The Director-National Institutes of Health (NIH; S10OD023526) for use of its facilities and services. This work was supported by NIH grant R01HL139883 (to J.C. Ralphe), and the Ellen and Arnold Wald Endowed Chair in Pediatric Research (to J.C. Ralphe).
The authors declare no competing financial interests.
Author contributions: W.J. de Lange was responsible for conceptualization, methodology, investigation, formal analysis, supervision and writing of the original draft, as well as review and editing of the manuscript. E.T. Farrell was responsible for conceptualization, methodology, investigation, formal analysis, as well as review and editing of the manuscript. J.J. Hernandez was responsible for methodology, investigation as well as review and editing of the manuscript. A. Stempien was responsible for methodology, investigation, formal analysis, and writing of the original draft, as well as review and editing of the manuscript. C.R. Kreitzer was responsible for investigation, and review and editing of the manuscript. D.R. Jacobs was responsible for investigation. D.L. Petty was responsible for investigation. R.L. Moss responsible for conceptualization, review and editing of the manuscript. W.C. Crone responsible for conceptualization, supervision, funding acquisition and review and editing of the manuscript. J.C. Ralphe was responsible for conceptualization, methodology, supervision, funding acquisition and writing of the original draft, as well as review and editing of the manuscript.
References
This work is part of a special issue on Myofilament Function 2022.

