


Several “primary atopic disorders” are linked to monogenic defects that attenuate TCR signaling, favoring T helper type 2 (TH2) cell differentiation. Patients with CARD11-associated atopy with dominant interference of NF-κB signaling (CADINS) disease suffer from severe atopy, caused by germline loss-of-function/dominant interfering (LOF/DI) CARD11 variants. The CARD11 scaffold enables TCR-induced activation of NF-κB, mTORC1, and JNK signaling, yet the function of CARD11-dependent JNK signaling in T cells remains nebulous. Here we show that CARD11 is critical for TCR-induced activation of JNK1 and JNK2, as well as canonical JUN/FOS AP-1 family members. Patient-derived CARD11 DI variants attenuated WT CARD11 JNK signaling, mirroring effects on NF-κB. Transcriptome profiling revealed JNK inhibition upregulated TCR-induced expression of GATA3 and NFATC1, key transcription factors for TH2 cell development. Further, impaired CARD11-JNK signaling was linked to enhanced GATA3 expression in CADINS patient T cells. Our findings reveal a novel intrinsic mechanism connecting impaired CARD11-dependent JNK signaling to enhanced GATA3/NFAT2 induction and TH2 cell differentiation in CADINS patients.
Introduction
Sufficient signal strength after TCR engagement is critical for the induction of transcriptional and metabolic programs that promote normal effector cell activation, differentiation, proliferation, and survival. Monogenic defects in humans can lead to alterations within these pathways and various immunological diseases, broadly classified as inborn errors of immunity (Tangye et al., 2022). Several “primary atopic disorders” have been linked to monogenic defects that attenuate TCR signaling, consistent with the paradigm that weaker TCR signal strength favors T helper type 2 (TH2) vs. TH1 cell differentiation (Milner, 2020). Caspase recruitment domain (CARD) containing protein 11 (CARD11) is a critical scaffold protein that connects antigen receptor engagement in both T and B lymphocytes to the induction of several transcriptional programs. CARD11-dependent signaling is conveyed through the assembly of a “CARD11-BCL10-MALT1 (CBM) complex” comprised of CARD11, the adaptor protein BCL10, and the scaffold/protease MALT1. This CBM signalosome serves as a platform for recruitment of additional effector kinases and ubiquitin-editing enzymes responsible for signal propagation. Several inborn errors of immunity have been linked to genetic aberrations in CARD11, including combined immunodeficiency, B cell expansion with NF-κB and T cell anergy disease, and CARD11-associated atopy with dominant interference of NF-κB signaling (CADINS) disease. This spectrum of disease results from homozygous null mutations causing complete loss of protein expression, heterozygous gain of function, or heterozygous loss of function/dominant interfering (LOF/DI) mutations, respectively (Lu et al., 2018).
Historically, we appreciate the importance of CARD11 for connecting TCR engagement to the stimulation of NF-κB; indeed, CBM complex function is often equated with NF-κB activation alone. However, recent studies have revealed a role for CARD11 in mechanistic target of rapamycin complex 1 (mTORC1) activation (Hamilton et al., 2014; Nakaya et al., 2014). Although this pathway remains underexplored, previous data from our group and others suggest that CBM signaling induces mTORC1 activity via upregulation of the glutamine transporter ASCT2, which is impaired in CBM KO mice and CADINS patient T cells (Ma et al., 2017; Nakaya et al., 2014). Various models have shown that mTORC1 can both activate and be activated by JNK (Wong et al., 2015; Walker et al., 2018; Bai et al., 2022). Additionally, CARD11 was shown to play a role in TCR-induced activation of JNK2 signaling (Blonska et al., 2007), and JNK2 activation was partially impaired in a mouse model of CADINS (Hutcherson et al., 2021). However, the function of CARD11-dependent JNK signaling in T cell activation and differentiation remains poorly understood, especially given the complexity of activator protein 1 (AP-1) transcription factor (TF) complexes governed by JNK and c-Jun.
CADINS disease patients exhibit a high prevalence of atopic disease, with ∼90% of reported patients having significant allergic disease (Lu et al., 2018). Atopy is ultimately driven by type 2 immune responses accompanied by enhanced IgE production, in which TH2 CD4+ T cells are responsible for producing inflammatory cytokines that drive B cell class switching to IgE (Akdis and Akdis, 2009). Interestingly, deletion of either JNK1 or JNK2 in mice has been shown to skew T cells toward a TH2 phenotype (Dong et al., 1998; Yang et al., 1998). Although we and others have shown that murine and human CD4+ T cells harboring CARD11 LOF/DI variants also exhibit TH2 skewing (Dadi et al., 2018; Hutcherson et al., 2021; Ma et al., 2017), a role for impaired JNK signaling in this phenomenon has never been examined. Moreover, the impact of CADINS patient–derived CARD11 variants on JNK signaling and downstream gene transcription has not been explored in detail. Here we aimed to thoroughly examine the effects of various CADINS patient–derived LOF/DI CARD11 variants on JNK signaling in human T cells, guided by the hypothesis that impaired CARD11-dependent JNK signaling also contributes to abnormal TH differentiation and atopic disease in CADINS patients.
Results
CARD11 is critical for the activation of both JNK1 and JNK2 in human T cells
Prior to evaluating the effects of patient-derived CARD11 variants on JNK signaling, we first validated our model system. WT or CARD11 KO Jurkat T cells were stimulated with PMA and ionomycin (P/I) for up to 60 min (Fig. 1 A). As previously described (Egawa et al., 2003; Hara et al., 2003; Pomerantz et al., 2002; Shambharkar et al., 2007), we observed no IκB⍺ degradation or p65 phosphorylation in CARD11 KO Jurkat T cells, confirming a loss of TCR-induced NF-κB signaling. Interestingly, we also observed a complete loss of JNK1 and JNK2 phosphorylation in CARD11 KO cells, in contrast to prior research findings demonstrating a selective loss of JNK2 p54 phosphorylation in CARD11-deficient T cells (Blonska et al., 2007). We confirmed that this discrepancy likely resulted from the prior study using a phospho-JNK antibody that is cross-reactive in detecting ERK phosphorylation (Fig. S1 A). WT or CARD11 KO Jurkat T cells were stimulated with P/I for 30 min in the presence of increasing doses of the MEK inhibitor, trametinib. The cross-reactive bands detected with the previously used phospho-JNK antibody disappeared in CARD11 KO Jurkat T cells in a dose-dependent manner. As previously described (Blonska et al., 2007), c-Jun phosphorylation and accumulation were largely absent in CARD11 KO cells after P/I stimulation, consistent with a complete loss of JNK activity. By contrast, ERK phosphorylation was unaffected in CARD11 KO cells (Fig. 1 A and Fig. S1 A). We further found that the protein translation inhibitor anisomycin could effectively induce JNK phosphorylation in these cells (Fig. 1 B) (Cano et al., 1994), indicating that the loss of P/I-induced JNK signaling in CARD11 KO Jurkat T cells was CARD11-dependent. Similar results were obtained using anti-CD3/anti-CD28 agonistic antibodies, albeit with significantly diminished signal strength overall (Fig. S1 B).

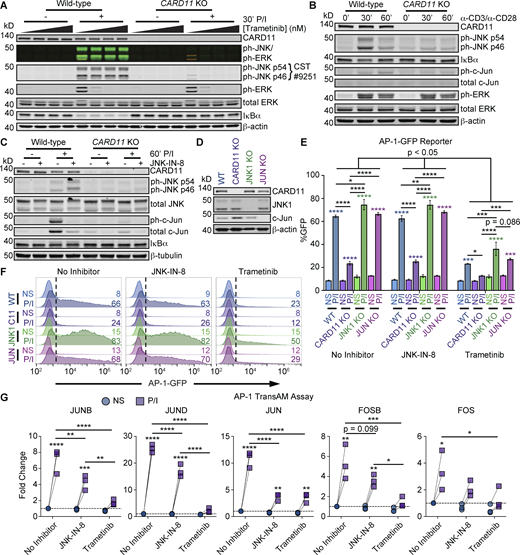
CARD11 KO leads to a loss of JNK and AP-1 activation. (A) Immunoblot analysis of CARD11-dependent and -independent pathways in WT or CARD11 KO Jurkat T cells stimulated with 20 ng/ml PMA and 1 μg/ml ionomycin (P/I) over time. (B) Immunoblot analysis of JNK and NF-κB signaling in WT or CARD11 KO Jurkat T cells stimulated for 30 min with P/I or 80 ng/ml anisomycin. (C and D) Flow cytometric analysis of WT or CARD11 KO Jurkat cells transfected with an AP-1–driven GFP reporter and stimulated with P/I for 6 h. (C) Quantitation of the %GFP+ in the absence or presence of 1 μM JNKi or 100 nM trametinib (n = 3). (D) Representative histograms demonstrating the GFP+ gate (dashed lines) and %GFP+ cells (numbers) summarized in C. (E) Representative immunoblot from transfected cells in C and D. (F) Quantitation of the fold change in AP-1 family member DNA binding, normalized to unstimulated WT (NS) for each family member, in WT or CARD11 KO Jurkat T cells stimulated with P/I for 2 h (n = 4). All immunoblots are representative of three independent experiments. Error bars indicate the SEM. Asterisks denote significance by two-way ANOVA followed by Šídák’s multiple comparisons test. *P < 0.05; **P < 0.01; ***P < 0.001; and ****P < 0.0001. EV, empty vector; NS/No stim., no stimulus. (G) Schematic detailing the effects of CARD11 KO on NF-κB activation, JNK1/2 phosphorylation/activation, and AP-1 activation. Created in BioRender. Bauman, B. (2025) https://biorender.com/s09c704. Source data are available for this figure: SourceData F1.
CARD11 KO leads to a loss of JNK and AP-1 activation. (A) Immunoblot analysis of CARD11-dependent and -independent pathways in WT or CARD11 KO Jurkat T cells stimulated with 20 ng/ml PMA and 1 μg/ml ionomycin (P/I) over time. (B) Immunoblot analysis of JNK and NF-κB signaling in WT or CARD11 KO Jurkat T cells stimulated for 30 min with P/I or 80 ng/ml anisomycin. (C and D) Flow cytometric analysis of WT or CARD11 KO Jurkat cells transfected with an AP-1–driven GFP reporter and stimulated with P/I for 6 h. (C) Quantitation of the %GFP+ in the absence or presence of 1 μM JNKi or 100 nM trametinib (n = 3). (D) Representative histograms demonstrating the GFP+ gate (dashed lines) and %GFP+ cells (numbers) summarized in C. (E) Representative immunoblot from transfected cells in C and D. (F) Quantitation of the fold change in AP-1 family member DNA binding, normalized to unstimulated WT (NS) for each family member, in WT or CARD11 KO Jurkat T cells stimulated with P/I for 2 h (n = 4). All immunoblots are representative of three independent experiments. Error bars indicate the SEM. Asterisks denote significance by two-way ANOVA followed by Šídák’s multiple comparisons test. *P < 0.05; **P < 0.01; ***P < 0.001; and ****P < 0.0001. EV, empty vector; NS/No stim., no stimulus. (G) Schematic detailing the effects of CARD11 KO on NF-κB activation, JNK1/2 phosphorylation/activation, and AP-1 activation. Created in BioRender. Bauman, B. (2025) https://biorender.com/s09c704. Source data are available for this figure: SourceData F1.
MEK inhibition with trametinib confirms that phospho-JNK antibody cross-reacts with phospho-ERK and that JNK-c-Jun signaling is a minor contributor to AP-1 signaling. (A) Immunoblot analysis of WT or CARD11 KO Jurkat T cells stimulated with 20 ng/ml PMA and 1 μg/ml ionomycin (P/I) for 30 min after pre-treatment with DMSO or increasing concentrations (10, 100, or 1,000 nM) of trametinib. (B) Immunoblot analysis of WT or CARD11 KO Jurkat T cells stimulated with 5 μg/ml plate-bound anti-CD3 and 5 μg/ml soluble anti-CD28 agonistic antibodies for 30 or 60 min. (C) Immunoblot analysis of WT or CARD11 KO Jurkat T cells stimulated with 20 ng/ml PMA and 1 μg/ml ionomycin (P/I) for 60 min after pre-treatment with DMSO or 1 μM JNK inhibitor (JNKi). (D) Immunoblot analysis of WT, CARD11 KO, MAPK8 (JNK1) KO, or JUN (c-Jun) KO Jurkat T cells from E and F. (E and F) Flow cytometric analysis of WT, CARD11 KO, MAPK8 (JNK1) KO, or JUN (c-Jun) KO Jurkat T cells transfected with an AP-1–driven GFP reporter and stimulated with P/I for 6 h. (E) Quantitation of the %GFP+ in the absence or presence of 1 μM JNKi or 100 nM trametinib (n = 3). (F) Representative histograms demonstrating the GFP+ gate (dashed lines) and %GFP+ cells (numbers) summarized in E. (G) Quantitation of the fold change in AP-1 family member DNA binding, normalized to unstimulated, uninhibited WT (NS) for each family member, in WT Jurkat T cells stimulated with P/I for 2 h in the absence or presence of 1 μM JNKi or 100 nM trametinib (n = 3). Immunoblots are representative of three independent experiments. Error bars indicate the SEM. Asterisks denote significance by two-way ANOVA followed by Šídák’s multiple comparison tests. *P < 0.05; **P < 0.01; ***P < 0.001; and ****P < 0.0001. EV, empty vector; NS/No stim., no stimulus. Source data are available for this figure: SourceData FS1.
MEK inhibition with trametinib confirms that phospho-JNK antibody cross-reacts with phospho-ERK and that JNK-c-Jun signaling is a minor contributor to AP-1 signaling. (A) Immunoblot analysis of WT or CARD11 KO Jurkat T cells stimulated with 20 ng/ml PMA and 1 μg/ml ionomycin (P/I) for 30 min after pre-treatment with DMSO or increasing concentrations (10, 100, or 1,000 nM) of trametinib. (B) Immunoblot analysis of WT or CARD11 KO Jurkat T cells stimulated with 5 μg/ml plate-bound anti-CD3 and 5 μg/ml soluble anti-CD28 agonistic antibodies for 30 or 60 min. (C) Immunoblot analysis of WT or CARD11 KO Jurkat T cells stimulated with 20 ng/ml PMA and 1 μg/ml ionomycin (P/I) for 60 min after pre-treatment with DMSO or 1 μM JNK inhibitor (JNKi). (D) Immunoblot analysis of WT, CARD11 KO, MAPK8 (JNK1) KO, or JUN (c-Jun) KO Jurkat T cells from E and F. (E and F) Flow cytometric analysis of WT, CARD11 KO, MAPK8 (JNK1) KO, or JUN (c-Jun) KO Jurkat T cells transfected with an AP-1–driven GFP reporter and stimulated with P/I for 6 h. (E) Quantitation of the %GFP+ in the absence or presence of 1 μM JNKi or 100 nM trametinib (n = 3). (F) Representative histograms demonstrating the GFP+ gate (dashed lines) and %GFP+ cells (numbers) summarized in E. (G) Quantitation of the fold change in AP-1 family member DNA binding, normalized to unstimulated, uninhibited WT (NS) for each family member, in WT Jurkat T cells stimulated with P/I for 2 h in the absence or presence of 1 μM JNKi or 100 nM trametinib (n = 3). Immunoblots are representative of three independent experiments. Error bars indicate the SEM. Asterisks denote significance by two-way ANOVA followed by Šídák’s multiple comparison tests. *P < 0.05; **P < 0.01; ***P < 0.001; and ****P < 0.0001. EV, empty vector; NS/No stim., no stimulus. Source data are available for this figure: SourceData FS1.
CARD11 is required for robust AP-1 activation in human T cells
We next asked whether the JNK1/2 signaling defect noted in CARD11 KO Jurkat T cells compromised gene induction driven by AP-1 TFs. By phosphorylating and stabilizing c-Jun after TCR stimulation, JNK signaling is presumed to enable activation-induced gene expression in part through the formation of AP-1 complexes comprised of c-Fos/c-Jun heterodimers (Shaulian and Karin, 2002). However, prior work indicated that CARD11-deficient JPM50.6 Jurkat T cells did not display any reduction in AP-1 nuclear complexes or AP-1–driven reporter activity, despite an observed JNK2 activation defect (Blonska et al., 2007). Utilizing transient transfection of a novel AP-1–driven GFP reporter construct, we examined these findings in our CARD11 KO Jurkat T cell line. The deletion of CARD11 led to a substantial loss of P/I-driven AP-1 reporter activity (albeit less pronounced than the stable NF-κB reporter), which was partially recovered upon ectopic expression of WT CARD11 (Fig. 1, C–E). Using specific inhibitors targeting JNK (JNK-IN-8, i.e. JNKi) or MEK (trametinib) signaling, we found that CARD11-dependent JNK signaling had minimal impact on AP-1 reporter activation. By contrast, MEK inhibition markedly reduced P/I-induced AP-1 reporter activity, indicating c-Fos dependence (Fig. 1, C and D) (Herrera et al., 1990). Effective inhibition of JNK using JNKi was confirmed via western blot, with significant decreases in c-Jun phosphorylation and accumulation observed as expected (Fig. S1 C). Moreover, we noted increased retardation of JNK proteins on the gel, as expected due to the irreversible binding of JNKi (Zhang et al., 2012). The importance of JNK signaling for AP-1 activation was also investigated via genetic modification of Jurkat T cells. Compared with WT Jurkat T cells, MAPK8 (JNK1) or JUN (c-Jun) KO Jurkat T cells exhibited robust AP-1 reporter activation upon P/I stimulation, even in the presence of JNKi (Fig. S1, D–F). We further examined the importance of CARD11 for the DNA-binding capacity of specific AP-1 family members, including JUNB, JUND, JUN, FOSB, and FOS (Fig. 1 F). Nuclear lysates isolated from P/I-stimulated WT or CARD11 KO Jurkat T cells were incubated with plate-bound consensus AP-1 oligonucleotides; surprisingly, we found that all JUN/FOS family members assayed exhibited a substantial decrease in DNA binding in the absence of CARD11 (Fig. 1 F). Subsequently, we assayed AP-1 family member DNA binding in response to P/I stimulation in the presence of either JNKi or trametinib. Although JNKi treatment decreased the DNA binding of all assayed AP-1 family members, c-Jun DNA binding was most severely impacted as expected (Fig. S1 G). In concordance with our other AP-1 assays, pre-treatment with trametinib nearly abolished DNA binding by all AP-1 family members tested (Fig. S1 G). Taken together, these findings suggest that CARD11 is, in fact, important for activating AP-1 TFs through a mechanism that is largely independent of JNK kinase activity or c-Jun phosphorylation and induction alone (Fig. 1 G).
Patient-derived CARD11 LOF variants do not reconstitute NF-κB, JNK, or AP-1 activation in human T cells
Having validated our model system, we evaluated whether specific patient-derived LOF/DI CARD11 variants could reconstitute NF-κB, JNK, and/or AP-1 signaling relative to WT CARD11. We chose three LOF/DI CARD11 variants from previously described CADINS patients (E57D, L194P, and R975W) (Ma et al., 2017) and a fourth novel pathogenic variant from a patient that we recently characterized as LOF/DI (R891Q, c.2672G>A; Figs. 2 and 3). A brief clinical description of this patient is provided (Table S1). All four variants were discovered in patients that displayed a characteristic CADINS patient phenotype of severe allergic disease with a history of respiratory infections (Lu et al., 2018), and were found across major domains of the CARD11 protein that are critical for either nucleation of the CBM complex (CARD and coiled-coil) or higher-order CARD11 multimerization (membrane-associated guanylate kinase domain [MAGUK]) (Rawlings et al., 2006). To investigate effects on signaling pathways, CARD11 KO Jurkat T cells were transiently transfected with expression constructs encoding FLAG-tagged WT or mutant CARD11. Acute NF-κB and JNK signaling were measured via immunoblot after cells were stimulated with P/I for 30–60 min, with readouts including p65 phosphorylation and IκB⍺ degradation (NF-κB) or JNK phosphorylation (JNK; Fig. 2, B and C). In contrast to WT CARD11, none of the four variants could appreciably reconstitute either NF-κB or JNK signaling in CARD11 KO cells after P/I stimulation. We next evaluated effects on NF-κB–driven transcriptional activity utilizing CARD11 KO Jurkat T cells stably transduced with an NF-κB–driven enhanced GFP (EGFP) construct (Gewies et al., 2021). As expected, ectopic expression of WT CARD11 alone did not trigger constitutive NF-κB activation, confirming CARD11 is retained in an inactive conformation in unstimulated cells even when overexpressed. Similar to previously published assays in JPM50.6 cells (Ma et al., 2017), there was a significant reduction in NF-κB–driven EGFP production for each CARD11 variant tested after stimulation with anti-CD3/anti-CD28 or P/I (Fig. 2, D–F). We also assessed the effects of each variant relative to WT CARD11 on AP-1–driven transcriptional activity utilizing an AP-1–driven GFP reporter. Similar to defects noted for NF-κB–driven EGFP expression, there was a significant reduction in AP-1–driven GFP expression after stimulation with P/I (Fig. 2, G–I), suggesting LOF CARD11 variants comparably attenuate both pathways downstream of TCR engagement.

CARD11 LOF variants do not reconstitute CARD11-dependent signaling pathways. (A) Schematic of 3x-FLAG–tagged CARD11 protein expressed from pUNO vector (signaling domains annotated). Approximate location of each tested LOF variant is denoted with a black arrow and the variant of interest. (B) Immunoblot analysis of JNK and NF-κB signaling in CARD11 KO Jurkat cells transiently transfected with empty vector (EV), WT, or LOF CARD11 variants and stimulated for 30 or 60 min with 20 ng/ml PMA and 1 μg/ml ionomycin (P/I). (C) Quantitation of the fold change of specified proteins over baseline from immunoblots in B; n = 3. (D and E) Flow cytometric analysis of CARD11 KO NF-κB-EGFP Jurkat cells transfected as in B and stimulated with 1 μg/ml anti-CD3/anti-CD28 antibodies or P/I for 6 h. (D) Quantitation of the mean fluorescent intensity (top) or %GFP+ cells (bottom; n = 3). (E) Representative histograms demonstrating the GFP+ gate (dashed lines) and %GFP+ cells (numbers) summarized in D. (F) Representative immunoblot from transfected cells in D and E. (G) Representative immunoblot from transfected cells in H and I. (H and I) Flow cytometric analysis of CARD11 KO Jurkat cells transfected as in B in addition to an AP-1–driven GFP reporter and stimulated with P/I for 6 h. (H) Quantitation of the %GFP+ cells (n = 3). (I) Representative histograms demonstrating the GFP+ gate (dashed lines) and %GFP+ cells (numbers) summarized in H. Immunoblots are representative of three independent experiments. Error bars indicate the SEM. Asterisks denote significance by two-way ANOVA followed by Šídák’s multiple comparisons test (D and H) or one-way ANOVA followed by Dunnett’s multiple comparisons test (C). *P < 0.05; **P < 0.01; and ****P < 0.0001. EV, empty vector; F, FLAG; L, LATCH; MFI, mean fluorescence intensity; NS/No stim., no stimulus. Source data are available for this figure: SourceData F2.
CARD11 LOF variants do not reconstitute CARD11-dependent signaling pathways. (A) Schematic of 3x-FLAG–tagged CARD11 protein expressed from pUNO vector (signaling domains annotated). Approximate location of each tested LOF variant is denoted with a black arrow and the variant of interest. (B) Immunoblot analysis of JNK and NF-κB signaling in CARD11 KO Jurkat cells transiently transfected with empty vector (EV), WT, or LOF CARD11 variants and stimulated for 30 or 60 min with 20 ng/ml PMA and 1 μg/ml ionomycin (P/I). (C) Quantitation of the fold change of specified proteins over baseline from immunoblots in B; n = 3. (D and E) Flow cytometric analysis of CARD11 KO NF-κB-EGFP Jurkat cells transfected as in B and stimulated with 1 μg/ml anti-CD3/anti-CD28 antibodies or P/I for 6 h. (D) Quantitation of the mean fluorescent intensity (top) or %GFP+ cells (bottom; n = 3). (E) Representative histograms demonstrating the GFP+ gate (dashed lines) and %GFP+ cells (numbers) summarized in D. (F) Representative immunoblot from transfected cells in D and E. (G) Representative immunoblot from transfected cells in H and I. (H and I) Flow cytometric analysis of CARD11 KO Jurkat cells transfected as in B in addition to an AP-1–driven GFP reporter and stimulated with P/I for 6 h. (H) Quantitation of the %GFP+ cells (n = 3). (I) Representative histograms demonstrating the GFP+ gate (dashed lines) and %GFP+ cells (numbers) summarized in H. Immunoblots are representative of three independent experiments. Error bars indicate the SEM. Asterisks denote significance by two-way ANOVA followed by Šídák’s multiple comparisons test (D and H) or one-way ANOVA followed by Dunnett’s multiple comparisons test (C). *P < 0.05; **P < 0.01; and ****P < 0.0001. EV, empty vector; F, FLAG; L, LATCH; MFI, mean fluorescence intensity; NS/No stim., no stimulus. Source data are available for this figure: SourceData F2.

CARD11 DI variants disrupt CARD11-dependent signaling pathways to different extents. (A) Immunoblot analysis of JNK and NF-κB signaling in WT Jurkat cells transiently transfected with empty vector (EV), WT, or DI CARD11 variants stimulated for 30 or 60 min with 20 ng/ml PMA and 1 μg/ml ionomycin (P/I). (B) Quantitation of the fold change of specified proteins over baseline from immunoblots in A; n = 3. (C and D) Flow cytometric analysis of WT NF-κB-EGFP Jurkat cells transfected as in A and stimulated with 1 μg/ml anti-CD3/anti-CD28 antibodies or P/I for 6 h. (C) Quantitation of the mean fluorescent intensity (top) or %GFP+ cells (bottom; n = 4). (D) Representative histograms demonstrating the GFP+ gate (dashed lines) and %GFP+ cells (numbers) summarized in C. (E) Representative immunoblot from transfected cells in C and D. (F) Representative immunoblot from transfected cells in G and H. (G and H) Flow cytometric analysis of WT Jurkat cells transfected as in A in addition to an AP-1–driven GFP reporter and stimulated with P/I for 6 h. (G) Quantitation of the %GFP+ cells (n = 3). (H) Representative histograms demonstrating the GFP+ gate (dashed lines) and %GFP+ cells (numbers) summarized in G. (I) Quantitation of the fold change in AP-1 family member DNA binding, normalized to unstimulated WT (NS) for each family member, in WT Jurkat stably transduced with WT or L194P and stimulated with P/I for 2 h (n = 3). Immunoblots are representative of three independent experiments. Error bars indicate the SEM. Asterisks denote significance by (B) one-way ANOVA with Dunnett’s multiple comparisons test or (C, G, and I) two-way ANOVA with Šídák’s multiple comparisons test. *P < 0.05; **P < 0.01; ***P < 0.001; and ****P < 0.0001. EV, empty vector; MFI, mean fluorescence intensity; and NS/No stim., no stimulus. Source data are available for this figure: SourceData F3.
CARD11 DI variants disrupt CARD11-dependent signaling pathways to different extents. (A) Immunoblot analysis of JNK and NF-κB signaling in WT Jurkat cells transiently transfected with empty vector (EV), WT, or DI CARD11 variants stimulated for 30 or 60 min with 20 ng/ml PMA and 1 μg/ml ionomycin (P/I). (B) Quantitation of the fold change of specified proteins over baseline from immunoblots in A; n = 3. (C and D) Flow cytometric analysis of WT NF-κB-EGFP Jurkat cells transfected as in A and stimulated with 1 μg/ml anti-CD3/anti-CD28 antibodies or P/I for 6 h. (C) Quantitation of the mean fluorescent intensity (top) or %GFP+ cells (bottom; n = 4). (D) Representative histograms demonstrating the GFP+ gate (dashed lines) and %GFP+ cells (numbers) summarized in C. (E) Representative immunoblot from transfected cells in C and D. (F) Representative immunoblot from transfected cells in G and H. (G and H) Flow cytometric analysis of WT Jurkat cells transfected as in A in addition to an AP-1–driven GFP reporter and stimulated with P/I for 6 h. (G) Quantitation of the %GFP+ cells (n = 3). (H) Representative histograms demonstrating the GFP+ gate (dashed lines) and %GFP+ cells (numbers) summarized in G. (I) Quantitation of the fold change in AP-1 family member DNA binding, normalized to unstimulated WT (NS) for each family member, in WT Jurkat stably transduced with WT or L194P and stimulated with P/I for 2 h (n = 3). Immunoblots are representative of three independent experiments. Error bars indicate the SEM. Asterisks denote significance by (B) one-way ANOVA with Dunnett’s multiple comparisons test or (C, G, and I) two-way ANOVA with Šídák’s multiple comparisons test. *P < 0.05; **P < 0.01; ***P < 0.001; and ****P < 0.0001. EV, empty vector; MFI, mean fluorescence intensity; and NS/No stim., no stimulus. Source data are available for this figure: SourceData F3.
Patient-derived CARD11 variants dominantly interfere with NF-κB, JNK, and AP-1 activation in human T cells
Having evaluated the detrimental effects on NF-κB, JNK, or AP-1 signaling for CARD11 mutant proteins in isolation, we next investigated their impact in the presence of WT CARD11, as each patient variant is heterozygous (Ma et al., 2017). WT Jurkat T cells were transiently transfected with equal amounts of DNA for expression of FLAG-tagged WT or mutant CARD11. As above, acute NF-κB and JNK signaling outputs were measured via immunoblot (Fig. 3, A and B). Relative to ectopic expression of WT CARD11, we observed a graded effect on both NF-κB and JNK signaling; variants located within the CARD and coiled-coil domains (E57D/L194P) showed greater dominant interference than those found within the MAGUK domain (R891Q/R975W). A similar pattern was noted in WT Jurkat T cells stably transduced with an NF-κB–driven EGFP construct (Fig. 3, C–E), indicating quantitative defects in acute NF-κB signal readouts were congruent with the reduction in NF-κB–driven transcriptional activity (Gehring et al., 2019). Utilizing an AP-1–driven GFP reporter, we also assessed effects on AP-1–driven transcriptional activity. Similar to NF-κB–driven EGFP expression, there was a significant reduction in AP-1–driven GFP expression in WT Jurkat cells transfected with E57D or L194P, while R891Q and R975W did not show a significant DI effect (Fig. 3, F–H). To equilibrate expression of both WT and mutant CARD11, we also co-transfected CARD11 KO Jurkat T cells with equal amounts of WT CARD11-V5 and FLAG-tagged WT or mutant constructs (Fig. S2, A–H). These experiments generated highly similar findings compared with WT Jurkat T cells transfected with WT or mutant CARD11. Finally, we investigated the impact of L194P, a strong DI mutant, on the DNA-binding capacity of individual AP-1 family members. Nuclear lysates from WT Jurkat T cells stably transduced with WT or L194P CARD11 and stimulated with P/I for 2 h were incubated with plate-bound AP-1 consensus oligonucleotides (Fig. 3 I). As seen with the complete loss of CARD11 (Fig. 1 F), the presence of a strong DI variant substantially reduced the DNA-binding capacity of the AP-1 family members assayed, with comparable expression of WT and L194P CARD11 protein noted (Fig. S3 I).

CARD11 DI variants expressed at a 50:50 ratio to WT CARD11 disrupt CARD11-dependent signaling pathways to different extents. (A) Immunoblot analysis of JNK and NF-κB signaling in CARD11 KO Jurkat cells transiently transfected with a 50:50 ratio of WT CARD11-V5 and empty vector (EV), WT CARD11-FLAG, or DI CARD11-FLAG variants. Transfected cells were stimulated for 30 or 60 min with 20 ng/ml PMA and 1 μg/ml ionomycin (P/I). (B) Quantitation of the fold change of specified proteins over baseline from immunoblots in A; n = 3. (C and D) Flow cytometric analysis of CARD11 KO NF-κB-EGFP Jurkat cells transfected as in A and stimulated with 1 μg/ml anti-CD3/anti-CD28 antibodies or P/I for 6 h. (C) Quantitation of the mean fluorescent intensity (top) or %GFP+ cells (bottom; n = 3). (D) Representative histograms demonstrating the GFP+ gate (dashed lines) and %GFP+ cells (numbers) summarized in C. (E) Representative immunoblot from transfected cells in C and D. (F) Representative immunoblot from transfected cells in G and H. (G and H) Flow cytometric analysis of CARD11 KO Jurkat cells transfected as in A in addition to an AP-1–driven GFP reporter and stimulated with P/I for 6 h. (G) Quantitation of the %GFP+ cells (n = 5). (H) Representative histograms demonstrating the GFP+ gate (dashed lines) and %GFP+ cells (numbers) summarized in G. (I) Representative immunoblot confirming ectopic CARD11 expression in stably transduced Jurkat cells used in Fig. 3 I. Immunoblots are representative of at least three independent experiments. Error bars indicate the SEM. Asterisks denote significance by one-way ANOVA followed by Dunnett’s multiple comparisons (B) or two-way ANOVA followed by Šídák’s multiple comparisons (C and G). *P < 0.05; **P < 0.01; ***P < 0.001; and ****P < 0.0001. EV, empty vector; MFI, mean fluorescence intensity; and NS/No Stim., no stimulus. Source data are available for this figure: SourceData FS2.
CARD11 DI variants expressed at a 50:50 ratio to WT CARD11 disrupt CARD11-dependent signaling pathways to different extents. (A) Immunoblot analysis of JNK and NF-κB signaling in CARD11 KO Jurkat cells transiently transfected with a 50:50 ratio of WT CARD11-V5 and empty vector (EV), WT CARD11-FLAG, or DI CARD11-FLAG variants. Transfected cells were stimulated for 30 or 60 min with 20 ng/ml PMA and 1 μg/ml ionomycin (P/I). (B) Quantitation of the fold change of specified proteins over baseline from immunoblots in A; n = 3. (C and D) Flow cytometric analysis of CARD11 KO NF-κB-EGFP Jurkat cells transfected as in A and stimulated with 1 μg/ml anti-CD3/anti-CD28 antibodies or P/I for 6 h. (C) Quantitation of the mean fluorescent intensity (top) or %GFP+ cells (bottom; n = 3). (D) Representative histograms demonstrating the GFP+ gate (dashed lines) and %GFP+ cells (numbers) summarized in C. (E) Representative immunoblot from transfected cells in C and D. (F) Representative immunoblot from transfected cells in G and H. (G and H) Flow cytometric analysis of CARD11 KO Jurkat cells transfected as in A in addition to an AP-1–driven GFP reporter and stimulated with P/I for 6 h. (G) Quantitation of the %GFP+ cells (n = 5). (H) Representative histograms demonstrating the GFP+ gate (dashed lines) and %GFP+ cells (numbers) summarized in G. (I) Representative immunoblot confirming ectopic CARD11 expression in stably transduced Jurkat cells used in Fig. 3 I. Immunoblots are representative of at least three independent experiments. Error bars indicate the SEM. Asterisks denote significance by one-way ANOVA followed by Dunnett’s multiple comparisons (B) or two-way ANOVA followed by Šídák’s multiple comparisons (C and G). *P < 0.05; **P < 0.01; ***P < 0.001; and ****P < 0.0001. EV, empty vector; MFI, mean fluorescence intensity; and NS/No Stim., no stimulus. Source data are available for this figure: SourceData FS2.
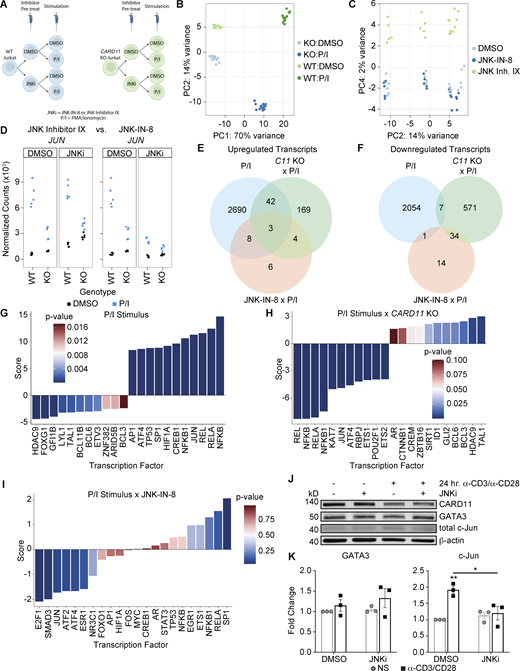
RNA-seq produced robust data, JNK inhibitor IX did not recapitulate important controls, and CARD11 KO cells demonstrate significant reductions in NF-κB and AP-1 TF activities. (A) Schematic of RNA-seq experimental design with the inclusion of JNK inhibitor IX. Created in BioRender. Bauman, B. (2025) https://biorender.com/u68a150. (B) PC analysis (PCA) plot of the first two PCs demonstrating robust clustering by experimental factors. (C) PCA plot of PC2 and PC4 demonstrating the separation of JNK inhibitor IX—including data from the rest of the dataset. (D) Plots of normalized transcript counts of JUN (encoding c-Jun) comparing the effects of JNK inhibitor IX (left) to JNKi (right). (E and F) Venn diagrams demonstrating the overlap between P/I-stimulated WT Jurkat T cells (blue), P/I-stimulated CARD11 KO Jurkat T cells (green), and P/I-stimulated WT Jurkat T cells preincubated with JNKi (orange). (E) Upregulated transcripts shared between the three effects/interactions. (F) Downregulated transcripts shared between the three effects/interactions. (G–I) Bar plots of TF activities determined via decoupleR using DEGs. Bars are colored by P values according to legends. Positive scores indicate activated TFs, and negative scores indicate inactivated TFs. (G) TF activities in WT Jurkat T cells stimulated with P/I versus DMSO. (H) TF activities in CARD11 KO Jurkat T cells stimulated with P/I versus WT Jurkat T cells stimulated with P/I. (I) TF activities in WT Jurkat T cells stimulated with P/I in the presence of JNKi versus DMSO. (J) Representative immunoblot analysis of GATA3 and c-Jun accumulation in HD CD4+ T cells stimulated for 24 h with 5 μg/ml plate-bound anti-CD3 and 5 μg/ml soluble anti-CD28 in the presence or absence of JNKi. (K) Quantitation of the fold change of GATA3 (left) and c-Jun (right) over unstimulated cells (n = 3). Error bars indicate the SEM. Asterisks denote significance by two-way ANOVA followed by Šídák’s multiple comparisons. *P < 0.05; **P < 0.01. NS/No stim., no stimulus. Source data are available for this figure: SourceData FS3.
RNA-seq produced robust data, JNK inhibitor IX did not recapitulate important controls, and CARD11 KO cells demonstrate significant reductions in NF-κB and AP-1 TF activities. (A) Schematic of RNA-seq experimental design with the inclusion of JNK inhibitor IX. Created in BioRender. Bauman, B. (2025) https://biorender.com/u68a150. (B) PC analysis (PCA) plot of the first two PCs demonstrating robust clustering by experimental factors. (C) PCA plot of PC2 and PC4 demonstrating the separation of JNK inhibitor IX—including data from the rest of the dataset. (D) Plots of normalized transcript counts of JUN (encoding c-Jun) comparing the effects of JNK inhibitor IX (left) to JNKi (right). (E and F) Venn diagrams demonstrating the overlap between P/I-stimulated WT Jurkat T cells (blue), P/I-stimulated CARD11 KO Jurkat T cells (green), and P/I-stimulated WT Jurkat T cells preincubated with JNKi (orange). (E) Upregulated transcripts shared between the three effects/interactions. (F) Downregulated transcripts shared between the three effects/interactions. (G–I) Bar plots of TF activities determined via decoupleR using DEGs. Bars are colored by P values according to legends. Positive scores indicate activated TFs, and negative scores indicate inactivated TFs. (G) TF activities in WT Jurkat T cells stimulated with P/I versus DMSO. (H) TF activities in CARD11 KO Jurkat T cells stimulated with P/I versus WT Jurkat T cells stimulated with P/I. (I) TF activities in WT Jurkat T cells stimulated with P/I in the presence of JNKi versus DMSO. (J) Representative immunoblot analysis of GATA3 and c-Jun accumulation in HD CD4+ T cells stimulated for 24 h with 5 μg/ml plate-bound anti-CD3 and 5 μg/ml soluble anti-CD28 in the presence or absence of JNKi. (K) Quantitation of the fold change of GATA3 (left) and c-Jun (right) over unstimulated cells (n = 3). Error bars indicate the SEM. Asterisks denote significance by two-way ANOVA followed by Šídák’s multiple comparisons. *P < 0.05; **P < 0.01. NS/No stim., no stimulus. Source data are available for this figure: SourceData FS3.
Loss of CARD11 leads to specific inactivation of NF-κB and AP-1 TFs
To illuminate the impact of CARD11-JNK signaling on changes in gene expression, we utilized RNA sequencing (RNA-seq) as an unbiased approach to interrogate the entire transcriptome. WT or CARD11 KO Jurkat T cells were preincubated with JNKi (targeting both JNK1 and JNK2), JNK inhibitor IX (targeting JNK2), or DMSO for 2 h, followed by activation with P/I or DMSO for an additional 2 h prior to RNA isolation (Fig. S3 A). To further confirm our results demonstrating the importance of CARD11 for activating both JNK1 and JNK2, we compared the difference between JNK2 inhibition alone versus inhibition of JNK1 and JNK2. Dimensionality reduction of the resultant gene expression matrix via principal component (PC) analysis (using the top 500 genes by variance) demonstrated that the majority of variance within the samples came from stimulation with P/I (PC1, 70% variance) and genotype (WT versus KO; PC2, 14% variance; Fig. S3 B). JNK inhibitor IX–treated cells clustered separately from DMSO- and JNKi-treated cells (PC4 versus PC2; Fig. S3 C), and the analysis of normalized transcript counts for JUN (c-Jun) between experimental conditions revealed that JNK inhibitor IX pre-treatment did not lead to a decrease in JUN expression with P/I stimulation (Fig. S3 D). Comparatively, pre-treatment with JNKi did lead to a significant decrease in JUN expression, recapitulating the CARD11 KO Jurkat T cell dataset (Fig. 1 A). As the loss or decrease in JUN expression is a critical control for CARD11 KO or dominant interference of both JNK1 and JNK2 signaling, we focused our analyses on JNKi (Fig. 4 A).

Inhibition of JNK signaling leads to increased GATA3 accumulation in Jurkat T cells. (A) Schematic of RNA-seq experimental design. Created in BioRender. Bauman, B. (2025) https://biorender.com/u68a150. (B) Venn diagram demonstrating the overlap between P/I-stimulated WT Jurkat T cells (blue), P/I-stimulated CARD11 KO Jurkat T cells (green), and P/I-stimulated WT Jurkat T cells preincubated with JNKi (orange). (C) Heatmap of the CARD11-JNK transcriptome, demonstrating the relative expression of each transcript between conditions, represented as scaled Z scores for each gene. (D) Volcano plot showing DEGs from the comparison of WT Jurkat T cells stimulated with 20 ng/ml PMA and 1 μg/ml ionomycin (P/I) for 2 h after a 2-h pre-treatment with JNKi versus those stimulated with P/I for 2 h after pre-treatment with DMSO. The upregulation of GATA3 is highlighted, and the expanded plot shows normalized counts for GATA3 across experimental conditions. (E) Representative immunoblot analysis of GATA3 and c-Jun accumulation in WT versus CARD11 KO Jurkat T cells stimulated for 2 h with P/I in the presence or absence of JNKi. (F) Quantitation of the fold change of GATA3 (left) and c-Jun (right) over baseline in both WT and CARD11 KO Jurkat T cells from immunoblots in E; n = 3. (G and H) Flow cytometric analysis of WT and CARD11 KO Jurkat T cells stimulated for 2 h with P/I in the presence or absence of JNKi. (G) Representative histograms of the data summarized in H, demonstrating the intracellular staining of GATA3 with the mean fluorescence intensity (MFI) annotated (numbers). (H) Quantitation of the fold change in MFI of GATA3 measured by intracellular flow cytometry (n = 3). Immunoblots are representative of three independent experiments. Error bars indicate the SEM. Asterisks denote significance by two-way ANOVA followed by Šídák’s multiple comparisons test. **P < 0.01; ***P < 0.001; and ****P < 0.0001. NS/No stim., no stimulus. Source data are available for this figure: SourceData F4.
Inhibition of JNK signaling leads to increased GATA3 accumulation in Jurkat T cells. (A) Schematic of RNA-seq experimental design. Created in BioRender. Bauman, B. (2025) https://biorender.com/u68a150. (B) Venn diagram demonstrating the overlap between P/I-stimulated WT Jurkat T cells (blue), P/I-stimulated CARD11 KO Jurkat T cells (green), and P/I-stimulated WT Jurkat T cells preincubated with JNKi (orange). (C) Heatmap of the CARD11-JNK transcriptome, demonstrating the relative expression of each transcript between conditions, represented as scaled Z scores for each gene. (D) Volcano plot showing DEGs from the comparison of WT Jurkat T cells stimulated with 20 ng/ml PMA and 1 μg/ml ionomycin (P/I) for 2 h after a 2-h pre-treatment with JNKi versus those stimulated with P/I for 2 h after pre-treatment with DMSO. The upregulation of GATA3 is highlighted, and the expanded plot shows normalized counts for GATA3 across experimental conditions. (E) Representative immunoblot analysis of GATA3 and c-Jun accumulation in WT versus CARD11 KO Jurkat T cells stimulated for 2 h with P/I in the presence or absence of JNKi. (F) Quantitation of the fold change of GATA3 (left) and c-Jun (right) over baseline in both WT and CARD11 KO Jurkat T cells from immunoblots in E; n = 3. (G and H) Flow cytometric analysis of WT and CARD11 KO Jurkat T cells stimulated for 2 h with P/I in the presence or absence of JNKi. (G) Representative histograms of the data summarized in H, demonstrating the intracellular staining of GATA3 with the mean fluorescence intensity (MFI) annotated (numbers). (H) Quantitation of the fold change in MFI of GATA3 measured by intracellular flow cytometry (n = 3). Immunoblots are representative of three independent experiments. Error bars indicate the SEM. Asterisks denote significance by two-way ANOVA followed by Šídák’s multiple comparisons test. **P < 0.01; ***P < 0.001; and ****P < 0.0001. NS/No stim., no stimulus. Source data are available for this figure: SourceData F4.
When analyzing the RNA-seq data, we set a target false discovery rate of 0.05 for the DESeq2 automated independent filtering and multiple testing correction procedure and considered absolute log2 fold change (LFC) values >0.4 (∼1.3-fold change) to be biologically relevant effect sizes (Mognol et al., 2019). With this threshold for differentially expressed genes (DEGs), we identified 4,805 DEGs in WT Jurkat T cells stimulated with P/I (2743 upregulated and 2,062 downregulated; Fig. 4 B; Fig. S3, E and F; and Table S2). Comparing CARD11 KO to WT Jurkat T cells stimulated with P/I, we found 830 DEGs in CARD11 KO Jurkat T cells (218 upregulated and 612 downregulated; Fig. 4 B; Fig. S3, E and F; and Table S3). The stimulation of WT Jurkat in the presence of JNKi showed differential expression of 70 genes, relative to DMSO-treated cells (21 upregulated and 49 downregulated; Fig. 4 B; Fig. S3, E and F; and Table S4). Utilizing the DEGs from each main effect or interaction (Fig. 4 B), we examined the activity of TFs using the R package decoupleR (Badia-I-Mompel et al., 2022). Utilizing TF regulons derived from TF–gene interactions in the Collection of Transcription Regulation Interactions (CollecTRI) meta resource (Müller-Dott et al., 2023; Vazquez et al., 2022), we employed decoupleR to perform univariate linear modeling to infer TF activity. Fig. S3, G–I summarizes these results, demonstrating up- and downregulated TF activities for the top 11 TFs in either direction (full results for statistically significant TFs summarized in Tables S5, S6, and S7). As demonstrated in Fig. S3 G, stimulation of WT Jurkat T cells with P/I primarily drove the activation of NF-κB TFs (NFKB, RELA, and REL). Importantly, in CARD11 KO Jurkat T cells, these TFs are the most significantly downregulated in activity (Fig. S3 H). Both datasets also revealed up- and downregulation of JUN TF activity (Fig. S3, G and H, respectively), aligning with our aforementioned data. Although not statistically significant, treatment with JNKi in P/I-stimulated WT Jurkat T cells also showed a trend for downregulation of JUN TF activity (Fig. S3 I). The lack of statistical significance is likely due to the small number DEGs within this dataset; nevertheless, these bioinformatic analyses validated our earlier findings that CARD11 governs both NF-κB and JUN/AP-1–mediated gene transcription in activated T cells.
Impaired CARD11-JNK signaling leads to increased GATA3 expression in human T cells
Comparison of the overlap of DEGs between these three sets revealed 40 DEGs shared amongst all comparisons (Fig. 4, B and C; and Table 1, LFC and adjusted P value (Padj) for WT Jurkat stimulated with P/I in the presence of JNKi), which we defined as the “CARD11-JNK transcriptome.” Five of these genes (RILPL2, TAGAP, LTB, GATA3, and TWIST1) were downregulated in P/I-stimulated CARD11 KO Jurkat T cells yet upregulated in P/I-stimulated WT Jurkat after JNKi pre-treatment (Fig. 4, C and D). As previously described (Blonska et al., 2012), complete absence of CARD11 led to a loss of P/I-induced GATA3 upregulation; however, GATA3 expression was increased by P/I stimulation upon selective inhibition of JNK signaling (Fig. 4, C and D). CADINS patient T cells have only partially impaired CARD11 signaling and exhibit increased production of TH2 cytokines (Ma et al., 2017). Since GATA3 is the master TF of TH2 cells, we first validated these effects at the protein level in Jurkat T cells. Indeed, when WT Jurkat cells were stimulated with P/I in the presence of JNKi, we saw a modest but consistent increase in GATA3 protein accumulation compared with cells stimulated with P/I and DMSO (Fig. 4, E and F). Conversely, stimulation with P/I in the presence of JNKi resulted in a significant decrease in c-Jun protein accumulation as expected (Fig. 4, E and F). Subsequently, we confirmed this in healthy donor (HD) CD4+ T cells, in which activation with plate-bound anti-CD3 and soluble anti-CD28 antibodies for 24 h elicited a modest increase in GATA3 protein expression in the presence of JNKi (Fig. S4, J and K). The increase in GATA3 protein levels seen by western blot in WT Jurkat T cells was further confirmed via intracellular flow cytometry, again showing a modest but consistent increase in GATA3 protein levels after P/I stimulation in the presence of JNKi (Fig. 4, G and H). Together, these data suggest that partial impairment of CARD11-JNK signaling enhances TCR-induced GATA3 expression, in contrast to what occurs in the complete absence of CARD11 signaling (Blonska et al., 2012).
Overlapping DEGs, termed the CARD11-JNK transcriptome
| Gene_symbol | Gene_id | LFCa | P valuea | Padja |
|---|---|---|---|---|
| PLAU | ENSG00000122861 | −1.1459878 | 1.13E-21 | 1.71E-17 |
| JMJD1C | ENSG00000171988 | −0.5223971 | 1.02E-15 | 7.70E-12 |
| TOR1AIP1 | ENSG00000143337 | −0.4962579 | 2.07E-12 | 1.04E-08 |
| KLHL21 | ENSG00000162413 | −0.847113 | 3.44E-12 | 1.08E-08 |
| SRXN1 | ENSG00000271303 | −0.5208689 | 3.57E-12 | 1.08E-08 |
| LINC00152 | ENSG00000222041 | −0.610012 | 8.70E-11 | 1.87E-07 |
| MIR4435-1HG | ENSG00000172965 | −0.6801504 | 1.31E-10 | 2.46E-07 |
| FOXO3 | ENSG00000118689 | −0.4604652 | 1.39E-09 | 1.74E-06 |
| RILPL2 | ENSG00000150977 | 0.54250912 | 1.17E-09 | 1.74E-06 |
| DNMBP | ENSG00000107554 | −0.407956 | 9.29E-09 | 9.44E-06 |
| SLA | ENSG00000155926 | 0.70099976 | 1.28E-08 | 1.21E-05 |
| LRRC16B | ENSG00000186648 | −0.9116568 | 1.73E-08 | 1.53E-05 |
| NFATC1 | ENSG00000131196 | 0.60335062 | 4.55E-08 | 3.61E-05 |
| ZEB2 | ENSG00000169554 | −0.7737978 | 5.05E-08 | 3.81E-05 |
| LTB | ENSG00000227507 | 1.27229666 | 1.03E-07 | 7.05E-05 |
| GPR3 | ENSG00000181773 | −0.6275092 | 1.42E-07 | 8.56E-05 |
| MAFF | ENSG00000185022 | −0.6784956 | 1.56E-07 | 8.70E-05 |
| GATA3 | ENSG00000107485 | 0.58473198 | 2.21E-07 | 1.19E-04 |
| NR4A1 | ENSG00000123358 | 0.4818049 | 6.58E-07 | 3.31E-04 |
| TWIST1 | ENSG00000122691 | 0.8717264 | 9.93E-07 | 4.68E-04 |
| PDGFA | ENSG00000197461 | 0.48235779 | 1.76E-06 | 7.80E-04 |
| PLAUR | ENSG00000011422 | −0.485689 | 3.20E-06 | 0.00130214 |
| JUN | ENSG00000177606 | −0.7818161 | 4.65E-06 | 0.00184406 |
| KLF6 | ENSG00000067082 | −0.742193 | 7.71E-06 | 0.00269995 |
| CTB-58E17.1 | ENSG00000261005 | −0.520812 | 7.68E-06 | 0.00269995 |
| PMAIP1 | ENSG00000141682 | −0.4129919 | 1.09E-05 | 0.00336081 |
| STX1A | ENSG00000106089 | −0.5978878 | 1.55E-05 | 0.00440106 |
| MAST4 | ENSG00000069020 | −0.6182108 | 3.28E-05 | 0.00824738 |
| PIM1 | ENSG00000137193 | −0.4853275 | 4.29E-05 | 0.01008797 |
| SEMA7A | ENSG00000138623 | −0.4326794 | 5.37E-05 | 0.01206407 |
| SMTN | ENSG00000183963 | −0.5586116 | 6.65E-05 | 0.01373236 |
| RHOB | ENSG00000143878 | −0.6202746 | 6.80E-05 | 0.01384982 |
| TAGAP | ENSG00000164691 | 0.99963619 | 8.90E-05 | 0.0165473 |
| DUSP10 | ENSG00000143507 | −0.5227999 | 1.12E-04 | 0.01879331 |
| SH3RF2 | ENSG00000156463 | −0.5597937 | 1.12E-04 | 0.01879331 |
| IL23A | ENSG00000110944 | −0.6408118 | 1.22E-04 | 0.01960365 |
| KIAA1217 | ENSG00000120549 | −0.5719955 | 1.30E-04 | 0.02024216 |
| NETO1 | ENSG00000166342 | −0.6483206 | 1.93E-04 | 0.02690275 |
| LUCAT1 | ENSG00000248323 | −0.4137985 | 2.10E-04 | 0.02745686 |
| IRGQ | ENSG00000167378 | −0.4009233 | 4.77E-04 | 0.044649 |
Displayed values for LFC, P value, and Padj are from the interaction between JNKi treatment and P/I stimulation.

Patient T cells show decreased TCR signaling and increased GATA3 accumulation. (A–H) Immunoblot analysis of acute JNK and NF-κB signaling (A–D) and GATA3 accumulation (E–H) in healthy control and patient T cells. (A–D) Acute signaling was assessed by stimulation for 30 or 60 min with 20 ng/ml PMA and 1 μg/ml ionomycin (P/I). (E–H) GATA3 accumulation was assessed by stimulation with P/I for 2 h in the absence or presence of 80 ng/ml anisomycin. Each patient was assayed with one to two healthy controls. Source data are available for this figure: SourceData FS4.
Patient T cells show decreased TCR signaling and increased GATA3 accumulation. (A–H) Immunoblot analysis of acute JNK and NF-κB signaling (A–D) and GATA3 accumulation (E–H) in healthy control and patient T cells. (A–D) Acute signaling was assessed by stimulation for 30 or 60 min with 20 ng/ml PMA and 1 μg/ml ionomycin (P/I). (E–H) GATA3 accumulation was assessed by stimulation with P/I for 2 h in the absence or presence of 80 ng/ml anisomycin. Each patient was assayed with one to two healthy controls. Source data are available for this figure: SourceData FS4.
CADINS patient T cells exhibit impaired NF-κB and JNK signaling
We aimed to corroborate our findings in primary T cells derived from five previously described CADINS patients relative to healthy controls (Ma et al., 2017; Meitlis et al., 2020) (Fig. 5 A). Flow cytometric profiling (both clinical and research-based) revealed no substantial and/or consistent abnormalities observed in the proportion or absolute number of naïve versus memory CD4 and CD8 T cells in starting peripheral blood mononuclear cell (PBMC) from the patients we studied (Table S8). Given limited patient sample material, we elected to expand effector T cells from thawed patient PBMCs. To activate T cells, we stimulated patient PBMCs with anti-CD3– and anti-CD28–conjugated beads for 3 days. We then removed the beads and cultured the activated T cells with recombinant human IL-2 (r-hIL-2) for an additional 8–12 days prior to performing experiments (Fig. 5 B). Although CADINS patient CD4+CD45RA− T cells expanded at a slower rate compared with healthy controls (Table S9), we obtained sufficient numbers of effector T cells for signaling assays. We then assessed patient T cells for acute defects in NF-κB (p65 phosphorylation and IκB⍺ degradation) and JNK (JNK phosphorylation and c-Jun phosphorylation/accumulation) signaling pathways 30–60 min after P/I stimulation (Fig. 5, C and D; and Fig. S4, A–D). We found that patient T cells harboring LOF/DI CARD11 variants in the CARD or coiled-coil domains exhibited significant attenuation of both NF-κB and JNK signaling, congruent with results obtained from our transient transfection assays (Figs. 3 and S2). Similar to our transient transfection assays and previously published data (Figs. 3 and S2) (Ma et al., 2017), the R975W variant did not significantly blunt either pathway. Notably, reduced NF-κB signaling metrics were comparable with those we previously observed in freshly thawed, resting patient T cells (Ma et al., 2017; Meitlis et al., 2020), suggesting that CARD11-dependent signaling defects are preserved in expanded effector T cells from CADINS patients.
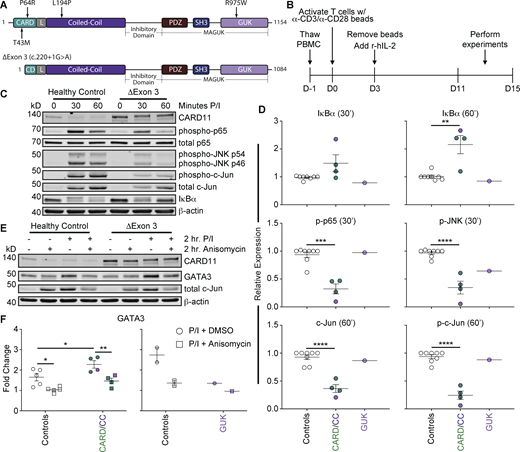
CADINS patient T cells exhibit decreased NF-κB and JNK signaling and increased GATA3 accumulation. (A) Top: Schematic of CARD11 protein structure with the approximate location of each patient variant denoted with a black arrow and the variant of interest. Bottom: Schematic of resulting CARD11 protein structure expressed from patient allele with splice site variant (c.220+1G>A). (B) Schematic of experimental timeline for the activation and expansion of healthy control and patient T cells from thawed PBMCs. (C) Representative immunoblot analysis of JNK and NF-κB signaling in healthy control and patient T cells stimulated for 30 or 60 min with 20 ng/ml PMA and 1 μg/ml ionomycin (P/I). Each patient was assayed with one to two healthy controls. (D) Quantitation of the expression of each protein relative to healthy control levels at the specified time point from immunoblots in C. Patient variants are color coded by protein domain location. (E) Representative immunoblot analysis of GATA3 accumulation in healthy control and patient T cells stimulated for 2 h with P/I in the presence or absence of 80 ng/ml anisomycin. (F) Quantitation of the fold change of GATA3 (left) and c-Jun (right) with P/I stimulation alone (circles) or P/I plus anisomycin (squares) relative to each respective no stimulus condition from the immunoblots in E. Patient variants are color coded by protein domain location. Error bars indicate the SEM. Asterisks denote significance by (D) one-way ANOVA with Dunnett’s multiple comparisons test and (F) two-way ANOVA with Šídák’s multiple comparisons test. *P < 0.05; **P < 0.01; ***P < 0.001; and ****P < 0.0001. CC, coiled-coil; CD, CARD; and L, LATCH. Source data are available for this figure: SourceData F5.
CADINS patient T cells exhibit decreased NF-κB and JNK signaling and increased GATA3 accumulation. (A) Top: Schematic of CARD11 protein structure with the approximate location of each patient variant denoted with a black arrow and the variant of interest. Bottom: Schematic of resulting CARD11 protein structure expressed from patient allele with splice site variant (c.220+1G>A). (B) Schematic of experimental timeline for the activation and expansion of healthy control and patient T cells from thawed PBMCs. (C) Representative immunoblot analysis of JNK and NF-κB signaling in healthy control and patient T cells stimulated for 30 or 60 min with 20 ng/ml PMA and 1 μg/ml ionomycin (P/I). Each patient was assayed with one to two healthy controls. (D) Quantitation of the expression of each protein relative to healthy control levels at the specified time point from immunoblots in C. Patient variants are color coded by protein domain location. (E) Representative immunoblot analysis of GATA3 accumulation in healthy control and patient T cells stimulated for 2 h with P/I in the presence or absence of 80 ng/ml anisomycin. (F) Quantitation of the fold change of GATA3 (left) and c-Jun (right) with P/I stimulation alone (circles) or P/I plus anisomycin (squares) relative to each respective no stimulus condition from the immunoblots in E. Patient variants are color coded by protein domain location. Error bars indicate the SEM. Asterisks denote significance by (D) one-way ANOVA with Dunnett’s multiple comparisons test and (F) two-way ANOVA with Šídák’s multiple comparisons test. *P < 0.05; **P < 0.01; ***P < 0.001; and ****P < 0.0001. CC, coiled-coil; CD, CARD; and L, LATCH. Source data are available for this figure: SourceData F5.
We also assessed GATA3 accumulation in patient effector T cells after restimulation (Fig. 5, E and F; Fig. S4, E–H; and Fig. S5, A and B). We hypothesized that strong DI CARD11 variants that dampened TCR-induced JNK signaling would acutely induce increased GATA3 accumulation. Indeed, we found that patient T cells harboring CARD11 DI variants in the CARD or coiled-coil domain induced greater GATA3 expression after P/I stimulation relative to healthy controls, whereas cells carrying the carboxy-terminal R975W variant did not. Using intracellular flow cytometry, we noted a similar modest increase in GATA3 induction in both CD4+ and CD8+ effector T cells from CADINS patients (Fig. S5, A and B). While it is possible that enhanced GATA3 induction is tied to a higher proportion of TH2 cells present in original patients’ PBMC, we did not observe increased GATA3 expression in patient-derived effector T cells before P/I restimulation. To test whether increased GATA3 accumulation was due to decreased JNK signaling, we stimulated patient effector T cells with P/I in the presence of anisomycin, a CARD11-independent JNK activator (Fig. 1 B). Similar to healthy controls, GATA3 accumulation was significantly suppressed in patient T cells carrying CARD and coiled-coil domain variants with concomitant anisomycin treatment, with no appreciable effect observed in R975W patient cells (Fig. 5 F). Collectively, these results highlight a hitherto unrecognized link between impaired CARD11-dependent JNK signaling and acute GATA3 induction after TCR stimulation, implying that JNK defects directly contribute to TH2 skewing observed in CADINS.

Patient CD4 + and CD8 + T cells display increased intracellular GATA3. (A) Representative histograms from HD and CADINS patient (T43M) CD4+ and CD8+ T cells showing intracellular GATA3 expression. Numbers on histograms represent the mean fluorescence intensity of GATA3. (B) Summary plots of fold change in GATA3 protein levels measured by intracellular flow cytometry in HD and CADINS patient CD4+ and CD8+ T cells (n = 5). (C and D) Summary plots showing the percentage and MFI of CD4+ T cells expressing IFN-γ (C) and IL-13 (D) as measured by intracellular flow cytometry (n = 5). (E) Representative gating strategy for data summarized in A–D. Error bars indicate the SEM. Asterisks denote significance by two-way ANOVA followed by Šídák’s multiple comparisons. *P < 0.05; **P < 0.01; ***P < 0.001; and ****P < 0.0001. MFI, mean fluorescence intensity.
Patient CD4 + and CD8 + T cells display increased intracellular GATA3. (A) Representative histograms from HD and CADINS patient (T43M) CD4+ and CD8+ T cells showing intracellular GATA3 expression. Numbers on histograms represent the mean fluorescence intensity of GATA3. (B) Summary plots of fold change in GATA3 protein levels measured by intracellular flow cytometry in HD and CADINS patient CD4+ and CD8+ T cells (n = 5). (C and D) Summary plots showing the percentage and MFI of CD4+ T cells expressing IFN-γ (C) and IL-13 (D) as measured by intracellular flow cytometry (n = 5). (E) Representative gating strategy for data summarized in A–D. Error bars indicate the SEM. Asterisks denote significance by two-way ANOVA followed by Šídák’s multiple comparisons. *P < 0.05; **P < 0.01; ***P < 0.001; and ****P < 0.0001. MFI, mean fluorescence intensity.
Impaired CARD11-JNK signaling leads to increased NFAT2 expression in human T cells
Given the modest increase in GATA3 expression we observed in CADINS patient T cells and JNKi-treated Jurkat cells, we re-examined our Jurkat RNA-seq dataset to search for other JNK inhibition–induced transcriptional changes that might aid in TH2 skewing. Notably, we found that transcription of NFATC1 (the gene encoding NFAT2) was significantly increased in P/I-stimulated WT Jurkat T cells pre-treated with JNKi (Fig. 6 A), a TF previously identified to be important for TH2 differentiation (Wang et al., 2006; Yoshida et al., 1998). We thus examined the importance of CARD11 and JNK inhibition for the DNA binding of NFAT2 by incubating nuclear lysates isolated from P/I-stimulated WT or CARD11 KO Jurkat T cells, pre-treated with DMSO or JNKi, with plate-bound consensus NFAT oligonucleotides. NFAT2 DNA binding was detected via an NFAT2-specific antibody (NFAT2 TransAM assay). Congruent with our RNA-seq data, P/I-stimulated WT Jurkat T cells displayed elevated NFAT2 DNA-binding activity that was significantly increased with JNK inhibition (Fig. 6 B). Furthermore, NFAT2 DNA binding was nearly doubled in P/I-stimulated CARD11 KO compared with WT cells, with no additional increase observed with JNK inhibition, again mirroring our RNA-seq findings. To investigate the impact of a strong CARD11 DI variant, we next compared DNA-binding capacity of NFAT2 in nuclear lysates from PI-stimulated Jurkat T cells stably transduced with WT or L194P CARD11 using the NFAT2 TransAM assay (Fig. 6 C). Although the effect was more pronounced in CARD11 KO Jurkat cells (Fig. 6 B), the presence of a strong DI variant substantially increased the DNA binding of NFAT2 relative to WT expressing cells (Fig. 6 C). Finally, we corroborated our findings using RNA-seq data generated from flow-sorted, naïve CD4+ T cells from HDs or CADINS patients after 3 days of activation with anti-CD3/anti-CD28 agonistic antibodies. Akin to what we found in JNK-inhibited, P/I-stimulated WT Jurkat T cells, CADINS patient T cells harboring a strong DI variant (R75W) significantly upregulated GATA3 and NFATC1 (NFAT2) after 3 days of TCR stimulation. Taken together, we posit a model whereby DI CARD11 variants impair TCR-induced signals to the JNK pathway, and this impaired JNK signaling leads to increased GATA3 and NFAT2 expression and activity, both key factors in the TH2 differentiation pathway (Fig. 6 E).

Impaired CARD11-JNK signaling leads to increased NFAT2 expression and activation. (A) Volcano plot showing DEGs from the comparison of WT Jurkat T cells stimulated with 20 ng/ml PMA and 1 μg/ml ionomycin (P/I) for 2 h after a 2-h pre-treatment with JNKi versus those stimulated with P/I for 2 h after pre-treatment with DMSO. The upregulation of NFATC1 (NFAT2) is highlighted, and the expanded plot shows normalized counts for NFATC1 (NFAT2) across experimental conditions. (B) Quantitation of the fold change in NFATc1 (NFAT2) DNA binding, normalized to unstimulated WT (NS), in WT or CARD11 KO Jurkat T cells stimulated with P/I for 4 h (n = 3–4). (C) Quantitation of the fold change in NFATc1 (NFAT2) DNA binding, normalized to unstimulated WT (NS), in WT Jurkat stably transduced with WT or L194P and stimulated with P/I for 4 h (n = 3). (D) Expression of GATA3 and NFATC1 (NFAT2) in CADINS patient versus HD naïve CD4 T cells after 3 days of anti-CD3/anti-CD28 activation. (E) Schematic summarizing the hypothesized effects of WT or DI CARD11 on NFAT2 and GATA3 expression and activity. Error bars indicate the SEM. Asterisks denote significance by two-way ANOVA with Šídák’s multiple comparisons test. Created in BioRender. Bauman, B. (2025) https://biorender.com/a16y201. *P < 0.05; **P < 0.01; ***P < 0.001; and ****P < 0.0001. NS/No stim, no stimulus.
Impaired CARD11-JNK signaling leads to increased NFAT2 expression and activation. (A) Volcano plot showing DEGs from the comparison of WT Jurkat T cells stimulated with 20 ng/ml PMA and 1 μg/ml ionomycin (P/I) for 2 h after a 2-h pre-treatment with JNKi versus those stimulated with P/I for 2 h after pre-treatment with DMSO. The upregulation of NFATC1 (NFAT2) is highlighted, and the expanded plot shows normalized counts for NFATC1 (NFAT2) across experimental conditions. (B) Quantitation of the fold change in NFATc1 (NFAT2) DNA binding, normalized to unstimulated WT (NS), in WT or CARD11 KO Jurkat T cells stimulated with P/I for 4 h (n = 3–4). (C) Quantitation of the fold change in NFATc1 (NFAT2) DNA binding, normalized to unstimulated WT (NS), in WT Jurkat stably transduced with WT or L194P and stimulated with P/I for 4 h (n = 3). (D) Expression of GATA3 and NFATC1 (NFAT2) in CADINS patient versus HD naïve CD4 T cells after 3 days of anti-CD3/anti-CD28 activation. (E) Schematic summarizing the hypothesized effects of WT or DI CARD11 on NFAT2 and GATA3 expression and activity. Error bars indicate the SEM. Asterisks denote significance by two-way ANOVA with Šídák’s multiple comparisons test. Created in BioRender. Bauman, B. (2025) https://biorender.com/a16y201. *P < 0.05; **P < 0.01; ***P < 0.001; and ****P < 0.0001. NS/No stim, no stimulus.
Discussion
CARD11 is a critical signaling scaffold that connects antigen receptor engagement to signaling pathways driving the activation, proliferation, and survival of lymphocytes. The importance of CARD11 for TCR-driven NF-κB activation is well established, but prior work revealed a connection, albeit puzzling, to JNK2 signaling as well (Blonska et al., 2007; Hutcherson et al., 2021). Importantly, there is a paucity of information regarding how CARD11-dependent JNK signaling influences downstream gene expression in T cells, with no apparent link to AP-1–mediated transcription. Fully understanding the CARD11-dependent signaling pathways triggered by TCR activation is important, as differential impacts on specific signaling nodes may govern mechanisms of pathogenesis across an ever-expanding spectrum of phenotypes associated with mutations in CARD11, collectively termed “CARD11-opathies” (Lu et al., 2018). Here we show that CARD11 is required for the phosphorylation and activation of both JNK1 and JNK2 after TCR stimulation, in contrast to prior work indicating a selective JNK2 p54 defect in CARD11-deficient JPM50.6 cells (Blonska et al., 2007). We determined that this discrepancy is likely the result of a cross-reactive antibody that also detects phospho-ERK. Additionally, with the use of a novel AP-1–driven GFP reporter, we demonstrated a substantial decrease in AP-1 signaling in the absence of CARD11, contrary to previously published data utilizing electrophoretic mobility shift assays and AP-1–driven luciferase reporters (Blonska et al., 2007; Hara et al., 2003). Although our data demonstrate a stark decrease in activation-induced AP-1 activity in CARD11 KO Jurkat T cells, it is possible that a luciferase reporter was not sensitive enough to detect this difference due to the lack of a destabilization domain on the luciferase or the ability of individual luciferase enzymes to catalyze the conversion of multiple substrate molecules to light. Nevertheless, we found that JNK kinase activity exerts minimal impact on AP-1–dependent transcription, suggesting a more complex CARD11-dependent mechanism.
AP-1 is commonly referenced as a simple JUN/FOS heterodimer, perpetuating confusion over the study of genes regulated by a panoply of AP-1 complexes. Indeed, our results demonstrating minimal effect on conventional AP-1 reporter activity with JNK kinase inhibition, and thus c-Jun phosphorylation, highlight the need to explicitly define specific AP-1 complexes that might be disrupted under different conditions. As our AP-1 reporter utilized repetitive consensus sequences (5′-TGAC/GTCA-3′) (Angel et al., 1987), which can bind to any member of the JUN/FOS family of AP-1 TFs, it is possible that JNK inhibition exerts qualitative rather than quantitative differences in active AP-1 complexes induced by TCR signaling (i.e., increased JunB/JunD binding in the absence/depletion of c-Jun). Indeed, we found that the loss of CARD11 significantly reduces binding of nuclear JunB, JunD, c-Jun, FosB, and c-Fos to consensus DNA oligonucleotides (5′-TGAGTCA-3′), suggesting CARD11 controls AP-1 signaling more than previously recognized. Additionally, we demonstrated that genetic inactivation of MAPK8 (JNK1) or JUN (c-Jun) in Jurkat T cells, even in the presence of JNK inhibition, still did not significantly impair AP-1 signaling to the same degree as CARD11 deletion. Our future studies will characterize the mechanism by which CARD11 affects the activation of other members of the AP-1 TF family, which should help to delineate the importance of CARD11 in TCR signaling more broadly.
Since our initial description of LOF/DI CARD11 variants (Ma et al., 2017), the number of CADINS patients and deleterious variants has rapidly expanded, as have the reported clinical phenotypes (Dadi et al., 2018; Dorjbal et al., 2019; Meitlis et al., 2020; Pietzsch et al., 2022; Urdinez et al., 2022). To fully illuminate potential genotype-phenotype correlations, we must improve our understanding of CARD11 variant impacts on signaling outcomes beyond just NF-κB. Although several recent studies have shown that mutations in CARD11 alter JNK signaling in T cells (Hutcherson et al., 2021; Bedsaul et al., 2022; Gaide et al., 2002; Wang et al., 2019; Kutzner et al., 2022), our study is the first to extensively characterize confirmed LOF/DI variants derived from CADINS patients. Indeed, we showed that CARD11 variants incapable of restoring NF-κB signaling also cannot reconstitute JNK signaling or AP-1–dependent transcriptional activity in CARD11 KO T cells. Additionally, our novel findings suggest that the extent of dominant interference of NF-κB signaling mirrors that seen for JNK signaling and AP-1 reporter activation when WT and DI CARD11 variants are co-expressed, perhaps consistent with a common defect in optimal BCL10 filament formation and/or TAK1 activation (David et al., 2018; Qiao et al., 2013; Schlauderer et al., 2018; Blonska et al., 2007). Localization of variants within specific domains of CARD11 also plays a role in the severity of the DI effect, with CARD/coiled-coil variants disrupting signaling to NF-κB and JNK to a greater extent than those localized to the C-terminal MAGUK domain. Considering the CARD domain directly interacts with BCL10 to initiate CBM complex assembly (Qiao et al., 2013), and the coiled-coil domain facilitates CARD11 oligomerization (Tanner et al., 2007), it makes sense that variants in these domains are more likely to exhibit potent dominant interference via “oligomer poisoning” (Bedsaul et al., 2022). Further work is required to understand how CARD11 DI variants that differentially impair signaling pathways can phenotypically lead to similar disease outcomes, such as severe atopic dermatitis.
Ultimately, we have also provided evidence to clarify the transcriptional importance of this CARD11-JNK signaling axis. Utilizing RNA-seq along with genetic and pharmacological manipulations, we discovered a novel role of CARD11-dependent JNK activation in modulating GATA3 and NFATC1 expression after T cell stimulation. Our data confirmed previously published results demonstrating that the loss of CARD11 abolishes GATA3 upregulation in Jurkat T cells (Blonska et al., 2012). Surprisingly, we discovered that inhibition of JNK kinase activity in an otherwise intact signaling environment led to increased expression of GATA3. More importantly, we showed that in CADINS patient T cells harboring potent CARD11 DI variants, TCR-induced GATA3 upregulation was also increased relative to healthy controls. This increase was effectively blocked with simultaneous anisomycin treatment, suggesting CARD11-independent activation of JNK was sufficient to restore GATA3 suppression after T cell activation. These data strongly suggest that CARD11-dependent JNK activation is critical for tuning GATA3 expression and potentially TH2 differentiation. An important caveat to this approach is that anisomycin induces JNK activation via ribotoxic stress, ultimately leading to inhibition of protein synthesis. However, the latter effect generally occurs at extremely high concentrations (Cano et al., 1994; Mahadevan and Edwards, 1991) and is likely not relevant here since translation-dependent c-Jun induction remained intact (Fig. 5 E) (Blonska et al., 2007).
Further work is needed to fully delineate the mechanism by which JNK activity regulates GATA3 expression. One hypothesis is that decreased JNK activity leads to increased expression and prolonged nuclear accumulation of NFAT2. Our transcriptional data in P/I-stimulated Jurkat T cells treated with JNKi support this hypothesis, as NFAT2 expression is bolstered in an autoregulatory positive feedback loop (Chuvpilo et al., 2002). We further corroborated these data with the use of NFAT2-specific DNA-binding assays and ultimately in TCR-stimulated CADINS patient naïve T cells. Indeed, prior studies determined that JNK-mediated phosphorylation of NFAT2 inhibited interactions with the phosphatase calcineurin (Chow et al., 2000), which is critical for the maintenance of NFAT2 nuclear localization. As the GATA3 locus harbors several potential NFAT-binding sites within conserved noncoding sequences (Scheinman and Avni, 2009), we hypothesize that this increased NFAT2 nuclear localization could potentiate GATA3 expression. Notably, NFAT2 itself is important for the production of TH2 cytokines (Yoshida et al., 1998; Wang et al., 2006), and NFAT2 deletion in mice results in impaired IL-4 secretion (Ranger et al., 1998) and inhibition of allergic traits in murine models of asthma (Koch et al., 2015). Furthermore, NFAT2 nuclear expression was observed in antigen-specific TH2 cells (Faith et al., 2003), and enhanced TH2 responses noted in Jnk1−/− mice were linked to increased nuclear accumulation of NFAT2 (Dong et al., 1998).
Haploinsufficiency of JNK1 (encoded by MAPK8) has been reported in a family with chronic mucocutaneous candidiasis and connective tissue abnormalities (Li et al., 2019). Chemokine receptor-defined TH subsets amongst total CD4+ T cells suggested that patient TH1 cells were elevated, TH17 cells impaired, and despite relatively lower memory CD4+ T cells compared with controls, the TH2 cells were similar. T cell–specific GATA3 expression and serum IgE were not measured, but it is noteworthy that one carrier had persistent elevation of eosinophils when younger, and two out of three carriers had eczematous dermatitis. Although the defect in TH subsets in JNK1 haploinsufficient individuals differs from Jnk1−/− mice, these data highlight the complexity of T cell differentiation and the importance of studies like the one described herein. Indeed, haploinsufficiency in JNK1 would affect many more cell types than those impaired by LOF/DI CARD11 variants. More recently, biallelic NFATC1 (NFAT2) mutations were characterized in patients with recurrent infections, hypogammaglobulinemia, and decreased antibody responses (Kostel Bal et al., 2023). Intriguingly, these patients displayed decreases in TH2 and TFH cells, with decreased GATA3 expression in TH2-enriched (CCR4+CCR6−) cell populations. Given these findings, we posit that increased NFAT2 activity might augment TH2 (and perhaps TFH2/TFH13) differentiation in humans (Martinez et al., 2016). Future studies will further explore the mechanistic connection between DI CARD11 variants and elevated NFAT2 expression in CADINS disease pathogenesis.
The development of atopic disease, both in general and in CADINS disease, is complex and incompletely understood. Although ∼90% of CADINS patients present with some form of atopic disease (Lu et al., 2018), it remains unclear how specific CARD11 DI variants contribute to the TH2 diathesis observed in this cohort. However, we have identified a potential T cell intrinsic mechanism specifically linking attenuated JNK signaling to increased GATA3 and NFAT2 induction, which likely helps to ignite or sustain TH2 cell polarization in combination with reduced NF-κB and glutamine-dependent mTORC1 signaling. This complex mechanism is intriguing, as studies have also identified cross talk and co-regulation between JNK and mTOR signaling (Bai et al., 2022; Walker et al., 2018; Wong et al., 2015). Indeed, our previous work suggests that supplying excess glutamine partially rescues mTORC1 signaling and IFN-γ secretion in CADINS T cells in vitro, the latter only with concomitant addition of exogenous cytokines known to activate both NF-κB and JNK (e.g., TNF-⍺ and IL-1) (Ma et al., 2017). Considering these data and our work described here, we posit that future clinical studies should evaluate combinatorial treatments capable of restoring signaling through all three CARD11-dependent pathways in T cells for maximal efficacy.
Study limitations
While our data provide new insights into CARD11-dependent JNK signaling and its importance in TCR-driven transcriptional programs, our study does not fully elucidate the mechanism by which this signaling pathway increases GATA3 expression. Paradoxically, GATA3 is not upregulated by TCR stimulation in CARD11 KO T cells. This contrast suggests that attenuation versus complete abrogation of CARD11-dependent signaling can result in starkly different outcomes for T cell differentiation and function, with the former contributing to a TH2 diathesis consistent with reduced (but not absent) TCR/CD28 signal strength. This discrepancy also translates to dramatic differences in both T cell responses and clinical presentations of patients harboring heterozygous DI variants versus homozygous CARD11 null mutations (Greil et al., 2013; Stepensky et al., 2013). Although this paradigm holds true for other genes in the TCR signaling pathway (e.g., ZAP70, LAT, and MALT1) (Milner, 2020), further work is required to resolve this conundrum. As mentioned above, decreased JNK signaling allows for increased NFAT2 activation; the potential direct regulation of GATA3 by NFAT2 will be assessed in future studies. Our study also primarily focused on a single node of CARD11-dependent signaling; however, we do not fully appreciate whether CARD11 influences other TCR-induced signaling pathways beyond NF-κB, mTORC1, and JNK. These data highlight the need for future studies that utilize more unbiased approaches to study CARD11 signaling, such as phosphoproteomic or total proteomic analyses. Finally, the study of CARD11 DI variant signaling and function in B cells and polarized CD4+ TH cells is underexplored. Due to limited availability of CADINS patient material, we could not sort sufficient quantities of purified CD4+ T cells or CD19+ B cells for experimentation. Instead, we relied upon non-polarizing, IL-2–dependent expansion of bulk effector T cells from cryopreserved PBMC, which recapitulated TCR signaling defects observed herein using Jurkat T cells, and in resting/naïve primary T cells studied in prior publications (Dorjbal et al., 2019; Ma et al., 2017). Although we uncovered robust, significant effects on acute GATA3 and NFAT2 induction in this context, we acknowledge this is not an ideal approach to study altered TH differentiation. Indeed, we noted a reduction in both IFN-γ and IL-13–secreting CD4+ effector T cells from CADINS patients under these “TH0” culture conditions, although total IFN-γ production (based on mean fluorescence intensity) was significantly reduced in CADINS effectors compared with IL-13 (Fig. S5, C and D), suggesting a slight TH2-favored balance in this system. Interestingly, recent work in mice heterozygous for the CADINS patient–derived R30W CARD11 variant demonstrated age-dependent elevations in serum IgE levels without a concomitant increase in TH2 cells (Hutcherson et al., 2021), underscoring the need for more B cell–focused studies utilizing both human cells and murine models.
Materials and methods
Study design
This preclinical study was designed to (1) assess the effects of CADINS patient–derived CARD11 variants on CARD11-dependent JNK signaling and (2) determine the transcriptional importance of CARD11-JNK signaling in T cells. For in vitro experiments in cell lines, experiments were repeated at least three times, and the total number of experiments for each are defined in the figure legends. For experiments involving CADINS patient T cells, at least one to two HDs were included for each experiment. The statistical analyses described below were verified in consultation with an experienced biostatistician (Dr. Sorana Raiciulescu, Uniformed Services University of the Health Sciences Biostatistics Consulting Center).
Human individuals
Blood from anonymous HDs (buffy coats) was generously provided by Dr. Michael Lenardo (NIAID/NIH, Bethesda, MD, USA) and the National Institutes of Health (NIH) Blood Bank. Patient blood samples and PBMCs were obtained with informed consent under protocols approved by the Institutional Review Boards at the NIH, Columbia University Medical Center, and the Washington University School of Medicine.
Immunoblot analysis and quantitation
Cell lysates were prepared using NP-40 lysis buffer (50 mM Tris, pH 7.4, 0.5 mM EDTA, 150 mM NaCl, 1% NP-40, and 0.5% deoxycholate) with protease and phosphatase inhibitor cocktails added (Sigma-Aldrich). Lysates were separated on 4–20% Tris-glycine gels (Bio-Rad or Invitrogen) and transferred to nitrocellulose using a Trans-Blot Turbo transfer system (Bio-Rad). Immunoblots were incubated with specific primary antibodies (Table 2) followed by incubation with anti-mouse or anti-rabbit secondary antibodies conjugated to IRDye680 or IRDye800 (1:10,000; LI-COR) prior to imaging on an Odyssey CLx infrared imaging system (LI-COR Biosciences). Protein bands were quantified using the Odyssey system (LI-COR), and samples were normalized to a weighted average of total proteins.
Primary antibodies used for immunoblot analyses
| Supplier | Antibody target | Clone | Catalog # | Dilution | RRID # |
|---|---|---|---|---|---|
| Cell Signaling | phospho-ERK (Thr202/Tyr204) | E10 | 9106 | 1:2,000 | RRID:AB_331768 |
| IκB⍺ | L35A5 | 4814 | 1:1,000 | RRID:AB_390781 | |
| phospho-JNK (Thr183/Tyr185) | 98F2 | 4671 | 1:1,000 | RRID:AB_331338 | |
| phospho-JNK (Thr183/Tyr185) | G9 | 9255 | 1:1,000 | RRID:AB_2307321 | |
| phospho-JNK (Thr183/Tyr185) | Polyclonal | 9251 | 1:1,000 | RRID:AB_331659 | |
| Total JNK | Polyclonal | 9252 | 1:1,000 | RRID:AB_2250373 | |
| phospho-c-Jun (Ser63) | S4B3 | 2361 | 1:1,000 | RRID:AB_490908 | |
| c-Jun | L70B11 | 2315 | 1:1,000 | RRID:AB_490780 | |
| β-tubulin | D3U1W | 86298 | 1:5,000 | RRID:AB_2715541 | |
| GATA3 | D13C9 | 5852 | 1:1,000 | RRID:AB_10835690 | |
| phospho-ERK (Thr202/Tyr204) | D13.14.4E | 4370 | 1:2,000 | RRID:AB_2315112 | |
| Total ERK | L34F12 | 4696 | 1:2,000 | RRID:AB_390780 | |
| CARD11 | 1D12 | 4435 | 1:1,000 | RRID:AB_2070359 | |
| phospho-p65 (Ser536) | 93H1 | 3033 | 1:1,000 | RRID:AB_331284 | |
| Total p65 | L8F6 | 6956 | 1:1,000 | RRID:AB_10828935 | |
| V5-Tag | D3H8Q | 13202 | 1:1,000 | RRID:AB_2687461 | |
| Sigma-Aldrich | β-actin | AC-15 | A1978 | 1:30,000 | RRID:AB_476692 |
| FLAG | M2 | F1804 | 1:1,000 | RRID:AB_262044 |
Cell culture and transfection
WT and CARD11 KO Jurkat T cell lines, including those expressing an NF-κB-driven EGFP reporter gene, were kindly provided by Dr. Daniel Krappmann (Helmholtz Munich, Neuherberg, Germany) (Gehring et al., 2019; Gewies et al., 2021; Seeholzer et al., 2018). All Jurkat cells were cultured in complete RPMI 1640 medium (Gibco) supplemented with 1% penicillin-streptomycin (Gibco), 10% FBS (Sigma-Aldrich), and 100 μg/ml normocin (InvivoGen). Jurkat cells were transfected using a BTX Electroporator (BTX Harvard Apparatus: 260 V, 950 μF) in 0.4 ml RPMI 1640 medium supplemented with 10% FBS (no antibiotics) and cultured for 24 h prior to subsequent experiments. For LOF assays, CARD11 KO Jurkat cells were transfected with 1 μg pUNO-CARD11 expression plasmid/106 cells. For DI assays, WT Jurkat cells were transfected with 250 ng pUNO-CARD11 expression plasmid/106 cells. When performing AP-1 reporter assays (both LOF and DI), cells were co-transfected with 0.66 μg AP-1-GFP reporter plasmid/106 cells. Inhibitors for JNK (JNK inhibitor IX, Cayman Chemical; JNK-IN-8, MilliporeSigma) and stimulating reagents PMA (Cayman), ionomycin (Sigma-Aldrich), and anisomycin (Selleck Chem) were dissolved in DMSO.
Intracellular flow cytometry
For intracellular flow cytometry in Jurkat T cells, WT or CARD11 KO Jurkat T cells were plated at 1 × 10⁶ cells/ml and incubated for 2 h with DMSO or JNKi prior to stimulation with 20 ng/ml PMA and 1 μg/ml ionomycin for 6 h. For intracellular flow cytometry in primary human T cells, HD or CADINS patient T cells were plated at 1 × 10⁶ cells/ml and stimulated with 20 ng/ml PMA and 1 μg/ml ionomycin for 6 h. Brefeldin A (BioLegend) was added after 2 h of stimulation in experiments examining intracellular cytokine expression. Stimulation was halted by placing cells on ice and adding 1 ml of ice-cold PBS to each sample. Cells were collected via centrifugation for 5 min at 1,500 RPM, resuspended in 200 μl PBS, and plated in polypropylene 96-well U-bottom plates (Thermo Fisher Scientific). After washing with 200 μl PBS at 1,500 rpm for 5 min, supernatant was decanted, and cells were resuspended in 100 μl of Zombie NIR (BioLegend) and kept in the dark at room temperature for 15 min. Cells were then washed as before and resuspended in 50 μl of surface staining master mix. Cells were stained with antibodies targeting surface-expressed molecules outlined in Table 3. The buffer for this staining mix was 50:50 of FACS Buffer (PBS + 1% FBS and 0.2% sodium azide) and Brilliant Staining Buffer (BD Biosciences). In primary human PBMC, this mix also included 20 μl each of Human TruStain FcX and True-Stain Monocyte Blocker (BioLegend). Cells were incubated in staining mix on ice, in the dark, for 30 min. After surface staining, cells were washed as before and resuspended in 100 μl True-Nuclear Fixation Buffer (BioLegend) and incubated in the dark at room temperature for 1 h. Cells were then collected via centrifugation at 1,500 RPM for 5 min, supernatant was decanted, and cells were resuspended with 50 μl of intracellular staining mix containing Alexa Fluor 647 anti-human GATA3 (BioLegend) in Permeabilization Buffer from the True-Nuclear Fixation Buffer Kit. Cells were incubated in staining mix at room temperature, in the dark, for 40 min. After intracellular staining, cells were washed with Permeabilization Buffer and then resuspended in 200 μl FACS buffer in flow cytometry tubes. For samples examining intracellular cytokine expression, surface staining with Zombie NIR and other surface markers was completed as above. For intracellular staining, the Cyto-Fast Fix/Perm Buffer Set (BioLegend) was used. After surface staining, samples were washed and resuspended in 150 μl of Cyto-Fast Fix/Perm Buffer and incubated for 20 min in the dark at room temperature. Cells were washed with Cyto-Fast Perm Wash solution and then incubated with 100 μl of cytokine staining mix in the dark at room temperature for 20 min (Table 3). The staining mix buffer was 75:25 Cyto-Fast Perm Wash and Brilliant Staining Buffer. Cells were washed once more in Cyto-Fast Perm wash and resuspended in 200 μl FACS buffer in flow cytometry tubes. Samples were analyzed using a five-laser Cytek Aurora, maintained by the Uniformed Services University of the Health Sciences Flow Cytometry Core Facility. Analysis of flow cytometry data was performed with FlowJo software (v10.10.0).
Flow cytometry antibodies and conjugates
| Supplier | Antibody target | Clone | Catalog # | Dilution | RRID # |
|---|---|---|---|---|---|
| T cell subset surface phenotyping panel | |||||
| BioLegend | Brilliant Violet 421 anti-human CD3 | UCHT1 | 300434 | 1:100 | RRID:AB_10897105 |
| Brilliant Violet 510 anti-human CD45RA | HI100 | 304142 | 1:200 | RRID:AB_2561947 | |
| Brilliant Violet 570 anti-human CD127 (IL-1Rα) | A019D5 | 351308 | 1:100 | RRID:AB_2832685 | |
| Brilliant Violet 605 anti-human CD95 (Fas) | DX2 | 305627 | 1:50 | RRID:AB_2562444 | |
| Brilliant Violet 650 anti-human CD197 (CCR7) | G043H7 | 353234 | 1:50 | RRID:AB_2563867 | |
| Brilliant Violet 711 anti-human CD25 | BC96 | 302636 | 1:100 | RRID:AB_2562910 | |
| Brilliant Violet 750 anti-human CD69 | FN50 | 310954 | 1:100 | RRID:AB_2876611 | |
| Brilliant Violet 785 anti-human CD196 (CCR6) | G034E3 | 353422 | 1:100 | RRID:AB_2563660 | |
| Alexa Fluor 488 anti-human CD19 | HIB19 | 302219 | 1:100 | RRID:AB_389313 | |
| Alexa Fluor 488 anti-human CD56 (NCAM) | 5.1H11 | 362518 | 1:100 | RRID:AB_2564093 | |
| Alexa Fluor 488 anti-human CD11b | ICRF44 | 301318 | 1:100 | RRID:AB_493017 | |
| PE anti-human CCR10 | 6588-5 | 341504 | 1:100 | RRID:AB_1595446 | |
| PE/Fire 640 anti-human KLRG1 | 2F1/KLRG1 | 138440 | 1:200 | RRID:AB_2936685 | |
| PE/Cyanine5 anti-human CD28 | CD28.2 | 302910 | 1:200 | RRID:AB_314312 | |
| PE/Fire 700 anti-human CD154 (CD40L) | 24–31 | 310862 | 1:200 | RRID:AB_3097395 | |
| PE/Cyanine7 anti-human CD57 | HNK-1 | 359624 | 1:400 | RRID:AB_2632689 | |
| PE/Fire 810 anti-human CD294 (CRTH2) | BM-16 | 350135 | 1:100 | RRID:AB_2941528 | |
| Alexa Fluor 647 anti-human/mouse/rat CD278 (ICOS) | C398.4A | 313516 | 1:100 | RRID:AB_2122582 | |
| APC/Fire 750 anti-human CD152 (CTLA-4) | BNI3 | 369628 | 1:100 | RRID:AB_2820030 | |
| BD Biosciences | BUV395 anti-human CD195 (CCR5) | 3A9 | 742914 | 1:50 | RRID:AB_2741142 |
| BUV496 anti-human CD4 | SK3 | 612936 | 1:100 | RRID:AB_2870220 | |
| BUV563 anti-human CD27 | M-T271 | 741366 | 1:200 | RRID:AB_2870866 | |
| BUV615 anti-human CD194 (CCR4) | 1G1 | 613000 | 1:50 | RRID:AB_2870269 | |
| BUV661 anti-human CD279 (PD-1) | EH12.1 | 569246 | 1:100 | RRID:AB_2874457 | |
| BUV805 anti-human CD8 | SK1 | 612889 | 1:400 | RRID:AB_2833078 | |
| BV480 anti-human CD185 (CXCR5) | RF8B2 | 566142 | 1:50 | RRID:AB_2739540 | |
| BB700 anti-human CD183 (CXCR3) | 1C6/CXCR3 | 566532 | 1:100 | RRID:AB_2739742 | |
| RB780 anti-human CD45RO | UCHL1 | 569124 | 1:400 | RRID:AB_3484045 | |
| Primary human T cell intracellular GATA3 panel | |||||
| BioLegend | Brilliant Violet 421 anti-human CD3 | UCHT1 | 300434 | 1:100 | RRID:AB_10897105 |
| Brilliant Violet 510 anti-human CD45RA | HI100 | 304142 | 1:200 | RRID:AB_2561947 | |
| Brilliant Violet 650 anti-human IFN-γ | 4S.B3 | 502538 | 1:50 | RRID:AB_2563608 | |
| Thermo Fisher Scientific | FITC anti-human IL-13 | 85BRD | 11–7136-42 | 1:50 | RRID:AB_2572515 |
| BD Biosciences | BUV496 anti-human CD4 | SK3 | 612936 | 1:100 | RRID:AB_2870220 |
| BUV805 anti-human CD8 | SK1 | 612889 | 1:400 | RRID:AB_2833078 | |
| RB780 anti-human CD45RO | UCHL1 | 569124 | 1:400 | RRID:AB_3484045 | |
| Primary human T cell intracellular cytokines panel | |||||
| BioLegend | Brilliant Violet 421 anti-human CD3 | UCHT1 | 300434 | 1:100 | RRID:AB_10897105 |
| Brilliant Violet 510 anti-human CD45RA | HI100 | 304142 | 1:200 | RRID:AB_2561947 | |
| Brilliant Violet 650 anti-human IFN-γ | 4S.B3 | 502538 | 1:50 | RRID:AB_2563608 | |
| Thermo Fisher Scientific | FITC anti-human IL-13 | 85BRD | 11–7136-42 | 1:50 | RRID:AB_2572515 |
| BD Biosciences | BUV496 anti-human CD4 | SK3 | 612936 | 1:100 | RRID:AB_2870220 |
| BUV805 anti-human CD8 | SK1 | 612889 | 1:400 | RRID:AB_2833078 | |
| RB780 anti-human CD45RO | UCHL1 | 569124 | 1:400 | RRID:AB_3484045 | |
| Jurkat T cell intracellular flow cytometry antibodies and conjugates | |||||
| BioLegend | Brilliant Violet 421 anti-human CD3 | UCHT1 | 300434 | 1:100 | RRID:AB_10897105 |
| Brilliant Violet 510 anti-human CD45RA | HI100 | 304142 | 1:200 | RRID:AB_2561947 | |
| Alexa Fluor 647 anti-human GATA3 | 16E10A23 | 653810 | 1:20 | RRID:AB_2563217 | |
Primary human CD4+ T cell isolation, inhibition, and stimulation for GATA3 accumulation
For experiments involving HD CD4+ T cells, buffy coats were generously provided by Dr. Michael Lenardo and the NIH Blood Bank. PBMCs were isolated via Ficoll density centrifugation, and CD4+ T cells were purified from PBMCs using the EasySep Human CD4+ T cell Isolation Kit (Stem Cell Technologies). For activation, appropriate wells of a 24-well cell culture–treated plate were coated with 5 μg/ml anti-human CD3 (BD Biosciences; HIT3⍺) in PBS or empty PBS for 2 h at 37°C. Isolated CD4+ T cells were resuspended at 2 × 10⁶ cells/ml in RPMI 1640 medium supplemented with 1% penicillin-streptomycin and 10% FBS (complete RPMI 1640) and preincubated with DMSO or 1 μM JNKi for 1 h, then transferred to PBS or anti-CD3–coated wells, and anti-human CD28 (CD28.2; BD Biosciences) was added to anti-CD3–coated wells at 5 μg/ml. Cells were incubated for 24 h at 37°C prior to collection for lysate preparation and subsequent immunoblot analysis.
Primary human T cell culture and expansion
HD PBMCs were cryopreserved after isolation via Ficoll density centrifugation from buffy coats generously provided by Dr. Michael Lenardo and the NIH Blood Bank. For the activation and expansion of primary human T cells from previously frozen PBMCs, PBMCs from HDs or CADINS patients were rapidly thawed at 37°C, washed with complete RPMI 1640, and then rested overnight in fresh complete RPMI 1640 at 2–2.5 × 10⁶ cells/ml. Subsequently, PBMCs were counted, resuspended at 2 × 10⁶ cells/ml, and activated for 3 days with anti-CD3/anti-CD28–conjugated beads at a 1:1 cell:bead ratio. Anti-CD3/anti-CD28–conjugated beads were generated by coupling Dynabeads M-450 Epoxy beads (Thermo Fisher Scientific) with anti-human CD3 (HIT3⍺; BD) and anti-human CD28 (CD28.2; BD) antibodies according to the manufacturer’s protocol. Activating beads were removed with a magnet after 3 days of activation, and activated T cells were cultured in complete RPMI 1640 supplemented with 100 IU/ml r-hIL-2 (Peprotech) at 1–1.5 × 10⁶ cells/ml for 8–12 days before signaling assays were completed.
Transcriptome profiling
For RNA-seq experiments, WT and CARD11 KO Jurkat T cells were freshly thawed and cultured for 1 week prior to treating cells for RNA isolation. Five individual experiments were performed as follows: 2 × 10⁶ Jurkat T cells (WT or CARD11 KO) were incubated for 2 h with DMSO, JNK inhibitor IX, or JNKi prior to stimulation with 20 ng/ml PMA and 1 μg/ml ionomycin for 2 h. Cells were collected, pelleted, and resuspended in Trizol (Invitrogen). RNA was isolated using a Direct-zol RNA MiniPrep Kit (Zymo Research) according to the manufacturer’s instructions, including on-column DNaseI treatment. After elution, RNA was quantified with the Quant-iT Ribogreen RNA Kit according to the manufacturer’s instructions (Invitrogen). All samples were normalized to 20 ng/μl, aliquoted, and frozen at −80°C. For each sample, a total RNA input of 200 ng was used for library preparation using the Illumina Stranded Total RNA Prep with Ribo-Zero Plus Kit (Illumina) and IDT for Illumina RNA UD Indexes Set A, Ligation (96 indexes, 96 samples). Sequencing libraries were quantified by real-time PCR using KAPA Library Quantification Kit for NGS (Roche) and assessed for size distribution on a Fragment Analyzer (Agilent) to confirm absence of adapter dimers and unligated library molecules. Sequencing libraries were pooled at <40-plex and sequenced on a NovaSeq 6000 (Illumina) using a 200 cycle SBS kit (Illumina) with paired-end reads at 101-bp length targeting >60 million reads per sample.
For RNA-seq experiments of CARD11 R75W patients and healthy controls, PBMCs were thawed and rested in complete RPMI 1640 medium overnight in 37°C CO2 incubator. Naïve CD4+ T cells were isolated by sorting (FACSAria) for CD4+CD45RO− cells, and 1 × 10⁵ cells were cultured in a 96-well flat bottom plate in RPMI 1640 medium in the presence of MACSiBead particles loaded with biotinylated antibodies against human CD2, CD3, and CD28 (Miltenyi Biotec) for 3 days, with 25 ng/ml recombinant human IL-2 (Peprotech). After 3 days of culture, 3 × 10⁵ cells were collected, pelleted, and RNA was isolated using a miRNAeasy kit (Qiagen) according to the manufacturer’s instructions, including on-column DNaseI treatment. After elution, RNA was quantified with a bioanalyzer assay using an RNA Pico chip (Agilent). For the RNA-seq pipeline, the Clontech Ultra Low v4 kit (Takara Bio) was used for cDNA synthesis, and Nextera XT kit (Illumina) was used for library preparation. Libraries were sequenced using an Element AVITI at the JP Sulzberger Columbia Genome Center with paired-end reads at 75-bp length targeting 40 million reads per sample.
After sequencing, the Nextflow nf-core/rnaseq (v3.4) workflow was used to estimate a matrix of sample gene expression values (Di Tommaso et al., 2017; Ewels et al., 2020; Patel et al., 2021), using the reference human genome (GRCh37; Ensembl release 75) obtained from Illumina’s iGenomes resource (https://support.illumina.com/sequencing/sequencing_software/igenome.html). Briefly, paired-end DNA sequence FastQ files were merged by sample (two/sample) and underwent read quality control (FastQC v0.11.9) prior to adapter and quality trimming (Trim Galore! v0.6.7), then input into Salmon’s (v1.5.2) (Patro et al., 2017) mapping mode for gene expression matrix quantification. Further sequencing quality control was performed via subsequent trimmed read alignment using STAR (v2.6.1d) (Dobin et al., 2013), SAMtools (v1.13) (Li et al., 2009), and Picard (v2.25.7, https://broadinstitute.github.io/picard/), followed by RSeQC (v3.0.1) (Wang et al., 2012), Qualimap (v2.2.2-dev) (Okonechnikov et al., 2016), and Preseq (v3.1.1, https://smithlabresearch.org/software/preseq/). After confirming the absence of sequencing or sequencing library anomalies, we proceeded to differential expression analysis.
Here we deployed the DESeq2 package (v1.32.0) (Love et al., 2014) for the R language and environment for statistical computing (v4.1.1) (R Core Team, 2021) following the recommended bulk RNA-seq analysis workflow from the DESeq2 vignette (https://bioconductor.org/packages/release/bioc/vignettes/DESeq2/inst/doc/DESeq2.html), modeling genotype, stimulus, inhibitor, and their subsequent interaction terms. We also included a batch term per DESeq2’s recommended methodology for controlling inter-batch variance. Briefly, we imported the resultant Salmon gene expression matrices via tximport (v1.22.0) (Soneson et al., 2016), then performed quality control visualizations to better understand sources of variance within our dataset. We calculated between sample correlation, between sample distances, and PCs of a regularized logarithm transformation of the expression matrix blind to our specified model using the 500 genes with the greatest variance. We then tested for differential gene expression using our specified model with the Wald test and multiple testing correction via the Benjamini–Hochberg procedure (target false discovery rate = 0.05) and performed effect size shrinkage as provided by the apeglm R package (Zhu et al., 2019). The results for main effects and interaction effects were then evaluated to identify DEGs, using an absolute LFC value >0.4 (∼1.3-fold change) as a cutoff for biological relevance (Mognol et al., 2019). TF activities were then inferred via the R package decoupleR (v2.7.1) (Badia-I-Mompel et al., 2022) on selected model contrasts with TF regulons imported from the CollecTRI meta resource (Müller-Dott et al., 2023; Vazquez et al., 2022). Data from CollecTRI were imported with the R package OmnipathR (v3.11.1) (Türei et al., 2021).
TF DNA binding
For the detection of DNA binding by activated TFs, nuclear lysates were prepared using NE-PER Nuclear and Cytoplasmic Extraction Reagents (Thermo Fisher Scientific) according to the manufacturer’s instructions. The binding of activated FOSB, FOS, JUNB, JUND, and JUN were measured via TransAM AP-1 Family DNA-binding ELISAs as per the manufacturer’s instructions (Active Motif). The binding of activated NFATc1 (NFAT2) was measured via the TransAM NFATc1 DNA-binding ELISA per the manufacturer’s instructions (Active Motif). For each experiment, 10 × 106 cells were stimulated with P/I or DMSO. Specific cell lines/inhibitors/stimulation timeframes used in each experiment are indicated in the respective figure legends.
Cloning and mutagenesis
WT human CARD11, as well as the CARD11 variants E57D, L194P, and R975W, were expressed from the pUNO-CARD11-3x FLAG construct, as previously described (Ma et al., 2017). R891Q was a novel variant generated via site-directed mutagenesis with the following primers: (forward: 5′-CGTCTCTCGCAAGCAAGCTTC-3′; reverse: 5′-GAAGCTTGCTTGCGAGAGACG-3′) using Phusion DNA polymerase (Invitrogen) for linear amplification followed by DpnI digest as previously described (Ma et al., 2017). Mutations were confirmed by Sanger sequencing, and all plasmids were isolated for transfection from transformed competent NEB 5-alpha Escherichia coli (New England BioLabs) using a GenElute HP Plasmid Maxi-Prep kit (Sigma-Aldrich). Our novel AP-1 reporter was cloned using the pGL4.32 NF-κB–driven luciferase reporter (Promega) as a template, with all PCR amplification steps performed using Phusion DNA polymerase. The pGL4.32 luciferase gene is fused to a PEST destabilization domain, to decrease the protein half-life, rendering the reporter more transcriptionally responsive. First, GFP2 (also called ppluGFP2 and copGFP; from Pontellina plumata) (Shagin et al., 2004) was cloned out of the pmaxGFP vector (Lonza) using the following primers: (forward: 5′-TGGCAATCCGGTACTGTTGGTAAAGCCACCATGCCCGCCATGAAGATC-3′; reverse: 5′-CTCCTCCACCTCGGGAGGGAAGCCGTGAGATAATCGAGCTCGAGATCTGG-3′), and the pGL4.32 backbone was linearized with the following primers, including the PEST destabilization domain: (forward: 5′-TCTCACGGCTTCCCTCCCGAGG-3′; reverse: 5′-GGTGGCTTTACCAACAGTACCG-3′). The amplified segments were assembled using the NEBuilder HiFi DNA Assembly Master Mix (NEB), and successful insertion of GFP2 was confirmed by Sanger sequencing. After maxi-prep, this NF-κB-GFP reporter was used as template for creation of the AP-1 reporter. The NF-κB response element (RE) was removed via linear amplification with the following primers: (forward: 5′-AGATCTGGCCTCGGCGGCCAAGCTT-3′; reverse: 5′-GAGCTCAGGTACCGGCCAGTTAGGCC-3′). The AP-1 RE (a 6× repeat of the AP-1 consensus site TGAC/GTCA) (Angel et al., 1987) was constructed via annealing and amplification of the following overlapping primers: (forward: 5′-GGCCTAACTGGCCGGTACCTGAGCTCTGAGTCAGTGACTCAGTGAGTCAGTGACTCAGTGAGTCAGTGACTCAG-3′; reverse: 5′-GTGTCTAAGCTTGGCCGCCGAGGCCAGATCTTGATATCCTCGAGCTGAGTCACTGACTCACTGAGTCACTGAC-3′). The backbone and RE fragments were assembled using the NEBuilder HiFi DNA Assembly Master Mix, and successful insertion of the RE was confirmed by Sanger sequencing.
Statistical analysis
All statistical analyses were performed using GraphPad Prism (v10). For in vitro assays evaluating the differences between treatment and genotype (AP-1– and NF-κB–driven GFP reporters), two-way ANOVA with correction for multiple comparisons was used (multiple comparisons tests are described in individual figure legends). Relative expression of acute signaling proteins in CADINS patient T cells was compared with ordinary one-way ANOVA and Dunnett’s multiple comparison test. The fold change in GATA3 accumulation in patient T cells was analyzed by two-way ANOVA with Tukey’s multiple comparison tests. Differences between mean values were considered significant when P < 0.05 for all experiments, and significance levels are indicated in each figure legend.
Online supplemental material
Supplementary information related to the antibody and inhibitor validation, RNA-seq analyses, extended analyses on individual CADINS patients, and salient data provided in response to reviewer critiques are summarized below. Fig. S1 shows that the MEK inhibition with trametinib confirms that phospho-JNK antibody cross-reacts with phospho-ERK and that JNK-c-Jun signaling is a minor contributor to AP-1 signaling. Fig. S2 shows that the CARD11 DI variants expressed at a 50:50 ratio to WT CARD11 disrupt CARD11-dependent signaling pathways to different extents. Fig. S3 shows that the RNA-seq produced robust data, JNK inhibitor IX did not recapitulate important controls, and CARD11 KO cells demonstrate significant reductions in NF-κB and AP-1 TF activities. Fig. S4 shows that the patient T cells show decreased TCR signaling and increased GATA3 accumulation. Fig. S5 shows that the patient CD4+ and CD8+ T cells display increased intracellular GATA3. Table S1 shows the brief clinical description of patient harboring R891Q (c.2672G>A) CARD11 variant. Table S2 shows the DEGs in WT Jurkat T cells stimulated with P/I versus unstimulated cells. Table S3 shows the DEGs in CARD11 KO Jurkat T cells stimulated with P/I versus WT Jurkat T cells stimulated with P/I. Table S4 shows the DEGs in WT Jurkat T cells stimulated with P/I in the presence of JNKi versus DMSO. Table S5 shows the TF activities in WT Jurkat T cells stimulated with P/I versus unstimulated cells. Table S6 shows the TF activities in CARD11 KO Jurkat T cells stimulated with P/I versus WT Jurkat T cells stimulated with P/I. Table S7 shows the TF activities in WT Jurkat T cells stimulated with P/I in the presence of JNKi versus DMSO. Table S8 shows the clinical flow cytometric profiling of peripheral blood lymphocytes in CADINS patients. Table S9 shows the flow cytometric phenotyping of effector T cells derived from cryopreserved PBMC from CADINS patients versus HD controls.
Data availability
RNA-seq data are deposited in the Gene Expression Omnibus database (accession numbers GSE288360 and GSE287077). Other patient-related data and materials are available upon request to Dr. Snow ([email protected]).
Acknowledgments
We thank the patients and their families for participating in this research. We also thank Dr. Daniel Krappmann for supplying CARD11 KO Jurkat cells, Dr. Michael Lenardo and the National Institutes of Health (NIH) Blood Bank for supplying normal donor buffy coats, other members of the Snow laboratory for their helpful discussions, and the Uniformed Services University of the Health Sciences Student Bioinformatics Initiative and Biostatistics Consulting Center for extensive assistance with RNA-seq data analysis and statistical analyses, respectively. We also thank the J.P. Sulzberger Columbia Genome Center for performing RNA-seq on CADINS patient and HD naïve CD4+ T cells. The opinions and assertions expressed herein are those of the authors and are not to be construed as reflecting the views of the Uniformed Services University of the Health Sciences or the United States Department of Defense.
This work was supported by NIH grant R01AI168295 (to A.L. Snow and J.D. Milner) and the Jeffrey Modell Foundation Specific Defect Research Program (to A.L. Snow). This research was funded in part through the NIH/National Cancer Institute Cancer Center Support Grant P30CA013696 and used the Genomics and High Throughput Screening Shared Resource at Columbia University.
Author contributions: B.M. Bauman: conceptualization, data curation, formal analysis, investigation, methodology, software, visualization, and writing—original draft, review, and editing. J.R. Stinson: investigation and writing—review and editing. M.A. Kallarakal: investigation. L.H. Huang: investigation. A.M. Frank: methodology and software. G. Sukumar: data curation, methodology, project administration, supervision, and writing—review and editing. N. Saucier: data curation. C.L. Dalgard: data curation, formal analysis, funding acquisition, investigation, methodology, project administration, resources, supervision, and writing—review and editing. A.Y. Chan: resources and writing—review and editing. J.D. Milner: conceptualization, formal analysis, funding acquisition, investigation, methodology, resources, supervision, visualization, and writing—original draft. M.A. Cooper: resources. A.L. Snow: conceptualization, funding acquisition, project administration, supervision, and writing—original draft, review, and editing.

