


During autophagy, toxic cargo is encapsulated by autophagosomes and trafficked to lysosomes for degradation. NBR1, an autophagy receptor targeting ubiquitinated aggregates, serves as a model for studying the multivalent, heterotypic interactions of cargo-bound receptors. Here, we find that three critical NBR1 partners—ATG8-family proteins, FIP200, and TAX1BP1—each bind to distinct, overlapping determinants within a short linear interaction motif (SLiM). To explore whether overlapping SLiMs extend beyond NBR1, we analyzed >100 LC3-interacting regions (LIRs), revealing that FIP200 and/or TAX1BP1 binding to LIRs is a common phenomenon and suggesting LIRs as protein interaction hotspots. Phosphomimetic peptides demonstrate that phosphorylation generally enhances FIP200 and ATG8-family binding but not TAX1BP1, indicating differential regulation. In vivo, LIR-mediated interactions with TAX1BP1 promote optimal NBR1 flux by leveraging additional functionalities from TAX1BP1. These findings reveal a one-to-many binding modality in the LIR motif of NBR1, illustrating the cooperative mechanisms of autophagy receptors and the regulatory potential of multifunctional SLiMs.
Introduction
Autophagy is a highly conserved pathway that maintains cell health by breaking down and recycling cellular components such as protein aggregates or damaged organelles. This process involves the formation of a double-membraned vesicle, the autophagosome, which encapsulates unwanted cellular cargo and transports it to lysosomes for degradation (Søreng et al., 2018). While autophagy occurs at a basal level to manage cell waste, cells can activate autophagy in response to urgent needs such as starvation or stress. Many stress-induced forms of autophagy are highly selective for specific cargoes. This specificity is conferred by selective autophagy receptors (SARs), proteins that identify cargo and direct it toward the autophagic machinery to ensure its efficient degradation (Kirkin and Rogov, 2019; Lamark and Johansen, 2021; Vargas et al., 2023).
Among these receptors, sequestosome-1 (SQSTM1), also known as p62, is a prominent member of the SQSTM1-like receptor (SLR) family, which includes p62, NBR1, TAX1BP1, NDP52, and Optineurin. SLRs are equipped with several critical domains: ubiquitin-binding domains for cargo recognition, Atg8 interacting regions/motifs (AIMs) for attachment to autophagosomal membranes, and various domains that promote oligomerization (Johansen and Lamark, 2020). A key role of p62 is the formation of cytoplasmic clusters called p62 bodies, through a process of polymerization and phase separation (Ciuffa et al., 2015; Wurzer et al., 2015; Sun et al., 2018; Zaffagnini et al., 2018; Kurusu et al., 2024). This mechanism is critical for the cellular clearance of protein aggregates through a specialized form of autophagy known as aggrephagy (Bauer et al., 2023).
The SLR family exhibits significant functional interconnectivity, with both unique and overlapping roles that enable a coordinated response to diverse cellular challenges. Although p62 is often highlighted in studies of SLR function, NBR1 is considered an ancestral SLR with a gene duplication in early metazoans giving rise to p62 (Svenning et al., 2011; Rasmussen et al., 2022). This evolutionary split allowed NBR1 and p62 to evolve distinct functions despite their structural similarities. For example, p62 retains an extended PB1 domain essential for forming p62 filaments, while NBR1, having lost one binding face of its PB1 domain, depends on interaction with the p62 PB1 domain for filament recruitment (Lamark et al., 2003; Wilson et al., 2003; Ciuffa et al., 2015; Jakobi et al., 2020). NBR1 recruitment is thought to cap the p62 filaments and enhance binding to polyubiquitinated substrates through its higher-affinity UBA domain (Turco et al., 2021). Following the sequestration of ubiquitinated cargo by p62 and NBR1, TAX1BP1 is recruited to p62 bodies through its interaction with NBR1. Together, TAX1BP1 and NBR1 recruit FIP200, a crucial autophagy initiation factor, thereby initiating autophagosome formation around cargo (Ohnstad et al., 2020; Turco et al., 2021). This collaborative action among SLRs promotes efficient encapsulation and degradation of cellular debris, underscoring their collective role in maintaining cellular health.
The functionality of SARs is also closely linked to their interaction with the autophagosomal membrane facilitated by SAR binding to mammalian Atg8-family proteins, which include the LC3 and GABARAP subfamilies. This interaction is mediated by short linear interaction motifs (SLiMs) known as Atg8-family interacting motifs (AIMs) or LC3-interacting regions (LIRs) (Birgisdottir et al., 2013). LIRs have emerged as a key focus of autophagy research. These motifs, with their consensus sequence [F/W/Y]0-X1-X2-[I/L/V]3, are typically embedded within intrinsically disordered regions and lack stable 3D structures in isolation (Popelka and Klionsky, 2015). However, they can adopt specific, constrained conformations when binding to their targets (Rogov et al., 2023). In addition, some SARs feature a FIP200-interacting region (FIR) that can resemble and sometimes co-exist with the LIR (Turco et al., 2019; Fu et al., 2021; Zhou et al., 2021; Goodall et al., 2022). While these interactions are typically of modest affinity, LIR and FIR binding can be significantly enhanced by posttranslational modifications such as phosphorylation, further underscoring the complex regulation of autophagy receptors (Gubas and Dikic, 2022).
In this study, we investigate the role of multivalent, heterotypic interactions in selective autophagy using the archetypal receptor NBR1. We demonstrate that NBR1 binds three key partners—Atg8-family proteins, FIP200, and TAX1BP1—through a single region containing a short SLiM. Expanding our analysis to over 100 LIR-containing peptides, we observe frequent overlap between LC3-, FIP200-, and TAX1BP1-interacting regions (TIRs). Mutational peptide arrays indicate that each binding event is governed by unique molecular determinants rather than a shared motif. Complementary in vivo studies reveal that TAX1BP1 uniquely enhances NBR1 flux, reliant on NBR1’s multifunctional SLiM. These findings underscore the organizational complexity of this one-to-many binding modality, providing detailed insights into the cooperative dynamics among autophagy receptors and emphasizing the critical and versatile role of multifunctional SLiMs in regulating autophagy.
Results
NBR1 contains overlapping SLiMs that recruit TAX1BP1, LC3A, and FIP200
NBR1 is an archetypal autophagy receptor and an excellent model for deciphering the role of multivalent, heterotypic interactions made by cargo-bound receptors (Rasmussen et al., 2022). NBR1, TAX1BP1, and p62 were previously reported to interact, which enhances the process of aggrephagy (Kirkin et al., 2009; Zaffagnini et al., 2018; Sánchez-Martín et al., 2020; Schlütermann et al., 2021; Turco et al., 2021; Vargas et al., 2023). In vitro, the interaction between NBR1 and TAX1BP1 was reported to depend on a conserved FW domain of NBR1 (Turco et al., 2021). To corroborate this interaction and investigate whether other NBR1 domains also contribute to binding TAX1BP1 in vivo, we systematically truncated NBR1 from both its N- and C-termini (Fig. S1 A). We co-transfected HEK293T cells with myc-tagged TAX1BP1 and TagBFP-V5-tagged NBR1 variants. We then immunoprecipitated NBR1 and monitored for co-immunoprecipitation of myc-TAX1BP1 (Fig. 1 A). Among these truncations, NBR11–622 and NBR1781-end emerged as the longest N- and C-terminal fragments, respectively, lacking observable TAX1BP1 binding, suggesting the presence of a TAX1BP1 binding site in this range (i.e., NBR1623–780) (Fig. 1 A). Intriguingly, this region does not contain the FW domain but contains two other notable motifs: coiled-coil 2 (CC2, residues 686–727), previously reported to bind FIP200 (Turco et al., 2021), and a well-characterized SLiM, the LIR (residues 732–735) (Kirkin et al., 2009).
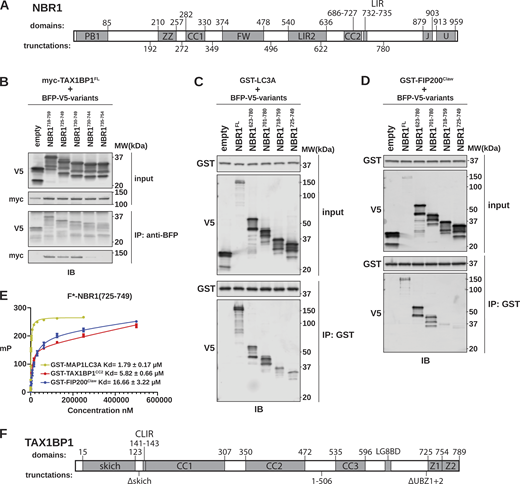
NBR1 binds LC3A, FIP200Claw, and TAX1BP1CC2through a shared unstructured region. (A) Schematic of NBR1 domain architecture. Domain boundaries are listed above the schematic. Truncation boundaries are listed below the schematic. (B) HEK293T cells were co-transfected with full-length (FL) myc-TAX1BP1 and the indicated BFP-V5-NBR1 truncations. Extracts derived from transfected cells were immunoprecipitated (IP) with protein G dynabeads conjugated with anti-BFP antibody. Input and eluates were resolved by SDS-PAGE followed by immunoblotting (IB) with the indicated antibodies. (C and D) HEK293T cells were transfected with indicated BFP-V5-NBR1 truncations. Extracts derived from transfected cells were incubated with GST-resin pre-bound with purified GST-MAP1LC3A or GST-FIP200Claw. Input and eluates were resolved by SDS-PAGE followed by immunoblotting (IB) with the indicated antibodies. (E) Purified GST-MAP1LC3A, GST-FIP200Claw, or GST-TAX1BP1CC2 were serially diluted and incubated with 50 nM FITC-labeled NBR1725–749. Fluorescence anisotropy was measured by plate reader and analyzed using a nonlinear fit to determine KD. (F) Schematic of TAX1BP1 architecture. Domain boundaries are listed above the schematic. Truncation boundaries are listed below the schematic. Source data are available for this figure: SourceData FS1.
NBR1 binds LC3A, FIP200Claw, and TAX1BP1CC2through a shared unstructured region. (A) Schematic of NBR1 domain architecture. Domain boundaries are listed above the schematic. Truncation boundaries are listed below the schematic. (B) HEK293T cells were co-transfected with full-length (FL) myc-TAX1BP1 and the indicated BFP-V5-NBR1 truncations. Extracts derived from transfected cells were immunoprecipitated (IP) with protein G dynabeads conjugated with anti-BFP antibody. Input and eluates were resolved by SDS-PAGE followed by immunoblotting (IB) with the indicated antibodies. (C and D) HEK293T cells were transfected with indicated BFP-V5-NBR1 truncations. Extracts derived from transfected cells were incubated with GST-resin pre-bound with purified GST-MAP1LC3A or GST-FIP200Claw. Input and eluates were resolved by SDS-PAGE followed by immunoblotting (IB) with the indicated antibodies. (E) Purified GST-MAP1LC3A, GST-FIP200Claw, or GST-TAX1BP1CC2 were serially diluted and incubated with 50 nM FITC-labeled NBR1725–749. Fluorescence anisotropy was measured by plate reader and analyzed using a nonlinear fit to determine KD. (F) Schematic of TAX1BP1 architecture. Domain boundaries are listed above the schematic. Truncation boundaries are listed below the schematic. Source data are available for this figure: SourceData FS1.
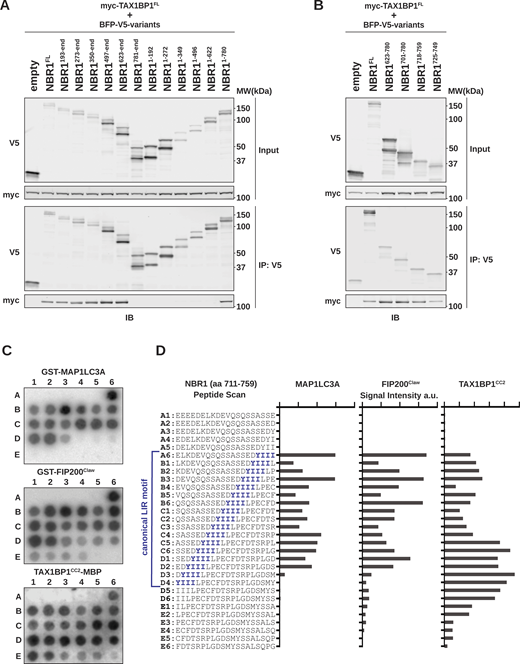
A short unstructured region in NBR1 mediates interactions with MAP1LC3A, FIP200, and TAX1BP1. (A and B) HEK293T cells were co-transfected with full-length (FL) myc-TAX1BP1 and indicated BFP-V5-NBR1 truncations. Extracts derived from transfected cells were immunoprecipitated (IP) with protein G dynabeads conjugated with anti-V5 antibody. Input and eluates were resolved by SDS-PAGE followed by immunoblotting (IB) with the indicated antibodies. (C) A sliding frame peptide array spanning NBR1711–759 was probed with 100 nM GST-MAP1LC3A, GST-FIP200Claw (residues 1490–1594), or TAX1BP1CC2-MBP (residues 346–506). Antibody-HRP conjugates were used to visualize binding to the arrays. Each spot represents a one residue register shift. (D) Quantification of HRP-derived intensities from C. Peptide sequences and corresponding positions in C are indicated (A1–E6). The canonical NBR1 LIR motif is indicated in blue. a.u., arbitrary units. Source data are available for this figure: SourceData F1.
A short unstructured region in NBR1 mediates interactions with MAP1LC3A, FIP200, and TAX1BP1. (A and B) HEK293T cells were co-transfected with full-length (FL) myc-TAX1BP1 and indicated BFP-V5-NBR1 truncations. Extracts derived from transfected cells were immunoprecipitated (IP) with protein G dynabeads conjugated with anti-V5 antibody. Input and eluates were resolved by SDS-PAGE followed by immunoblotting (IB) with the indicated antibodies. (C) A sliding frame peptide array spanning NBR1711–759 was probed with 100 nM GST-MAP1LC3A, GST-FIP200Claw (residues 1490–1594), or TAX1BP1CC2-MBP (residues 346–506). Antibody-HRP conjugates were used to visualize binding to the arrays. Each spot represents a one residue register shift. (D) Quantification of HRP-derived intensities from C. Peptide sequences and corresponding positions in C are indicated (A1–E6). The canonical NBR1 LIR motif is indicated in blue. a.u., arbitrary units. Source data are available for this figure: SourceData F1.
To pinpoint the NBR1–TAX1BP1 interaction site, we made additional truncations of the NBR1623–780 region, identifying NBR1725–749 as sufficient for interaction with TAX1BP1 (Fig. 1 B). This segment harbors the NBR1 LIR (Rozenknop et al., 2011), suggesting a potential overlap between the TAX1BP1-interacting region (TIR) and LIR. Notably, two peptides that failed to pulldown TAX1BP1 give important clues to a potential TIR motif (Fig. S1 B). NBR1735–754 lacks the LIR and NBR1730–744 contains the LIR but lacks downstream residues, yet neither peptide was sufficient for binding, suggesting a related but distinct mode of binding between NBR1 and TAX1BP1 or LC3-family proteins. As a control, we confirmed NBR1 LIR functionality using GST-tagged LC3A as bait, confirming NBR1725–749 is sufficient to interact with LC3A (Fig. S1 C). Thus, the extended LIR of NBR1 plays a dual role in binding TAX1BP1 and Atg8-family proteins.
Intriguingly, within the initially identified TAX1BP1-binding region of NBR1623–780 lies CC2, previously recognized for its interaction with FIP200 (Turco et al., 2021). To validate this interaction, we purified a GST-tagged C-terminal fragment of FIP200 (1490–1594, hereafter FIP200Claw), immobilized it on GST-resin, and probed with HEK293T cell lysates expressing various NBR1 truncations. As anticipated, the removal of CC2 led to reduced NBR1 association with FIP200Claw, consistent with previous findings (Turco et al., 2021), yet NBR1725–749 maintained a reduced FIP200Claw interaction (Fig. S1 D). As such, a single unstructured region of NBR1, residues 725–749, can mediate the interaction between NBR1 and an array of critical autophagy mediators.
To further characterize these binding events, we used fluorescence anisotropy to determine the relative affinity of these interactions using a fluorescently labelled NBR1 peptide (FITC-NBR1725–749) (Fig. S1 E). LC3A bound with a KD of 1.79 ± 0.17 μM, consistent with previous literature (Rozenknop et al., 2011). FIP200Claw bound with a KD of 16.66 ± 3.22 μM. TAX1BP1 coiled-coil 2 (residues 346–506, hereafter TAX1BP1CC2) (Fig. S1 F), which we previously reported to be required for TAX1BP1 binding to NBR1, bound with a KD of 5.82 ± 0.66 μM (Ohnstad et al., 2020). Taken together, all three binding events occur with micromolar affinity and well within the range of previously reported affinities for LC3- and FIP200- interacting proteins (Wirth et al., 2019, 2021; Zhou et al., 2021). Further supporting these data, BFP-tagged FIP200Claw and TAX1BP1CC2 were sufficient to co-localize with tf-NBR1 when co-expressed in cells, whereas BFP alone was not (Fig. S2, A–D), suggesting that these affinities are sufficient to mediate protein–protein interactions in vivo.

TAX1BP1 CC2 and FIP200 Claw are sufficient to interact with NBR1 in vivo. (A) Representative confocal micrographs of HeLa PentaKO cells co-transduced with tf-NBR1 and indicated BFP-TAX1BP1 variants. Scale bar: 10 µm. (B) Quantification of A. Data represent median of three independently generated cell lines. Pearson’s correlation coefficient between RFP and BFP (reflective of NBR1 and TAX1BP1 co-localization) was calculated using Cell Profiler. Scatter plots represent median ± SD. Each data point represents a single replicate. n ≥ 17 cells per replicate. P values were determined using one-way ANOVA (P < 0.0001). Multiple comparisons were made using Tukey correction. ****, P < 0.0001; ns, not significant. (C) Representative confocal micrographs of HeLa PentaKO cells co-transduced with tf-NBR1 and BFP-FIP200Claw. Scale bar: 10 µm. (D) Quantification of C. Data represent median of three independently generated cell lines. Pearson’s correlation coefficient between RFP and BFP (reflective of NBR1 and FIP200Claw co-localization) was calculated using Cell Profiler. Scatter plots represent median ± SD. Each data point represents a single replicate. n > 16 cells per replicate. P values were determined using one-way ANOVA (P < 0.0001). Multiple comparisons were made using Tukey correction. ****, P < 0.0001. (E) KD values (±standard error of the fit) for NBR1722–745, NBR1725–749, and GST-His6 control. Values are derived from ForteBio Octet BLI analysis using purified GST-His-tagged peptides immobilized on NiNTA sensors and probed against titrations of MBP-LC3A, MBP-FIP200Claw, TRX-TAX1BP1CC2-MBP, and MBP-GABARAPL1. Experiments were performed in duplicate (separate days). n.b., no detectable binding.
TAX1BP1 CC2 and FIP200 Claw are sufficient to interact with NBR1 in vivo. (A) Representative confocal micrographs of HeLa PentaKO cells co-transduced with tf-NBR1 and indicated BFP-TAX1BP1 variants. Scale bar: 10 µm. (B) Quantification of A. Data represent median of three independently generated cell lines. Pearson’s correlation coefficient between RFP and BFP (reflective of NBR1 and TAX1BP1 co-localization) was calculated using Cell Profiler. Scatter plots represent median ± SD. Each data point represents a single replicate. n ≥ 17 cells per replicate. P values were determined using one-way ANOVA (P < 0.0001). Multiple comparisons were made using Tukey correction. ****, P < 0.0001; ns, not significant. (C) Representative confocal micrographs of HeLa PentaKO cells co-transduced with tf-NBR1 and BFP-FIP200Claw. Scale bar: 10 µm. (D) Quantification of C. Data represent median of three independently generated cell lines. Pearson’s correlation coefficient between RFP and BFP (reflective of NBR1 and FIP200Claw co-localization) was calculated using Cell Profiler. Scatter plots represent median ± SD. Each data point represents a single replicate. n > 16 cells per replicate. P values were determined using one-way ANOVA (P < 0.0001). Multiple comparisons were made using Tukey correction. ****, P < 0.0001. (E) KD values (±standard error of the fit) for NBR1722–745, NBR1725–749, and GST-His6 control. Values are derived from ForteBio Octet BLI analysis using purified GST-His-tagged peptides immobilized on NiNTA sensors and probed against titrations of MBP-LC3A, MBP-FIP200Claw, TRX-TAX1BP1CC2-MBP, and MBP-GABARAPL1. Experiments were performed in duplicate (separate days). n.b., no detectable binding.
Three binding interactions mediated by a short, unstructured span of NBR1 imply that its interactions with FIP200 and TAX1BP1, akin to LC3A, are orchestrated by SLiMs. To precisely map these motifs, we constructed a single amino acid sliding-frame peptide array spanning NBR1 residues 711–759. We probed the sliding frame peptide array with purified GST-tagged LC3A, GST-tagged FIP200Claw, or MBP-tagged TAX1BP1CC2 and visualized with HRP-conjugated antibodies targeting GST or MBP (Fig. 1 C). LC3A binding correlated strongly with the presence of the core LIR motif (YIII, spots A6–D3; Fig. 1 D), validating our approach. Similarly, FIP200Claw primarily engaged the core LIR. In contrast, the maximal binding of TAX1BP1CC2 did not fully align with the LIR itself but with subsequent residues (spots C5–D6), suggesting an extended or alternative motif beyond the core LIR motif (Fig. 1 D).
FIR and TIR overlap with LIRs is common despite divergent motifs
Multiple instances of FIRs overlapping with LIRs have been reported (Turco et al., 2019; Zhou et al., 2021; Goodall et al., 2022), while FIRs that do not coincide with LIRs have also been documented (Fujita et al., 2013; Smith et al., 2018; Ravenhill et al., 2019; Fu et al., 2021; Zhou et al., 2021). This raises a fundamental question: To what extent do LIRs and FIRs overlap? Moreover, our demonstration of TAX1BP1 binding in relation to an LIR and FIR prompts an additional question: do LIRs or FIRs also bind TAX1BP1? To answer these questions, we printed a peptide array comprising 100 established LIR sequences from the LIR Central database (Chatzichristofi et al., 2023) Each peptide included 10 amino acids upstream and downstream of the core LIR (typically 24 residues total) (Table S1). As a control, we included the multifunctional NBR1725–749 sequence identified in Fig. 1 B. We also included five previously reported FIR peptides as a control for FIP200 binding (Fujita et al., 2013; Smith et al., 2018; Ravenhill et al., 2019; Fu et al., 2021; Zhou et al., 2021).
The LIR family array was probed as in Fig. 1 C by incubating with purified HA-tagged LC3A, HA-tagged GABARAPL1, GST-tagged FIP200Claw, or MBP-tagged TAX1BP1CC2. Each protein probe was subsequently visualized via HRP-conjugated antibody. The binding of LC3A, GABARAPL1, FIP200Claw, and TAX1BP1CC2 was prevalent, but not universal. LC3A bound 29 peptides, GABARAPL1 bound 49 peptides, FIP200 bound 57 peptides, and TAX1BP1 bound 49 peptides (Fig. 2, A and B). These data show that among the spectrum of known LIR-containing peptides, there exists an equally rich spectrum of FIR motifs and an unexplored array of potential TIR motifs. In comparison, previously validated FIR peptides were largely selective for FIP200Claw binding (Fig. 2 B).

Comprehensive analysis of LIR binding interactions with Atg8-family proteins, FIP200 Claw , and TAX1BP1 CC2 . (A) The LIR peptide array, containing peptides selected from the iLIR database, was probed with 100 nM GST-LC3A, GST-GABARAPL1, GST-FIP200Claw, or TAX1BP1CC2-MBP. Antibody-HRP conjugates were used for visualization. Peptide spots that bound none of the four protein probes (“never-binders”) are labeled with red asterisk and excluded from further analysis. Redundant protein names reflect multiple LIR sequences within a single protein. LIR motif of each peptide is shown for reference. (B) FIR containing peptides from selected literature, probed as in A. (C) Spearman r correlation analysis of SLiM binding preference for each protein (LC3A, GABARAPL1, GST-FIP200Claw, or TAX1BP1CC2-MBP) based on spot intensity in A and B. “Never-binders” and phosphomimetic peptides were excluded from analysis. N = 79. (D) IceLogo sequence alignment derived from all bound peptides (determined by blinded scorers). All unbound peptides were used as a reference set to calculate position specific P value for each amino acid. “Never-binders” were excluded from analysis. Enriched amino acids are positive, under-represented amino acids are negative. Shown as percent enrichment (P value <0.05).
Comprehensive analysis of LIR binding interactions with Atg8-family proteins, FIP200 Claw , and TAX1BP1 CC2 . (A) The LIR peptide array, containing peptides selected from the iLIR database, was probed with 100 nM GST-LC3A, GST-GABARAPL1, GST-FIP200Claw, or TAX1BP1CC2-MBP. Antibody-HRP conjugates were used for visualization. Peptide spots that bound none of the four protein probes (“never-binders”) are labeled with red asterisk and excluded from further analysis. Redundant protein names reflect multiple LIR sequences within a single protein. LIR motif of each peptide is shown for reference. (B) FIR containing peptides from selected literature, probed as in A. (C) Spearman r correlation analysis of SLiM binding preference for each protein (LC3A, GABARAPL1, GST-FIP200Claw, or TAX1BP1CC2-MBP) based on spot intensity in A and B. “Never-binders” and phosphomimetic peptides were excluded from analysis. N = 79. (D) IceLogo sequence alignment derived from all bound peptides (determined by blinded scorers). All unbound peptides were used as a reference set to calculate position specific P value for each amino acid. “Never-binders” were excluded from analysis. Enriched amino acids are positive, under-represented amino acids are negative. Shown as percent enrichment (P value <0.05).
We note that 32 LIR peptides did not bind to any of the four probes. The presence of these “never-binders” in our assay may arise from several factors. First, some may represent true non-binding events (e.g., a spuriously annotated LIR). Others may selectively bind to Atg8-family members not included in this study. Additionally, peptide insolubility or conformational instability on the array could impair binding, preventing some peptides from adopting optimal conformations under assayed conditions. Interestingly, NBR1YIII was classified as a never-binder, while an extended peptide spanning this region, NBR1725–749, bound to all probes. To investigate this discrepancy, we purified both peptides as GST fusions and evaluated their interactions with all four probes using biolayer interferometry (BLI) (Fig. S2 E). In this context, LC3A, GABARAPL1, and FIP200claw bound both peptides with comparable affinities. TAX1BP1CC2 also bound both peptides, although it bound more tightly to the C-terminally extended NBR1 peptide, consistent with the C-terminal binding mode identified in Fig 1, C and D. These findings suggest that the classification of NBR1YIII as a never-binder is the result of peptide insolubility on the array rather than representing a genuine lack of binding activity. Therefore, as we cannot distinguish true non-binding events from technical artifacts, never-binders were excluded from further analysis (Fig. 2 A, red asterisks).
To assess the relationship between LIRs, FIRs, and TIRs, we conducted a correlation analysis based on binding intensity (Fig. 2 C). Our analysis revealed that the binding of LC3A and GABARAPL1 is moderately correlated (r = 0.63, P = <0.001, N = 79), reflecting the previously reported preferences of individual LIR motifs for different Atg8-family proteins (Rogov et al., 2017; Atkinson et al., 2019; Wirth et al., 2019). However, LC3A-binding (r = 0.33, P = 0.003) and GABARAPL1-binding (r = 0.37, P = <0.001) only weakly correlated with FIP200Claw-binding, highlighting that not all LIR motifs are FIR motifs. Furthermore, TAX1BP1-binding showed no significant correlation with LC3A binding (r = −0.22, P = 0.27), GABARAPL1 binding (r = −0.10, P = 0.18), or FIP200 binding (r = −0.30, P = 0.37). These results suggest that the mechanism of TAX1BP1-binding is distinct from that of the core LIR motif.
Related, but distinct, binding motifs mediate LC3A, FIP200, and TAX1BP1 binding
Discrepancies in binding among LC3A, GABARAPL1, FIP200, and TAX1BP1 led us to explore the specific binding determinants recognized by each protein. To achieve this, we generated iceLogos to identify consensus motifs for each probe (Fig. 2 D) (Colaert et al., 2009). This approach successfully recapitulated known differences in LIR preferences between LC3A and GABARAPL1 (i.e., valine at the +1 and +3 positions) (Rogov et al., 2017, 2023), thereby validating the use of peptide arrays to derive meaningful consensus motifs. Similarly, analysis of FIP200Claw binding revealed a MAP1LC3A-like motif, albeit with reduced stringency for an aromatic residue at the +0 position and an extended negative charge, consistent with Zhou et al. (2021). In contrast, TAX1BP1CC2 did not reveal a strong motif and was de-enriched for the negative charge.
To more precisely map interaction determinants, we focused on NBR1 as a test case and created a mutational peptide array for the minimally sufficient NBR1725–749 peptide, systematically mutating each amino acid position to all other amino acids. The array was probed as in Fig. 1 C using HA-LC3A, MBP-GABARAPL1, GST- FIP200Claw, or TAX1BP1CC2-MBP. As expected, LC3A binding reflected a consensus LIR motif ([F/W/Y]0-X1-X2-[I/L]3) (Rogov et al., 2023), with additional contributions from negatively charged sites at positions −2, −1, and +6 relative to the first residue of the LIR (Fig. 3 A). Likewise, GABARAPL1 also recapitulated the expected Gabarap-interacting motif (GIM, [F/W]0-V-X2-[V/I]4), with negative charges contributing at the −2 and −1 positions (Fig. 3 B) (Rogov et al., 2017). Interestingly, the FIP200Claw probe revealed high tolerance to single point mutations within the core hydrophobic motif of NBR1, yet was sensitive to the removal of acidic residues from the peptide (i.e., positions −2, −1, +6, +9) (Fig. 3 C). In contrast, TAX1BP1CC2 displayed a distinct binding pattern, requiring specific residues at the +4, +5, and +8 positions relative to the core LIR motif (Fig. 3 D). These findings collectively support that Atg8-family proteins, FIP200Claw, and TAX1BP1CC2 interact through unique yet overlapping short linear motifs within an unstructured region of NBR1.

Mutational analysis of NBR1 reveals unique binding determinants for MAP1LC3A, GABARPL1, FIP200 Claw , and TAX1BP1 CC2 . (A–D) Mutational peptide array of NBR1728–747 probed with HA-LC3A (A), MBP-GABARAPL1 (B), GST-FIP200Claw (C), or TAX1BP1CC2-MBP (D), and immunoblotted with HRP-conjugated antibodies to GST or MBP. Each amino acid position is substituted for every other amino acid. NBR1’s canonical LIR motif (YIII) is indicated in blue. Red arrows indicate key residues identified for each SLiM binding motif. Membrane was cut where indicated to facilitate stripping.
Mutational analysis of NBR1 reveals unique binding determinants for MAP1LC3A, GABARPL1, FIP200 Claw , and TAX1BP1 CC2 . (A–D) Mutational peptide array of NBR1728–747 probed with HA-LC3A (A), MBP-GABARAPL1 (B), GST-FIP200Claw (C), or TAX1BP1CC2-MBP (D), and immunoblotted with HRP-conjugated antibodies to GST or MBP. Each amino acid position is substituted for every other amino acid. NBR1’s canonical LIR motif (YIII) is indicated in blue. Red arrows indicate key residues identified for each SLiM binding motif. Membrane was cut where indicated to facilitate stripping.
Phosphorylation has been reported previously to enhance binding to multiple LIRs and FIRs (Rogov et al., 2023). Given the notable contribution of acidic residues to NBR1 binding by LC3A, GABARAPL1, and FIP200, we aimed to more systematically evaluate the contribution of phosphorylation to Atg8-family and FIP200 binding. Noting the importance of phosphorylation at the −2 or −1 positions, we identified all LIRs from our array containing possible phosphorylation sites (serine or threonine residues) at these positions (Table S1). We then mutated each residue to aspartic acid and evaluated the effect of the phosphomimetic residues on the interaction with Atg8-family proteins (both LC3A and GABARAPL1), FIP200, and TAX1BP1 (compare Fig. 2 A, column 1, and Fig. 4 A). LC3A and GABARAPL1 showed a significant increase in signal intensity with phosphomimetic variants (P = 0.0002 and P = 0.0029, respectively), as did FIP200Claw (P = <0.0001), aligning with previous findings (Fig. 4 B) (Rogov et al., 2023). In contrast, TAX1BP1CC2 displayed no significant difference between native and phosphomimetic variants (P = 0.8222) (Fig. 4 B).

Phosphorylation differentially regulates LIRs, FIRs, and TIRs. (A) Phosphomimetic peptide variants were generated for each LIR peptide containing phosphorylatable residues (Ser or Thr) at the −2 or −1 positions relative to the core LIR motif. The phosphomimetic LIR peptide array was probed with 100 nM GST-LC3A, GST-GABARAPL1, GST-FIP200Claw, or TAX1BP1CC2-MBP. The array was visualized with antibody-HRP conjugates and imaged simultaneously with the native LIR array in Fig. 2 A to allow direct comparison. Peptide spots that bound none of the four protein probes (“never-binders”) are labeled with red asterisk and excluded from further analysis. Probe images of P-CCPG and P-TNIP were previously presented in Fig. 2 B and are re-presented here for comparison. (B) Comparison of spot intensity between native (Fig. 2 A) and phosphomimetic variant peptides (A) using a nonparametric t test with Wilcoxon matched pairs signed rank test. **, P < 0.01; ****, P < 0.0001; ns, not significant.
Phosphorylation differentially regulates LIRs, FIRs, and TIRs. (A) Phosphomimetic peptide variants were generated for each LIR peptide containing phosphorylatable residues (Ser or Thr) at the −2 or −1 positions relative to the core LIR motif. The phosphomimetic LIR peptide array was probed with 100 nM GST-LC3A, GST-GABARAPL1, GST-FIP200Claw, or TAX1BP1CC2-MBP. The array was visualized with antibody-HRP conjugates and imaged simultaneously with the native LIR array in Fig. 2 A to allow direct comparison. Peptide spots that bound none of the four protein probes (“never-binders”) are labeled with red asterisk and excluded from further analysis. Probe images of P-CCPG and P-TNIP were previously presented in Fig. 2 B and are re-presented here for comparison. (B) Comparison of spot intensity between native (Fig. 2 A) and phosphomimetic variant peptides (A) using a nonparametric t test with Wilcoxon matched pairs signed rank test. **, P < 0.01; ****, P < 0.0001; ns, not significant.
As differences between negatively charged residues (phosphomimetics) and phospho-residues are well-documented (Popelka and Klionsky, 2022), we extended our analysis by probing an additional peptide array containing peptides with phosphorylated serine/threonine residues at the −2 and −1 position (Fig. S3 A). As anticipated, we observed strong correlations between phosphomimetic peptides and phosphorylated serine/threonine peptides for most probes (LIR: 0.83, P < 0.0001; GIR: 0.62, P = 0.0006; FIR: 0.81, P < 0.0001) (Fig. S3 B). Unexpectedly, TAX1BP1CC2 binding shows a weak correlation (0.27, P > 0.18) (Fig. S3 B), however, still demonstrates no preference between non-phosphorylated, phosphomimetic, and phosphorylated peptides (Fig. S3, C and D). Importantly, the discrepancy between phosphomimetic and phosphorylated peptides for TAX1BP1CC2 is unlikely due to technical variability as technical replicates show a high correlation (0.84–0.93, P < 0.0001) (Fig. S3 E). These findings suggest that the occasional charge effects observed for TAX1BP1 likely represent context-specific interactions rather than a generalizable charge-driven mechanism. Thus, while subtle phosphoregulation of the TAX1BP1 motif remains possible, our data indicate that phosphorylation does not consistently influence TAX1BP1 interactions. Together with our iceLogo consensus sequences, these findings are consistent with the model that negative charge—whether through phosphorylation or acidic residues—enhances LIR and FIR-mediated interactions (Zhou et al., 2021; Rogov et al., 2023). In contrast, TIR-mediated interactions involve a divergent motif less sensitive to charge or phosphorylation, suggesting that TAX1BP1CC2 recognizes its targets through a distinct mechanism.

TAX1BP1 is insensitive to negative charge and phosphorylation of −2, −1 LIR positions. (A) Phosphorylated peptide variants were generated for each LIR peptide containing phosphorylatable residues (Ser or Thr) at the −2 or −1 positions relative to the core LIR motif. The phosphorylated LIR peptide array was probed with 100 nM GST-LC3A, GST-GABARAPL1, GST-FIP200Claw, or GST-TAX1BP1CC2. Antibody-HRP conjugates were used to visualize the arrays. Peptide spots that bound none of the four protein probes (“never-binders”) are labeled with red asterisk and excluded from further analysis. (B) Spearman r correlation test was performed between phosphomimetic (Pm) probe in Fig. 4 A and phosphorylated (Ph) probe in A. “Never-binders” from phosphomimetic array were excluded from analysis. (C) Native, phosphomimetic, and phosphorylated peptide arrays were probed in parallel with TAX1BP1CC2-MBP to allow direct comparison. (D) Comparison of spot intensity between native, phosphomimetic (Pm), and phosphorylated (Ph) variant peptides using nonparametric Friedman test one-way ANOVA with Dunn’s multiple comparison test. ns, not significant. (E) Spearman r correlation test was performed between TAX1BP1 phosphomimetic (Pm) probe in (Fig. 4 A) and technical replicate (C), and between TAX1BP1 phosphorylated (Ph) probe in (A) and technical replicate (C).
TAX1BP1 is insensitive to negative charge and phosphorylation of −2, −1 LIR positions. (A) Phosphorylated peptide variants were generated for each LIR peptide containing phosphorylatable residues (Ser or Thr) at the −2 or −1 positions relative to the core LIR motif. The phosphorylated LIR peptide array was probed with 100 nM GST-LC3A, GST-GABARAPL1, GST-FIP200Claw, or GST-TAX1BP1CC2. Antibody-HRP conjugates were used to visualize the arrays. Peptide spots that bound none of the four protein probes (“never-binders”) are labeled with red asterisk and excluded from further analysis. (B) Spearman r correlation test was performed between phosphomimetic (Pm) probe in Fig. 4 A and phosphorylated (Ph) probe in A. “Never-binders” from phosphomimetic array were excluded from analysis. (C) Native, phosphomimetic, and phosphorylated peptide arrays were probed in parallel with TAX1BP1CC2-MBP to allow direct comparison. (D) Comparison of spot intensity between native, phosphomimetic (Pm), and phosphorylated (Ph) variant peptides using nonparametric Friedman test one-way ANOVA with Dunn’s multiple comparison test. ns, not significant. (E) Spearman r correlation test was performed between TAX1BP1 phosphomimetic (Pm) probe in (Fig. 4 A) and technical replicate (C), and between TAX1BP1 phosphorylated (Ph) probe in (A) and technical replicate (C).
Structural modeling identifies a unique binding mode between NBR1 and TAX1BP1
To further characterize TAX1BP1 binding, we focused on the contribution of the +4, +5, and +8 positions within NBR1725–749 (Fig. 3 D). Co-immunoprecipitation of full-length myc-TAX1BP1 and BFP-V5-tagged NBR1 variants (L736A, P737A, and F740A) confirmed that these positions contribute to TAX1BP1 binding relative to a Y732A LIR mutant (Fig. 5 A and Fig. S4 A) (Kirkin et al., 2009). Conversely, the F740A mutation did not impair FIP200Claw or LC3A binding as compared with an NBR1Y732A control, indicating its specificity for TAX1BP1 despite its proximity to the LIR (Fig. S4, B and C). Thus, Y732A and F740A mutations can be used to selectively disrupt interactions with LC3A and TAX1BP1, respectively.
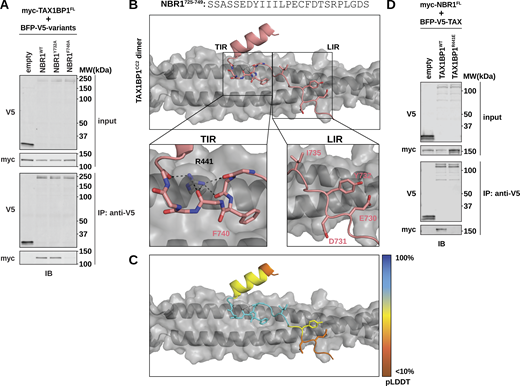
Structural modeling reveals a unique interface between TAX1BP1 and NBR1. (A) HEK293T cells were co-transfected with full-length (FL) myc-TAX1BP1 and indicated BFP-V5-NBR1FL variants. Extracts derived from transfected cells were immunoprecipitated (IP) with protein G dynabeads conjugated with anti-V5 antibody. Input and eluates were resolved by SDS-PAGE followed by immunoblotting (IB) with the indicated antibodies. (B) Predictive structural model of NBR1725–749 with a dimer TAX1BP1CC2. The model was generated using AlphaFold AF2-multimer with MMseqs2 through Google Colab. The TIR inset highlights the hydrophobic binding pocket occupied by NBR1F740 and the backbone interactions mediated by TAX1BP1R441. The LIR inset highlights the lack of meaningful interactions between NBR1LIR and TAX1BP1CC2. (C) Predicted IDDT per position (pLDDT) for NBR1725–749 as an estimation of model confidence. Blue is high confidence, orange is low confidence. (D) HEK293T cells were co-transfected with full-length (FL) myc-NBR1 and indicated BFP-V5-TAX1BP1 variants. Extracts derived from transfected cells were immunoprecipitated (IP) with protein G dynabeads conjugated with anti-V5 antibody. Input and eluates were resolved by SDS-PAGE followed by immunoblotting (IB) with the indicated antibodies. Source data are available for this figure: SourceData F5.
Structural modeling reveals a unique interface between TAX1BP1 and NBR1. (A) HEK293T cells were co-transfected with full-length (FL) myc-TAX1BP1 and indicated BFP-V5-NBR1FL variants. Extracts derived from transfected cells were immunoprecipitated (IP) with protein G dynabeads conjugated with anti-V5 antibody. Input and eluates were resolved by SDS-PAGE followed by immunoblotting (IB) with the indicated antibodies. (B) Predictive structural model of NBR1725–749 with a dimer TAX1BP1CC2. The model was generated using AlphaFold AF2-multimer with MMseqs2 through Google Colab. The TIR inset highlights the hydrophobic binding pocket occupied by NBR1F740 and the backbone interactions mediated by TAX1BP1R441. The LIR inset highlights the lack of meaningful interactions between NBR1LIR and TAX1BP1CC2. (C) Predicted IDDT per position (pLDDT) for NBR1725–749 as an estimation of model confidence. Blue is high confidence, orange is low confidence. (D) HEK293T cells were co-transfected with full-length (FL) myc-NBR1 and indicated BFP-V5-TAX1BP1 variants. Extracts derived from transfected cells were immunoprecipitated (IP) with protein G dynabeads conjugated with anti-V5 antibody. Input and eluates were resolved by SDS-PAGE followed by immunoblotting (IB) with the indicated antibodies. Source data are available for this figure: SourceData F5.
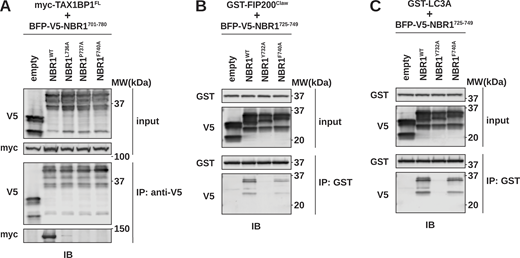
Selective mutations disrupt NBR1 interaction with LC3 or TAX1BP1CC2. (A) HEK293T cells were co-transfected with full-length (FL) myc-TAX1BP1 and indicated BFP-V5-NBR1 variants. Extracts derived from transfected cells were immunoprecipitated (IP) with protein G dynabeads conjugated with anti-V5 antibody. Input and eluates were resolved by SDS-PAGE followed by immunoblotting (IB) with the indicated antibodies. (B and C) HEK293T cells were transfected with indicated BFP-V5-NBR1 variants. Extracts derived from transfected cells were incubated with GST-resin prebound with purified GST-FIP200Claw (B) or GST-MAP1LC3A (C). Input and eluates were resolved by SDS-PAGE followed by immunoblotting (IB) with the indicated antibodies. Source data are available for this figure: SourceData FS4.
Selective mutations disrupt NBR1 interaction with LC3 or TAX1BP1CC2. (A) HEK293T cells were co-transfected with full-length (FL) myc-TAX1BP1 and indicated BFP-V5-NBR1 variants. Extracts derived from transfected cells were immunoprecipitated (IP) with protein G dynabeads conjugated with anti-V5 antibody. Input and eluates were resolved by SDS-PAGE followed by immunoblotting (IB) with the indicated antibodies. (B and C) HEK293T cells were transfected with indicated BFP-V5-NBR1 variants. Extracts derived from transfected cells were incubated with GST-resin prebound with purified GST-FIP200Claw (B) or GST-MAP1LC3A (C). Input and eluates were resolved by SDS-PAGE followed by immunoblotting (IB) with the indicated antibodies. Source data are available for this figure: SourceData FS4.
Numerous structural studies have detailed the interaction between LIRs and Atg8-family proteins, as well as the interaction between FIRs and FIP200Claw (Fu et al., 2021; Zhou et al., 2021; Rogov et al., 2023). However, the structural basis of the NBR1–TAX1BP1 interaction was uncharacterized. To better understand how NBR1 interacts with TAX1BP1, we utilized AlphaFold structural modeling to predict the interface between NBR1 and TAX1BP1 and compared it with the predicted NBR1 interactions with LC3A and FIP200Claw (Mirdita et al., 2022).
Our AlphaFold model, pairing NBR1725–749 with a dimer of TAX1BP1CC2, provides several key insights. Notably, while the NBR1 LIR motif makes high-confidence interactions with LC3A and FIP200Claw (Fig. S5, A–F), it makes minimal contribution to TAX1BP1 binding (Fig. 5 B [LIR inset] and Fig. 5 C). Instead, residue F740 of NBR1 embeds in a hydrophobic pocket on either side of the TAX1BP1 coiled-coil dimer (Fig. 5 B [TIR inset]), a finding supported by our peptide array and co-immunoprecipitation data, which independently identified F740 as a crucial determinant of NBR1 binding to TAX1BP1.

Comparative interactions between NBR1 and LC3, FIP200 Claw , and TAX1BP1 CC2 . (A) Predictive structural model of NBR1725–749 with FIP200Claw. Model was generated using AlphaFold AF2-multimer with MMseqs2 through Google Colab. TIR inset shows no meaningful interactions. (B) LIR inset from A, highlighting core LIR residues (NBR1Y732 and NBR1I735) and the interaction between NBR1D731 and NBR1E730 with FIP200R1573 and FIP200K1569, respectively. (C) Predicted IDDT per position (pLDDT) for NBR1725–749 in complex with FIP200Claw. Blue is high confidence; red is low confidence. (D) Predictive structural model of NBR1725–749 with MAP1LC3A. The model was generated using AlphaFold AF2-multimer with MMseqs2 through Google Colab. TIR inset shows no meaningful interactions. (E) LIR inset from D, highlighting core LIR residues (NBR1Y732 and NBR1I735) and NBR1D731 and NBR1E730. (F) Predicted IDDT per position (pLDDT) for NBR1725–749 in complex with MAP1LC3A. Blue is high confidence; red is low confidence. (G) Buried surface area (BSA) analysis using the PDBePISA server of NBR1725–749 with MAP1LC3A, FIP200Claw, and TAX1BP1CC2. NBR1 residues spanning 727–747 are shown.
Comparative interactions between NBR1 and LC3, FIP200 Claw , and TAX1BP1 CC2 . (A) Predictive structural model of NBR1725–749 with FIP200Claw. Model was generated using AlphaFold AF2-multimer with MMseqs2 through Google Colab. TIR inset shows no meaningful interactions. (B) LIR inset from A, highlighting core LIR residues (NBR1Y732 and NBR1I735) and the interaction between NBR1D731 and NBR1E730 with FIP200R1573 and FIP200K1569, respectively. (C) Predicted IDDT per position (pLDDT) for NBR1725–749 in complex with FIP200Claw. Blue is high confidence; red is low confidence. (D) Predictive structural model of NBR1725–749 with MAP1LC3A. The model was generated using AlphaFold AF2-multimer with MMseqs2 through Google Colab. TIR inset shows no meaningful interactions. (E) LIR inset from D, highlighting core LIR residues (NBR1Y732 and NBR1I735) and NBR1D731 and NBR1E730. (F) Predicted IDDT per position (pLDDT) for NBR1725–749 in complex with MAP1LC3A. Blue is high confidence; red is low confidence. (G) Buried surface area (BSA) analysis using the PDBePISA server of NBR1725–749 with MAP1LC3A, FIP200Claw, and TAX1BP1CC2. NBR1 residues spanning 727–747 are shown.
To further assess our structural predictions, we performed buried surface area (BSA) analysis using the PDBePISA server (Fig. S5 G) (Krissinel and Henrick, 2007). This analysis highlights the largely overlapping motifs recognized by FIP200 and LC3A. In addition, the BSA analysis emphasizes the importance of distinct amino acids in NBR1 for its interaction with TAX1BP1, especially F740 which has a BSA of 104.62 Å2 upon binding to TAX1BP1 but a BSA of 0 Å2 upon binding to either LC3A or FIP200.
Moreover, our structural model predicts that Arg441 of TAX1BP1 forms a finger-like protrusion that makes backbone interactions with the +6, +7, +9, and +12 positions of the NBR1 peptide, inducing a small kink in NBR1 to accommodate binding (Fig. 5 B [TIR inset]). To validate this model, we generated a charge inversion mutant, TAX1BP1R441E. Immunoprecipitation of TAX1BP1 variants from HEK293T cells co-transfected with full-length myc-tagged NBR1 showed that R441E impairs the interaction of TAX1BP1 with NBR1 (Fig. 5 D). Similarly, in vivo colocalization between tf-NBR1 and BFP-TAX1BP1 was significantly reduced in the presence of either NBR1F740A or TAX1BP1R441E (Fig. S6, A and B). These findings underscore the predictive power of our model and demonstrate that disrupting either side of the binding interface, NBR1F740A or TAX1BP1R441E, is sufficient to inhibit the interaction between full-length NBR1 and TAX1BP1. Moreover, these effects are specific as the TAX1BP1R441E mutation does not affect TAX1BP1 dimerization, another critical facet of TAX1BP1CC2 (Fig. S6 C). Together, these data show that varied conformations taken by a short, disordered region of NBR1 bring key residues into contact with diverse binding pockets on LC3A, FIP200Claw, and TAX1BP1CC2.
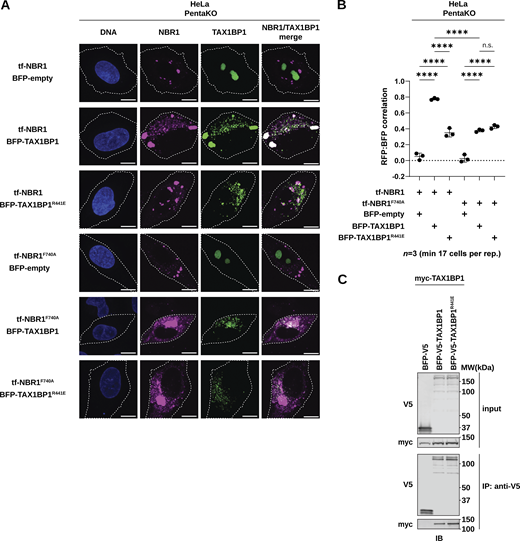
NBR1 F740A and TAX1BP1 R441E are sufficient to disrupt in vivo correlation. (A) Representative confocal micrographs of Hela PentaKO cells co-transduced with tf-NBR1 or tf-NBR1F740A and BFP-TAX1BP1 or BFP-TAX1BP1R441E. Scale bar: 10 µm. (B) Quantification of A. Data represent median of three independently generated cell lines. Pearson’s correlation coefficient between RFP and BFP (reflective of NBR1 and TAX1BP1 co-localization) was calculated using Cell Profiler. Scatter plots represent median ± SD. Each data point represents a single replicate. Statistical analysis was performed using ordinary one-way ANOVA with Tukey’s multiple comparisons correction. n ≥ 17 cells per replicate; ****, P < 0.0001, ns, not significant. (C) HEK293T cells were co-transfected with full-length (FL) myc-TAX1BP1 and indicated BFP-V5-TAX1BP1 variants. Extracts derived from transfected cells were immunoprecipitated (IP) with protein G dynabeads conjugated with anti-V5 antibody. Input and eluates were resolved by SDS-PAGE followed by immunoblotting (IB) with the indicated antibodies. Source data are available for this figure: SourceData FS6.
NBR1 F740A and TAX1BP1 R441E are sufficient to disrupt in vivo correlation. (A) Representative confocal micrographs of Hela PentaKO cells co-transduced with tf-NBR1 or tf-NBR1F740A and BFP-TAX1BP1 or BFP-TAX1BP1R441E. Scale bar: 10 µm. (B) Quantification of A. Data represent median of three independently generated cell lines. Pearson’s correlation coefficient between RFP and BFP (reflective of NBR1 and TAX1BP1 co-localization) was calculated using Cell Profiler. Scatter plots represent median ± SD. Each data point represents a single replicate. Statistical analysis was performed using ordinary one-way ANOVA with Tukey’s multiple comparisons correction. n ≥ 17 cells per replicate; ****, P < 0.0001, ns, not significant. (C) HEK293T cells were co-transfected with full-length (FL) myc-TAX1BP1 and indicated BFP-V5-TAX1BP1 variants. Extracts derived from transfected cells were immunoprecipitated (IP) with protein G dynabeads conjugated with anti-V5 antibody. Input and eluates were resolved by SDS-PAGE followed by immunoblotting (IB) with the indicated antibodies. Source data are available for this figure: SourceData FS6.
NBR1 recruits TAX1BP1 to enhance its own lysosomal delivery
What effect does the one-to-many interaction of the NBR1 SLiM have in vivo? Dissecting individual points of connection among SQSTM1-like receptors (SLRs) is complex due to their interconnectivity. To overcome this, we utilized a previously characterized HeLa cell line lacking all five major SLRs: p62, NBR1, TAX1BP1, NDP52, and Optineurin (PentaKO cells) (Lazarou et al., 2015). To monitor lysosomal delivery in these cells, we employed a suite of tandem fluorescent (tf) reporters composed of RFP and GFP fused to the N-terminus of each cargo receptor (Shoemaker et al., 2019). In the acidic environment of the lysosome, GFP fluorescence is quenched, while the RFP signal remains, making the red:green fluorescence ratio a reliable indicator of lysosomal delivery (Fig. 6 A).

Synergy between NBR1 and TAX1BP1 mitigates competition and optimizes flux. (A) Schematic of the tandem fluorescent (tf) reporter system. Throughout autophagosome formation, both RFP and GFP fluorescence are observed. Upon lysosomal fusion, the acidic lysosomal environment quenches GFP, whereas RFP is maintained. Therefore, an increasing red:green ratio corresponds with increased lysosomal delivery. (B) HeLa PentaKO cells were transfected with tf-p62, tf-NBR1, tf-TAX1BP1, tf-NDP52, or tf-Optineurin. After 24 h, cells were analyzed for red:green ratio by flow cytometry. Median values for each sample are identified by a black line within each violin. The red dotted line across all samples corresponds to red:green ratio of maximally inhibited conditions (e.g., BafA1 treatment) n > 10,000 cells per sample. (C) HeLa PentaKO cells were co-transfected with tf-NBR1 and indicated BFP-tagged receptors. After 24 h, cells were analyzed for red:green ratio by flow cytometry. Graphs represent mean ± SD from four independent experiments. n > 10,000 cells per sample. P values were determined using a one-way ANOVA (P = <0.0001). Multiple comparisons were made using Dunnett T3 correction. *, P < 0.05; **, P < 0.01; ***, P < 0.001; ns, not significant. (D) HeLa PentaKO cells were co-transfected with tf-NBR1 (wild type or F740A) and BFP-TAX1BP1 (wild type or R441E). After 24 h, cells were analyzed for red:green ratio by flow cytometry (n > 10,000 cells per sample). Graphs represent mean ± SD from three independent experiments. P values were determined using a one-way ANOVA (P = <0.0001). Multiple comparisons were made using Tukey correction. ***, P < 0.001; ns, not significant. (E) HeLa pentaKO cells were co-transfected with tf-NBR1 (wild type or Y732A) and BFP-TAX1BP1 (wild type or V143S). After 24 h, cells were analyzed for red:green ratio by flow cytometry (n > 10,000 cells per sample). Graphs represent mean ± SD from three independent experiments. P values were determined using a one-way ANOVA (P = <0.0001). Multiple comparisons were made using Tukey correction. ***, P < 0.001; ****, P < 0.0001; ns, not significant. (F) HeLa pentaKO cells were co-transfected with tf-NBR1 and BFP-TAX1BP1 variants. After 24 h, cells were analyzed for red:green ratio by flow cytometry (n > 10,000 cells per sample). Graphs represent mean ± SD from four independent experiments. P values were determined using a one-way ANOVA (P = <0.0001). Multiple comparisons were made using Tukey correction. *, P < 0.05; ****, P < 0.0001; ns, not significant.
Synergy between NBR1 and TAX1BP1 mitigates competition and optimizes flux. (A) Schematic of the tandem fluorescent (tf) reporter system. Throughout autophagosome formation, both RFP and GFP fluorescence are observed. Upon lysosomal fusion, the acidic lysosomal environment quenches GFP, whereas RFP is maintained. Therefore, an increasing red:green ratio corresponds with increased lysosomal delivery. (B) HeLa PentaKO cells were transfected with tf-p62, tf-NBR1, tf-TAX1BP1, tf-NDP52, or tf-Optineurin. After 24 h, cells were analyzed for red:green ratio by flow cytometry. Median values for each sample are identified by a black line within each violin. The red dotted line across all samples corresponds to red:green ratio of maximally inhibited conditions (e.g., BafA1 treatment) n > 10,000 cells per sample. (C) HeLa PentaKO cells were co-transfected with tf-NBR1 and indicated BFP-tagged receptors. After 24 h, cells were analyzed for red:green ratio by flow cytometry. Graphs represent mean ± SD from four independent experiments. n > 10,000 cells per sample. P values were determined using a one-way ANOVA (P = <0.0001). Multiple comparisons were made using Dunnett T3 correction. *, P < 0.05; **, P < 0.01; ***, P < 0.001; ns, not significant. (D) HeLa PentaKO cells were co-transfected with tf-NBR1 (wild type or F740A) and BFP-TAX1BP1 (wild type or R441E). After 24 h, cells were analyzed for red:green ratio by flow cytometry (n > 10,000 cells per sample). Graphs represent mean ± SD from three independent experiments. P values were determined using a one-way ANOVA (P = <0.0001). Multiple comparisons were made using Tukey correction. ***, P < 0.001; ns, not significant. (E) HeLa pentaKO cells were co-transfected with tf-NBR1 (wild type or Y732A) and BFP-TAX1BP1 (wild type or V143S). After 24 h, cells were analyzed for red:green ratio by flow cytometry (n > 10,000 cells per sample). Graphs represent mean ± SD from three independent experiments. P values were determined using a one-way ANOVA (P = <0.0001). Multiple comparisons were made using Tukey correction. ***, P < 0.001; ****, P < 0.0001; ns, not significant. (F) HeLa pentaKO cells were co-transfected with tf-NBR1 and BFP-TAX1BP1 variants. After 24 h, cells were analyzed for red:green ratio by flow cytometry (n > 10,000 cells per sample). Graphs represent mean ± SD from four independent experiments. P values were determined using a one-way ANOVA (P = <0.0001). Multiple comparisons were made using Tukey correction. *, P < 0.05; ****, P < 0.0001; ns, not significant.
To validate this approach, we transfected each tf-labeled receptor into PentaKO cells and evaluated its lysosomal delivery by flow cytometry. We observed substantial flux in all reporters except tf-Optineurin, with tf-NBR1 exhibiting the highest flux (Fig. 6 B). Co-transfection with BFP-tagged p62, NDP52, or Optineurin modestly reduced tf-NBR1 flux (P = 0.0043, P = <0.0001, P = 0.018, respectively) relative to BFP alone, indicative of competitive interactions among the receptors. In contrast, co-transfection with BFP-TAX1BP1 substantially increased tf-NBR1 flux (P = <0.0001), demonstrating that TAX1BP1 acts synergistically with NBR1 to boost its lysosomal delivery (Fig. 6 C). This finding underscores the unique role of TAX1BP1 in enhancing NBR1-mediated autophagic pathways in vivo.
Given the previously reported interactions between p62, NBR1, and TAX1BP1 in p62 bodies, we investigated whether the addition of p62 to the NBR1:TAX1BP1 complex would further enhance NBR1 flux. We co-transfected PentaKO HeLa cells with tf-NBR1, HALO-TAX1BP1, and/or BFP-p62 and examined the red:green ratio via flow cytometry. Consistent with earlier findings (Fig. 6 C), the addition of BFP-p62 modestly decreased tf-NBR1 flux, while HALO-TAX1BP1 significantly increased it (Fig. S7 A). The combined addition of BFP-p62 and HALO-TAX1BP1 was largely additive, with p62 muting the TAX1BP1-mediated enhancement of tf-NBR1 flux, suggesting that p62 is unexpectedly inhibitory in our add-back system (see Discussion for details).

Synergy between NBR1 and TAX1BP1. (A) HeLa PentaKO cells were co-transfected with tf-NBR1, HALO-TAX1BP1, and the indicated BFP-tagged receptors. Triple-positive cells were analyzed by flow cytometry with red:green ratio as a readout of NBR1 flux. Graphs represent mean ± SD from three independent experiments. n > 10,000 cells per sample. P values were determined using a one-way ANOVA (P = 0.0006). Multiple comparisons were made using Dunnett T3 correction. **, P < 0.01, ns, not significant. (B) HeLa pentaKO cells were transfected with tf-TAX1BP1 (WT or R441E). After 24 h, cells were analyzed for red:green ratio by flow cytometry (n > 10,000 cells per sample). Median values for each sample are identified by a black line within each violin. BafA1, Bafilomycin A1. (C)Atg7KO/TAX1BP1KO K562 cells expressing tf-NBR1 were electroporated with the indicated BFP-tagged variants of TAX1BP1. BFP-expressing cells were analyzed by red:green ratio as a readout for flux. n > 10,000 cells per sample. (D) HeLa pentaKO cells were co-transfected with tf-NBR1 and the indicated BFP-tagged TAX1BP1 variants. tf-positive cells were analyzed by flow cytometry with red:green ratio as a readout of NBR1 flux. Graphs represent mean ± SD from three independent experiments. n > 10,000 cells per sample. P values were determined using a one-way ANOVA (P < 0.0001). Multiple comparisons were made using Tukey’s correction. ****, P < 0.0001, ns, not significant.
Synergy between NBR1 and TAX1BP1. (A) HeLa PentaKO cells were co-transfected with tf-NBR1, HALO-TAX1BP1, and the indicated BFP-tagged receptors. Triple-positive cells were analyzed by flow cytometry with red:green ratio as a readout of NBR1 flux. Graphs represent mean ± SD from three independent experiments. n > 10,000 cells per sample. P values were determined using a one-way ANOVA (P = 0.0006). Multiple comparisons were made using Dunnett T3 correction. **, P < 0.01, ns, not significant. (B) HeLa pentaKO cells were transfected with tf-TAX1BP1 (WT or R441E). After 24 h, cells were analyzed for red:green ratio by flow cytometry (n > 10,000 cells per sample). Median values for each sample are identified by a black line within each violin. BafA1, Bafilomycin A1. (C)Atg7KO/TAX1BP1KO K562 cells expressing tf-NBR1 were electroporated with the indicated BFP-tagged variants of TAX1BP1. BFP-expressing cells were analyzed by red:green ratio as a readout for flux. n > 10,000 cells per sample. (D) HeLa pentaKO cells were co-transfected with tf-NBR1 and the indicated BFP-tagged TAX1BP1 variants. tf-positive cells were analyzed by flow cytometry with red:green ratio as a readout of NBR1 flux. Graphs represent mean ± SD from three independent experiments. n > 10,000 cells per sample. P values were determined using a one-way ANOVA (P < 0.0001). Multiple comparisons were made using Tukey’s correction. ****, P < 0.0001, ns, not significant.
To rigorously test whether the synthetic enhancement of tf-NBR1 by TAX1BP1 depends on NBR1:TAX1BP1 binding, we tested tf-NBR1F740A and BFP-tagged TAX1BP1R441E variants, which each disrupt the NBR1:TAX1BP1 interaction. Strikingly, we found no difference in flux between tf-NBR1 and tf-NBR1F740A or tf-TAX1BP1 and tf-TAX1BP1R441E, indicating that neither mutation affects receptor flux individually (Fig. 6 D and Fig. S7 B). However, co-transfection of PentaKO HeLa cells with tf-NBR1 (or tf-NBR1F740A) and BFP-empty, BFP-TAX1BP1, or BFP-TAX1BP1R441E revealed that either binding mutant (NBR1F740A or TAX1BP1R441E) was sufficient to block the enhancement of NBR1 flux (Fig. 6 D). This observation was further corroborated in Atg7-deficient K562 cells, where NBR1 degradation depends on its interaction with TAX1BP1 (Ohnstad et al., 2020). Transfection of ATG7KO/TAX1BP1KO cells with wild-type TAX1BP1 rescues NBR1 degradation, whereas the R441E mutant does not (Fig. S7 C). Thus, direct binding between TAX1BP1 and the TIR motif of NBR1 is required for synergistic functions of NBR1 and TAX1BP1 across multiple in vivo models.
Finally, we investigated the specific role of TAX1BP1 in mediating NBR1 flux. To this end, we generated mutations in functional domains of TAX1BP1, co-transfected PentaKO HeLa cells with tf-NBR1 and BFP-TAX1BP1 variants, and monitored NBR1 flux. Initially, we examined several C-terminal truncations, including TAX1BP11–724 (lacking the ubiquitin-binding domains) and TAX1BP11–506 (also lacking coiled-coil 3 and the LGALS8 binding region) (Fig. S1 F). Removal of these domains did not impair TAX1BP1’s ability to support NBR1 flux, indicating that these regions are not strictly required (Fig. S7 D). Therefore, while ubiquitin binding may contribute to TAX1BP1 recruitment under physiological conditions, our data align with recent findings from Bauer et al. (2024), suggesting that ubiquitin binding is not the primary driver of TAX1BP1 recruitment.
Given that C-terminal truncations did not impair TAX1BP1’s ability to mediate NBR1 flux, we turned our focus to other regions that might be critical for this process. Previous studies have established that NBR1 flux depends on its LIR motif (Kirkin et al., 2009; Waters et al., 2009). Consistent with these reports, we observe a significant inhibition of NBR1 flux in the absence of a functional LIR (NBR1Y732A). However, this defect is rescued by wild-type TAX1BP1 (Fig. 6 E). Based on this observation, we hypothesized that TAX1BP1 provides additional LIR motifs to facilitate flux. To test this, we mutated the LIR motif of TAX1BP1 (V143S) (Tumbarello et al., 2015) and assessed its effect on NBR1. Notably, BFP-TAX1BP1V143S neither enhances tf-NBR1 flux nor rescues tf-NBR1Y732A, compared with BFP alone (Fig. 6 E). These data suggest that TAX1BP1 augments NBR1 flux through the addition of high-valency interactions with Atg8-family proteins.
Building on this, we next explored whether additional TAX1BP1 functions contribute to NBR1 flux. Previous studies have demonstrated that TAX1BP1 recruits FIP200 to p62 condensates (Ohnstad et al., 2020; Turco et al., 2021). To investigate this function, we examined the role of the N-terminal SKICH domain, which mediates the formation of the TAX1BP1/FIP200/NAP1 ternary complex (Ravenhill et al., 2019; Vargas et al., 2023). Specifically, we introduced a known mutation in the SKICH domain (TAX1BP1A114Q), which disrupts ternary complex formation (Ravenhill et al., 2019; Ohnstad et al., 2020; Zhang et al., 2024) and consequently impairs many TAX1BP1 functions (Ohnstad et al., 2020; Eapen et al., 2021; Kuno et al., 2022). Surprisingly, TAX1BP1A114Q only very modestly impacts TAX1BP1 function in supporting NBR1 flux (Fig. 6 F). However, when combined with the LIR mutation (TAX1BP1A114Q/V143S), the disruption of both LC3 and FIP200/NAP1 binding severely impair NBR1 flux, comparable with a complete SKICH deletion (ΔSKICH) (Fig. 6 F). These findings underscore that both LC3 recruitment and FIP200/NAP1 recruitment support NBR1 flux, with optimal flux requiring their combined action.
Discussion
Prior studies have demonstrated that NBR1, TAX1BP1, and p62 play distinct roles in aggrephagy (Ohnstad et al., 2020; Sarraf et al., 2020; Turco et al., 2021). Here, we use peptide-based arrays and cell-based reconstitution to provide additional insights into their cooperative dynamics within cellular autophagy processes. While SQSTM1-like receptors (SLRs) are each independently capable of targeting lysosomes, we find that their simultaneous overexpression results in competition (Fig. 6 C). However, in the case of NBR1 and TAX1BP1, we find that heterotypic interactions enable cooperation rather than competition, potentially reducing the burden on cells facing heavy autophagy demands (Fig. 7).

Model of the LC3-interacting motif (LIR) of NBR1 as a multifunctional protein interaction hotspot governing NBR1 flux. NBR1 engages three key partners—Atg8-family proteins, FIP200, and TAX1BP1—through a single short linear interaction motif (SLiM). This one-to-many binding mechanism is facilitated by distinct but overlapping determinants, likely representing an evolutionary tradeoff between related, but nonidentical, consensus motifs. Additional multivalent interactions mediated by TAX1BP1 further enable receptor coordination and optimal flux.
Model of the LC3-interacting motif (LIR) of NBR1 as a multifunctional protein interaction hotspot governing NBR1 flux. NBR1 engages three key partners—Atg8-family proteins, FIP200, and TAX1BP1—through a single short linear interaction motif (SLiM). This one-to-many binding mechanism is facilitated by distinct but overlapping determinants, likely representing an evolutionary tradeoff between related, but nonidentical, consensus motifs. Additional multivalent interactions mediated by TAX1BP1 further enable receptor coordination and optimal flux.
Interestingly, our study did not observe the previously reported synergy between p62 and NBR1 (Sánchez-Martín et al., 2020; Turco et al., 2021). This is perhaps not unexpected. First, biochemical studies have highlighted the importance of proper stoichiometry between p62 and NBR1 (Turco et al., 2021). In our cell-based reconstitutions, where receptor titration through co-transfection cannot be precisely controlled, the required stoichiometry is unlikely to be consistently achieved. Alternatively, a key function of p62 is the generation of ubiquitinated condensates, presumed autophagy cargo (Komatsu et al., 2010; Sun et al., 2018; Zaffagnini et al., 2018; Sánchez-Martín et al., 2020; Turco et al., 2021; Kurusu et al., 2024). Our data suggest that p62’s role in coalescing ubiquitinated cargo, while critical for cargo incorporation and clearance, is not required for NBR1 flux. However, NBR1 could then accelerate the degradation of p62-bound cargo by linking it to its own rapid turnover, a process further expedited by TAX1BP1. This model positions NBR1, one of the earliest conserved autophagy receptors (Kraft et al., 2010; Rasmussen et al., 2022), as a central orchestrator in this network, with evolutionary adaptors (i.e., p62 and TAX1BP1) subsequently enhancing its functionality and minimizing competition from other autophagy processes (Fig. 7).
Parallel to this work, Bauer et al. similarly characterized the interaction between TAX1BP1 and NBR1, proposing a switch-like model in which p62-NBR1 condensates sequester cargo until a critical mass of ubiquitinated targets is reached. At that point, NBR1 recruits TAX1BP1 to initiate autophagosome formation (Bauer et al., 2024; Ferrari et al., 2024). This switch-like mechanism underscores the essential role of receptor cooperativity in regulating autophagosome formation, highlighting how coordinated interactions among autophagy receptors ensure efficient and timely cargo degradation. In both studies, the linchpin of these activities is the LIR motif of NBR1, an apparent protein interaction hub—enabling interaction with Atg8s, FIP200, and TAX1BP1—that enables optimal NBR1 flux.
More broadly, this study presents a systematic analysis of over 100 autophagy-related SLiMs, evaluating consensus sequences and correlation between LC3A, GABARAPL1, FIP200, and TAX1BP1 binding (Fig. 2). While previous studies have detailed the binding determinants within individual SLiMs, our comprehensive approach allows us to extract insights into the binding characteristics of these motifs across a wide array of autophagy-related proteins, thereby expanding and generalizing prior findings. The validity of our method is underscored by our successful recapitulation of known differences in LIR preferences between LC3A and GABARAPL1 (Fig. 2 D). We similarly recover the reduced stringency of FIP200Claw for aromatic residues at the +0 position and the strong contribution of adjacent negatively charged residues (Zhou et al., 2021). Collectively, these findings demonstrate the utility of peptide arrays in deriving meaningful consensus motifs.
Leveraging this approach, our analysis reveals only a modest correlation (Spearman’s r = 0.33–0.37) between the binding of FIP200 and Atg8-family proteins (Fig. 2 C). This is despite BSA analysis showing that LIR residues contacting LC3A also make substantial contacts with FIP200 (Fig. S5, A–G), which might otherwise imply that these factors recognize a common motif. Yet, our NBR1 mutagenic peptide arrays also reveal significant differences between FIP200 binding and LC3A binding (Fig. 3). Notably, individual point mutants within the core LIR (732–735) were insufficient to disrupt FIP200 binding (Fig. 3 C). This highlights that FIP200Claw is more tolerant than ATG8 family members regarding the spacing and size of hydrophobic residues within the motif. Consequently, we were unable to identify FIP200-specific mutations to determine the contribution of the NBR1:FIP200Claw interaction in vivo. More broadly, these results further highlight that Atg8 binding and FIP200 binding are not inseparable events. Rather, multifunctional binding sites likely represent an evolutionary tradeoff between multiple related, but nonidentical, consensus motifs.
Extending our LIR analysis, we find that TAX1BP1CC2 lacks a clear consensus motif, including a conspicuous lack of negative charge (Fig. 2 D). This absence aligns with our observation that TAX1BP1 binding is not strongly dependent on the LIR motif. Two possible explanations may account for the lack of a defined TIR motif. First, if the positions of TAX1BP1 binding vary relative to the core LIR, it undermines the ability of the iceLogo approach to identify a consensus sequence. Second, structural modeling suggests that aromatic residues—whether at the +0 position or elsewhere within the sequence—can fit into a hydrophobic pocket of TAX1BP1CC2 and be stabilized by sequence-independent backbone interactions mediated by TAX1BP1R441 (Fig. 5 B). As such, the primary sequence requirements for this mode of TAX1BP1 binding appear minimal. Given this minimal motif, we acknowledge that our peptide arrays may overestimate the number of physiologically relevant TIR-containing peptides. Moving forward, more comprehensive studies will be necessary to refine these potential TAX1BP1 binding sites, prioritize their significance, and clarify their functional roles in vivo.
An enduring question is why multifunctional autophagy SLiMs have evolved rather than separate, non-overlapping binding sites. As previously proposed (Turco et al., 2019; Zhou et al., 2021), overlapping FIRs and LIRs with differential affinities suggest an intriguing mechanism to drive the sequential recruitment of autophagosomal factors—FIP200 first, followed by the higher affinity Atg8s. This arrangement could ensure that once the cargo is bound, FIP200 is displaced to prevent its degradation, thus facilitating continuous autophagosome formation.
The effects of phosphorylation within these motifs add yet another layer of complexity. Phosphorylation positively correlates with both FIP200 and Atg8-family binding, preventing us from concluding a universal sequence of events that is governed in a phospho-dependent manner (Fig. 4 B). Moreover, while phosphomimetics at positions −2 or −1 generally enhance binding, this effect is not universal. Therefore, although a general trend, the enhancement effect of phosphorylation might be selective to certain motifs within the LIR and FIR landscape, and not uniformly applicable across all interactions. At the same time, the geometry of the phosphomimetic residues is known to be a suboptimal proxy for phosphorylation (Popelka and Klionsky, 2022; Kliche et al., 2023; Le Guerroué et al., 2023). As such, the role of phosphorylation is likely to be underestimated by our approach. In addition, the role of phosphorylation at other sites was not formally tested. However, the contribution of other acidic residues to the interaction of NBR1 with LC3 and FIP200 is consistent with a broad ability of phosphorylation to affect LIR binding (Rogov et al., 2023). This likely enables a more nuanced control over these interactions, which may be critical for the temporal ordering and/or regulation of autophagy processes.
The simultaneous overlap of binding sites for TAX1BP1 (Fig. 1, C and D) introduces a final complexity. Computational simulations suggest that heterotypic (one-to-many) interactions enhance the efficiency of phase transitions within cellular condensates by lowering the phase boundary considerably compared to a one-to-one binding model (Riback et al., 2020; Krishnan et al., 2022). This suggests that heterogeneous systems, like those involving the heterotypic SLiM of NBR1, can undergo phase transitions at reduced valency, highlighting a possible evolutionary benefit of receptor cooperation. Future studies will need to fully test these hypotheses. It also suggests that while each SLR contains sufficient utility to flux on its own, by combining their varied multivalencies, cells can optimize the clearance of targeted cargo (Sun et al., 2018; Jakobi et al., 2020; Yamasaki et al., 2020; Agudo-Canalejo et al., 2021). We note that TAX1BP1’s cooperative impact hinges on its LC3 binding capacity (Fig. 6 E). This points to LC3 valency as a critical factor, beyond the previously emphasized role of TAX1BP1 in FIP200 recruitment (Ohnstad et al., 2020; Turco et al., 2021; Zhang et al., 2024). Therefore, the multifunctional SLiM of NBR1, coupled with TAX1BP1’s diverse binding contributions, underscores the role of multivalency in optimizing cellular clearance mechanisms, reinforcing our understanding of autophagy receptor function as a complex, cooperative system that enhances adaptability and efficiency.
An overarching concept that emerges from this study is the potential for LIRs to serve as protein interaction hot-spots. This idea further expands the known role of LIRs in autophagy and introduces many new avenues for exploration. Compellingly, two studies recently revealed a role for the LIR motif of BNIP3 and BNIP3L/NIX in interacting with the WIPI-family of autophagy proteins (Bunker et al., 2023; Adriaenssens et al., 2024, Preprint). Furthermore, a noncanonical AIM—termed the shuffled AIM (sAIM)—has been shown to facilitate interaction with both Atg8-family proteins and another ubiquitin-like protein, UFM1 (Picchianti et al., 2023). These observations underscore our finding that LIR motifs are critical, multifunctional, protein-binding hotspots interacting with proteins beyond just Atg8s. We anticipate further instances where additional interacting proteins bind to LIRs with significant effects. Investigating these possibilities will be essential for gaining deeper insights into autophagy regulation and its implications for cellular function and disease pathology.
In conclusion, our study offers new insights into the interactions between autophagy-related SLiMs and their numerous overlapping binding partners. Our findings highlight the diverse and partially overlapping binding motifs of NBR1, illustrating an intricate co-evolutionary balance that fulfills the requirements of three distinct binding events, each necessitating a unique conformation of the unstructured NBR1725–749 SLiM. This one-to-many binding modality unveils a complex, cooperative mechanism that enhances cellular adaptability and efficiency. Such cooperation between autophagy receptors and other autophagy factors furthers the mechanistic basis for the widespread role of multifunctional SLiMs in autophagy. These insights lay the groundwork for future research into the molecular mechanisms driving autophagy, potentially leading to novel therapeutic approaches for diseases associated with autophagy dysregulation.
Materials and methods
Antibodies
All immunoblotting (IB) primary antibodies were diluted 1:1,000 unless otherwise noted. All secondary antibodies were diluted 1:10,000 unless otherwise noted. The following antibodies were used: mouse anti-myc (M4439; Sigma-Aldrich), rabbit anti-V5 (13202; CST), mouse anti-V5 (MCA1360; Biorad), rabbit anti-GST (2625T; CST), rabbit anti-MBP-tag (15089-1-AP; Proteintech), mouse anti-HA (901501; BioLegend), rabbit anti-TAX1BP1 (5105; CST), rabbit anti-LC3A/B (12741S; CST), goat anti-GST-HRP conjugate (RPN1236; Cytiva), goat anti-Rb-HRP conjugate (1706515; Bio-rad), and goat anti-Ms-HRP conjugate (1706516; Bio-rad).
Chemicals and reagents
The following chemicals and reagents were used in this study: 2-mercaptoethanol (BME) (M6250-100ML; Sigma-Aldrich), 41-µm nylon mesh (B0015GZDEQ; Amazon), agar (A10752; Alpha Aesar), agarose (16500500; Thermo Fisher Scientific), Amicon Ultra-15 Centrifugal Filters (UFC903024; Sigma-Aldrich), ampicillin (A9518-25G; Sigma-Aldrich), Bafilomycin A1 (11038; Caymen chemical), BCA assay (23227; Pierce), blasticidin (ant-bl1; Invivogen), cOmplete protease inhibitor tablet (5056489001; Sigma-Aldrich), Dynabeads protein G (10004D; Thermo Fisher Scientific), EDTA (EDS-500G; Sigma-Aldrich), Glutathione Sepharose 4B resin (95016-984; VWR), glycerol (G2025-1L; Sigma-Aldrich), HEPES (H3375-1KG; Sigma-Aldrich), Imidazole (O3196-500; Fischer Scientific), Intercept (TBS) Blocking Buffer (927-60003; LI-COR), Isopropyl-β-D-thiogalactopyranoside (IPTG) (BP1755-10; Fischer Scientific), Lipofectamine 3000 (97064-850; Fischer Scientific), Novex 4–20% Tris-Glycine gels (WXP42020BOX; Thermo Fisher Scientific), Phusion High-Fidelity DNA polymerase (M0530L; NEB), Pico PLUS chemiluminescent substrate (PI34577; Fischer Scientific), polybrene (H9268-5G; Sigma-Aldrich), potassium chloride (P217-500; Fisher Scientific), puromycin (ant-pr-1; Invivogen), PVDF membranes 0.2 µm (#ISEQ00010; Sigma-Aldrich), sodium phosphate dibasic monohydrate (S373-500; Fisher Scientific), sodium phosphate monobasic monohydrate (S369-1; Fischer Scientific), sodium chloride (6438; Fisher Scientific), sodium dodecyl sulfate (SDS) (74255-250G; Sigma-Aldrich), sucrose (BP220-1; Fisher Scientific), Taq DNA ligase (M0208L; NEB), Tris(2-carboxyethyl)phosphine hydrochloride (TCEP) (97064-850; VWR), Tris base (T1378-5KG; Sigma-Aldrich), Triton X-100 (T9284500ML; Sigma-Aldrich), tryptone (DF0123-17-3; Fisher Scientific), Tween-20 (BP337500; Fisher Scientific), T5 exonuclease (M0363S; NEB), urea (U15-3; Fischer Scientific), yeast extract (BP1422-2; Fisher Scientific), and zeocin (ant-zn-1; Invivogen).
Vectors
All plasmids are listed in Table S2.
Isothermal assembly
PCR inserts were amplified with Phusion High-Fidelity DNA Polymerase (M0530L; NEB). Amplification primers were designed with a 30-bp overlap with the linear ends of restriction-digested vectors. Linearized vectors were dephosphorylated using calf intestinal phosphatase (M0290S; NEB). All inserts and vectors were purified using 0.9% agarose gel prior to isothermal assembly (D4002; Zymo Research). 50 ng of linearized vector DNA was mixed with an isomolar amount of purified insert(s). 2.5 µl of DNA mix was incubated with 7.5 µl isothermal assembly master mix at 50°C for 20 min. The product of the isothermal assembly reaction was transformed into NEB Stable cells (C3040H; NEB). Transformed cells were plated on 1.5% agar plates with LB media (10 g/liter tryptone, 5 g/liter yeast extract, 5 g/liter NaCl). All cultures and plates were grown at 34°C overnight and included 100 µg/ml ampicillin. Overnight cultures were pelleted at 3,000 × g for 10 min and plasmid DNA was extracted and purified using a Qiagen miniprep kit (27106; Qiagen). Sequences were verified by Sanger sequencing (Eton Bioscience Inc.).
Tissue culture
K562 ATG7KO/TAX1BP1KO cells expressing tf-NBR1 were generated previously (Ohnstad et al., 2020). HeLa PentaKO cells were a gift from Dr. Richard Youle (Lazarou et al., 2015). All cells were grown in a standard water-jacketed incubator with 5% CO2. K562 cells were grown in IMDM media (10-016-CV; Corning) with 10% FBS (26140079; Thermo Fisher Scientific) and 1x pen/strep (15140122; Thermo Fisher Scientific). HEK293T and HeLa PentaKO cells were grown in DMEM media (10-013-CV; Thermo Fisher Scientific) with 10% FBS and 1x pen/strep. All cells were passaged <25 times. For passaging, cells were washed with HBSS (14025092; Thermo Fisher Scientific) and trypsinized with Trypsin–EDTA (25300-054; Gibco). Puromycin (2 µg/ml), blasticidin (5 µg/ml), and zeocin (50 µg/ml) were added when necessary for selection.
Transient transfection and nucleofection
HEK293T cells with grown overnight in Opti-MEM Reduced Serum media with 5% FBS (51985-034; Thermo Fisher Scientific) to 90% confluence. HeLa PentaKO cells were grown overnight in Opti-MEM Reduced Serum media with 5% FBS to 70% confluence. Cells were transfected using Lipofectamine 3000 reagent (L3000008; Life Technologies) according to the manufacturer’s recommendations. K562 cells were nucleofected using a Nucleofector 2b Device (Lonza) using nucleofector kit T (VACA-1002; Lonza) and protocol T-016.
Lentiviral generation
Lentivirus was generated in HEK293T cells transfected using a Lipofectamine 3000 kit (L3000008; Life Technologies). Cells were seeded in Opti-MEM media containing 5% FBS and no antibiotics. At ∼80% confluency, cells were transfected with pVSV-G, pSPAX2, and the relevant expression construct at a 1:4:3 ratio. Opti-MEM media was exchanged with fresh media 6 h after transfection. The supernatant containing the virus was harvested at 24 and 48 h after transfection and pooled. Virus supernatant was clarified by centrifugation for 15 min at 1,000 × g and aliquoted for single use.
Viral transduction
HeLa PentaKO cells were trypsinized and seeded in DMEM containing 8 µg/ml polybrene (1:1,000) with lentivirus. Transduction was allowed to proceed overnight (5pm-8am) before exchanging for fresh media. Cells were allowed 24 h to recover prior to the addition of antibiotic selection.
Immunofluorescence microscopy
Cells were seeded on collagen-coated glass bottom dishes (P35G-1.5-10-C; MatTek) at ∼70% confluency and allowed to adhere overnight. Cells were washed 2X in warm HBSS and fixed for 15 min in 4% paraformaldehyde (PFA) made fresh from 16% PFA (#15710; Electron Microscopy Sciences) diluted in HBSS. Cells were blocked and permeabilized in Intercept (TBS) Blocking Buffer (927-60003; LI-COR) plus 0.3% Triton X-100 for 1 h at room temperature and then washed in HBSS. Cells were incubated in HBSS with NucSpot Nuclear Stain (1:1,000 dilution) for 5 min prior to being washed with HBSS for storage or imaging.
Confocal microscopy
All fluorescence images were acquired on a Nikon Eclipse Ti-E inverted microscope stand with a Yokogawa CSU-W1 spinning disk system and Nikon LU-N4 laser launch. This system is located in the Life Sciences Light Microscopy Facility at Dartmouth. Images were acquired with a Nikon 100× Plan Apochromat objective lens with a numerical aperture of 1.45. The laser lines and emission filters used were 405 nm (455/50), 488 nm (525/36), 561 nm (605/52), and 640 nm (705/72). Images were acquired with a Teledyne Photometrics Prime BSI camera and Nikon Elements AR 5.42.06 imaging software. All cells were fixed in 4% PFA and imaged in HBSS at room temperature.
Image analysis
Image intensities were modified linearly and evenly across all samples. Maximum intensity projections were individually imported into CellProfiler 3.1.9. Primary objects were identified based on nuclear staining using “IdentifyPrimaryObjects.” tf-NBR1 positive cells were identified based on GFP using “IdentifySecondaryObjects.” BFP-construct positive cells were identified based on BFP using “IdentifySecondaryObjects.” Colocalization was measured using “MeasureColocalization” of RFP with BFP signal. All quantification was performed in a blinded, automated fashion. All reported data are the median of three independently generated biological replicates.
Immunoprecipitation
Cells were collected and resuspended in lysis/IP buffer (50 mM HEPES pH 7.4, 150 mM NaCl, 2 mM EDTA, 1% Triton X-100, 2× cOmplete protease inhibitor tablet [5056489001; Sigma-Aldrich]) or IP Buffer with 0.5 mM DTT. Cells were incubated on ice for 20 min and pelleted at 1,000 × g 10 min at 4°C. The supernatant was normalized by total protein using BCA assay (23227; Pierce) prior to IP. The normalized extract was applied to Glutathione Sepharose 4B resin (95016-984; VWR) prebound to purified proteins, or protein G dynabeads (10004D; Thermo Fisher Scientific) prebound to the indicated antibodies. Incubations were allowed to proceed for 1 h at 4°C. Beads were washed 3× times with one tube change. Proteins were eluted by boiling at 70°C in 1× Laemmli Loading Buffer (3× stock: 189 mM Tris pH 6.8, 30% glycerol, 6% SDS, 10% β-mercaptoethanol, and bromophenol blue).
Gel electrophoresis and immunoblotting
Gel electrophoresis was performed at 195 V for 65 min in Novex 4–20% Tris-Glycine gels (WXP42020BOX; Thermo Fisher Scientific). For western blotting, samples were transferred for 60 min to 0.2 µm PVDF membranes (#ISEQ00010; Sigma-Aldrich) using a Semi-dry transfer cell (Bio-Rad). Membranes were blocked for 20 min in Intercept (TBS) Blocking Buffer (927-60003; LI-COR). Primary antibodies were incubated overnight at 4°C. Blots were rinsed 3 × 5 min in TBS-T (10 mM Tris pH 7.9, 150 mM NaCl, 0.05% Tween-20, 0.25 mM EDTA). Secondary antibodies (1:10,000 dilution in Intercept [TBS] Blocking Buffer with 0.2% Tween-20 and 0.01% SDS) were incubated for 1 h at room temperature. Blots were rinsed 3 × 10 min in TBS-T and imaged using fluorescence (LI-COR Odyssey CLx Imager).
Flow cytometry
Adherent cells were trypsinized, pelleted, washed in cold HBSS, and filtered through a 41-µm nylon mesh (B0015GZDEQ; Amazon) prior to analysis. K562 cells were washed in cold HBSS and filtered through a 41-µm nylon mesh prior to analysis. Data were collected on a Cytoflex S Cytometer (Beckman). Data were analyzed using FlowJo v 10 (FlowJo; LLC) and R. The red:green ratios of tf-labeled reporters were normalized to a Bafilomycin-treated control where applicable.
Biolayer interferometry (BLI)
BLI analysis was performed using an Octet HTX (ForteBio; Sartorius). HIS-tagged peptides were immobilized on biosensors coated with NiNTA (18-5103; Sartorius) and then either associated with varying concentrations of analytes in solution or associated with assay buffer to subtract the slight negative slope from HIS-tagged ligands leaching from the sensor. Analyte concentrations were set at 35, 11.7, 3.9, and 1.3 µM, with the exception of MBP-GABARAPL1 (20, 6.7, 2.2, and 0.7 µM). A blank NiNTA sensor was also interrogated for each concentration of the analyte to also subtract the nonspecific signal of the sensor and analyte. All binding experiments were performed in solid-black 384-well plates containing 70–90 µl of solution made in assay buffer (PBS, 0.01% bovine serum albumin, 0.1% polysorbate 20, 20 mM imidazole, and 10 mM DTT, pH 7.2) in each well at 25°C with an agitation speed of 1,000 rpm. Biosensors were associated with the lowest concentration of analyte first, and then the sensors were regenerated with 0.5 M imidazole, pH 7.5, and neutralized with assay buffer before associating in the next highest analyte concentration. Dissociation constants for the interactions were determined via the Octet Data Analysis HT software with a 1:1 binding model; aberrant data were removed to achieve a higher R2 or lower χ2 value of the fit. Data are presented as KD ± standard error of the fit. All BLI values were validated by performing the experiment in duplicate (on separate days).
Statistical analysis
All statistical analysis was performed using Prism 10 (GraphPad). All statistical tests are indicated in the relevant figure legends. All tests were two-tailed with P < 0.05 as the minimum threshold for statistical significance. Prior to the indicated tests, Shapiro–Wilk was used to test normality. Each statistical test and the number of replicates (n) used for each test are indicated in the relevant figure legend.
AlphaFold structural modeling
Sequences were obtained from Uniprot and the LIR-central database (Chatzichristofi et al., 2023). AF2-multimer was used with MMseqs2 through Google Colab (https://colab.research.google.com/github/sokrypton/ColabFold/blob/main/AlphaFold2.ipynb#scrollTo=UGUBLzB3C6WN). The top-ranked structure was relaxed using AMBER and examined using Pymol V2.4.1 (PyMOL V2.4.1; Schrödinger, LLC). Predicted LDDT (pLDDT) per residue was estimated by pLDDT metric output by AF2 as a metric of model confidence. pLDDT scores were colored in Pymol using the Pymol extension Color AlphaFold (https://github.com/cbalbin-bio/pymol-color-alphafold).
Buried surface area calculations
The BSA of NBR1 amino acids upon binding to different binding partners was calculated using the proteins, interfaces, structures, and assemblies (PISA) server at the European Bioinformatics Institute (http://www.ebi.ac.uk/pdbe/prot_int/pistart.html). Each relaxed model from the AlphaFold structural modeling was analyzed for the BSA area at the interface of NBR1 and its binding partner.
Peptide array design
Peptide arrays were printed by the MIT Biopolymers & Proteomics Core and Intavis Peptide Services GmbH. LIR sequences were drawn from the LIR-Central database (Chatzichristofi et al., 2023) (Table S1). FIR sequences were drawn from Fujita et al. (2013); Smith et al. (2018); Ravenhill et al. (2019); Fu et al. (2021); Zhou et al. (2021). The NBR1 sliding frame array was printed using 20 aa sections of NBR1711–759 printed with a 1 aa frame shift per spot. Sequences containing serine or threonine residues at −2 or −1 positions relative to the LIR were mutated to aspartic acid and printed in parallel or printed separately with phospho-serine or phospho-threonine. The NBR1 mutational peptide array was printed using NBR1725–749, varying each position by all possible residues. As binding controls, the top two rows and bottom row were printed with wild type peptide.
Peptide array probing
Peptide arrays were reconstituted in methanol and sonicated briefly (15–30 s) prior to washing 3 × 5 min in TBS-T (10 mM Tris pH 7.9, 150 mM NaCl, 0.05% Tween-20, 0.25 mM EDTA), followed by a 1 h incubation in TBS-T + 0.5 mM TCEP to fully reduce peptide spots. Arrays were blocked in Intercept + 0.2% Tween-20 + 0.5 mM TCEP overnight at 4°C. Arrays were then stripped prior to the first probe and between subsequent probes. Arrays were stripped by washing 3 × 10 min in H2O, sonicating at 40°C 3 × 10 min in stripping mix A (8 M Urea, 2% SDS, 0.7% BME, in PBS pH 7), washing 3 × 10 min in stripping mix B (10% acetic acid, 50% ethanol, 40% H2O), rewetting in alcohol 3 × 10 min with brief sonication (15–30 s), washing 3 × 10 min in TBS-T + 0.5 mM TCEP, and blocking in Intercept + 0.2% Tween-20 + 0.5 mM TCEP 1 H at 4°C.
Peptide arrays were probed with 100 nM of each indicated protein in Intercept + 0.2% Tween-20 + 0.5 mM TCEP for 2 h at RT (FIP200Claw was probed in Intercept + 0.5% Triton X-100 + 0.5 mM TCEP for 2 h at RT). Probed membranes were washed 3 × 10 min in TBS-T prior to probing with primary antibodies as indicated in TBS-T (10 mM Tris pH 7.9, 150 mM NaCl, 0.2% Tween-20, 0.25 mM EDTA) with 5% milk powder overnight at 4°C. Probed arrays were washed 3 × 10 min in TBS-T followed by incubation with secondary HRP-conjugated antibodies as indicated in TBS-T + 5% milk for 1 h at 4°C then washed 3 × 10 min in TBS-T.
HRP-probed peptide arrays were visualized with Pico PLUS chemiluminescent substrate (PI34577; Fisher Scientific) according to the manufacturer’s recommendations using a Syngene imager. Images were analyzed and quantified using ImageLab 6.0 (BioRad). Images were scored blindly to determine a bind/no bind cutoff. In the LIR family array, peptide spots that failed to bind to either LC3A, GABARAPL1, FIP200Claw, or TAX1BP1CC2 were designated as never-binders and were excluded from further analysis.
iceLogo analysis
iceLogo sequence alignments were derived from all bound peptides (determined by blinded scorers). All unbound peptides were used as the reference set to calculate position-specific P value for each amino acid. Never-binders were excluded from the analysis. Enriched amino acids are positive and under-represented amino acids are negative, shown as percent enrichment.
Fluorescence anisotropy
FITC-NBR1 peptide was sourced from Biomatik and reconstituted in DMSO before dilution to Phosphate buffered SEC buffer (0.05 M NaH2PO4 pH 7.4 pH, 100 mM NaCl, 0.5 mM TCEP). Purified proteins GST-LC3A, GST-FIP200Claw, and GST-TAX1BP1CC2-MBP were purified as described and serially diluted in Phosphate buffered SEC buffer (0.05 M NaH2PO4 pH 7.4 pH, 100 mM NaCl, and 0.5 mM TCEP) with 50 nM FITC-NBR1725–749. Assays were performed on a Synergy Neo2 plate reader (BioTek). Binding curves were fit using a One Site: Total nonlinear regression model to determine KD.
Protein expression and purification
GST-tagged proteins were expressed in E. coli Rosetta 2 cells overnight at 16°C with 0.4 mM IPTG and purified using a HisTrap HP 5 ml column (Cytiva) equilibrated in (75 mM Tris pH 8, 500 mM NaCl, 5 mM BME, 20 mM imidazole, 10% glycerol) and eluted in (75 mM Trsi pH 8, 100 mM NaCl, 5 mM BME, 400 mM imidazole, and 10% glycerol) via a stepwise imidazole gradient. The protein was applied to a HiLoad 26/600 Superdex 200 column (Cytiva) equilibrated in (0.05 M NaH2PO4 pH 7.4, 100 mM NaCl, 5 mM BME). Fractions containing purified protein were concentrated, frozen using liquid nitrogen, and stored at −80°C.
HA-tagged MAP1LC3A and GABARAPL1 were expressed in E. coli Rosetta 2 cells overnight at 16°C with 0.4 mM IPTG and purified using HisTrap HP 5 ml column (Cytiva) equilibrated in (75 mM Tris pH 8, 500 mM NaCl, 5 mM BME, 20 mM imidazole, 10% glycerol) and eluted in (75 mM Trsi pH 8, 100 mM NaCl, 5 mM BME, 400 mM imidazole, and 10% glycerol) via a stepwise imidazole gradient. Eluted protein was dialyzed to (20 mM Hepes pH 7.4, 150 mM NaCl, 5 mM BME, and 5% glycerol) and cleaved with TEV protease overnight at 4°C. Cleaved and dialyzed protein was applied to a HiLoad 26/600 Superdex 200 equilibrated in (20 mM Hepes pH 7.4, 150 mM NaCl, 5 mM BME, and 5% glycerol). Fractions containing purified protein were concentrated, frozen using liquid nitrogen, and stored at −80°C.
MBP-tagged MAP1LC3A, GABARAPL1, FIP200Claw, and TAX1BP1CC2 were expressed in E. coli Rosetta 2 cells overnight at 16°C with 0.4 mM IPTG and purified using batch maltose binding protein column equilibrated in 25 mM Tris pH 7.5, 200 mM NaCl, 2 mM EDTA, and 5 mM BME, and eluted with 25 mM Tris pH 7.5, 200 mM NaCl, 2 mM EDTA, 5 mM BME, and 10 mM maltose. The protein was applied to a HiLoad 26/600 Superdex 200 column (Cytiva) equilibrated in 0.05 M NaH2PO4 pH 7.4, 100 mM NaCl, and 5 mM BME. Fractions containing purified protein were concentrated, frozen using liquid nitrogen, and stored at −80°C.
Online supplemental material
Fig. S1 shows domain maps of NBR1 and TAX1BP1 and immunoblot analysis of co-immunoprecipitation (co-IP) experiments between TAX1BP1, LC3A, FIP200CLAW, and NBR1 truncations. Fig. S2 shows fluorescence confocal micrographs showing either colocalization of tf-NBR1 with BFP-TAX1BP1 and CC2 truncations, or colocalization of tf-NBR1 with BFP-FIP200CLAW. Fig. S2 also shows BLI analysis of NBR1 peptides against LC3A, GABARAPL1, FIP200CLAW, and TAX1BP1CC. Fig. S3 shows phosphorylated peptide array probes of LC3A, GABARPL1, FIP200CLAW, and TAX1BP1CC2 as well as correlation analysis of replicate TAX1BP1CC2 probes. Fig. S4 shows immunoblots of co-IP experiments defining selective mutations that disrupt NBR1 interaction with LC3 or TAX1BP1CC2. Fig. S5 shows AlphaFold modeling of interactions between NBR1 and LC3, FIP200Claw, or TAX1BP1CC2 as well as buried surface analysis. Fig. S6 shows fluorescence confocal micrographs showing colocalization between tf-NBR1 and BFP-TAX1BP1, demonstrating that NBR1F740A and TAX1BP1R441E disrupt in vivo correlation. Fig. S6 also shows immunoblotting of a co-IP verifying that TAX1BP1R441E does not disturb the dimerization of TAX1BP1. Fig. S7 shows flow cytometry analysis of tf-NBR1 in the presence or absence of TAX1BP1 and/or p62. Fig. S7 also shows that tf-TAX1BP1 flux is not disturbed by the TAX1BP1R441E mutation and that the TAX1BP1R441E mutant is incapable of rescuing TAX1BP1 deletion in ATG7/TAX1BP1 double knock-out cells. Fig. S7 further shows that the loss of TAX1BP1 ubiquitin-binding domains (UBA), CC3, or the LGALS8-binding region does not disturb the synergy between NBR1 and TAX1BP1 in this system. Table S1 details the peptide sequences used in peptide arrays. Table S2 shows the vectors used in this study.
Data availability
Source data files have been made available at North, 2024, https://doi.org/10.17632/cw6n8mmywt.1. Additional data are available upon reasonable request.
Acknowledgments
This work is supported by the National Institutes of Health General Medical Sciences (R35GM142644 to C.J. Shoemaker). We would like to thank the Institute for Biomolecular Targeting (bioMT) core at Dartmouth supported by National Institutes of Health General Medical Sciences (P20GM113132), the Genomics Shared Resource and the Immune Monitoring and Flow Cytometry Shared Resource (DartLab) supported by the National Cancer Institute (P30CA023108), and Dr. Richard Youle (National Institute of Neurological Disorders and Stroke, Bethesda, MD, USA) for the HeLa PentaKO cell line.
Author contributions: B.J. North: Conceptualization, Data curation, Formal analysis, Investigation, Methodology, Validation, Visualization, Writing - original draft, Writing - review & editing, A.E. Ohnstad: Investigation, Writing - review & editing, M.J. Ragusa: Formal analysis, Visualization, Writing - review & editing, C.J. Shoemaker: Conceptualization, Formal analysis, Funding acquisition, Methodology, Project administration, Supervision, Visualization, Writing - original draft, Writing - review & editing.

