


Canonical autophagy captures within specialized double-membrane organelles, termed autophagosomes, an array of cytoplasmic components destined for lysosomal degradation. An autophagosome is completed when the growing phagophore undergoes ESCRT-dependent membrane closure, a prerequisite for its subsequent fusion with endolysosomal organelles and degradation of the sequestered cargo. ATG9A, a key integral membrane protein of the autophagy pathway, is best known for its role in the formation and expansion of phagophores. Here, we report a hitherto unappreciated function of mammalian ATG9A in directing autophagosome closure. ATG9A partners with IQGAP1 and key ESCRT-III component CHMP2A to facilitate this final stage in autophagosome formation. Thus, ATG9A is a central hub governing all major aspects of autophagosome membrane biogenesis, from phagophore formation to its closure, and is a unique ATG factor with progressive functionalities affecting the physiological outputs of autophagy.
Introduction
Canonical autophagy in mammals (Morishita and Mizushima, 2019) participates in fundamental biological and disease-related processes (Klionsky et al., 2021; Levine and Kroemer, 2019; Mizushima and Levine, 2020) by contributing to a diverse array of outputs, including metabolism (Deretic and Kroemer, 2021; Lahiri et al., 2019), cytoplasmic quality control (Lamark and Johansen, 2021; Pohl and Dikic, 2019), and anti-inflammatory and immune activities (Deretic, 2021). Canonical autophagy (Morishita and Mizushima, 2019; Yamamoto et al., 2023) entails autophagosome biogenesis (Chang et al., 2021; Cook and Hurley, 2023; Holzer et al., 2024) which is followed by autolysosome formation (Zhao and Zhang, 2019). Autophagosomes are membranous cytoplasmic organelles formed through distinct morphological stages including LC3-negative prophagophores (Kumar et al., 2021), open crescent-shaped LC3-positive phagophores (Kabeya et al., 2000), and closed double-membrane autophagosomes (Javed et al., 2023; Takahashi et al., 2019; Zhen et al., 2020, 2021). Fusion between autophagosomes and compartments of the endolysosomal system leads to their maturation into fully degradative autolysosomes (Zhao and Zhang, 2019).
The biogenesis of mammalian autophagosomes remains a work in progress, and not all models agree on its specifics. There is a general understanding that this process engages lipid/membranes from various sources including the endoplasmic reticulum (ER) (Axe et al., 2008; Hara et al., 2008; Hayashi-Nishino et al., 2009; Itakura and Mizushima, 2010, 2011; Mizushima et al., 2011; Nishimura et al., 2017; Tooze and Yoshimori, 2010) and components of the early secretory pathway, such as ERGIC (ER-Golgi intermediate compartment) and cis-Golgi (Ge et al., 2013, 2014, 2017; Kumar et al., 2021), the recycling endosomes (Knævelsrud et al., 2013; Kumar et al., 2021; Longatti et al., 2012; Moreau et al., 2011; Puri et al., 2013, 2018, 2023; Ravikumar et al., 2010; Shatz and Elazar, 2024; Soreng et al., 2018), and most critically, the ATG9A-positive vesicles (Broadbent et al., 2023; Cook and Hurley, 2023; Nguyen et al., 2023; Olivas et al., 2023; Orsi et al., 2012; Young et al., 2006). ATG9A, the mammalian ortholog of the yeast Atg9 (Yamamoto et al., 2012), is unique among ATG factors as it is a multispan integral membrane protein that traffics through several cellular compartments and forms a unique pool of small post-Golgi ATG9A-positive vesicles (Claude-Taupin et al., 2021; Orsi et al., 2012; Soreng et al., 2018; Young et al., 2006). Along with the LC3-negative prophagophores (Kumar et al., 2021), the ATG9A vesicles (Orsi et al., 2012; Young et al., 2006) contribute to the membrane nidus in a variant of what has been observed in yeast (Mari et al., 2010). Whereas in yeast Atg9 becomes and remains a part of the outer autophagosomal membrane and cycles away only upon autophagosome fusion with the vacuole (Yamamoto et al., 2012), there are split opinions on whether ATG9A is a part of the autophagosomal membrane as recently reported (Broadbent et al., 2023; Cook and Hurley, 2023; Olivas et al., 2023), or is only transiently incorporated and undergoes a fast recycling back to a depot of free ATG9A-positive vesicles (Orsi et al., 2012; Young et al., 2006), the latter model not excluding multiple cycles. ATG9A scaffolds protein complexes and through their enzymatic activities and other properties leads to the emergence of LC3-positive phagophores (Broadbent et al., 2023; Cook and Hurley, 2023; Kannangara et al., 2021; Nguyen et al., 2023; Olivas et al., 2023; Ren et al., 2023). This stage is referred to as the initiation step (designated here as step X) and is followed by the phagophore expansion stage (step Y), whereby a nascent phagophore grows by lipid acquisition from other membranes via lipid transfer proteins such as ATG2A and ATG2B (Dabrowski et al., 2023; Maeda et al., 2019; Valverde et al., 2019). There are physical and functional links between ATG2 proteins and ATG9A. This includes their direct association (van Vliet et al., 2022) and a lipid scramblase activity of the homotrimeric ATG9A (Maeda et al., 2020), which relaxes asymmetry in lipid bilayers assisting the directional flow of lipids between the donor (e.g., ER) and acceptor phagophore membranes. Furthermore, in yeast, Atg9 confines Atg2 to the tips of growing phagophores (Gómez-Sánchez et al., 2018). Mammalian ATG9A and yeast Atg9 differ in their cytofacial domains, e.g., ATG9A possesses a complex C-terminal domain that is different than the one in yeast Atg9. This raises the question of whether the large C-terminal domain imparts additional, yet to be fully characterized, functions on ATG9A (Claude-Taupin et al., 2021; Ren et al., 2023; van Vliet et al., 2022, 2024).
During the X and Y steps, membranes are shaped through dynamic interactions with the omegasome, a subdomain of the ER (Axe et al., 2008; Nähse et al., 2023), in response to nutrient starvation (Ganley et al., 2009; Hosokawa et al., 2009; Jung et al., 2009; Neufeld, 2010) or upon cargo recognition by selective autophagic receptors (Lamark and Johansen, 2021; Popelka and Klionsky, 2022; Stolz et al., 2014; Turco et al., 2019). Progression of prophagophores into morphologically discernible membrane crescents is marked by the conjugation to membrane aminophospholipids of mammalian ATG8 proteins (mATG8s: LC3A, LC3B, LC3B2, LC3C, GABARAP, GABARAPL1, and GABARAPL2), a process commonly referred to as LC3-lipidation (Kabeya et al., 2000; Mizushima, 2020) or membrane atg8ylation (Deretic and Lazarou, 2022). One of seven mATG8s, LC3B, represents a widely used autophagy marker (Kabeya et al., 2000) although mATG8s can atg8ylate membranes other than autophagosomes in response to stress, damage, or membrane remodeling signals (Deretic et al., 2024). The formation of double membrane-delimited autophagosomes can be finalized via ESCRT-dependent closure of the phagophore (step Z) (Flower et al., 2020; Javed et al., 2023; Takahashi et al., 2018, 2019), followed by fusion of autophagosomes with endosomal and lysosomal organelles leading to the formation of autolysosomes (Zhao and Zhang, 2019). The sequestered cytoplasmic cargo is then degraded within autolysosomes (Zhao and Zhang, 2019).
Phagophore closure (step Z) occurs via membrane scission promoted by ESCRT proteins (Flower et al., 2020; Javed et al., 2023; Knorr et al., 2015; Takahashi et al., 2018, 2019; Zhen et al., 2020). The ESCRT machinery, together with its companion ATPase VPS4, specializes in constricting and closing saddle-like shaped membranes with negative Gaussian curvatures at multiple intracellular locales (Christ et al., 2017; Hurley, 2015). The ESCRT–VPS4 system has a broad repertoire of functions including endosome intralumenal vesicle and exosome formation, viral budding, plasma membrane scission during cytokinesis, postmitotic nuclear membrane reformation, and repair of lysosomal membrane, nuclear envelope, and plasmalemma, and, as recently recognized (Flower et al., 2020; Javed et al., 2023; Knorr et al., 2015; Takahashi et al., 2018, 2019; Zhen et al., 2020), autophagosomal closure (Christ et al., 2017; Hurley, 2015; Zhen et al., 2021). What guides ESCRT recruitment to a growing mammalian phagophore (in yeast Vps21, ortholog, or Rab5 contributes to this process [Lipatova et al., 2012; Zhou et al., 2019]) and what triggers membrane closure is an evolving question. Multiple ESCRT complexes contribute to this process including ESCRT-I (Flower et al., 2020; Takahashi et al., 2019) and ESCRT-III (Takahashi et al., 2018; Zhen et al., 2020). With the exception of the recruitment of the ESCRT-I protein VPS37A, which involves its direct binding to mATG8s (Javed et al., 2023), what directs ESCRTs’ sequential action in space and time, including the VPS4-dependent ESCRT-III constriction and disassembly during the final act of membrane scission (Christ et al., 2017; Hurley, 2015; Maity et al., 2019; Vietri et al., 2015) is unknown.
Here, we show that ATG9A, previously implicated in the initiation and expansion stages of autophagosome biogenesis, also controls the phagophore closure. This occurs through the interaction of ATG9A’s C-terminal domain with IQGAP1, a multifunctional scaffold protein assembling multiprotein complexes in a variety of pathways (Thines et al., 2023), identified here as a previously unappreciated mammalian autophagy factor that bridges ATG9A with a key regulatory ESCRT-III protein CHMP2A. CHMP2A in turn triggers the final stages of ESCRT-dependent phagophore closure. Thus, ATG9A is unique among ATG proteins, acting as a central hub that governs all three (X, Y, and Z) steps in the biogenesis of the autophagosome, the organelle that defines canonical autophagy.
Results
IQGAP1 is required for efficient phagophore closure
A two-dimensional analysis of APEX2-proteomic data (Fig. 1 A and Table S1; MassIVE proteomics repository; MSV000084519) comparing two different ways of inducing canonical autophagy, i.e., starvation vs. mitochondrial H+ gradient dissipation with CCCP, revealed ATG9A proximity interactors from all aspects of autophagosome formation: FIP200, ATG13, and ULK1 (initiation, Fig. 1 B step X); ATG2B (expansion, Fig. 1 B step Y); WIPI2, ATG3, and ATG7 (atg8ylation); and ESCRTs VPS37A, VPS4A/B (closure, step Z) (Fig. 1 B). Since ESCRTs play a central role in phagophore closure (Flower et al., 2020; Takahashi et al., 2018, 2019; Zhen et al., 2020), we focused on these potential interactors and hypothesized that ATG9A may contribute to ESCRT-dependent sealing of autophagosomes.
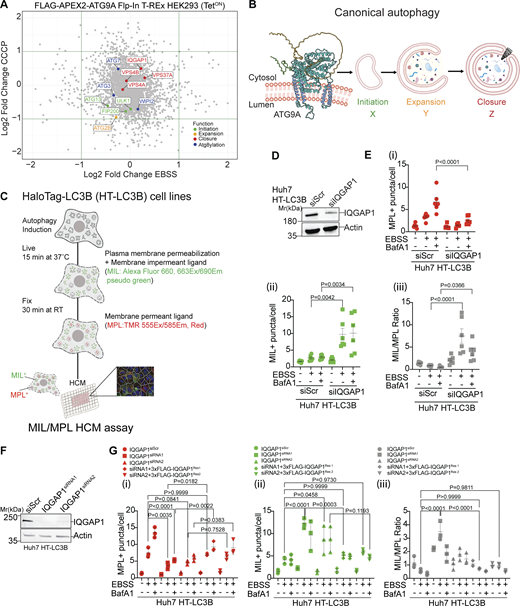
IQGAP1 plays a role in autophagosome closure. (A) Scatter plot of ATG9A proximity proteome comparing starvation-induced autophagy (EBSS, 90 min) and treatment with CCCP (20 µM, 6 h) identified by LC-MS/MS in FLAG-APEX2-ATG9A Flp-In T-REx HEK293(TetON) cells. For highlighted proteins (colors defined in inset legend), functions are separated by the stage of autophagosome biogenesis. (B) Schematic ATG9A was modified from the AlphaFold entry AF-Q7Z3C6 by rotating the unstructured C-terminal loop to avoid clashes with the membrane. Successive stages of autophagosome biogenesis: initiation (X), expansion (Y), and closure (Z). (C) Schematic representation of quantitative high content microscopy HaloTag (HT)-LC3B based closure assay (MIL/MPL HCM) encompassing incubation with membrane-impermeant HT ligand (MIL) to stain and saturate HT-LC3B-II accessible to the cytosol followed by membrane-permeant HT ligand (MPL) to stain LC3B-II (protected from and free of MIL because of sequestration within sealed membranes). (D) IQGAP1 knockdown (siRNA pool) in Huh7 HT-LC3B cells, immunoblot analysis. (E) MIL/MPL HCM quantification in Huh7 HT-LC3B control cells or cells knocked down for IQGAP1. Starvation in EBSS, 90 min incubation ± 100 nM BafA1. (i) MPL+ puncta (red symbols), closed autophagosomes. (ii) MIL+ puncta (green symbols), unclosed phagophores, and other accessible HT-LC3B; (iii) Ratio of MIL+ and MPL+ profiles (puncta/cell; gray symbols) in i and ii. Circles, siRNA control cells; squares, cells knocked down for IQGAP1. (F) Immunoblot of IQGAP1 KD with individual siRNAs, MIL/MPL HCM quantification in Huh7 HT-LC3B control cells or cells knocked down for IQGAP1 (siRNA1, squares; siRNA2, triangles) and complementation with siRNA resistant constructs pDest-3xFLAG-iQGAP1Res1 (diamonds) or pDest-3xFLAG-IQGAP1Res2 (inverted triangles) against siRNA1 and siRNA2, respectively. Starvation in EBSS, 90 min incubation ± 100 nM BafA1. (i–iii) MPL+ puncta (red symbols), (ii) MIL+ puncta (green symbols), (iii) Ratio of MIL+ and MPL+ profiles (puncta/cell; gray symbols). HCM parameters: 60 fields/well, >500 primary objects (cells)/well; 6 (E) or 4 (F) wells per sample/plate. Statistical significance was determined by one-way ANOVA and post-hoc Tukey’s multiple comparison test. Data, means ± SD, n = 5 (E) or 3 (F) biologically independent experiments per condition. Source data are available for this figure: SourceData F1.
IQGAP1 plays a role in autophagosome closure. (A) Scatter plot of ATG9A proximity proteome comparing starvation-induced autophagy (EBSS, 90 min) and treatment with CCCP (20 µM, 6 h) identified by LC-MS/MS in FLAG-APEX2-ATG9A Flp-In T-REx HEK293(TetON) cells. For highlighted proteins (colors defined in inset legend), functions are separated by the stage of autophagosome biogenesis. (B) Schematic ATG9A was modified from the AlphaFold entry AF-Q7Z3C6 by rotating the unstructured C-terminal loop to avoid clashes with the membrane. Successive stages of autophagosome biogenesis: initiation (X), expansion (Y), and closure (Z). (C) Schematic representation of quantitative high content microscopy HaloTag (HT)-LC3B based closure assay (MIL/MPL HCM) encompassing incubation with membrane-impermeant HT ligand (MIL) to stain and saturate HT-LC3B-II accessible to the cytosol followed by membrane-permeant HT ligand (MPL) to stain LC3B-II (protected from and free of MIL because of sequestration within sealed membranes). (D) IQGAP1 knockdown (siRNA pool) in Huh7 HT-LC3B cells, immunoblot analysis. (E) MIL/MPL HCM quantification in Huh7 HT-LC3B control cells or cells knocked down for IQGAP1. Starvation in EBSS, 90 min incubation ± 100 nM BafA1. (i) MPL+ puncta (red symbols), closed autophagosomes. (ii) MIL+ puncta (green symbols), unclosed phagophores, and other accessible HT-LC3B; (iii) Ratio of MIL+ and MPL+ profiles (puncta/cell; gray symbols) in i and ii. Circles, siRNA control cells; squares, cells knocked down for IQGAP1. (F) Immunoblot of IQGAP1 KD with individual siRNAs, MIL/MPL HCM quantification in Huh7 HT-LC3B control cells or cells knocked down for IQGAP1 (siRNA1, squares; siRNA2, triangles) and complementation with siRNA resistant constructs pDest-3xFLAG-iQGAP1Res1 (diamonds) or pDest-3xFLAG-IQGAP1Res2 (inverted triangles) against siRNA1 and siRNA2, respectively. Starvation in EBSS, 90 min incubation ± 100 nM BafA1. (i–iii) MPL+ puncta (red symbols), (ii) MIL+ puncta (green symbols), (iii) Ratio of MIL+ and MPL+ profiles (puncta/cell; gray symbols). HCM parameters: 60 fields/well, >500 primary objects (cells)/well; 6 (E) or 4 (F) wells per sample/plate. Statistical significance was determined by one-way ANOVA and post-hoc Tukey’s multiple comparison test. Data, means ± SD, n = 5 (E) or 3 (F) biologically independent experiments per condition. Source data are available for this figure: SourceData F1.
An abundant presence of IQGAP1 (55–61 unique peptide counts) was noted in proximity-biotinylation LC/MS/MS data with APEX2-ATG9A (Table S1). IQGAP1 is known to interact directly with CHMP2A (Claude-Taupin et al., 2021). CHMP2A is a key ESCRT-III protein that facilitates the final stages of ESCRT-dependent membrane scission (Radulovic et al., 2018; Teis et al., 2008; Vietri et al., 2015) and is critical for phagophore closure (Takahashi et al., 2018; Zhen et al., 2020). Moreover, ATG9A, IQGAP1, and CHMP2A are known to cooperate in protection from plasma membrane damage (Claude-Taupin et al., 2021). We thus tested whether IQGAP1 matters for autophagosomal sealing. For this, we induced autophagy by amino acid starvation in the EBSS medium and employed a previously validated method (Fig. 1 C) for quantifying phagophore closure (Javed et al., 2023; Takahashi et al., 2018). This assay, termed MIL/MPL HCM assay (Javed et al., 2023), relays on haloalkane dehalogenase (HaloTag; HT) fusion with LC3B and sequential staining with fluorescent HT membrane impermeant ligand (MIL; Alexa Fluor 660 fluorescing at 690 nm/pseudocolored green in displays) followed by membrane-permeant ligand (MPL; tetramethylrhodamine/TMR fluorescing at 585 nm, colored red in displays). MIL puncta represent unclosed whereas MPL profiles represent closed autophagosomes (Javed et al., 2023; Takahashi et al., 2018). We knocked down (Fig. 1 D) IQGAP1 using an siRNA pool in Huh7 cells stably expressing HT-LC3B and observed that MPL puncta (closed autophagosomes) were decreased (Fig. 1, E i and Fig. S1 A) whereas MIL puncta (unclosed autophagosomes) were increased (Fig. 1, E ii and Fig. S1 A) in comparison with control. This was further reflected in increased MIL/MPL ratios in cells knocked down for IQGAP1 (Fig. 1, E iii and Fig. S1 A). A bafilomycin A1 (BafA1) control was included to inhibit autophagic flux. In samples treated with BafA1, MPL profiles further increased in control cells and this was less pronounced in cells knocked down for IQGAP1 (Fig. 1, E i). We additionally carried knockdowns using two individual siRNAs (siRNA1 and siRNA2) separately, which confirmed the results with the siRNA pool. We complemented these knockdowns by transient transfection with siRNA-resistant clones of IQGAP1 encoded by plasmids pDEST-3xFLAG-IQGAP1Res1 and pDEST-3xFLAG-IQGAP1Res2 (Fig. 1, F and G; and Fig. S1, B–D) overexpressing 3xFLAG-IQGAP1 from the CMV promoter (Fig. S1 D). Thus, IQGAP1 plays a role in phagophore closure.
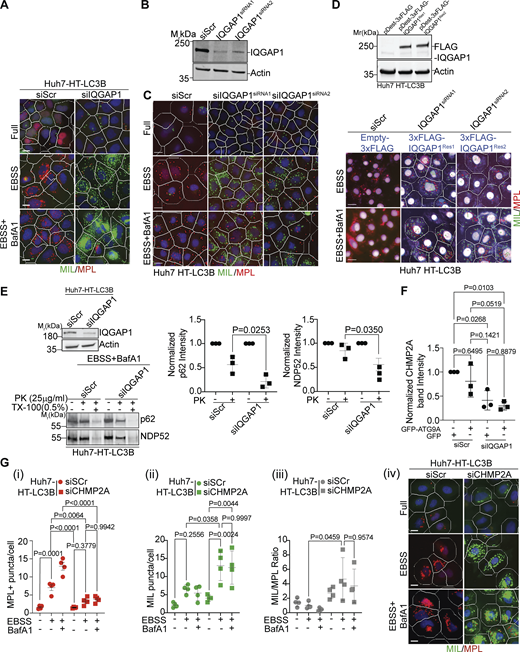
IQGAP1 contributes to autophagosome closure via CHMP2A. (A) HCM Images (example) of the effects of IQGAP1 knockdown in Huh7-HT-LC3 cells in Fig. 1 E, (masks: white, primary objects; green, MIL+ profiles; red, MPL+ profiles). (B) Immunoblot analysis of IQGAP1 knockdown with individual siRNAs, siRNA1 or siRNA2 in Huh7 HT-LC3B cells. (C) HCM example images corresponds to Fig. 1, F i–iii. (D) Upper panel, expression analysis by immunoblotting of the siRNA1 or siRNA2 resistant constructs pDest-3xFLAG-IQGAP1Res1 and pDest-3xFLAG-IQGAP1Res2 in Huh7 HT-LC3B cells. Lower panel, examples of HCM images of FLAG+ (gated) cells transfected with pDest-3xFLAG-IQGAP1Res1 or pDest-3xFLAG-IQGAP1Res2, corresponding to Fig. 1, F i–iii. (E) Immunoblot analysis of IQGAP1 knockdown in Huh7 HT-LC3B cells (top blot) and protease protection assay (bottom blot) of p62 and NDP52 in Huh7 HT-LC3B cell extracts (siRNAs: Scr, siRNA control; siIQGAP1, IQGAP1 siRNA) ± proteinase K with or without Triton X-100 treatment. Quantification of p62 and NDP52 levels (band intensities) in control and proteinase K-treated samples. Data are means ± SD, n = 3 (biologically independent experiments); one-way ANOVA followed by Tukey’s multiple comparison test. (F) Quantification by immunoblotting (band intensity) of CHMP2A in whole cell lysates in control cells and cells knocked down for IQGAP1 (corresponding to Fig. 2, D ii). (G) Quantification (i–iii) and example images (iv), MIL/MPL HCM assay in Huh7 HT-LC3B cells treated with control (siScr) or CHMP2A siRNA (siCHMP2A) and sequentially incubated with membrane-impermeable HT ligand (MIL) to stain HT-LC3B-II (cytosolic) and membrane-permeant HT ligand (MPL) to stain LC3B-II, sequestered within closed membrane. HCM images: MPL+ (red mask) and MIL+ (green mask) puncta. Huh7 HT-LC3B cells were incubated in EBSS to induce autophagy for 90 min ± BafA1 (100 nM). Scale bars, 10 μm. Source data are available for this figure: SourceData FS1.
IQGAP1 contributes to autophagosome closure via CHMP2A. (A) HCM Images (example) of the effects of IQGAP1 knockdown in Huh7-HT-LC3 cells in Fig. 1 E, (masks: white, primary objects; green, MIL+ profiles; red, MPL+ profiles). (B) Immunoblot analysis of IQGAP1 knockdown with individual siRNAs, siRNA1 or siRNA2 in Huh7 HT-LC3B cells. (C) HCM example images corresponds to Fig. 1, F i–iii. (D) Upper panel, expression analysis by immunoblotting of the siRNA1 or siRNA2 resistant constructs pDest-3xFLAG-IQGAP1Res1 and pDest-3xFLAG-IQGAP1Res2 in Huh7 HT-LC3B cells. Lower panel, examples of HCM images of FLAG+ (gated) cells transfected with pDest-3xFLAG-IQGAP1Res1 or pDest-3xFLAG-IQGAP1Res2, corresponding to Fig. 1, F i–iii. (E) Immunoblot analysis of IQGAP1 knockdown in Huh7 HT-LC3B cells (top blot) and protease protection assay (bottom blot) of p62 and NDP52 in Huh7 HT-LC3B cell extracts (siRNAs: Scr, siRNA control; siIQGAP1, IQGAP1 siRNA) ± proteinase K with or without Triton X-100 treatment. Quantification of p62 and NDP52 levels (band intensities) in control and proteinase K-treated samples. Data are means ± SD, n = 3 (biologically independent experiments); one-way ANOVA followed by Tukey’s multiple comparison test. (F) Quantification by immunoblotting (band intensity) of CHMP2A in whole cell lysates in control cells and cells knocked down for IQGAP1 (corresponding to Fig. 2, D ii). (G) Quantification (i–iii) and example images (iv), MIL/MPL HCM assay in Huh7 HT-LC3B cells treated with control (siScr) or CHMP2A siRNA (siCHMP2A) and sequentially incubated with membrane-impermeable HT ligand (MIL) to stain HT-LC3B-II (cytosolic) and membrane-permeant HT ligand (MPL) to stain LC3B-II, sequestered within closed membrane. HCM images: MPL+ (red mask) and MIL+ (green mask) puncta. Huh7 HT-LC3B cells were incubated in EBSS to induce autophagy for 90 min ± BafA1 (100 nM). Scale bars, 10 μm. Source data are available for this figure: SourceData FS1.
Phagophore closure is considered to be a prerequisite for substrate sequestration and fusion of autophagosomes with lysosomes whereupon degradative functions of autophagy are performed (Zhao and Zhang, 2019). To test IQGAP1’s role in the generation of closed, functional autophagosomes, we employed two separate methods of monitoring substrate sequestration and proteolytic flux. Substrate sequestration was assayed by proteinase K protection assay in extracts of cells induced for autophagy by starvation (EBSS) in the presence of BafA1 to prevent autophagic degradation of sequestered cargo (Javed et al., 2023; Kabeya et al., 2000; Nair et al., 2011) such as autophagy receptors. We observed decreased protection of autophagic receptors p62 and NDP52 from proteinase K in extracts from cells depleted of IQGAP1, reflecting their diminished sequestration within closed autophagosomal membranes and increased accessibility to proteinase K (Fig. S1 E). A second assay, referred to as TMRHT release, employs HT-LC3B as a reporter of substrate proteolysis during autophagic flux (Javed et al., 2023; Yim et al., 2022). In this assay, HT is covalently modified by a TMR-containing HT linker to generate TMRHT, and autophagic degradation releasing a proteolysis-resistant TMRHT fragment from its fusion with LC3B is detected and quantified by in-gel fluorescence of the free TMRHT band as well as by immunoblots (Fig. 2 A). Huh7 HT-LC3B cells induced for autophagy by starvation (EBSS) showed release of TMRHT, whereas those cells depleted of IQGAP1 did not, as detected by in-gel fluorescence (Fig. 2, B i) and immunoblots (Fig. 2, B ii and iii). Thus, IQGAP1 is a hitherto unappreciated key autophagy factor that acts at the point of phagophore closure leading to the formation of autophagosomes that then mature into autolysosomes.
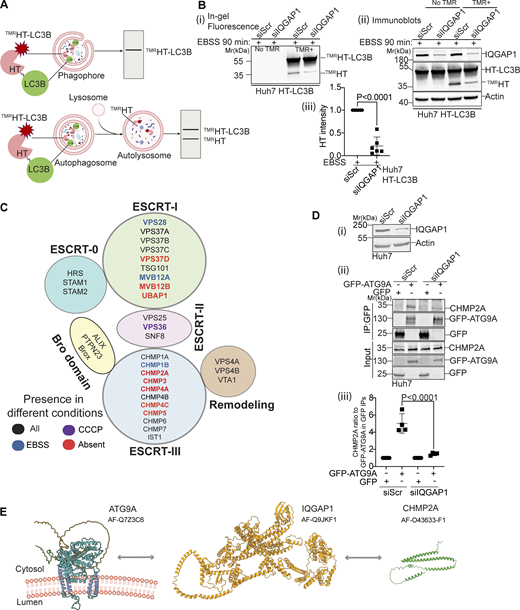
IQGAP1 is necessary for degradative autophagy and bridges ATG9A with CHMP2A. (A) Schematic, TMRHT release assay. TMRHT-LC3B (HaloTag-LC3B) is processed by lysosomal hydrolases releasing the TMRHT fragment from a fusion with LC3B. Released (HaloTag stabilized by TMR) is detectable by in-gel fluorescence and immunoblotting. Top, open phagophores do not yield the TMRHT fragment. Bottom, closed autophagosomes fuse with lysosomes and the TMRHT fragment is released. (B)TMRHT release in IQGAP1 knockdown or control (siScr) cells stably expressing HT-LC3B. TMR+, cells incubated with TMR for 30 min. Cells were starved in EBSS for 90 min, lysed, and processed for in-gel fluorescence and immunoblotting. (i) In-gel fluorescence detection of released TMRHT. (ii) Immunoblot detection of released TMRHT. (iii) quantification of released TMRHT in immunoblots. (C) ESCRT protein subcomplexes with components present in or absent from LC-MS/MS after proximity biotinylation with APEX2-ATG9A. Cells (FLAG-APEX2-ATG9A Flp-In T-REx HEK293[TetON]) were incubated in EBSS (90 min) or treated with CCCP in full medium for 6 h. Black, proteins detected in all conditions; blue, detected only in EBSS; purple, detected only in CCCP; red, not detected in any samples. Note ESCRTs absent from proteomic dataset (red color). (D) Co-IP analysis of GFP-ATG9A with endogenous CHMP2A in Huh7 cells, control (siScr) or knocked down for IQGAP1 by siRNA. Cells were treated with protonophore CCCP for 6 h as a means to collapse organellar proton gradients. (i) Immunoblot, IQGAP1 knockdown in Huh7 cells. (ii) Western blot, Co-IP analysis of GFP-ATG9A (GFP pulldown), and endogenous CHMP2A in control and IQGAP1 depleted cells. (iii) Quantification of Co-IP analyses (CHMP2A band intensity was ratioed to the intensity of the upper band in GFP-ATG9A blots). Data, means ± SD, n = 3 ANOVA. (E) Summary of findings in Fig. 2. Source data are available for this figure: SourceData F2.
IQGAP1 is necessary for degradative autophagy and bridges ATG9A with CHMP2A. (A) Schematic, TMRHT release assay. TMRHT-LC3B (HaloTag-LC3B) is processed by lysosomal hydrolases releasing the TMRHT fragment from a fusion with LC3B. Released (HaloTag stabilized by TMR) is detectable by in-gel fluorescence and immunoblotting. Top, open phagophores do not yield the TMRHT fragment. Bottom, closed autophagosomes fuse with lysosomes and the TMRHT fragment is released. (B)TMRHT release in IQGAP1 knockdown or control (siScr) cells stably expressing HT-LC3B. TMR+, cells incubated with TMR for 30 min. Cells were starved in EBSS for 90 min, lysed, and processed for in-gel fluorescence and immunoblotting. (i) In-gel fluorescence detection of released TMRHT. (ii) Immunoblot detection of released TMRHT. (iii) quantification of released TMRHT in immunoblots. (C) ESCRT protein subcomplexes with components present in or absent from LC-MS/MS after proximity biotinylation with APEX2-ATG9A. Cells (FLAG-APEX2-ATG9A Flp-In T-REx HEK293[TetON]) were incubated in EBSS (90 min) or treated with CCCP in full medium for 6 h. Black, proteins detected in all conditions; blue, detected only in EBSS; purple, detected only in CCCP; red, not detected in any samples. Note ESCRTs absent from proteomic dataset (red color). (D) Co-IP analysis of GFP-ATG9A with endogenous CHMP2A in Huh7 cells, control (siScr) or knocked down for IQGAP1 by siRNA. Cells were treated with protonophore CCCP for 6 h as a means to collapse organellar proton gradients. (i) Immunoblot, IQGAP1 knockdown in Huh7 cells. (ii) Western blot, Co-IP analysis of GFP-ATG9A (GFP pulldown), and endogenous CHMP2A in control and IQGAP1 depleted cells. (iii) Quantification of Co-IP analyses (CHMP2A band intensity was ratioed to the intensity of the upper band in GFP-ATG9A blots). Data, means ± SD, n = 3 ANOVA. (E) Summary of findings in Fig. 2. Source data are available for this figure: SourceData F2.
ATG9A and IQGAP1 cooperate in phagophore closure via CHMP2A
A thorough inspection of the proximity-biotinylation proteomic data with APEX2-ATG9A (Fig. 2 C and Data S1) led to a curious observation that although the majority of ESCRT proteins from all ESCRT subcomplexes were present, CHMP2A, a key factor during the final stages of membrane scission during autophagosomal closure (Takahashi et al., 2018; Zhen et al., 2020), was paradoxically absent (Fig. 2 C). We hypothesized that the absence of CHMP2A in proteomic data with APEX2-ATG9A was the consequence of a need for an intermediary partner to bring ATG9A and CHMP2A together. It has previously been demonstrated that ATG9A directly interacts with IQGAP1 and that IQGAP1 interacts directly with CHMP2A (Claude-Taupin et al., 2021). Thus, we considered the possibility that IQGAP1 serves as a bridge between ATG9A and CHMP2A, a relationship of potential import for phagophore closure. We tested this in co-immunoprecipitation (co-IP) experiments with GFP-ATG9A and endogenous CHMP2A in cells knocked down for IQGAP1 or not (Fig. 2, D i) and detected a quantitative decrease (normalized for input CHMP2A) of CHMP2A in complexes with ATG9A when IQGAP1 levels were reduced (Fig. 2, D ii and iii). We also noted that in IQGAP1 knockdown cells there was a trend toward less CHMP2A in whole-cell extracts (Fig. S1 F), possibly reflecting its destabilization in the absence of IQGAP1. These findings reinforce the model in which IQGAP1 bridges ATG9A with CHMP2A (Fig. 2 E) to mediate phagophore closure. We confirmed that CHMP2A was important for autophagosomal closure in cells starved in EBSS (Fig. S1, G i–iv), consistent with findings by others (Takahashi et al., 2018, 2019; Zhen et al., 2020). A subset of 3xFLAG-ATG9A and GFP-CHMP2A fluorescence signals colocalized on phagophores (LC3+ profiles) (Fig. 3, A and B). Additionally, 3xFLAG-ATG9A, IQGAP1, and CHMP2A colocalized in a subset of profiles in confocal sections selected for optimal staining of endogenous IQGAP1 (Fig. S2, A and B). Taken together these data indicate that ATG9A, IQGAP1, and CHMP2A work together (Fig. 2 E) to mediate phagophore closure.
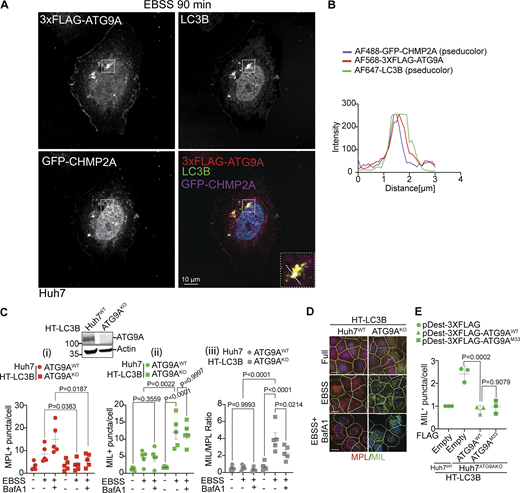
ATG9A colocalizes with CHMP2A and supports sequential stages in autophagosome biogenesis. (A) Confocal microscopy imaging of Huh7WT cells transiently transfected with pDest-3xFLAG-ATG9A and GFP-CHMP2A and stained for endogenous LC3B. Cells were starved in EBSS for 90 min. White square, enlarged area in the inset (merged image; dashed diagonal line - section). (B) Profile intensity (dashed diagonal in A inset) for multiple fluorescence channels. (C) Immunoblot analysis of ATG9A KO in Huh7 cells and MIL/MPL HCM closure assay in Huh7WT (circles) and Huh7ATG9AKO (squares) cells stably expressing HT-LC3B; starvation-induced autophagy (EBSS, 90 min) ± 100 nM BafA1. (i–iii) Quantifications: (i) MPL+ HT-LC3B (red symbols); (ii) MIL+ HT-LC3B (green symbols); (iii) MIL/MPL ratios (puncta/cell; gray symbols). (D) HCM images: red masks, MPL+ profiles, green masks, MIL+ profiles. Quantification: >500 (cells)/well with 80 fields/well; 6 wells per sample/plate. Data, means ± SD, n = 5 (biologically independent experiments); one-way ANOVA followed by Tukey’s multiple comparison test. (E) Complementation analysis of Huh7ATG9AKO HT-LC3B cells transfected with pDest-3xFLAG, pDest-3xFLAG-ATG9AWT or pDest-3xFLAG-ATG9AM33 mutant. Source data are available for this figure: SourceData F3.
ATG9A colocalizes with CHMP2A and supports sequential stages in autophagosome biogenesis. (A) Confocal microscopy imaging of Huh7WT cells transiently transfected with pDest-3xFLAG-ATG9A and GFP-CHMP2A and stained for endogenous LC3B. Cells were starved in EBSS for 90 min. White square, enlarged area in the inset (merged image; dashed diagonal line - section). (B) Profile intensity (dashed diagonal in A inset) for multiple fluorescence channels. (C) Immunoblot analysis of ATG9A KO in Huh7 cells and MIL/MPL HCM closure assay in Huh7WT (circles) and Huh7ATG9AKO (squares) cells stably expressing HT-LC3B; starvation-induced autophagy (EBSS, 90 min) ± 100 nM BafA1. (i–iii) Quantifications: (i) MPL+ HT-LC3B (red symbols); (ii) MIL+ HT-LC3B (green symbols); (iii) MIL/MPL ratios (puncta/cell; gray symbols). (D) HCM images: red masks, MPL+ profiles, green masks, MIL+ profiles. Quantification: >500 (cells)/well with 80 fields/well; 6 wells per sample/plate. Data, means ± SD, n = 5 (biologically independent experiments); one-way ANOVA followed by Tukey’s multiple comparison test. (E) Complementation analysis of Huh7ATG9AKO HT-LC3B cells transfected with pDest-3xFLAG, pDest-3xFLAG-ATG9AWT or pDest-3xFLAG-ATG9AM33 mutant. Source data are available for this figure: SourceData F3.
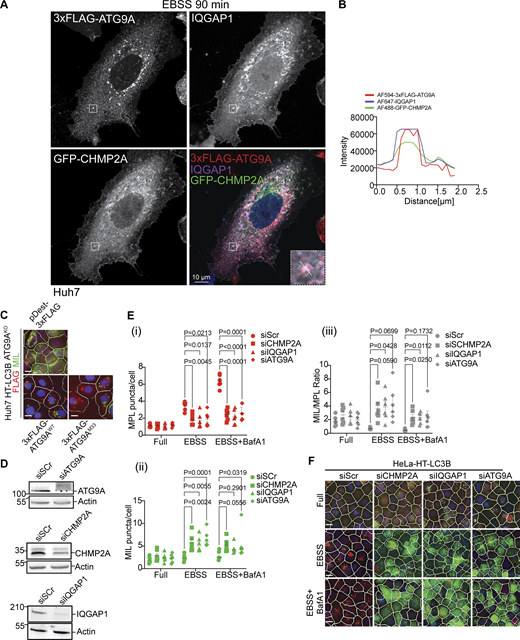
Localization analysis of IQGAP1, CHMP2A, and ATG9A and effects of their depletion on autophagosome closure. (A) Huh7WT cells were transiently co-transfected with pDest-3xFLAG-ATG9A and pDest-GFP-CHMP2A and stained for endogenous IQGAP1. Cells were starved in EBSS for 90 min. The selected area is shown within the white square, and the inset is depicted in the merged image. The region of interest (ROI) is marked with a diagonal dashed white line. (B) Profile intensity (dashed diagonal in A inset) for multiple fluorescence channels. (C) Representative images (HCM), one of 80 fields/well in reference to Fig. 3 E. Huh7WT and Huh7ATG9AKO cells stably expressing HT-LC3B complemented with pDest-3xFLAG-ATG9AWT or pDest-3xFLAG-ATG9AM33 (lipid scramblase mutant). (D) Immunoblot analysis of ATG9A, CHMP2A and IQAGP1 knockdown in Huh7 HT-LC3B cells. (E) Quantification, MIL/MPL HCM closure assay. HeLa HT-LC3B (stable cells) treated with siRNAs for CHMP2A (squares), IQGAP1 (triangles), ATG9A (diamonds), or control (Scr; circles). Autophagy was induced in EBSS for 90 min ± BafA1 (100 nM). Cells were sequentially incubated with MIL to stain unclosed structures and MPL to stain HT-LC3B-II available in closed membrane. (i–iii) MPL+, (red) puncta/cell, (ii) MIL+ (green) puncta/cell; (iii) MIL/MPL (gray) ratios of puncta per cell in I and ii. (F) HCM images represent examples (1 of 80 fields/well; >500 primary objects (cells)/well; 4 wells per sample/plate) of MPL+ (red masks; closed) and MIL+ (green masks; unclosed) quantified in E. Data means, ± SD, n = 5 (biologically independent experiments); two-way ANOVA followed by Tukey’s multiple comparison test Scale bars, 10 μm. Source data are available for this figure: SourceData FS2.
Localization analysis of IQGAP1, CHMP2A, and ATG9A and effects of their depletion on autophagosome closure. (A) Huh7WT cells were transiently co-transfected with pDest-3xFLAG-ATG9A and pDest-GFP-CHMP2A and stained for endogenous IQGAP1. Cells were starved in EBSS for 90 min. The selected area is shown within the white square, and the inset is depicted in the merged image. The region of interest (ROI) is marked with a diagonal dashed white line. (B) Profile intensity (dashed diagonal in A inset) for multiple fluorescence channels. (C) Representative images (HCM), one of 80 fields/well in reference to Fig. 3 E. Huh7WT and Huh7ATG9AKO cells stably expressing HT-LC3B complemented with pDest-3xFLAG-ATG9AWT or pDest-3xFLAG-ATG9AM33 (lipid scramblase mutant). (D) Immunoblot analysis of ATG9A, CHMP2A and IQAGP1 knockdown in Huh7 HT-LC3B cells. (E) Quantification, MIL/MPL HCM closure assay. HeLa HT-LC3B (stable cells) treated with siRNAs for CHMP2A (squares), IQGAP1 (triangles), ATG9A (diamonds), or control (Scr; circles). Autophagy was induced in EBSS for 90 min ± BafA1 (100 nM). Cells were sequentially incubated with MIL to stain unclosed structures and MPL to stain HT-LC3B-II available in closed membrane. (i–iii) MPL+, (red) puncta/cell, (ii) MIL+ (green) puncta/cell; (iii) MIL/MPL (gray) ratios of puncta per cell in I and ii. (F) HCM images represent examples (1 of 80 fields/well; >500 primary objects (cells)/well; 4 wells per sample/plate) of MPL+ (red masks; closed) and MIL+ (green masks; unclosed) quantified in E. Data means, ± SD, n = 5 (biologically independent experiments); two-way ANOVA followed by Tukey’s multiple comparison test Scale bars, 10 μm. Source data are available for this figure: SourceData FS2.
ATG9A as a hub supporting sequential stages in autophagosomal biogenesis
ATG9A is important for the X (initiation) (Broadbent et al., 2023; Cook and Hurley, 2023; Kannangara et al., 2021; Nguyen et al., 2023; Olivas et al., 2023; Ren et al., 2023) and Y (expansion) steps (Maeda et al., 2020; van Vliet et al., 2022) of autophagosome biogenesis (Fig. 1 B), and based on the above experiments participates in the Z (closure) step. This was reflected in the MIL/MPL assay (Fig. 3, C and D), whereby Huh7ATG9AKO HT-LC3B cells showed reduced MPL levels (Fig. 3, C i).
However, we also observed elevated MIL+ puncta levels and elevated MIL/MPL ratios relative to those in the parental Huh7WT HT-LC3B cells (Fig. 3, C ii and iii). The elevated MIL+ profiles in Huh7ATG9AKO HT-LC3B cells suggest an increase in the formation of HT-LC3B+ profiles accessible to the MIL probe despite these cells lacking ATG9A and thus expected not to be able to initiate canonical autophagy. A portion of elevated MIL+ profiles in cells lacking ATG9A could be LC3B+ membranes accessible to the MIL probe not necessarily limited to unclosed phagophores, given that atg8ylation of membranes other than the canonical autophagosomal organelles could be elevated (Deretic et al., 2024). Another portion of MIL+ profiles could be the previously described LC3B-containing protein condensates not protected by membranes (Maeda et al., 2020; Runwal et al., 2019; Sun et al., 2018), such as the structures referred to as high-density particles (HDPs) (Kishi-Itakura et al., 2014). We found that MIL+ profiles were suppressed in cells expressing 3xFLAG-ATG9AWT as determined by HCM (Fig. 3 E and Fig. S2 C). A prior report has indicated that the scramblase activity of ATG9A contributes to autophagosomal size but its absence does not prevent phagophore initiation or closure (Maeda et al., 2019). When the pDest-3xFLAG-ATG9AM33 construct, encoding a lipid scramblase mutant of ATG9A (Maeda et al., 2020), was used in complementation experiments, this variant of ATG9A also suppressed formation of MIL+ profiles, an effect that was indistinguishable from complementation with pDest-3xFLAG-ATG9AWT (Fig. 3 E and Fig. S2 C). The finding that pDest-3xFLAG-ATG9AWT and pDest-3xFLAG-ATG9AM33 squelched the excess MIL+ profiles in Huh7ATG9AKO HT-LC3B cells indicates that the surplus MIL+ stained LC3B in ATG9A knockout cells is tied to their inability to carry out canonical autophagy and incorporate LC3B into closed autophagosomes.
We next employed a technique termed SolVit (sealing of organellar limiting membranes in vitro) developed to study autophagosomal closure in a cell-free system (Fig. 4, A and B) (Javed et al., 2023). In SolVit, postnuclear supernatants (PNS) after sheer lysis of donor cells are combined with PNS from acceptor cells in the presence or absence of ATP to support biochemical reactions during membrane closure (Fig. 4 B). This is followed by sequential staining with MIL and MPL and HCM analysis of reaction products immobilized in mounting media on the bottoms of 96-well plates. When PNS from Huh7ATG9AKO HT-LC3B cells, prepared as previously described (Javed et al., 2023), were combined with equivalent preparations from either Huh7WT or Huh7ATG9AKO cells, the combination with PNS from Huh7WT cells increased MPL+ closed HT-LC3B profiles upon addition of ATP, whereas the combination with PNS from Huh7ATG9AKO cells increased primarily the MIL+ unclosed HT-LC3B profiles upon addition of ATP (Fig. 4, A–C). Collectively, the above experiments show that ATG9A is important for the generation of closed autophagosomes.
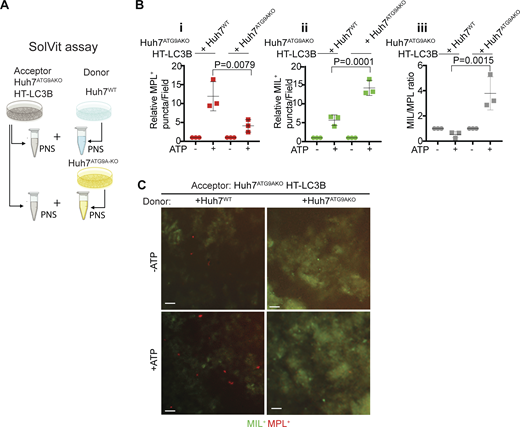
In vitro assay for autophagosome closure. (A) SolVit (sealing of organellar limiting membranes in vitro) assay schematic: in vitro complementation by mixing postnuclear supernatants (PNS) from ATG9AKO HT-LC3B cells (Acceptor) with PNS from ATG9AWT or ATG9AKO cells (Donor), ±ATP, incubated for 1 h. PNS were from cells treated with 20 μM CCCP for 6 h. Reaction products were stained with MIL and MPL sequentially and immobilized in mounting media on the bottom of 96-well plates followed by HCM quantification. (B i–iii) MPL+ profiles (red); (ii) MIL+ profiles (green). (iii) MIL/MPL ratios (gray). Each HCM experimental point: 1,000 valid primary objects/cells per well, 5 wells/sample. Data, means ± SD, n = 3 (biologically independent experiments); one-way ANOVA followed by Tukey’s multiple comparison test. (C) Examples of HCM images from SolVit assay. Red profiles, MPL+ closed LCB+ membranes; Green profiles, MIL+ unclosed LC3B+ membranes. Scale bars, 3 μm. Source data are available for this figure: SourceData F4.
In vitro assay for autophagosome closure. (A) SolVit (sealing of organellar limiting membranes in vitro) assay schematic: in vitro complementation by mixing postnuclear supernatants (PNS) from ATG9AKO HT-LC3B cells (Acceptor) with PNS from ATG9AWT or ATG9AKO cells (Donor), ±ATP, incubated for 1 h. PNS were from cells treated with 20 μM CCCP for 6 h. Reaction products were stained with MIL and MPL sequentially and immobilized in mounting media on the bottom of 96-well plates followed by HCM quantification. (B i–iii) MPL+ profiles (red); (ii) MIL+ profiles (green). (iii) MIL/MPL ratios (gray). Each HCM experimental point: 1,000 valid primary objects/cells per well, 5 wells/sample. Data, means ± SD, n = 3 (biologically independent experiments); one-way ANOVA followed by Tukey’s multiple comparison test. (C) Examples of HCM images from SolVit assay. Red profiles, MPL+ closed LCB+ membranes; Green profiles, MIL+ unclosed LC3B+ membranes. Scale bars, 3 μm. Source data are available for this figure: SourceData F4.
Ultrastructural analysis of autophagosomal closure
The above functional and fluorescence microscopy-based studies were complemented by ultrastructural analyses. For this, we used HeLa cells where electron microscopy (EM) parameters and ultrastructural interpretations have been well-established. We first confirmed, using the MIL/MPL HCM assay, loss of autophagosomal closure upon depletion of ATG9A, IQGAP1, or CHMP2A in HeLa cells induced for autophagy in EBSS (Fig. S2, D–F), which paralleled the results in Huh7 cells. As expected, HeLa cells knocked out for ATG9A (HeLaATG9AKO) showed a diminished number of double-membrane autophagosomes relative to the parental HeLa cells (Fig. 5, A and D; and Fig. S3 A) in agreement with the function of ATG9A in steps X and Y. In contrast, there was a prominent accumulation of unclosed phagophores in cells knocked down for IQGAP1 or CHMP2A (Fig. 5, B and D; and Fig. S3 A). The corresponding features of open phagophores are highlighted in Fig. S3 B, with additional examples shown in Fig. S3 D. These observations and quantifications confirm the role of IQGAP1 and CHMP2A in phagophore closure at the ultrastructural level.
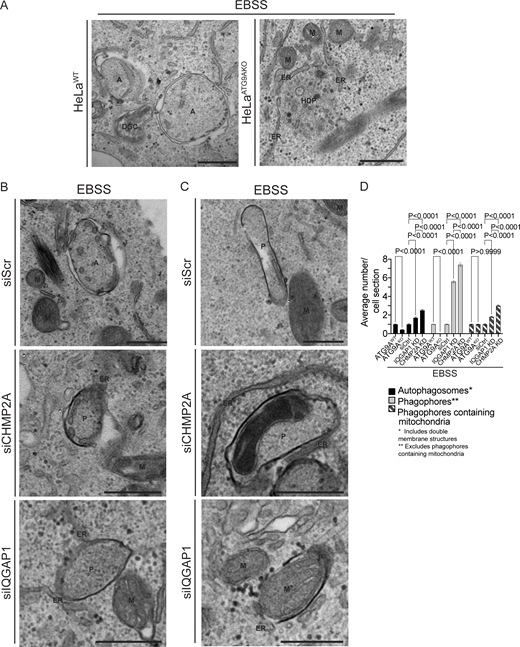
Ultrastructural analysis of ATG9A, IQGAP1, and CHMP2A in autophagosome closure. (A–C) Representative transmission electron microscopy (EM) micrographs of profiles in HeLaWT and HeLaATG9AKO (A), and HeLa cells treated with siRNA control (siScr), CHMP2A siRNA, or IQGAP1 siRNA (B and C). Cells were treated with EBSS (90 min) to induce autophagy. Examples of mitochondria engulfed in phagophores (C) in CHMP2A and IQGAP1 knockdown cells after EBSS treatment (90 min). (D) Quantification of autophagic structures (average number/cell section) in cells treated with EBSS (90 min) 60 sections were examined for counting. A, autophagosomes (engulfed content of similar electron density to surrounding cytosol); ER, endoplasmic reticulum; HDP, high density particle; M, mitochondria; P, phagophores. Statistics, unpaired t test. Data, sample mean, SE. Source data are available for this figure: SourceData F5.
Ultrastructural analysis of ATG9A, IQGAP1, and CHMP2A in autophagosome closure. (A–C) Representative transmission electron microscopy (EM) micrographs of profiles in HeLaWT and HeLaATG9AKO (A), and HeLa cells treated with siRNA control (siScr), CHMP2A siRNA, or IQGAP1 siRNA (B and C). Cells were treated with EBSS (90 min) to induce autophagy. Examples of mitochondria engulfed in phagophores (C) in CHMP2A and IQGAP1 knockdown cells after EBSS treatment (90 min). (D) Quantification of autophagic structures (average number/cell section) in cells treated with EBSS (90 min) 60 sections were examined for counting. A, autophagosomes (engulfed content of similar electron density to surrounding cytosol); ER, endoplasmic reticulum; HDP, high density particle; M, mitochondria; P, phagophores. Statistics, unpaired t test. Data, sample mean, SE. Source data are available for this figure: SourceData F5.
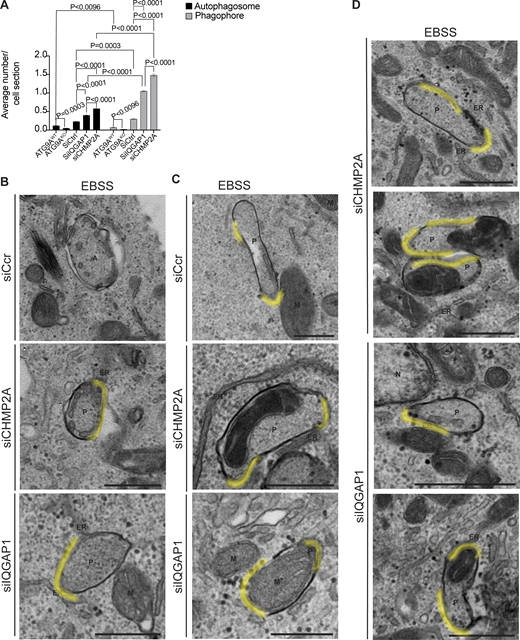
Transmission electron microscopy analysis of HeLa cell knocked out for ATG9A or knocked down for CHMP2A and IQGAP1. (A) Quantification of the average number of autophagosomes (black bars) and phagophores (gray bars) per cell section in HeLaWT or HeLaATG9AKO, HeLa siRNA control (siScr), or HeLa knockdown for CHMP2A and IQGAP1 (non-normalized data corresponding to the graph in Fig. 3 D). (B and C) Electron micrographs as in Fig. 3 with highlighted (yellow) open regions. (C and D) Additional examples (micrographs) representing phagophores containing mitochondria or not in CHMP2A and IQGAP1 knockdown cells quantified in Fig. 3 D. T test. Data means ± SE. Scale Bar 500 nm. A: Autophagosome; ER, Endoplasmic Reticulum; M, Mitochondria; M*, Mitochondria inside a phagophore; N, Nucleus; P, Phagophore. Source data are available for this figure: SourceData FS3.
Transmission electron microscopy analysis of HeLa cell knocked out for ATG9A or knocked down for CHMP2A and IQGAP1. (A) Quantification of the average number of autophagosomes (black bars) and phagophores (gray bars) per cell section in HeLaWT or HeLaATG9AKO, HeLa siRNA control (siScr), or HeLa knockdown for CHMP2A and IQGAP1 (non-normalized data corresponding to the graph in Fig. 3 D). (B and C) Electron micrographs as in Fig. 3 with highlighted (yellow) open regions. (C and D) Additional examples (micrographs) representing phagophores containing mitochondria or not in CHMP2A and IQGAP1 knockdown cells quantified in Fig. 3 D. T test. Data means ± SE. Scale Bar 500 nm. A: Autophagosome; ER, Endoplasmic Reticulum; M, Mitochondria; M*, Mitochondria inside a phagophore; N, Nucleus; P, Phagophore. Source data are available for this figure: SourceData FS3.
Strikingly, we frequently detected mitochondria captured in unclosed phagophores in cells knocked down for IQGAP1 or CHMP2A (Fig. 5, C and D). These mitophagophore structures, i.e., open phagophores harboring mitochondria, are highlighted in Fig. S3, C and D. There was a statistically significant increase in mitochondria-containing unclosed autophagic profiles in cells knocked down for IQGAP1 or CHMP2A (Fig. 5 D). Although mitophagy is readily detected when it is induced by mitochondrial depolarization treatments, it is unusual to detect at the ultrastructural level basal mitophagy or mitophagy in cells undergoing starvation-induced autophagy. We interpret these observations as a manifestation of basal mitophagy arrested at the closure state in cells deficient for IQGAP1 and CHMP2A, reflected in the accumulation of mitophagophores that cannot close.
We also detected additional morphological features in most cells (ATG9A knockout and IQGAP1 or CHMP2A knockdowns), including those typical of autophagy but also of other pathways, collectively termed degradative compartments (Fig. S4), as well as HDPs (Kishi-Itakura et al., 2014) in HeLaATG9KO cells (Fig. S4 A). There was also a paradoxical increase in profiles scored as autophagosomes when cells were knocked down for IQGAP1 or CHMP2A (Fig. 5 D and Fig. S3 A); we interpret this as a reflection of such profiles not being closed but containing openings in a plane different than the one captured in the EM sections. In keeping with this interpretation, such profiles were in frequent contact with or in the vicinity of the ER (Fig. S4 C), as was the case with morphologically clearly unclosed phagophores (Fig. 5 B; and Fig. S3, B and D) in keeping with the concept that nascent phagophores are adjacent to and form membrane contact sites with the ER (Hayashi-Nishino et al., 2010; Ylä-Anttila et al., 2009).
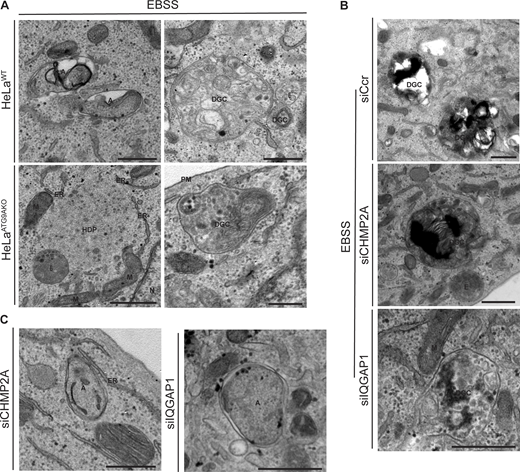
Additional types of profiles in electron micrographs from ultrastructural analyses. (A) HeLaWT and HeLaATG9AKO cells. Note autophagosome and DGC in HeLaWT cells and HDP and fewer DGC in HeLaATG9AKO. (B and C) HeLa cells knocked down for CHMP2A or IQGAP1. siRNA: siSCr control, CHPM2A or IQGAP1. A, autophagosome; DGC, degradative compartments; ER, endoplasmic reticulum; HDP, high density particle; M, mitochondria; N, nucleus; E, endosome; PM, plasma membrane. Scale bar, 500 nm. Source data are available for this figure: SourceData FS4.
Additional types of profiles in electron micrographs from ultrastructural analyses. (A) HeLaWT and HeLaATG9AKO cells. Note autophagosome and DGC in HeLaWT cells and HDP and fewer DGC in HeLaATG9AKO. (B and C) HeLa cells knocked down for CHMP2A or IQGAP1. siRNA: siSCr control, CHPM2A or IQGAP1. A, autophagosome; DGC, degradative compartments; ER, endoplasmic reticulum; HDP, high density particle; M, mitochondria; N, nucleus; E, endosome; PM, plasma membrane. Scale bar, 500 nm. Source data are available for this figure: SourceData FS4.
In summary, the morphological data combined with functional analyses in prior sections demonstrate that IQGAP1 is a hitherto unappreciated canonical autophagy factor and that ATG9A, IQGAP1, and CHMP2A work together during autophagosomal closure.
ATG9A–IQGAP1 interaction is critical for phagophore closure
ATG9A and IQGAP1 directly interact (Claude-Taupin et al., 2021). To enable further analysis of their cooperation in autophagosomal closure, we set out to generate mutants specifically disrupting such interactions. The available cryoEM structure (PDB 6WQZ) of ATG9A (Guardia et al., 2020) provides information up to the amino acid residue at position 587. The remaining large section of ATG9A, up to its C terminal (residue 839), is considered to be relatively unstructured. In our prior work (Claude-Taupin et al., 2021), we mapped IQGAP1 binding to the part of ATG9A between residues 495 and 839. Here, we employed the CollabFold implementation of AlphaFold-Multimer (Evans et al., 2022, Preprint; Mirdita et al., 2022) as an approach to search for sites of putative interactions between this part of ATG9A and IQGAP1 segments (Fig. S5 A). Among several resulting candidate sites, we focused on a region, termed Site 1 (Fig. 6 A and Fig. S5 B), with the highest AlphaFold prediction confidence metrics (pLDDT/predicted local distance difference test of 74.56; pTM/predicted template modeling score of 0.60; and interface predicted template modeling/ipTM of 0.58) (Fig. S5, C–E). A detailed view of this site and its key residues as well as its location within the AlphaFold database model AF-Q7Z3C6 is shown in Fig. S5, F and G. Another short region, termed Site 2 (Fig. 6 B and Fig. S5 H), with lower confidence metrics scores (Fig. S5, I and J) and a smaller calculated interface area (Fig. S5 K) was also included in further analyses. We generated mutants in full-size ATG9A: ATG9ACD1, in which four amino acids of Site 1 (689WEGQLQSLVLSEY701) were changed (W689S, E690K, L693R, Y701N), and ATG9ACD2, in which all amino acids of site 2 (801FSRLP805) were mutated into 801AAAA805 (Fig. 6, A and B). The ATG9ACD1 and ATG9ACD2 variants were used as 3xFLAG fusions in Co-IP experiments to test the effects of the mutations on the binding between ATG9A and IQGAP1. Both mutations, CD1 and CD2, diminished binding between ATG9A and IQGAP1 (Fig. 6, C and D) but did not perturb association with ATG13 and FIP200 (Fig. 6 E), which is important in the step X of autophagy (Ren et al., 2023). We next tested whether CD1 and CD2 mutations could complement or not the loss of ATG9A in Huh7ATG9AKO cells. Using the TMRHT release assay, we observed proteolytic liberation of the TMRHT fragment from the TMRHT-LC3B fusion in Huh7ATG9AKO HT-LC3B cells complemented with pDest-3xFLAG-ATG9AWT (Fig. 7, A–D). In contrast, Huh7ATG9AKO HT-LC3B cells transfected with pDest-3xFLAG-ATG9ACD1 or pDest-3xFLAG-ATG9ACD2 showed diminished TMRHT fragment release (Fig. 7, A–D). We interpret these findings as an indication that CD1 and CD2 mutations (dubbed CD for closure deficient), which reduce ATG9A–IQGAP1 interactions, prevent the generation of degradation-competent autophagic organelles, a property that requires phagophore closure.
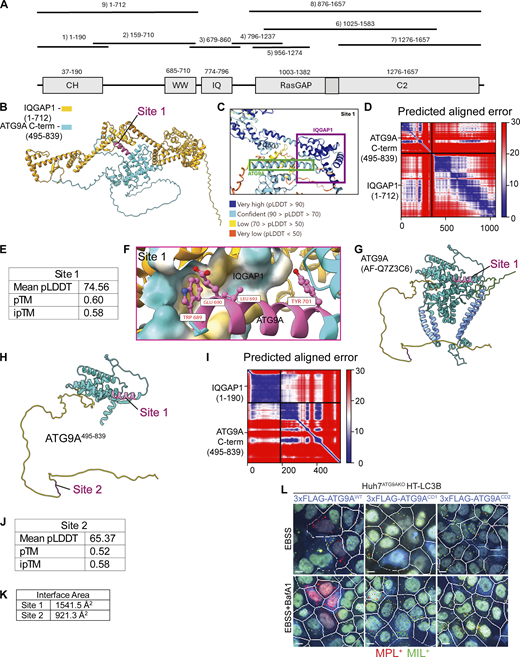
AlphaFold-Multimer modeling of potential IQGAP1-ATG9A interacting sites. (A) Annotated regions of IQGAP1 with fragments used in AlphaFold Multimer predictions; numbers, start/end residues. (B) Rank 1 model of Site 1. (C) Highlighted regions of ATG9A and IQGAP1 colored by pLDDT score (defined in legend). (D) Predicted aligned error (PAE) plot for site 1 model. (E) AlphaFold confidence metrics for Site 1. (F) Putative interactions predicted by AlphaFold-Multimer. Site 1 flipped 180° to enable viewing of a putative binding pocket in IQGAP1. (G) AlphaFold model of full-length ATG9A (AlphaFold database: AF-Q7Z3C6). Yellow, unstructured C-terminal region; green, unstructured N-terminal region; cornflower blue, transmembrane helices; magenta, predicted binding site. (H) AlphaFold model of ATG9A495–839 colored using the same scheme as in G. (I) Predicted aligned error (PAE) plot for site 2 model. (J) AlphaFold confidence metrics for Site 2. (K) Interface area as calculated using the PISA server for both Site 1 and Site 2. (L) Example images (MIL/MPL HCM) corresponding to the complementation experiments in Fig. 7 E. White masks, primary objects (cells); red masks, MPL+ structures; green masks, MIL+ structures. Gating was on FLAG transfected cells stained with anti-FLAG for immunofluorescence detection (blue). Scale bar 10 μm. Source data are available for this figure: SourceData FS5.
AlphaFold-Multimer modeling of potential IQGAP1-ATG9A interacting sites. (A) Annotated regions of IQGAP1 with fragments used in AlphaFold Multimer predictions; numbers, start/end residues. (B) Rank 1 model of Site 1. (C) Highlighted regions of ATG9A and IQGAP1 colored by pLDDT score (defined in legend). (D) Predicted aligned error (PAE) plot for site 1 model. (E) AlphaFold confidence metrics for Site 1. (F) Putative interactions predicted by AlphaFold-Multimer. Site 1 flipped 180° to enable viewing of a putative binding pocket in IQGAP1. (G) AlphaFold model of full-length ATG9A (AlphaFold database: AF-Q7Z3C6). Yellow, unstructured C-terminal region; green, unstructured N-terminal region; cornflower blue, transmembrane helices; magenta, predicted binding site. (H) AlphaFold model of ATG9A495–839 colored using the same scheme as in G. (I) Predicted aligned error (PAE) plot for site 2 model. (J) AlphaFold confidence metrics for Site 2. (K) Interface area as calculated using the PISA server for both Site 1 and Site 2. (L) Example images (MIL/MPL HCM) corresponding to the complementation experiments in Fig. 7 E. White masks, primary objects (cells); red masks, MPL+ structures; green masks, MIL+ structures. Gating was on FLAG transfected cells stained with anti-FLAG for immunofluorescence detection (blue). Scale bar 10 μm. Source data are available for this figure: SourceData FS5.
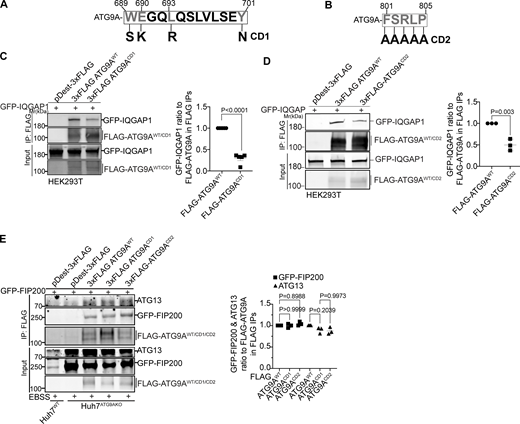
The C-terminal domain of ATG9A mediates its interaction with IQGAP1. (A and B) CD1 and CD2 mutant sites. Numbers, position within full size ATG9A. Mutated residues in ATG9A are indicated in gray. In A: S, polar instead of aromatic W; K, basic instead of acidic E; R, charged instead of aliphatic L; and N, polar instead of aromatic Y. In B, five consecutive residues (FSRLP) were changed to five As. (C) Co-IP analysis of pDest-3xFLAG-ATG9AWT or pDest-3xFLAG-ATG9ACD1 with pDest-GFP-IQGAP1 in transfected HEK293T cells and quantification of GFP-IQGAP1 and FLAG-ATG9A ratios. (D) Co-IP analysis of pDest-3xFLAG-ATG9AWT or pDest-3xFLAG-ATG9ACD2 with GFP-IQGAP1 in transfected HEK293T cells and quantification of GFP-IQGAP1 and FLAG-ATG9A intensity ratios. (E) Co-IP analysis of CD1 and CD2 ATG9A mutants (3xFLAG fusions) with GFP-FIP200 and endogenous ATG13. Huh7ATG9AKO were transfected with pDest-3xFLAG, pDest-3xFLAG-ATG9AWT, pDest-3xFLAG-ATG9ACD1, pDest-3xFLAG-ATG9ACD2. Autophagy was induced by EBSS (90 min). Data are means ± SD, n = 3–5 (biologically independent experiments); one-way ANOVA followed by Tukey’s multiple comparison test. Source data are available for this figure: SourceData F6.
The C-terminal domain of ATG9A mediates its interaction with IQGAP1. (A and B) CD1 and CD2 mutant sites. Numbers, position within full size ATG9A. Mutated residues in ATG9A are indicated in gray. In A: S, polar instead of aromatic W; K, basic instead of acidic E; R, charged instead of aliphatic L; and N, polar instead of aromatic Y. In B, five consecutive residues (FSRLP) were changed to five As. (C) Co-IP analysis of pDest-3xFLAG-ATG9AWT or pDest-3xFLAG-ATG9ACD1 with pDest-GFP-IQGAP1 in transfected HEK293T cells and quantification of GFP-IQGAP1 and FLAG-ATG9A ratios. (D) Co-IP analysis of pDest-3xFLAG-ATG9AWT or pDest-3xFLAG-ATG9ACD2 with GFP-IQGAP1 in transfected HEK293T cells and quantification of GFP-IQGAP1 and FLAG-ATG9A intensity ratios. (E) Co-IP analysis of CD1 and CD2 ATG9A mutants (3xFLAG fusions) with GFP-FIP200 and endogenous ATG13. Huh7ATG9AKO were transfected with pDest-3xFLAG, pDest-3xFLAG-ATG9AWT, pDest-3xFLAG-ATG9ACD1, pDest-3xFLAG-ATG9ACD2. Autophagy was induced by EBSS (90 min). Data are means ± SD, n = 3–5 (biologically independent experiments); one-way ANOVA followed by Tukey’s multiple comparison test. Source data are available for this figure: SourceData F6.
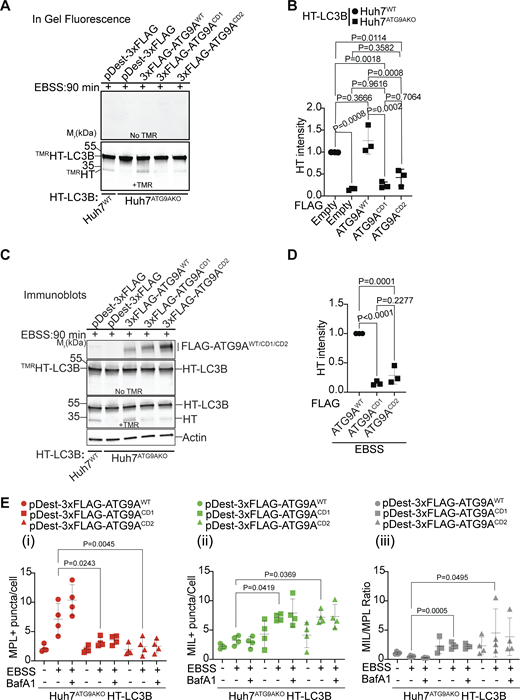
Disrupted ATG9A–IQGAP1 interaction impairs autophagosomal closure. (A–D)TMRHT release assay (see Fig. 2) in Huh7WT or Huh7ATG9AKO cells stably expressing HT-LC3B. Huh7ATG9AKO transfected with pDest-3xFLAG, pDest-3xFLAG-ATG9AWT, pDest-3xFLAG-ATG9ACD1, or pDest-3xFLAG-ATG9ACD2. Free TMRHT was measured by in-gel fluorescence (A and B) and immunoblotting (C and D). Cells were induced for autophagy in EBSS (90 min). Data are means ± SD, n = 3 (biologically independent experiments); one-way ANOVA followed by Tukey’s multiple comparison test. (E) MIL/MPL HCM assay in Huh7ATG9AKO HT-LC3B cells transiently transfected with pDest-3xFLAG-ATG9AWT (circles), pDest-3xFLAG-ATG9ACD1 (squares), or pDest3xFLAG-ATG9ACD2 (triangles). Gating on FLAG immunofluorescence was used to identify transfected cells. (i–iii) MPL+, closed HT-LC3B profiles (red symbols); (ii) MIL+, accessible HT-LC3B (green symbols); (iii) MIL/MPL ratios (gray symbols) of puncta/cell values in (i) and (ii). Cells were starved in EBSS for 90 min ± 100 nM BafA1, sequentially incubated with HT ligands MIL and MPL with immunostaining of FLAG incorporated into the protocol. Quantification: >500 cells/well; 4 wells per sample/plate, Data, means ± SD, n = 4 (biologically independent experiments); ANOVA followed by Tukey’s multiple comparison test. Source data are available for this figure: SourceData F7.
Disrupted ATG9A–IQGAP1 interaction impairs autophagosomal closure. (A–D)TMRHT release assay (see Fig. 2) in Huh7WT or Huh7ATG9AKO cells stably expressing HT-LC3B. Huh7ATG9AKO transfected with pDest-3xFLAG, pDest-3xFLAG-ATG9AWT, pDest-3xFLAG-ATG9ACD1, or pDest-3xFLAG-ATG9ACD2. Free TMRHT was measured by in-gel fluorescence (A and B) and immunoblotting (C and D). Cells were induced for autophagy in EBSS (90 min). Data are means ± SD, n = 3 (biologically independent experiments); one-way ANOVA followed by Tukey’s multiple comparison test. (E) MIL/MPL HCM assay in Huh7ATG9AKO HT-LC3B cells transiently transfected with pDest-3xFLAG-ATG9AWT (circles), pDest-3xFLAG-ATG9ACD1 (squares), or pDest3xFLAG-ATG9ACD2 (triangles). Gating on FLAG immunofluorescence was used to identify transfected cells. (i–iii) MPL+, closed HT-LC3B profiles (red symbols); (ii) MIL+, accessible HT-LC3B (green symbols); (iii) MIL/MPL ratios (gray symbols) of puncta/cell values in (i) and (ii). Cells were starved in EBSS for 90 min ± 100 nM BafA1, sequentially incubated with HT ligands MIL and MPL with immunostaining of FLAG incorporated into the protocol. Quantification: >500 cells/well; 4 wells per sample/plate, Data, means ± SD, n = 4 (biologically independent experiments); ANOVA followed by Tukey’s multiple comparison test. Source data are available for this figure: SourceData F7.
The effects of CD1 and CD2 mutations were directly tested by MPL/MIL HCM in complementation experiments using pDest-3xFLAG-ATG9AWT, pDest-3xFLAG-ATG9ACD1, or pDest-3xFLAG-ATG9ACD2 expression constructs and identifying transfected cells by immunofluorescent staining of FLAG, which somewhat quenched the MPL/MIL signals in transfectants for technical reasons but nevertheless permitted comparisons between the constructs (Fig. 7 E and Fig. S5 L). The Huh7ATG9AKO HT-LC3B cells transfected with 3xFLAG-ATG9AWT showed increased MPL+ puncta when induced for autophagy by EBSS, which was far less prominent in cells transfected with pDest-3xFLAG-ATG9ACD1 or pDest-3xFLAG-ATG9ACD2 constructs (Fig. 7, E i). This was mirrored by an increase in MIL+ puncta (and MIL/MPL ratios) in Huh7ATG9AKO HT-LC3B cells transfected with pDest-3xFLAG-ATG9ACD1 or pDest-3xFLAG-ATG9ACD2 relative to cells transfected with pDest-3xFLAG-ATG9AWT (Fig. 7, E i and ii). We concluded that CD1 and CD2 mutations, which reduce ATG9A–IQGAP1 association, prevent ATG9A from effectively participating in phagophore closure and formation of autophagosomes.
ATG9A as a probe for in vivo roles of the canonical autophagy pathway
Canonical autophagy has been implicated in many physiological and disease states (Klionsky et al., 2021; Mizushima and Levine, 2020) including immune functions (Deretic, 2021) and defense against microbes (Levine et al., 2011; Randow and Youle, 2014) such as the macrophage-parasitizing human pathogen Mycobacterium tuberculosis (Mtb) (Castillo et al., 2012; Gutierrez et al., 2004; Watson et al., 2012). Many such studies have relied on mutants in the LC3 lipidation cascade (also known as membrane atg8ylation) considered to be representative of autophagy. However, components of membrane atg8ylation (Deretic et al., 2024; Deretic and Klionsky, 2024) participate in several other homeostatic processes engaging non-autophagic membranes (Deretic and Lazarou, 2022; Durgan and Florey, 2022). This dichotomy underlies currently unresolved controversies concerning whether canonical autophagy or noncanonical processes contribute to the control of Mtb (Deretic and Wang, 2023; Feng et al., 2024; Golovkine et al., 2023; Kimmey et al., 2015; Kinsella et al., 2023; Köster et al., 2017; Wang et al., 2023). Thus, to resolve the contributions of canonical autophagy vs. noncanonical processes to control of Mtb in animal models, it is important to target canonical autophagy-specific genes. This is a difficult task, given that many ATG factors have non-autophagic roles (Galluzzi and Green, 2019). However, the molecular and cellular analyses in this work indicate that ATG9A, through specific interactors and sequential activities, is a relatively good candidate to represent canonical autophagy. A host cell that is key to the control of Mtb is the macrophage. Hence, we used Atg9afl/fl LysM-Cre+ mice (Claude-Taupin et al., 2021) derived from the previously characterized Atg9afl/fl mouse (Yamaguchi et al., 2018) with a conditional ATG9A defect in the myeloid lineage which includes macrophages. We noticed a significant post-weaning spontaneous mortality in Atg9afl/fl LysM-Cre+ mice of both sexes (Fig. 8, A and B). When we challenged mice with a low-dose aerosol of virulent M. tuberculosis (chronic infection model), the animal mortality was not further exacerbated (Fig. 8 A). Similarly, we observed no difference in mortality in the acute infection model between ATG9Afl/fl LysM-Cre+ and Atg9afl/fl LysM-Cre− mice that were infected with high-dose Mtb aerosols (Fig. 8 B). These findings indicate that control of M. tuberculosis relies on noncanonical atg8ylation processes but is independent of canonical autophagy (Deretic, 2023; Köster et al., 2017).
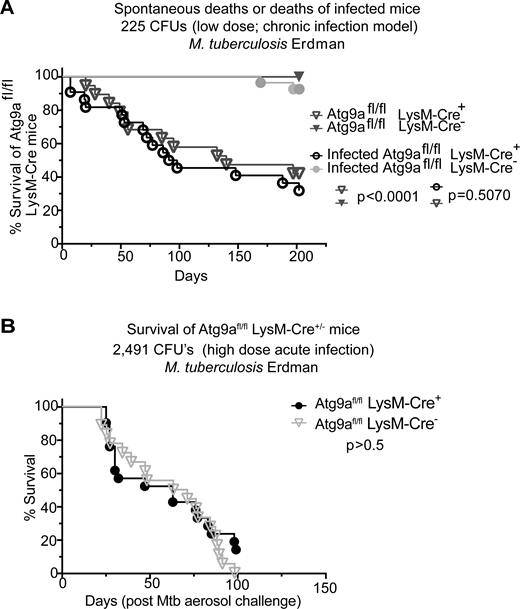
Effects of ATG9A on the viability of mice and in a murine model of tuberculosis. (A) Survival curves of Atg9afl/fl LysM-Cre+ and Atg9afl/fl LysM-Cre− littermate mice uninfected or infected with M. tuberculosis Erdman aerosol (low dose/chronic infection; initial lung deposition, 225 CFU). (B) Survival curves of Atg9afl/fl LysM-Cre+ or Atg9afl/fl LysM-Cre− mice infected with M. tuberculosis Erdman aerosol (high dose/acute infection; initial lung deposition 2,491 CFU). CFU, colony forming units. Statistical test, Mantel–Cox. Source data are available for this figure: SourceData F8.
Effects of ATG9A on the viability of mice and in a murine model of tuberculosis. (A) Survival curves of Atg9afl/fl LysM-Cre+ and Atg9afl/fl LysM-Cre− littermate mice uninfected or infected with M. tuberculosis Erdman aerosol (low dose/chronic infection; initial lung deposition, 225 CFU). (B) Survival curves of Atg9afl/fl LysM-Cre+ or Atg9afl/fl LysM-Cre− mice infected with M. tuberculosis Erdman aerosol (high dose/acute infection; initial lung deposition 2,491 CFU). CFU, colony forming units. Statistical test, Mantel–Cox. Source data are available for this figure: SourceData F8.
Discussion
In this study, we report a hitherto unknown function of ATG9A as a regulator of phagophore closure, the final stage in autophagosome biogenesis. The role of ATG9A in the sealing of the autophagosomal membrane is unanticipated given the general focus in the field on ATG9A’s function during the initial stages of autophagosomal membrane formation (Cook and Hurley, 2023) and its expansion (Maeda et al., 2020; van Vliet et al., 2022). The finding that ATG9A facilitates phagophore membrane closure, along with the other roles of ATG9A during phagophore formation (Broadbent et al., 2023; Cook and Hurley, 2023; Kannangara et al., 2021; Nguyen et al., 2023; Olivas et al., 2023; Ren et al., 2023) and expansion (Maeda et al., 2020; van Vliet et al., 2022), identify ATG9A as a hub that governs all principal steps in the biogenesis of autophagosomal membranes. This is consistent with a model (Fig. 9) whereby ATG9A acts in a sequential manner via subsets of specialized interactors leading to an orderly progression from the initial membrane nidus to the double membrane autophagosome, an emblematic organelle of canonical autophagy.

A model of ATG9A roles in consecutive stages of the canonical autophagy pathway. (i–iv) Stages: initiation (i), expansion (ii a and ii b; alternative ATG9A trafficking pathways for its inclusion in or cycling to/from phagophores), and closure (iii), leading to the formation of double-membrane autophagosomes (iv). ATG2A-ATG9A model is a modified PDB file from van Vliet et al. (2022). IQGAP1 and CHMP2A, AlphaFold structures AF-Q9JKF1 and AF-O43633-F1.
A model of ATG9A roles in consecutive stages of the canonical autophagy pathway. (i–iv) Stages: initiation (i), expansion (ii a and ii b; alternative ATG9A trafficking pathways for its inclusion in or cycling to/from phagophores), and closure (iii), leading to the formation of double-membrane autophagosomes (iv). ATG2A-ATG9A model is a modified PDB file from van Vliet et al. (2022). IQGAP1 and CHMP2A, AlphaFold structures AF-Q9JKF1 and AF-O43633-F1.
IQGAP1, based on this work, acts as a previously unappreciated canonical autophagy factor in mammalian cells. In this capacity, IQGAP1 provides a connection between the ATG and ESCRT systems, both performing intracellular membrane rearrangements in response to growth factors, nutrition, and stress or developmental signals (Christ et al., 2017; Hurley, 2015; Morishita and Mizushima, 2019). ATG9A directs the phagophore closure step through IQGAP1 (Thines et al., 2023), which in turn mobilizes a key ESCRT-III protein, CHMP2A, shown here and elsewhere (Takahashi et al., 2018; Zhen et al., 2020) to be necessary for autophagosomal closure. IQGAP1, the best-studied of the three members of the IQGAP family of proteins, is primarily known for scaffolding roles in a variety of signaling and intracellular trafficking pathways (Thines et al., 2023), including interactions with AMPK (Hedman et al., 2021) and mTORC1 (Chen et al., 2010). Incidentally, mTOR and AMPK are cardinal upstream regulators of canonical autophagy (Ganley et al., 2009; González et al., 2020; Herrero-Martín et al., 2009; Hosokawa et al., 2009; Jung et al., 2009; Kim et al., 2011; Mihaylova and Shaw, 2011; Neufeld, 2010). Scaffolding of protein complexes is a key feature of IQGAP1 (Thines et al., 2023), which fits with the finding that it bridges ATG9A with the key accessory ESCRT-III protein CHMP2A. IQGAP1 has been previously found to interact with ATG9A during the ATG9A’s noncanonical role in plasma membrane repair, which is also an ESCRT-dependent process (Claude-Taupin et al., 2021). IQGAP1 directly binds CHMP2A (Claude-Taupin et al., 2021) and is known to interact with another ESCRT-I protein, TSG101 (Morita et al., 2007), a component of the ESCRT-I helical assembly, also important for autophagosomal closure (Flower et al., 2020).
Of the two IQGAP1 binding sites in the cytofacial C-terminal domain of ATG9A identified here by structural modeling and mutational analysis, site 1/CD1 (ATG9A residues 689–701) protrudes from a relatively structured section within the C-terminal domain of ATG9A based on the predicted model (AF-Q7ZC36) available in AlphaFold Protein Structure Database. Site 2/CD2 (ATG9A residues 801–805) is located further C-terminally within a fully unstructured section (AF-Q7ZC36). Site2/CD2 is relatively close but non-overlapping with the recently identified (Ren et al., 2023) HDIR motif (HORMA dimer interacting region) at the ATG9A C-terminal tail (residues 830–839) with critical amino acids bracketing the 834PQVH837 core sequence. HDIR affects ATG9A binding to ATG13-ATG101 heterodimers (mutations in P834 and H837 abrogate binding) (Ren et al., 2023) and by association with the initiation ULK kinase complex, which is composed of FIP200, ATG13, ATG101, and ULK1/2. The separation between site 2/CD2 and HDIR is consistent with our observation that CD2 mutation does not affect ATG9A’s binding to ATG13 and FIP200. We don’t know whether sites CD1 and CD2 can be occupied at the same site or sequentially.
It is of interest that ATG2A and VPS13, another lipid transfer protein, interact with the C-terminal domain of ATG9A (van Vliet et al., 2022, 2024) that binds IQGAP1. There is a partial overlap between ATG2A and IQGAP1 binding sites in ATG9A. One of the ATG2A binding sites in ATG9A involves an AlphaFold-predicted helix (residues 695–723) located within the relatively unstructured C-terminal domain of ATG9A, which becomes extended (adding residues 687–694 to the AF-Q7ZC36 predicted helix) in our Alpha-Fold models of IQGAP1–ATG9A complexes that encompass the IQGAP1 binding site1/CD1 (at residues 689–701). Deletion of the helix (residues 695–723) in the context of the C-terminal fragment (residues 495–839) of ATG9A abrogates the binding of ATG2A, but in the context of the full-size ATG9A paradoxically causes stronger binding of ATG2A to ATG9A via the remainder of its multiple interaction sites (van Vliet et al., 2022). This has been interpreted as an indication that the 695–723 helix in ATG9A has a modulatory function rather than being solely a binding site for ATG2A (van Vliet et al., 2022). The complexity of ATG2A binding to ATG9A also reflects a region in the N-terminus of ATG9A (Imai et al., 2016; van Vliet et al., 2022). Nevertheless, we speculate that there is an active coordination between Y and Z steps, consistent with the relationships in yeast with Atg9 and Atg2 being at the phagophore tips (Gómez-Sánchez et al., 2018) where closure occurs. We envision this occurring in part through the 687–723 helix, which could transmit signals or be the site of transitions between the ATG2A-bound and IQGAP1-bound states. Conceivably, there could be a competition between ATG2A and IQGAP1 for binding to ATG9A based on the proximity of ATG2 and IQGAP1 binding sites within the 687–723 region of ATG9A. However, this is unlikely since ATG9A is actually a homotrimer (Guardia et al., 2020), and only one protomer at a time is occupied by ATG2A (van Vliet et al., 2022).
Whereas ESCRT subcomplexes are often depicted as an interconnected unit suggesting that they work automatically, it is known that specific stages of the ESCRT cascade are regulated. Moreover, ESCRT components may not possess an intrinsic affinity for negatively curved membranes (Bertin et al., 2020). As a result, they probably have to be guided in a coordinated manner to sites of action. Consistent with this idea, there is a sequential engagement of ESCRT subcomplexes by ATG factors during phagophore closure. The mATG8s covalently bound to aminophospholipids on phagophores recruit VPS37A (Javed et al., 2023), an ESCRT-I factor initiating the process of phagophore closure (Takahashi et al., 2019). Here, we have found that ATG9A via IQGAP1 recruits CHMP2A, a component of the minimal membrane fission machinery (Azad et al., 2023), known to recruit the ATPase VPS4 to ESCRT-III filaments (Teis et al., 2008) and is important for their constriction during the final stages of ESCRT-dependent membrane scission and closure (Maity et al., 2019). Our findings using the SolVit system, designed to study membrane closure in vitro, suggest that ATG9A stimulates ATP-dependent activities including those at the very end stages of membrane scission leading to the closure of LC3B+ membranes.
Phagophore closure is a critical step in canonical autophagy in which the captured cytoplasmic cargo is fully separated from the cytosol and committed to the next step, commonly involving proteolytic degradation within autolysosomes (Morishita and Mizushima, 2019; Zhao and Zhang, 2019). ATG9A’s actions during phagophore initiation (Broadbent et al., 2023; Cook and Hurley, 2023; Kannangara et al., 2021; Nguyen et al., 2023; Olivas et al., 2023; Ren et al., 2023), expansion stages (Maeda et al., 2019; Valverde et al., 2019; van Vliet et al., 2022), and closure, as shown here, position ATG9A as a master regulator of canonical autophagy. We have thus used Atg9a conditional knockout mice to address the controversy regarding whether it is the canonical pathway or noncanonical functions of ATG genes that control Mtb in vivo (Behar and Baehrecke, 2015; Deretic and Wang, 2023). We found that macrophage-specific loss of Atg9a in mice did not sensitize them to aerosol infections with Mtb, using both chronic (low dose) and acute (high dose) infection models. Instead, we observed spontaneous mortality in Atg9afl/fl LysM-Cre+ mice, which was not further exacerbated by Mtb infection. The early reports on the control of Mtb by autophagy (Gutierrez et al., 2004) relied on the use of Atg5 conditional knockout mice (Castillo et al., 2012; Watson et al., 2012) whereas more recent reports have expanded in vivo studies to other autophagy genes (Feng et al., 2024; Golovkine et al., 2023; Kimmey et al., 2015; Kinsella et al., 2023), but mostly those that are involved in atg8ylation, which is not canonical autophagy specific (Deretic et al., 2024). Thus, the issue of whether canonical autophagy or noncanonical processes (Köster et al., 2017; Wang et al., 2023) control Mtb in vivo has remained unresolved (Deretic, 2023; Deretic and Wang, 2023). The data with Atg9afl/fl LysM-Cre+ mice presented here strongly suggest that it is not canonical autophagy but instead non-canonical processes involving atg8ylation that contribute to the control of Mtb in vivo (Deretic and Lazarou, 2022; Deretic et al., 2024; Wang et al., 2023).
Limitations of the study
There are limitations of this work that define areas of further study. AlphaFold modeling remains to be validated in structural analyses of ATG9A–IQGAP1 complexes. Unfortunately, the AlphaFold 3 version publicly available at the time of this study did not help refine the modeling, as it could not predict even the known CryoEM structures within the ATG9A’s C-terminal fragment (495–839) (Guardia et al., 2020). Localization of ATG9A, IQGAP1, and CHMP2A on phagophores will require future work. The signals or programmed molecular events, possibly involving ATG2 proteins, which trigger transitions between ATG9A complexes or sequence their activities during autophagosome biogenesis are of interest to be defined. The pathological processes underlying the spontaneous deaths of ATG9Afl/fl LysM-Cre+ mice remain to be determined in future studies. Nonetheless, our study provides a major conceptual advance regarding the mechanisms of autophagy.
Materials and methods
Antibodies and reagents
The following primary antibodies and dilutions were used: mouse anti-Flag (mAb; F1804; Sigma-Aldrich, 0.5 µg/ml for immunoprecipitation/IP, 1:1,000 for western blot/WB, 1:400 for immunofluorescence/IF), rabbit anti-GFP (ab290; Abcam; 0.5 µg/ml for IP and 1:4,000 for WB), mouse anti-LC3 (M152-3; MBL, 1:400 for IF), rabbit anti-LC3B (27755s; CST, 1:1,000 for WB), rabbit anti-ATG9A (#13509; CST, 1:500 for WB), rabbit anti-IQGAP1 (20648S; CST, 1:1,000 for WB), rabbit anti-NDP52 (60732S; CST, 1:1,000 for WB), mouse anti-p62 (610833; BD Bioscience, 1:1,000 for WB), rabbit anti-CHMP2A (10477-1-AP; Proteintech, 1:500 for WB), Rabbit anti-FIP200 (17250-1-AP; Proteintech) mouse anti-beta-actin (sc-47778; SantaCruz, 1:2,500 for WB), mouse anti-HaloTag (G9211; Promega), rabbit anti-ATG13 (#13468; CST). Secondary antibodies: for IF Alexa Fluor 568 goat anti-mouse (cat#A-11031); for WB IRDye 680 (925-68020 goat anti-mouse; LI-COR), or goat IRDye 800 (926-32211 goat anti-rabbit; LI-COR). HaloTag ligands: MIL HaloTag Alexa Fluor 660 Ligand (G8471; Promega); membrane-permeant ligand (MPL) HaloTag TMR Ligand (G8251; Promega). The following reagents were used: Seahorse XF Plasma Membrane Permeabilizer (102504-100; Agilent). BafA1 (tlrl-baf1; lnvivoGen), carbonyl cyanide m-chlorophenylhydrazone (CCCP, C2759; Sigma-Aldrich), Lipofectamine 2000 (11668019; Thermo Fisher Scientific); Lipofectamine 3000 (L3000015; Thermo Fisher Scientific); Lipofectamine RNAiMAX (13778150; Thermo Fisher Scientific), Dynabeads Protein G (10003D; Thermo Fisher Scientific, 50 μl/ml for IP), and Saponin (S4521; Sigma-Aldrich). DMEM and Penicillin–Streptomycin (1,000 U/ml) solution were from Gibco, and OptiMEM and EBSS media from Life Technologies. siRNAs were from Horizon Discovery Biosciences Limited, Dharmacon: IQGAP1 siRNA pool (cat#M-004694-02-000), IQGAP1-siRNA1 5′-GAACGUGGCUUAUGAGUAC-3′ (D-004694-03), IQGAP1-siRNA2 5′-GGAAAGCUCUGGCAAUUUA-3′ (D-004694-01; Dharmacon), CHMP2A siRNA pool (cat#_020247-00-005), ATG9A siRNA pool (cat#M-014294-02-0005).
Cell culture
Cells were grown in DMEM supplemented with 10% fetal bovine serum and antibiotics; for starvation-induced autophagy, cells were washed three times in PBS and incubated for 90 min in EBSS. For CCCP treatment, cells were incubated with 20 μM CCCP in full medium for 6 h.
Cell lines
HEK293T cells were from the American Type Culture Collection, Huh7 cells were from Rocky Mountain Laboratory. ATG9AKO (referred herein as HeLaATG9AKO) HeLa and parental cells (referred herein as ATG9AWT) were from Dr. Chen Quan (Zhou et al., 2017). HeLa HT-LC3B cells used in MIL/MPL studies were described previously (Javed et al., 2023). ATG9A CRISPR knockouts in Huh7 were previously generated (Kumar et al., 2018, 2021). Huh7WT HT-LC3B cell line was generated by transduction of Huh7 with HaloTag/hMAP1LC3B-lentivirus particles (custom-made; Vectorbuilder, Inc.), and after 48 h of infection, cells were incubated with puromycin (2 μg/ml) for 1 wk to select and identify the HT-LC3B expressing stable clones (Huh7 HT-LC3B cells). Huh7ATG9AKO HT-LC3B cells were generated by knocking out ATG9A in Huh7 HT-LC3B cells using the CRISPR–Cas9 system by transduction with ATG9A CRISPR-Cas9 gRNAs (5′-CATGTGCTGGTCCGGGATAA-3′), and selection was carried out with hygromycin (due to puromycin resistance conferred during generation of the parental HT-LC3B stable cell line) following a previously published CRISPR protocol with modifications (Kumar et al., 2021). FLAG-APEX2-ATG9A Flp-In T-REx HEK293 (TetON) cell line was described previously (Claude-Taupin et al., 2021).
Plasmids, ATG9A mutants, and transfection
Plasmids used in this study for immunoprecipitation and complementation were expression constructs with pDest-3xFLAG-ATG9A (Claude-Taupin et al., 2021), GFP-IQGAP1 (Claude-Taupin et al., 2021), and GFP-FIP200 (Kumar et al., 2021). For mutant versions CD1 and CD2 of ATG9A, point mutations primers were made by using the Agilent Quick Change primer design tool in the previously described pDest-3xFLAG-ATG9A construct (Claude-Taupin et al., 2021) to generate pDest-3xFLAG-ATG9ACD1 and pDest-3xFLAG-ATG9ACD2 expression constructs. pDest-GFP-ATG9A and pDest-3xFLAG-ATG9AM33 were previously described (Claude-Taupin et al., 2021). IQGAP1 individual siRNA-resistant constructs were generated by making synonymous codon mutations in the pDONR-IQGAP1 plasmid (DNASU: HsCD00860306). pDest-3xFLAG-IQGAP1Res1 resistant against IQGAP1-siRNA1 was mutated to 5′-AAATGTTGCATACGAATAT-3′, and pDest-3xFLAG-IQGAP1Res2 resistant against IQGAP1-siRNA2 was mutated to 5′-GGAGAGTTCCGGTAACTTG-3′.
Immunoblotting and co-immunoprecipitation assays
For immunoblotting, cells were harvested and lysed in NP-40 buffer supplemented with protease inhibitor cocktail (cat# 11697498001; Roche) and 1 mM phenylmethylsulfonyl fluoride (cat# 93482; Sigma-Aldrich) for 30 min on ice. Supernatants were collected. Protein concentrations were determined using Pierce BCA Protein Assay Kit (#23225). Protein samples were boiled at 95°C in 1X Laemmli sample buffer (Bio-Rad). Protein separation by gel electrophoresis was carried out using TGX SDS Gels (#4561091; Bio-Rad), followed by blotting to a nitrocellulose membrane (#1620112; Bio-Rad). Membranes were incubated with 2–3 μg of primary antibodies diluted in blocking buffer (1XPBS, 3% BSA, 0.1% Tween-20) overnight at 4°C. After overnight incubation in primary antibodies, the membrane was washed three times in PBST (1X PBS, 0.1% Tween-20) and incubated with fluorescently labeled secondary antibodies (goat-anti-mouse IRDye 680LT or goat-anti-rabbit IRDye 800CW; LI-COR Biosciences) diluted 1:10,000 in blocking buffer. Membranes were visualized and analyzed using ImageLab v.6.0.0. For co-immunoprecipitation (Co-IP), 10-cm dish cells were either non-transfected (for endogenous proteins) or transfected with 10–12 µg of plasmids and lysed in NP-40 buffer containing protease inhibitor cocktail and incubated with 2–3 μg of primary antibodies at 4°C overnight. The immune complexes were captured with Dynabeads (Thermo Fisher Scientific). Dynabeads were washed three times with PBS and bound proteins were eluted with 2X Laemmli sample buffer (Bio-Rad) before being subjected to immunoblot analysis. Immunoblotting images were visualized in BioRad ChemiDoc Imaging System #12003153 and quantified using ImageLab software v.6.0.0. Normalization was relative to actin for immunoblots, whereas for co-Ips, normalization was by using equal amounts of protein in co-IPs and ratioing the intensity of the band corresponding to the co-IPed protein to the intensity of the band of the immunoprecipitated protein as indicated on Y-axes in graphs.
High content microscopy
High-content microscopy assay was performed as described previously (Javed et al., 2023). Briefly, cells were plated in 96-well plates, transfected with plasmids whenever required (as indicated in figure legends). Cells were stimulated for autophagy by incubating in EBSS, followed by processing either for MIL/MPL HCM assay or for conventional IF with antibodies. For conventional IF (not intermixed with MIL/MPL), cells were fixed with 4% paraformaldehyde (PFA; Sigma-Aldrich) for 5 min. Cells were permeabilized with 0.1 % saponin and blocked in 3% BSA for 30 min followed by incubation with primary antibody followed with secondary antibody for 1 h. Hoechst 33342 (1:1,000, H3570; Thermo Fisher Scientific) was used to stain nuclei for 10 min at room temperature. HCM with automated image acquisition and quantification was carried out in 96-well plates using a Cellomics HCS scanner equipped with iDEV software (Thermo Fisher Scientific) or Cellinsight CX7 HCA Reader with HCS StudioTM Cell Analysis Software and STORE Express Image and Database Software (Thermo Fisher Scientific).
MIL/MPL HCM closure assay
HaloTag-LC3B stable cell lines were seeded in 96-well plates at a density of 6–8,000 cells/well. After 18–24 h, the cells were starved in EBSS for autophagy induction for 90 min or treated with 20 µM CCCP for 6 h. Following induction, cells were treated with MIL (Alexa Fluor-660 663Ex/690Em, 1 µM, G8471; Promega) prepared in 1x MAS buffer (220 mM mannitol, 70 mM sucrose, 10 mM KH2PO4, 5 mM MgCl2, 2 mM HEPES, 1 mM EGTA; from Sigma-Aldrich) containing XF-PMP (102504-100; Agilent, 2 nM for Huh7, and 4 nM for HeLa) at 37°C for 15 min. Subsequently, cells were washed twice with 1x PBS and fixed with 4% paraformaldehyde in PBS for 5 min at room temperature. After another two washes with 1x PBS, cells were incubated with Membrane-Permeant Ligand (MPL: TMR 5 µM, 555Ex/585Em, G8251; Agilent) for 30 min at room temperature. Following one wash with 1x PBS, cells were stained with Hoechst 33342 (1:1,000, H3570; Thermo Fisher Scientific) for 10 min at room temperature. Finally, cells were washed twice and the plate was scanned using High Content Microscopy (HCM) for automated image acquisition and quantification using iDEV software (Thermo Fisher Scientific) in 96-well plates (Javed et al., 2023). For transfection/complementation assays, cells were stained with anti-FLAG antibodies to identify transfectants for gating. This was accomplished by modifying the standard MIL/MPL as follows: cells were first fixed, MIL was added with permeabilization reagent XF-PMP, washed, then stained with MPL, washed, and stained with primary anti-FLAG antibody followed by anti-FLAG secondary antibody (goat anti-mouse Alexa fluor 405, cat#35501BID). After that, the cells were subjected to HCM analysis in Cellinsight CX7 HCA Reader and HCS StudioTM Cell Analysis Software.
TMRHT release assay
For TMRHT release, Huh7 HT-LC3B cells were seeded in 60-mm dishes and next day transfected with control scrambled or IQGAP1 siRNAs (60 pmol siRNA). After 48 h, cells were stained with or without TMR 2.5 µM (Membrane Impermeant HaloTag ligand, 555Ex/585Em) at 37°C for 20–30 min. After incubation, cells were washed with 1x PBS twice and cells were starved for autophagy induction in EBSS for 90 min. Cells were harvested and lysed with NP-40 lysis buffer containing protease inhibitor cocktail and whole cell lysate was cleared by centrifugation at 12,000 RPM for 15 min in a refrigerated centrifuge. Whole-cell lysates were boiled with 1x sample buffer at 95°C and loaded on SDS page gel. TMR in-gel fluorescence for free TMRHT was imaged in BioRed ChemiDoc Imaging System #12003153 using an AF560 filter (Excitation at 556 nm Emission at 615 nm) and quantified by ImageLab software. Immunoblots were developed using mouse anti-HaloTag antibody, and secondary antibody IRDye 680 (IRDye 680RD from Licor has an excitation peak at 680 nm and an emission peak at 694 nm allowing separation from TMRHT fluorescence). TMRHT bands were imaged in BioRad ChemiDoc Imaging System #12003153 and quantified by ImageLab software.
Ultrastructural analyses
For conventional transmission electron microscopy (TEM), cells were fixed using a volume equal to the culture medium of the double-strength fixative (4% paraformaldehyde, 5% glutaraldehyde in 0.1 M sodium cacodylate buffer, pH 7.4) for 20 min at room temperature in a 25-cm flask. The fixative was removed and replaced by 5 ml of single-strength fixative (2% paraformaldehyde and 2.5% glutaraldehyde in 0.1 M sodium cacodylate buffer, pH 7.4) for 2 h at RT to further fix the cells. After five washes with 0.1 M sodium cacodylate buffer (pH 7.4), cells were scraped and embedded as previously described (Verheije et al., 2008). During the first step of dehydration, 0.5% uranyl acetate was added to the 70% ethanol solution and cells were incubated overnight at RT. After embedding and polymerization in epoxy resin, 70-nm ultrathin sections were cut using a Leica EM UC7 ultramicrotome (Leica Microsystems) and stained with lead citrate as previously described (Verheije et al., 2008). Cell sections were analyzed using a 120-kV transmission electron microscope Jeol-1400 equipped with a digital camera. For statistical analysis, the average number of autophagosomes and phagophores per cell section was obtained by examining randomly selected cell profiles in sections derived from three different grids per sample. The counted structures were categorized as follows: autophagosomes were defined as circular structures limited by a double membrane and mostly containing cytoplasmic material, while phagophores were defined as elongated, extremely electron-dense membrane surrounding either cytoplasmic material or defined organelles such as mitochondria. The number of autophagosomes and phagophores per cell section was determined by counting 60 cell profiles per condition.
SolVit—in vitro closure assay
SolVit (sealing of organellar limiting membranes in vitro) was developed for the HCM platform with modification from the previously described assay for in vitro fusion (Kumar et al., 2021; Matsui et al., 2018; Moreau et al., 2011) and membrane sealing (Javed et al., 2023). For SolVit, HuhATG9AKO HT-LC3B, Huh7WT, and HuhATG9AKO cells were seeded in a 10-cm dish at a density of 8–10 × 105 cells/plate and incubated for 18–24 h. The next day cells were incubated with EBSS for 90 min to induce autophagy. Cells were harvested and homogenized with B1 buffer (20 mM Hepes-KOH, pH 7.2, 400 mM sucrose, and 1 mM EDTA). Homogenates were centrifuged at 12,000 g for 15 min at 4°C, and post nuclear supernatant (PNS) containing Huh7WT or HuhATG9AKO (Donors) and HuhATG9AKO HT-LC3B (Acceptor) membranes were mixed for 60 min in the presence or absence of ATP and ATP regenerative system at 37°C. Control samples were left on ice. After incubation, the samples were stained with MIL for 15 min at 37°C. Samples were fixed with 2% paraformaldehyde in PBS for 15 min and stained with MPL for 30 min. Samples were centrifuged at 43,000 g for 1 h at 4°C. The supernatants were discarded and pellets were resuspended in 100 μl of mounting media+ 100 μl B1 buffer and dispensed in 96-well plates (40 μl/well, at least five wells per sample). The plates were centrifuged at 500 g for 3 min to allow the settling down of the membranes to the bottom of the plate. The plates were scanned in Cell Insight CX7 LZR High-Content Screening (HCS) Platform (Thermo Fisher Scientific). A minimum of 10,000 objects were scanned per well and five wells were used for analysis.
Protease protection assay
The previously published protocol was followed (Javed et al., 2023) with modifications. Huh7WT cells were seeded into 10-cm dishes and cells were knocked down for IQGAP1, and after 48 h of siRNA transfection, cells were induced for autophagy with EBSS for 90 min in the presence of 100 nM BafA1. After autophagy induction, cells were homogenized in a homogenization buffer containing 1 M HEPES-KOH (pH 7.5), 4 g of D-mannitol, 2.4 g of sucrose, and then diluted with 100 ml distilled water. Homogenates were centrifuged at 500 g at 4°C, the post-nuclear supernatant was collected and was equally divided into three parts, one of the samples was left untreated, and the other two were incubated with 25 µg/ml Proteinase K in the presence or absence of Triton X-100 (TX-100; 0.5%) for 30 min on ice. All samples were then subjected to TCA precipitation for 30 min, and protein pellets were resuspended in the 50 μl of 2× sample buffer. 40–60 µg of each sample was analyzed by immunoblotting.
APEX2-labeling and streptavidin enrichment for LC-MS/MS analysis
Proximity biotinylation LC-MS/MS was as previously described (Claude-Taupin et al., 2021). HEK293TAPEX2-ATG9A cells were incubated in 500 µM biotin-phenol (AdipoGen) in media. A 1-min pulse with 1 mM H2O2 at room temperature was carried out and stopped with quenching buffer (10 mM sodium ascorbate, 10 mM sodium azide, and 5 mM Trolox in PBS). All samples were washed twice with quenching buffer and twice with PBS.
For LC-MS/MS analysis, cell pellets were lysed in 500 μl ice-cold lysis buffer (6 M urea, 0.3 M NaCl, 1 mM EDTA, 1 mM EGTA, 10 mM sodium ascorbate, 10 mM sodium azide, 5 mM Trolox, 1% glycerol, and 25 mm Tris-HCl, pH 7.5) for 30 min by gentle pipetting. Lysates were clarified by centrifugation and protein concentrations were determined using Pierce 660 nm protein assay reagent. Streptavidin-coated magnetic beads (Pierce) were washed with lysis buffer. 1 mg of each sample was mixed with 100 μl of streptavidin beads. The suspensions were gently rotated at 4°C overnight to bind biotinylated proteins. The flow-through after enrichment was removed and the beads were washed in sequence with 1 ml IP buffer (150 mM NaCl, 10 mM Tris-HCl, pH 8.0, 1 mM EDTA, 1 mM EGTA, and 1% Triton X-100) twice; 1 ml 1 M KCl; 1 ml of 50 mM Na2CO3; 1 ml 2 M urea in 20 mM Tris HCl, pH 8.0; and 1 ml IP buffer. Biotinylated proteins were eluted, 10% of the sample was processed for immunoblotting, and 90% of the sample was processed for mass spectrometry.
LC-MS/MS
Digested peptides were analyzed by LC-MS/MS on a Thermo Fisher Scientific Q Exactive Plus Orbitrap Mass spectrometer in conjunction Proxeon Easy-nLC II HPLC (Thermo Fisher Scientific) and Proxeon nanospray source. The digested peptides were loaded on a 100 μm × 25 mm Magic C18 100 Å 5U reverse phase trap where they were desalted online before being separated using a 75 μm × 150 mm Magic C18 200 Å 3U reverse phase column. Peptides were eluted using a 140 min gradient with a flow rate of 300 nl/min. An MS survey scan was obtained for the m/z range 350–1,600, MS/MS spectra were acquired using a top 15 method, where the top 15 ions in the MS spectra were subjected to HCD (High Energy Collisional Dissociation). An isolation mass window of 1.6 m/z was for the precursor ion selection and normalized collision energy of 27% was used for fragmentation. A 15-s duration was used for the dynamic exclusion.
Proteomic profiling was carried out as described (Claude-Taupin et al., 2021) using a DIA scaffold (v.Scaffold_4.9.0; Proteome Software). Peptide identifications were >98.0% probability based on the scaffold false discovery rate (FDR). Showed proteins were represented at least by two unique peptide.
AlphaFold-Multimer structural predictions
Structural predictions were made with the ColabFold implementation of AlphaFold-Multimer, which uses MMseq2 to generate multiple sequence alignments. The Uniprot database was used to obtain protein sequences for AlphaFold-Multimer inputs: ATG9A (Uniprot ID: Q7Z3C6), IQGAP1 (Uniprot ID: P46940). Modeling of the C terminal domain of ATG9A (amino acids 495–839) interaction with IQGAP1 was performed by fragmenting the sequence of IQGAP1 and running predictions with the ATG9A C terminal domain and each individual IQGAP1 fragment. The following fragments of IQGAP1 were used in predictions: 1–190, 159–710, 679–860, 796–1,237, 956–1,274, 1,025–1,583, 1,276–1,657, 876–1,657, and 1–712. Predictions were run using the Google Colaboratory notebook implementation of ColabFold (version 1.5.2) with the following parameters: templates used, 24 recycles, default MSA settings, model type: alphafold2_multimer_v3. For fragment 1–712, initial modeling was performed using the above settings followed by an additional run with 48 instead of 24 recycles to improve model quality. Predictions run on NVIDIA A100 GPU as allocated by Google Colaboratory. All structures were visualized and analyzed in ChimeraX.
Mice
Atg9afl/fl LysM-Cre- and Atg9fl/fl LysM-Cre+ mice were generated by crossing Atg9fl/fl mice (Yamaguchi et al., 2018) with LysM-Cre+ mice as previously described (Claude-Taupin et al., 2021). Experimental comparison groups consisted of littermates from Atg9fl/fl crosses with Atg9afl/fl LysM-Cre+/− to avoid metagenomic effects (Stappenbeck and Virgin, 2016). All mice were in the C57BL/6J mice background ensured by >10 backcross rounds in source lineages leading up to Atg9fl/fl crosses with Atg9afl/fl LysM-Cre+/− mice.
Murine model of tuberculosis
M. tuberculosis Erdman (Manzanillo et al., 2012) was cultured as previously described (Chauhan et al., 2015) in Middlebrook 7H9 broth supplemented with 0.05% Tween 80, 0.2% glycerol, albumin, dextrose, and catalase (ADCBD Biosciences) and 10% oleic acid (For Erdman; OADCBD Biosciences) at 37°C and homogenized to generate single-cell suspension for frozen stock aliquots titrated for viable CFUs. These stocks were thawed and diluted in the aerosol vehicle for mouse infection studies (Jia et al., 2020). For acute (short-term) or chronic (long term) infection, mice were exposed to high- or low-dose M. tuberculosis Erdman aerosols using a GlasCol apparatus for aerosol delivery as previously described, and survival was monitored for indicated times after infection. Initial lung deposition was determined within a day following aerosol exposure by homogenizing lungs from designated mice coinfected in GlasCol chamber along with the experimental group mice and plating serial dilutions of lung homogenates on Middlebrook 7H11 plates, and M. tuberculosis colonies were visualized and counted several weeks after plating. All M. tuberculosis culture preparations were carried out in a biosafety-certified BSL3 laboratory and all murine aerosol infection and follow-up monitoring were carried out in a biohazard-certified ABLS3/animal BSL3 suite by BSL3/ABSL3 approved personnel in a monitored and a third party supervised environment.
Statistical analysis
Statistical analysis was performed using GraphPad Prism 10. For HCM, the typical sample size was n = 3–6 (biological replicates each on different plates). Technical replicates for HCM were typically 4–6 wells per condition. For HCM, the sample size was based on a historic power analysis from prior studies (Javed et al., 2023), assuming large effect size (differences and variability/standard deviation from published studies), power 80%, β 20%, and α 5%, favoring type II errors (false negative) over type I errors (false positive). Data distribution was assumed to be normal but this was not formally tested. Band intensity in immunoblots, n = 3–5 (independent biological replicates); no power analysis was performed. Data: means ± SD (n ≥ 3). ANOVA and post hoc tests (two-tailed) were used as specified in figure legends.
Inclusion and ethics
All institutional inclusion and ethics policies were followed.
Online supplemental material
There are five supplemental figures and one supplementary dataset: Fig. S1 shows IQGAP1 contribution to autophagosome closure via CHMP2A; Fig. S2 shows localization analysis of IQGAP1, CHMP2A, and ATG9A and the effects of their depletion on autophagosome closure; Fig. S3 shows transmission electron microscopy analysis of HeLa cell knocked out for ATG9A or knocked down for CHMP2A and IQGAP1; Fig. S4 shows additional types of profiles in electron micrographs from ultrastructural analyses; Fig. S5 shows AlphaFold-Multimer modeling of potential IQGAP1-ATG9A interacting sites. Data S1 shows an Excel sheet exported from DIA scaffold (v.Scaffold_4.9.0; Proteome Software) showing proteomic profiling of proximity biotinylation data (LC-MS/MS) from HEK293T FlpIn-FLAG-APEX2-ATG9A cells subjected to starvation in EBSS (Tab 1) or treated with CCCP (Tab 2).
Data availability
The raw data corresponding to Table S1 are available within the entry MSV000084519 deposited in the MassIVE proteomics repository. Scaffold proteomic analysis corresponding to Table S1 is within the entry PXD016084 in Proteome Exchange. Other data are available from the corresponding author upon reasonable request.
Acknowledgments
We thank Ryan Peters for outstanding technical help with mouse studies. We thank Yingying Cong for help with electron microscopy experiments.
F. Reggiori is supported by SNSF Sinergia (CRSII5_189952), Novo Nordisk Foundation (0066384), and Lundbeck Foundation (R383-2022-180) grants. This work was supported by National Institutes of Health grants R37AI042999 and R01AI111935 and a center grant P20GM121176 to V. Deretic.
Author contributions: R. Javed: Conceptualization, Formal analysis, Investigation, Methodology, Validation, Visualization, Writing - original draft, Writing - review & editing, M. Mari: Formal analysis, Investigation, E. Trosdal: Conceptualization, Data curation, Formal analysis, Investigation, Visualization, Writing - review & editing, T. Duque: Formal analysis, M.A. Paddar: Investigation, Validation, L. Allers: Data curation, Software, Visualization, M.H. Mudd: Investigation, Resources, A. Claude-Taupin: Conceptualization, Methodology, P.R. Akepati: Investigation, Validation, Visualization, E. Hendrix: Formal analysis, Investigation, Y. He: Formal analysis, Investigation, Methodology, Resources, Software, M. Salemi: Formal analysis, B. Phinney: Data curation, Project administration, Resources, Software, Yasuo Uchiyama: Resources, F. Reggiori: Conceptualization, Funding acquisition, Writing - review & editing, V. Deretic: Conceptualization, Data curation, Formal analysis, Funding acquisition, Investigation, Methodology, Project administration, Resources, Supervision, Validation, Visualization, Writing - original draft, Writing - review & editing.
References
V. Deretic is a lead author.


