


Senataxin is an evolutionarily conserved RNA-DNA helicase involved in DNA repair and transcription termination that is associated with human neurodegenerative disorders. Here, we investigated whether Senataxin loss affects protein homeostasis based on previous work showing R-loop-driven accumulation of DNA damage and protein aggregates in human cells. We find that Senataxin loss results in the accumulation of insoluble proteins, including many factors known to be prone to aggregation in neurodegenerative disorders. These aggregates are located primarily in the nucleolus and are promoted by upregulation of non-coding RNAs expressed from the intergenic spacer region of ribosomal DNA. We also map sites of R-loop accumulation in human cells lacking Senataxin and find higher RNA-DNA hybrids within the ribosomal DNA, peri-centromeric regions, and other intergenic sites but not at annotated protein-coding genes. These findings indicate that Senataxin loss affects the solubility of the proteome through the regulation of transcription-dependent lesions in the nucleus and the nucleolus.
Introduction
Senataxin (SETX) is the human homolog of the yeast superfamily I RNA-DNA helicase splicing endonuclease (SEN1) (DeMarini et al., 1992; Ursic et al., 1997; Winey and Culbertson, 1988). Loss of SEN1 or its catalytic activity in budding yeast results in transient R-loop accumulation and transcription-associated genome instability (Chan et al., 2014; Mischo et al., 2011), consistent with current models, suggesting that unresolved RNA-DNA hybrids in the genome have negative effects on genome integrity (Gaillard and Aguilera, 2016). In Saccharomyces cerevisiae, Sen1 associates with the replication forks and contributes to the resolution of transcription-replication conflicts during S phase through its helicase activity (Alzu et al., 2012; Appanah et al., 2020). Sen1 has also been reported to work with RNA-binding proteins Nrd1 and Nab3 to promote transcription termination of non-coding RNAs as well as some polyadenylated RNA polymerase II transcripts (Creamer et al., 2011; Jamonnak et al., 2011) and helps to remove RNA polymerase from DNA during termination (Porrua and Libri, 2013). In vitro, the helicase domain of Sen1 has been shown to unwind both DNA and RNA duplexes as well as RNA-DNA hybrids (Leonaitė et al., 2017; Martin-Tumasz and Brow, 2015).
The highly conserved helicase domain shared between SETX and Sen1 suggests that the proteins may have similar properties (Martin-Tumasz and Brow, 2015). Indeed, SETX in mammalian cells has been implicated in the resolution of R-loops, transcription termination, RNA splicing, and DNA repair (Becherel et al., 2015; Cohen et al., 2018; Hatchi et al., 2015; Skourti-Stathaki et al., 2011). In humans, mutations in the SETX gene cause Ataxia with Oculomotor Apraxia type 2 (AOA2), an autosomal recessive cerebellar ataxia characterized by progressive early-onset cerebellar ataxia, oculomotor apraxia, and peripheral neuropathy (Moreira et al., 2004). A dominant form of Amyotrophic Lateral Sclerosis (ALS4), associated with progressive degeneration of motor neurons in the brain and spinal cord, also results from SETX mutations (Chen et al., 2004), but these are reported to be gain-of-function alleles for RNA-DNA hybrid removal (Grunseich et al., 2018). SETX mutant cell lines derived from AOA2 patients are hypersensitive to DNA-damaging agents, particularly those that introduce DNA damage such as hydrogen peroxide and mitomycin C, consistent with the idea that SETX plays a vital role in maintaining genome integrity during genotoxic stress (Airoldi et al., 2010; Suraweera et al., 2007). Changes in chromosome stability and DNA repair efficiency in the absence of exogenous damage have also been observed in SETX-deficient cells and AOA2 patient-derived cell lines (Becherel et al., 2013; Groh et al., 2017; Kanagaraj et al., 2022; Suraweera et al., 2007). These findings indicate that SETX functions are required for genome maintenance in unstressed conditions.
Previous studies have shown that fibroblasts or neural progenitors derived from AOA2 and ALS4 patients exhibit changes in gene expression (Becherel et al., 2015; Fogel et al., 2014; Grunseich et al., 2018; Kanagaraj et al., 2022; Suraweera et al., 2009). Some of the genes affected by SETX loss are involved in neurogenesis, signal transduction, and synaptic transmission, which might explain the observed neurological phenotype of these patients. The relationship between the transcriptional alterations in SETX-deficient cells and roles of SETX in DNA repair is not well understood, however, and it is not known whether changes in R-loop levels lead directly to changes in RNA transcript levels.
R-loop-associated neurodegeneration pathology is not unique to AOA2 and ALS4. R-loops have also been linked to nucleotide expansion disorders that cause the neurodegenerative diseases ALS and frontotemporal dementia (Haeusler et al., 2014). Friedreich ataxia and Fragile X syndrome, both associated with trinucleotide repeat expansions, were reported to be associated with R-loops forming on expanded repeats within endogenous FXN and FMR1 genes, respectively (Groh et al., 2014). We have also observed R-loop accumulation in the absence of Ataxia-telangiectasia Mutated (ATM), a protein kinase that regulates the DNA damage response and oxidative stress signaling (Lee and Paull, 2021). Loss of ATM causes the autosomal recessive disorder ataxia-telangiectasia (A-T), characterized by childhood-onset cerebellar neurodegeneration (Rothblum-Oviatt et al., 2016).
Current models for the most common neurodegenerative diseases in the human population suggest that proteotoxic stress is the driving force in the pathology (Höhn et al., 2020). In this paradigm, protein aggregates—the insoluble forms of misfolded proteins—are considered to be the hallmark of neurodegenerative disease (Koopman et al., 2022). This view originates from the identification of misfolded protein intermediates generated by disease-linked alleles, the observation that loss of normal proteostasis accompanies the pathology, and that, in at least some model systems, the removal of the misfolded protein species can block progression toward neurodegeneration (Kurtishi et al., 2019; Selkoe and Hardy, 2016; Sweeney et al., 2017). It is difficult to reconcile this protein-centric view of neurodegeneration with observations that the accumulation of unrepaired DNA lesions can also strongly predispose individuals to neurodegeneration and age-associated pathology (Caldecott, 2022; Maynard et al., 2015; Schumacher et al., 2021). However, in previous work, we investigated human tumor cell lines and post-mitotic neuron-like cells after depletion or inhibition of ATM and found not only DNA damage but also the accumulation of detergent-resistant aggregates that were dependent on poly(ADP-ribose) polymerase (PARP) activation at sites of single-strand DNA breaks (Lee et al., 2021). The appearance of these aggregates was inhibited by overexpression of SETX, suggesting that R-loops are involved in their generation. Since SETX mutations underlie AOA2 and ALS4, we hypothesize that SETX deficiency might also cause protein aggregation and loss of protein homeostasis in a manner similar to loss of ATM.
Here, we investigated this question by quantifying protein aggregates in SETX-deficient human cells, finding that loss of this conserved helicase does in fact generate potentially toxic, misfolded protein species. Surprisingly, we find that the formation of these aggregates is not dependent on PARP but rather on non-coding RNA generated from the nucleolus in response to transcriptional stress in the absence of SETX.
Results
SETX deficiency increases protein aggregation in human cells
Based on our previous findings with ATM (Lee et al., 2021), we hypothesized that SETX may play a general role in preventing loss of protein homeostasis through its activity as an inhibitor of R-loop formation. This idea is also consistent with the fact that mutations in SETX are associated with the AOA2 and ALS4 disorders and that one of the central hallmarks of ALS as well as many other neurodegenerative disorders is the formation of insoluble protein aggregates (Kurtishi et al., 2019; Mulligan and Chakrabartty, 2013; Van Damme et al., 2017). To test this hypothesis, we depleted SETX from human U2OS cells using shRNA (Fig. 1 A) and used a red fluorescent molecular rotor dye (Proteostat) that has been shown to increase fluorescent yield significantly when bound to aggregated proteins (Shen et al., 2011). The Proteostat signal yield per cell was measured by fluorescence-activated cell sorting (FACS), with ∼10,000 cells monitored per measurement (three biological replicates shown here). The SETX-depleted cells exhibit a significantly higher level of Proteostat signal compared to shRNA control cells, although not as high as the positive control treatment with the proteasome inhibitor MG132 (Fig. 1 B).
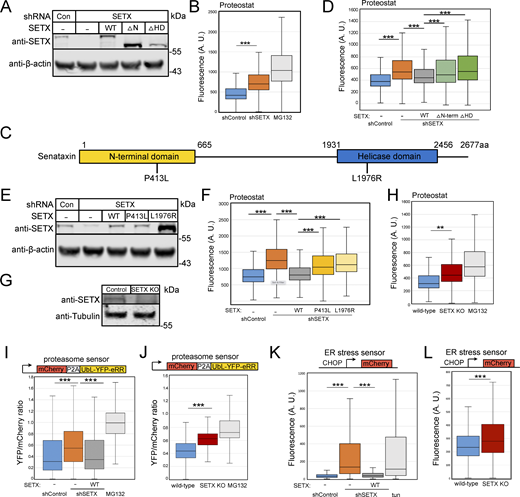
Protein aggregation is increased in human cells with SETX deficiency. (A) Protein levels of SETX in human U2OS cells with depletion of endogenous SETX and expression of recombinant wild-type (WT), without N-terminal domain (∆N-term, 1 a.a.–665 a.a.) or without helicase domain (∆HD, 1931 a.a.–2456 a.a.) by Western blotting with anti-SETX antibody; β-actin monitored for normalization. (B) Flow cytometric analysis of protein aggregates in U2OS cells with control or SETX shRNA using Proteostat (Enzo). Proteasome inhibitor MG132 (10 μM) treated cells were employed as positive control. At least 10,000 cells were measured in each replicate; three replicates are shown with box plot, the center line indicates the median, the box bounds indicate the first and third quartiles. (C) Schematic diagram of SETX showing known features, including N-terminal protein interaction domain (yellow) and helicase domain (blue). P413L and L1976R are reported SETX mutations causing AOA2 disease. (D) Proteostat intensities per cell were quantified by FACS in U2OS cells as in B with SETX shRNA and expression of recombinant SETX WT, ∆N-term, or ∆HD as indicated. (E) Levels of SETX in U2OS cells with SETX shRNA and expression of recombinant WT, P413L or L1976R alleles by Western blotting; β-actin monitored for normalization. (F) Proteostat intensities as in B from U2OS cells with SETX depletion and expression of recombinant SETX WT, P413L, or L1976R as indicated. (G) Levels of SETX in control and SETX knock-out (KO) U2OS cells by Western blotting; Tubulin serving as an internal control. (H) Proteostat intensities as in B from wild-type or SETX KO U2OS cells compared to wild-type cells with MG132 (10 μM) treatment. (I) Degradation of a UbL-YFP-eRR model proteasome substrate was measured relative to an mCherry expression control. Ratio of YFP fluorescence per cell normalized by mCherry signal as measured in at least 10,000 cells per condition. YFP/mCherry fluorescence ratios per cell were quantified by FACS in U2OS cells with control or SETX shRNA and expression of recombinant SETX WT, or MG132 (10 μM) as indicated. (J) Proteasome activity was measured as in I, comparing wild-type and SETX KO cells to MG132 (10 μM)-treated cells. (K) Activation of the unfolded protein response and ER stress was measured with a CHOP-mCherry reporter (Oh et al., 2012) by FACS with at least 10,000 cells per condition. mCherry fluorescence levels per cell were quantified by FACS in U2OS cells with control or SETX shRNA and expression of recombinant SETX WT, or tunicamycin (1 μg/ml) as indicated. (L) ER stress in U2OS wild-type and SETX KO cells as in WT and SETX KO data also shown in Fig. S8. All P values are derived using a two-tailed t test assuming unequal variance, using the mean of the fluorescence values from three biological replicates (n = 3). ** indicates P < 0.005, *** indicates P < 0.0005. Box plots show all measurements from all three replicates. Source data are available for this figure: SourceData F1.
Protein aggregation is increased in human cells with SETX deficiency. (A) Protein levels of SETX in human U2OS cells with depletion of endogenous SETX and expression of recombinant wild-type (WT), without N-terminal domain (∆N-term, 1 a.a.–665 a.a.) or without helicase domain (∆HD, 1931 a.a.–2456 a.a.) by Western blotting with anti-SETX antibody; β-actin monitored for normalization. (B) Flow cytometric analysis of protein aggregates in U2OS cells with control or SETX shRNA using Proteostat (Enzo). Proteasome inhibitor MG132 (10 μM) treated cells were employed as positive control. At least 10,000 cells were measured in each replicate; three replicates are shown with box plot, the center line indicates the median, the box bounds indicate the first and third quartiles. (C) Schematic diagram of SETX showing known features, including N-terminal protein interaction domain (yellow) and helicase domain (blue). P413L and L1976R are reported SETX mutations causing AOA2 disease. (D) Proteostat intensities per cell were quantified by FACS in U2OS cells as in B with SETX shRNA and expression of recombinant SETX WT, ∆N-term, or ∆HD as indicated. (E) Levels of SETX in U2OS cells with SETX shRNA and expression of recombinant WT, P413L or L1976R alleles by Western blotting; β-actin monitored for normalization. (F) Proteostat intensities as in B from U2OS cells with SETX depletion and expression of recombinant SETX WT, P413L, or L1976R as indicated. (G) Levels of SETX in control and SETX knock-out (KO) U2OS cells by Western blotting; Tubulin serving as an internal control. (H) Proteostat intensities as in B from wild-type or SETX KO U2OS cells compared to wild-type cells with MG132 (10 μM) treatment. (I) Degradation of a UbL-YFP-eRR model proteasome substrate was measured relative to an mCherry expression control. Ratio of YFP fluorescence per cell normalized by mCherry signal as measured in at least 10,000 cells per condition. YFP/mCherry fluorescence ratios per cell were quantified by FACS in U2OS cells with control or SETX shRNA and expression of recombinant SETX WT, or MG132 (10 μM) as indicated. (J) Proteasome activity was measured as in I, comparing wild-type and SETX KO cells to MG132 (10 μM)-treated cells. (K) Activation of the unfolded protein response and ER stress was measured with a CHOP-mCherry reporter (Oh et al., 2012) by FACS with at least 10,000 cells per condition. mCherry fluorescence levels per cell were quantified by FACS in U2OS cells with control or SETX shRNA and expression of recombinant SETX WT, or tunicamycin (1 μg/ml) as indicated. (L) ER stress in U2OS wild-type and SETX KO cells as in WT and SETX KO data also shown in Fig. S8. All P values are derived using a two-tailed t test assuming unequal variance, using the mean of the fluorescence values from three biological replicates (n = 3). ** indicates P < 0.005, *** indicates P < 0.0005. Box plots show all measurements from all three replicates. Source data are available for this figure: SourceData F1.
SETX is a large protein containing a conserved superfamily I RNA-DNA helicase domain (HD) in the C-terminus and a putative N-terminal protein interaction domain (N-term) (Fig. 1 C). The majority of SETX mutations detected in AOA2 or ALS4 patients are either in the HD or N-term domains (LOVD3 database) (Fokkema et al., 2021), suggesting the importance of these two domains for SETX functions. To test these individually, we complemented the cells depleted of SETX with shRNA-resistant forms of wild-type (WT) SETX, or versions lacking either the N-term domain (∆N-term), or the helicase domain (∆HD) in human U2OS cells (Fig. 1 A). We found that the higher level of Proteostat signal observed with SETX loss was reduced by wild-type SETX but not fully suppressed by expression of the ∆N-term or ∆HD mutants (Fig. 1 D), indicating the importance of these domains for SETX function in blocking protein aggregation in cells. Finally, to test the effects of SETX reported disease mutations, endogenous SETX was depleted, and two AOA2 disease-associated mutants, P413L (Moreira et al., 2004) and L1976R (Duquette et al., 2005), were expressed in U2OS cells (Fig. 1 E). The L1976R mutant expressed at a much higher level than either the WT or P413L mutant, but neither mutant allele fully complemented the shRNA-depleted cells for reduction of Proteostat signal observed with endogenous SETX depletion (Fig. 1 F).
To examine the consequences of complete loss of SETX, we generated a CRISPR knock-out line in U2OS (Fig. 1 G). Proteostat measurements in the SETX knock-out (SETX KO) line also showed significant increases in fluorescence when compared to the wild-type line, consistent with the shRNA depletion experiments.
The accumulation of insoluble aggregates can have detrimental effects on the ubiquitin-proteasome system (Davidson and Pickering, 2023; Kandel et al., 2024). To measure proteasome capacity, we employed a live-cell sensor for proteasome function that includes a single open reading frame encoding a fluorescent protein for normalization (mCherry) and a ubiquitin-like protein fused to YFP (UbL-YFP-eRR) that is known to be degraded by the proteasome (Yu et al., 2016a, 2016b), separated by a P2A oligopeptide sequence. The SETX-depleted cells have a significantly higher level of the YFP proteasome substrate per cell relative to the mCherry control (Fig. 1 I), indicating a loss of proteasome capacity caused by loss of SETX. This deficiency is restored by expression of full-length SETX (Fig. 1 I) and is also observed in the SETX KO cell line (Fig. 1 J).
Activation of the unfolded protein response (UPR) is often observed in response to proteotoxic stress (Hetz et al., 2020). To quantitate this signaling response, we used a fluorescence-based reporter assay for expression of the C/EBP homologous protein (CHOP) promoter, a widely used test for endoplasmic reticulum stress and activation of the UPR (Oslowski and Urano, 2011). Quantification of fluorescence signal by FACS showed that loss of SETX generated significantly higher expression of the CHOP UPR reporter per cell and that this is suppressed by full-length SETX expression (Fig. 1 K). Tunicamycin (a glycosylation inhibitor that induces endoplasmic reticulum stress) was used as a positive control. The SETX KO cell line also increases fluorescence yield in this assay (Fig. 1 L). Taken together, these observations suggest that SETX loss generates proteotoxic stress that impairs multiple cellular systems related to protein quality control.
Based on these results, we hypothesized that specific proteins may be destabilized in SETX-deficient cells and that these could be accumulating in insoluble form. To test for this, we employed a procedure we previously used for the detection of detergent-resistant aggregates in human cells and tissues that involves several rounds of extensive sonication, solubilization, and centrifugation followed by Western blotting (Lee et al., 2018, 2021), originally modified from an assay used in yeast (Koplin et al., 2010). Increased aggregates, including proteasome components PSMD2, PSMD8, and ALS-linked cellular aggregate TDP-43, were observed in SETX-deficient cells by Western blotting (Fig. 2 A, quantification in Fig. 2 B), consistent with the results obtained with the Proteostat reagent. The TDP-43 protein is one of the primary factors reported to accumulate in insoluble form in the brain and spinal cord tissues of ALS patients (Suk and Rousseaux, 2020). TDP-43 undergoes caspase-dependent proteolytic cleavage to generate ∼35 and ∼25 kDa C-terminal fragments even in unstressed cells, and these truncated proteins are more prone to aggregation (Gao et al., 2018; Zhang et al., 2007). Our results show significantly higher levels of TDP-43 truncated fragment (∼35 kDa; TDP-35) as well as the full-length TDP-43 protein in the aggregate fraction of SETX-depleted cells compared to wild-type cells (Fig. 2, A and B).
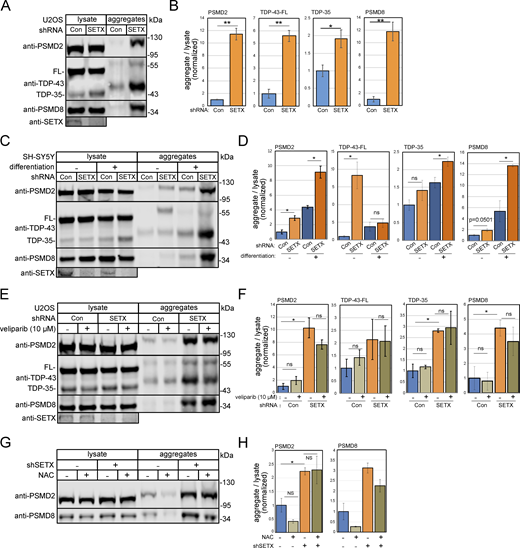
Insoluble protein aggregates accumulate in the absence of SETX. (A) Detergent-resistant aggregates were isolated in U2OS cells with SETX shRNA-mediated depletion or mock treatment as previously described (Lee et al., 2021). Whole lysates and detergent-resistant aggregates were isolated and analyzed by Western blotting for PSMD2, TDP-43, and PSMD8. (B) Quantification of PSMD2, full-length TDP-43 (FL), truncated TDP-43 (TDP35), and PSMD8 abundance in aggregate fractions normalized by lysate levels from three independent experiments, normalized to levels in control cells. (C) SH-SY5Y cells with control or SETX shRNA were induced or not induced to differentiate as indicated. Western blotting was performed to measure the levels of PSMD2, TDP-43, and PSMD8 in lysates and aggregates. (D) Levels of PSMD2, full-length TDP-43 (FL), truncated TDP-43 (TDP35), and PSMD8 in aggregate fractions normalized by lysate levels were quantified and shown relative to control cells. (E) U2OS cells with control or SETX shRNA were treated with PARP inhibitor veliparib (10 μM) as indicated. Levels of PSMD2, TDP-43, and PSMD8 were monitored by Western blotting in lysates and aggregate fractions. (F) Levels of PSMD2, full-length TDP-43 (FL), truncated TDP-43 (TDP35), and PSMD8 in aggregate fractions normalized by lysate levels were quantified in three independent experiments; shown relative to control cells. (G) Detergent-resistant aggregates were isolated in U2OS cells with SETX shRNA-mediated depletion with N-Acetyl cysteine (NAC, 1 mM) as indicated. Whole lysates and detergent-resistant aggregates were isolated and analyzed by Western blotting for PSMD2 and PSMD8. (H) Quantification of PSMD2 and PSMD8 abundance in aggregate fractions normalized by lysate levels from three independent experiments, normalized to levels in control cells. All P values are derived using a two-tailed t test assuming unequal variance, using three biological replicates (n = 3). Error bars indicate standard error. *, **, ***, and **** indicate P < 0.05, 0.01, 0.001, and 0.0001, respectively; ns = not significant. Source data are available for this figure: SourceData F2.
Insoluble protein aggregates accumulate in the absence of SETX. (A) Detergent-resistant aggregates were isolated in U2OS cells with SETX shRNA-mediated depletion or mock treatment as previously described (Lee et al., 2021). Whole lysates and detergent-resistant aggregates were isolated and analyzed by Western blotting for PSMD2, TDP-43, and PSMD8. (B) Quantification of PSMD2, full-length TDP-43 (FL), truncated TDP-43 (TDP35), and PSMD8 abundance in aggregate fractions normalized by lysate levels from three independent experiments, normalized to levels in control cells. (C) SH-SY5Y cells with control or SETX shRNA were induced or not induced to differentiate as indicated. Western blotting was performed to measure the levels of PSMD2, TDP-43, and PSMD8 in lysates and aggregates. (D) Levels of PSMD2, full-length TDP-43 (FL), truncated TDP-43 (TDP35), and PSMD8 in aggregate fractions normalized by lysate levels were quantified and shown relative to control cells. (E) U2OS cells with control or SETX shRNA were treated with PARP inhibitor veliparib (10 μM) as indicated. Levels of PSMD2, TDP-43, and PSMD8 were monitored by Western blotting in lysates and aggregate fractions. (F) Levels of PSMD2, full-length TDP-43 (FL), truncated TDP-43 (TDP35), and PSMD8 in aggregate fractions normalized by lysate levels were quantified in three independent experiments; shown relative to control cells. (G) Detergent-resistant aggregates were isolated in U2OS cells with SETX shRNA-mediated depletion with N-Acetyl cysteine (NAC, 1 mM) as indicated. Whole lysates and detergent-resistant aggregates were isolated and analyzed by Western blotting for PSMD2 and PSMD8. (H) Quantification of PSMD2 and PSMD8 abundance in aggregate fractions normalized by lysate levels from three independent experiments, normalized to levels in control cells. All P values are derived using a two-tailed t test assuming unequal variance, using three biological replicates (n = 3). Error bars indicate standard error. *, **, ***, and **** indicate P < 0.05, 0.01, 0.001, and 0.0001, respectively; ns = not significant. Source data are available for this figure: SourceData F2.
To examine aggregation in neuronal cells more relevant to the brain-specific phenotypes associated with SETX dysfunction, we used the neuroblastoma cell line SH-SY5Y and differentiated the cells over 7 days into post-mitotic neuron-like cells as previously described (Agholme et al., 2010). In both undifferentiated and differentiated SH-SY5Y cells, depletion of SETX induces aggregation of PSMD2, PSMD8, and TDP-43 similar to the results using U2OS cells (Fig. 2 C, quantification in Fig. 2 D). The highest levels of aggregates are observed in differentiated cells in the absence of SETX. From this result, it is also apparent that differentiation by itself increases the levels of aggregates. This observation is consistent with previous reports showing that neuronal differentiation promotes the formation of protein aggregates, in part due to altered levels of chaperone proteins (Molzahn and Mayor, 2020; Vonk et al., 2020; Thiruvalluvan et al., 2020). Our observation of higher aggregates with differentiation could also be related to the reduction of SETX levels in differentiated cells compared to non-differentiated cells (Fig. 2 C).
Protein aggregation observed with loss of SETX is distinct from that seen with ATM deficiency
We previously demonstrated that protein aggregation in the absence of ATM function is dependent on PARP activity (Lee et al., 2021). Since similar features are shared by AOA2 and A-T patients, including cerebellar atrophy and ataxia (Anheim et al., 2009; Mariani et al., 2017), we predicted that protein aggregation caused by SETX deficiency would also depend on PARP activity. To test this, we used the PARP inhibitor veliparib, specific for PARP1 and PARP2 enzymes (Knezevic et al., 2016). Using U2OS cells with SETX depletion, we found that incubation with veliparib does not reduce the PSMD2, PSMD8, and TDP-43 aggregates (Fig. 2 E, quantification in Fig. 2 F), indicating that protein aggregation in SETX-depleted cells is dependent on the mechanisms other than PARylation. In addition, we examined the effect of the antioxidant N-acetyl cysteine (NAC) on aggregate formation since the aggregates formed in the absence of ATM are strictly dependent on reactive oxygen species (Lee et al., 2021). The results with SETX depletion showed no effect of NAC, however (Fig. 2, G and H), indicating that the formation of aggregates resulting from SETX deficiency is not dependent on either PARP activity or oxidative stress.
SETX deficiency drives the aggregation of proteins associated with neurodegenerative disease
To identify proteins that aggregate in the absence of SETX, cell lysate and detergent-resistant aggregate fractions from U2OS cells with control or SETX shRNA expression were analyzed by label-free, quantitative mass spectrometry. Of 1,579 proteins present in all samples, only a small number of proteins (39) showed differences in the total lysate in control versus SETX-depleted cells (Fig. 3 A and Table S1). However, in the aggregate fraction with lysate normalization, 405 of these proteins showed significant differences in the cells with SETX deficiency, after controlling for false discovery rate (Fig. 3 B and Table S1) (Benjamini and Hochberg, 1995). Of these, the majority (339) show higher levels of aggregation in SETX-depleted cells, including PSMD2, PSMD8, and TDP-43 that were monitored by Western blotting above.
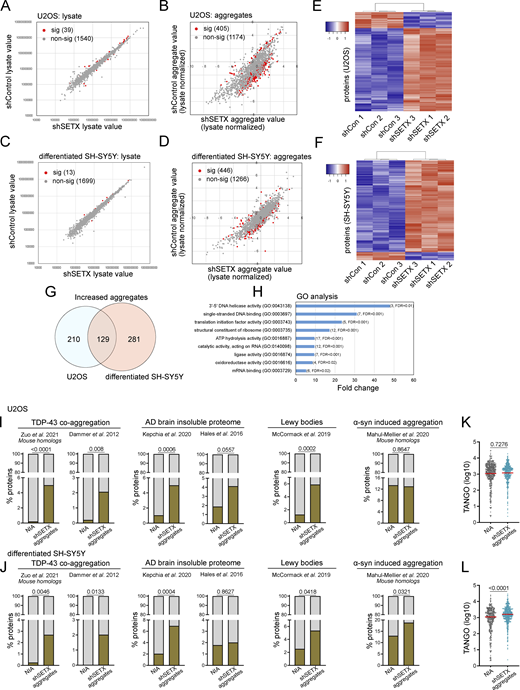
Global proteomics analysis of lysates and aggregates from SETX-depleted U2OS and differentiated SH-SY5Y cells shows similarities with neurodegeneration-associated aggregates. (A) Cell lysates from U2OS cells with mock treatment or SETX shRNA-mediated depletion (three biological replicates for each) were analyzed by mass spectrometry, identifying 1,579 proteins present in all samples. The abundance of each protein in control versus SETX-depleted cells is shown, with non-significant differences in grey and significant differences in red. Significance was determined using a two-tailed t test assuming unequal variance as well as Benjamini–Hochberg control of the false discovery rate at 0.05. See also Table S1. (B) Detergent-resistant aggregates were isolated from control and SETX-depleted cells and analyzed by mass spectrometry with lysate normalization. Red/grey indicators as in A. (C and D) Cell lysates and aggregate fractions were prepared from differentiated SH-SY5Y cells with control or SETX shRNA (three biological replicates for each) and analyzed as described in A and B. See also Table S1. (E) Levels of each aggregated protein, normalized by lysate values, were analyzed by hierarchical clustering (Pearson) comparing shControl samples (3) and shSETX samples (3) in U2OS cells. Only proteins with statistically significant differences between the groups are shown, which includes 405 proteins (of 1,580 total identified in all samples) in U2OS cells. Relationships between samples, as determined by the clustering output, are shown. (F) Levels of each aggregated protein, normalized by lysate values, were analyzed by hierarchical clustering (Pearson) comparing shControl samples (3) and shSETX samples (3) in differentiated SH-SY5Y cells as in E. 446 proteins shown (of 1,712 total identified in all samples) for SH-SY5Y cells. (G) Overlap between increased aggregated proteins identified in U2OS and in differentiated SH-SY5Y cells. See Table S2. (H) Gene Ontology terms and fold enrichment of proteins identified from overlap in G, number of genes and FDR values in parentheses. (I and J) Relative percentages of proteins identified from various disease (model) datasets in the non-aggregated protein group (NIA) and increased aggregated fractions caused by SETX deficiency in U2OS (I) or differentiated SH-SY5Y cells (J), sources for aggregated proteins as indicated (Dammer et al., 2012; Zuo et al., 2021; McCormack et al., 2019; Hales et al., 2016; Kepchia et al., 2020; Mahul-Mellier et al., 2020). (K and L) TANGO scores of proteins identified in NIA and aggregate fractions from U2OS (K) and differentiated SH-SY5Y cells (L). In I and J, The chi-squared test was used to evaluate the statistical significance of differences in distribution. In K and L, Welch’s t test was used to compute P values. (I–L) P values shown on each graph.
Global proteomics analysis of lysates and aggregates from SETX-depleted U2OS and differentiated SH-SY5Y cells shows similarities with neurodegeneration-associated aggregates. (A) Cell lysates from U2OS cells with mock treatment or SETX shRNA-mediated depletion (three biological replicates for each) were analyzed by mass spectrometry, identifying 1,579 proteins present in all samples. The abundance of each protein in control versus SETX-depleted cells is shown, with non-significant differences in grey and significant differences in red. Significance was determined using a two-tailed t test assuming unequal variance as well as Benjamini–Hochberg control of the false discovery rate at 0.05. See also Table S1. (B) Detergent-resistant aggregates were isolated from control and SETX-depleted cells and analyzed by mass spectrometry with lysate normalization. Red/grey indicators as in A. (C and D) Cell lysates and aggregate fractions were prepared from differentiated SH-SY5Y cells with control or SETX shRNA (three biological replicates for each) and analyzed as described in A and B. See also Table S1. (E) Levels of each aggregated protein, normalized by lysate values, were analyzed by hierarchical clustering (Pearson) comparing shControl samples (3) and shSETX samples (3) in U2OS cells. Only proteins with statistically significant differences between the groups are shown, which includes 405 proteins (of 1,580 total identified in all samples) in U2OS cells. Relationships between samples, as determined by the clustering output, are shown. (F) Levels of each aggregated protein, normalized by lysate values, were analyzed by hierarchical clustering (Pearson) comparing shControl samples (3) and shSETX samples (3) in differentiated SH-SY5Y cells as in E. 446 proteins shown (of 1,712 total identified in all samples) for SH-SY5Y cells. (G) Overlap between increased aggregated proteins identified in U2OS and in differentiated SH-SY5Y cells. See Table S2. (H) Gene Ontology terms and fold enrichment of proteins identified from overlap in G, number of genes and FDR values in parentheses. (I and J) Relative percentages of proteins identified from various disease (model) datasets in the non-aggregated protein group (NIA) and increased aggregated fractions caused by SETX deficiency in U2OS (I) or differentiated SH-SY5Y cells (J), sources for aggregated proteins as indicated (Dammer et al., 2012; Zuo et al., 2021; McCormack et al., 2019; Hales et al., 2016; Kepchia et al., 2020; Mahul-Mellier et al., 2020). (K and L) TANGO scores of proteins identified in NIA and aggregate fractions from U2OS (K) and differentiated SH-SY5Y cells (L). In I and J, The chi-squared test was used to evaluate the statistical significance of differences in distribution. In K and L, Welch’s t test was used to compute P values. (I–L) P values shown on each graph.
In addition to U2OS cells, we also examined protein aggregation in SH-SY5Y cells after differentiation into neuron-like cells. Mass spectrometry analysis of the total lysates showed only a few significant changes (13), but we identified 446 proteins showing differences in the aggregates with SETX depletion, of which most (410) show increased levels in SETX-depleted cells compared to the control (Fig. 3, C and D; and Table S1). Unsupervised hierarchical clustering of normalized aggregate levels in both U2OS and SH-SY5Y cells clearly separates control shRNA from SETX shRNA-treated cell lines (Fig. 3, E and F), consistent with the conclusion that these aggregates are defining features associated with SETX loss.
Gene Ontology analysis of the aggregation-prone proteins identified in the SETX-depleted cells shows enrichment for proteins associated with ribosomes or ribosomal RNA (Fig. S1). Other enriched categories include replication and translation-related factors, single-stranded DNA-binding proteins, and telomeric DNA-binding proteins. In addition, we found proteins associated with other forms of neurodegenerative disorders enriched in the aggregate list, including dihydropyrimidinase (DHP), an enzyme involved in the pyrimidine degradation pathway whose deficiency causes neurological and gastrointestinal abnormalities (Van Kuilenburg et al., 2010), and chaperone proteins including the small heat shock protein HSP27 and HSP70 family member HSPA1A, both associated with aggregates and proposed to play a neuro-protective role (Beretta and Shala, 2022).
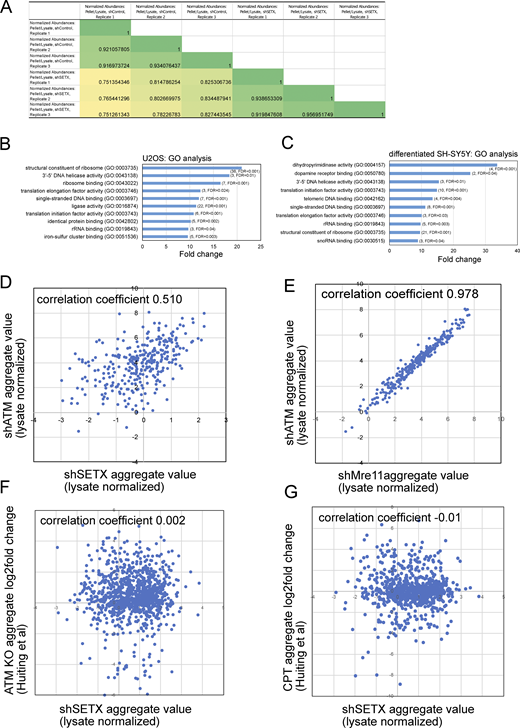
Comparative analysis of protein aggregates isolated from SETX-depleted U2OS and differentiated SH-SY5Y cells. (A) Spearman correlation coefficients for shControl and shSETX pellet values normalized by lysates (three biological replicates each); 1,580 proteins present in all samples. See Table S1. (B) Enriched Gene Ontology groups are shown from analysis of significantly aggregated proteins in U2OS cells with the number of proteins and FDR values in parentheses. (C) Enriched Gene Ontology groups and fold enrichment of proteins identified in aggregates from SETX-depleted SH-SY5Y cells as in B, number of genes and FDR values in parentheses. (D and E) Aggregates and total lysates from three replicates of SETX shRNA depletion were analyzed by mass spectrometry. Aggregate values (normalized by lysate, log2 transformed) for each protein (mean of three replicates) were plotted: (D) SETX-depleted cells (X axis) versus ATM shRNA-treated cells (Y axis) (Lee et al., 2021), 310 proteins, Spearman correlation coefficient = 0.51; (E) Mre11-depleted cells (X axis) versus ATM shRNA-treated cells (Y axis) (Lee et al., 2021), 1,424 proteins, Spearman correlation coefficient = 0.978. (F) SETX-depleted cells (X axis) versus insoluble protein log2 fold change in ATM KO U2OS cells (Huiting et al., 2022) (Y axis), 1,044 proteins, Spearman correlation coefficient = 0.002. (G) SETX-depleted cells (X axis) versus insoluble protein log2 fold change in CPT-treated U2OS cells (Huiting et al., 2022) (Y axis), 818 proteins, Spearman correlation coefficient = 0.01. For each comparison, only proteins with measurements in both datasets are plotted.
Comparative analysis of protein aggregates isolated from SETX-depleted U2OS and differentiated SH-SY5Y cells. (A) Spearman correlation coefficients for shControl and shSETX pellet values normalized by lysates (three biological replicates each); 1,580 proteins present in all samples. See Table S1. (B) Enriched Gene Ontology groups are shown from analysis of significantly aggregated proteins in U2OS cells with the number of proteins and FDR values in parentheses. (C) Enriched Gene Ontology groups and fold enrichment of proteins identified in aggregates from SETX-depleted SH-SY5Y cells as in B, number of genes and FDR values in parentheses. (D and E) Aggregates and total lysates from three replicates of SETX shRNA depletion were analyzed by mass spectrometry. Aggregate values (normalized by lysate, log2 transformed) for each protein (mean of three replicates) were plotted: (D) SETX-depleted cells (X axis) versus ATM shRNA-treated cells (Y axis) (Lee et al., 2021), 310 proteins, Spearman correlation coefficient = 0.51; (E) Mre11-depleted cells (X axis) versus ATM shRNA-treated cells (Y axis) (Lee et al., 2021), 1,424 proteins, Spearman correlation coefficient = 0.978. (F) SETX-depleted cells (X axis) versus insoluble protein log2 fold change in ATM KO U2OS cells (Huiting et al., 2022) (Y axis), 1,044 proteins, Spearman correlation coefficient = 0.002. (G) SETX-depleted cells (X axis) versus insoluble protein log2 fold change in CPT-treated U2OS cells (Huiting et al., 2022) (Y axis), 818 proteins, Spearman correlation coefficient = 0.01. For each comparison, only proteins with measurements in both datasets are plotted.
A comparison of the aggregate-prone proteins in U2OS and SH-SY5Y cells with SETX depletion identifies a core set of 129 aggregate-prone polypeptides (Fig. 3 G and Table S2). This comparison, in combination with the highly overlapped gene ontology analysis results, indicates similar global aggregation propensity and pattern of polypeptides destabilized with SETX loss in different cell lines. Gene Ontology term analysis with this core set of aggregation-prone proteins shows that, besides the enriched categories mentioned above, oxidoreductases and RNA processing factors are among the most affected groups (Fig. 3 H).
Neurodegenerative diseases, including Parkinson’s disease (PD), Huntington’s disease (HD), Alzheimer’s disease (AD), ALS, and prion diseases, have been suggested to exhibit common cellular and molecular mechanisms related to loss of protein homeostasis (Hipp et al., 2014; Kurtishi et al., 2019; Sweeney et al., 2017). Proteins aggregating in ATM-deficient cells were also shown to have significant overlap with aggregates found in some of these more common age-associated disorders (Huiting et al., 2022). To test the overlap of aggregated proteins in SETX-depleted cells and those identified in neurodegenerative disorders associated with protein misfolding, we first defined a group of proteins that were not identified as aggregating (NIA) to serve as a benchmark. This group of proteins was identified in all cell lysates (triplicates of control and SETX-depleted cells), but not in aggregate fractions. We found that proteins that aggregate in U2OS cells with SETX depletion are significantly enriched for constituents of disease-associated protein aggregates in comparison with NIA proteins (Fig. 3 I), including TDP-43-associated aggregates (Dammer et al., 2012; Zuo et al., 2021), Lewy bodies (McCormack et al., 2019), and aggregates in AD brains (Hales et al., 2016; Kepchia et al., 2020), but not in α-synuclein-induced aggregates (Mahul-Mellier et al., 2020). A similar result was also observed among proteins that aggregate in differentiated SH-SY5Y cells with SETX depletion, including α-synuclein-induced aggregates (Fig. 3 J). These results are consistent with the idea that loss of SETX results in destabilization of a core set of proteins known to be prone to aggregation in neurodegenerative disease.
We next examined the intrinsic aggregation propensities of proteins using the TANGO algorithm, which is based on empirical data collected on aggregation-promoting regions (Fernandez-Escamilla et al., 2004). The aggregated proteins identified in SH-SY5Y cells with SETX deficiency have a higher propensity for aggregation in comparison with NIA proteins when analyzed by this method (Fig. 3 L), but this difference is not observed in U2OS cells (Fig. 3 K).
Despite the fact that SETX overexpression resolves protein aggregates in ATM-deficient cells, a comparison of aggregates formed in these two conditions did not show a strong correspondence (correlation coefficient = 0.51) (Fig. S1). Aggregation efficiency values do show a striking similarity between loss of ATM and loss of Mre11 function, as we previously demonstrated (Lee et al., 2021). Overall, we conclude that SETX deficiency destabilizes a set of proteins in multiple cell types but with important differences compared to ATM loss, including the identity of the proteins aggregating and the lack of dependence on PARP function or oxidative stress.
Intergenic R-loops are increased in SETX-depleted cells
SETX is a helicase that plays a crucial role in resolving R-loops by unwinding RNA-DNA hybrids (Groh et al., 2017; Kanagaraj et al., 2022; Lavin et al., 2013; Yüce and West, 2013). This is widely considered to be the primary role of SETX that also ties into its functions at the replication fork and its effects on transcription termination (Alzu et al., 2012; Ramachandran et al., 2021; Skourti-Stathaki et al., 2011). To examine the levels of R-loops in SETX-depleted cells, we used UVA laser-induced DNA crosslinks which present a physical barrier to RNA polymerase, leading to transcription stalling and complex DNA lesions including R-loops (Britton et al., 2014). A live-cell assay was performed with overexpression of a bacterial catalytically inactive RNaseH1 fused to mCherry (RNaseH1 (D10R-E48R)-mCherry) that acts as a sensor to detect R-loops formed in the genome (Bhatia et al., 2014; Makharashvili et al., 2018). Here, we tested R-loop signal (RNaseH1 (D10R-E48R)-mCherry) accumulation at DNA damage sites using laser micro-irradiation and live-cell imaging by confocal microscopy. We observed that the recruitment of RNaseH1 (D10R-E48R)-mCherry occurs at a higher intensity in SETX-depleted cells in comparison with control cells, confirming that higher levels of R-loops form at DNA lesions with SETX loss (Fig. 4 A, quantification in Fig. 4 B).
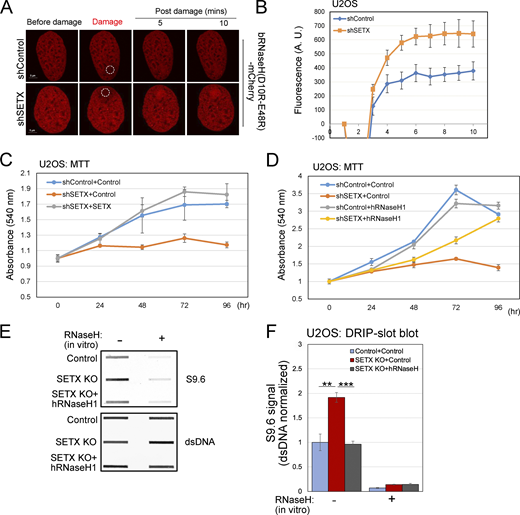
SETX-deficient cells show higher R-loops and slower growth which are rescued by human RNaseH1 overexpression. (A) Laser micro-irradiation was performed in live U2OS cells stably expressing bacterial RNaseH (D20R-E48R)-mCherry as R-loop sensor. The circle indicates the site of laser damage. (B) RNaseH (D20R-E48R)-mCherry signal at laser damage sites at different time points was quantified from >8 control or SETX-depleted cells as in A. (C) Proliferation of U2OS cells with control or SETX shRNA treatment and induction of wild-type SETX, monitored by MTT assay. (D) Proliferation of U2OS cells with control or SETX shRNA treatment and induction of human RNaseH1, monitored by MTT assay as in C. (E) Slot blot analysis of genomic DNA isolated from U2OS cells with SETX knock-out (KO) and wild-type human RNaseH1 overexpression as indicated, using S9.6 and dsDNA antibodies to measure RNA-DNA hybrids and dsDNA, respectively. Recombinant RNaseH treatment confirms the specificity of the S9.6 antibody. (F) Levels of RNA-DNA hybrid signal (S9.6) were quantified in three replicates of E, normalized by dsDNA signal; shown relative to control cells. Error bars indicate standard deviation. (B–D) Error bars indicate standard error. *, **, ***, and **** indicate P < 0.05, 0.01, 0.001, and 0.0001, respectively, by two-tailed t test assuming unequal variance; ns = not significant. Source data are available for this figure: SourceData F4.
SETX-deficient cells show higher R-loops and slower growth which are rescued by human RNaseH1 overexpression. (A) Laser micro-irradiation was performed in live U2OS cells stably expressing bacterial RNaseH (D20R-E48R)-mCherry as R-loop sensor. The circle indicates the site of laser damage. (B) RNaseH (D20R-E48R)-mCherry signal at laser damage sites at different time points was quantified from >8 control or SETX-depleted cells as in A. (C) Proliferation of U2OS cells with control or SETX shRNA treatment and induction of wild-type SETX, monitored by MTT assay. (D) Proliferation of U2OS cells with control or SETX shRNA treatment and induction of human RNaseH1, monitored by MTT assay as in C. (E) Slot blot analysis of genomic DNA isolated from U2OS cells with SETX knock-out (KO) and wild-type human RNaseH1 overexpression as indicated, using S9.6 and dsDNA antibodies to measure RNA-DNA hybrids and dsDNA, respectively. Recombinant RNaseH treatment confirms the specificity of the S9.6 antibody. (F) Levels of RNA-DNA hybrid signal (S9.6) were quantified in three replicates of E, normalized by dsDNA signal; shown relative to control cells. Error bars indicate standard deviation. (B–D) Error bars indicate standard error. *, **, ***, and **** indicate P < 0.05, 0.01, 0.001, and 0.0001, respectively, by two-tailed t test assuming unequal variance; ns = not significant. Source data are available for this figure: SourceData F4.
U2OS cells deficient in SETX grow more slowly than wild-type cells, a phenotype that is complemented by full-length shRNA-resistant SETX expression (Fig. 4 C). Partial complementation was also observed with wild-type human RNaseH1 expression (Fig. 4 D), indicating that accumulation of RNA-DNA hybrids contributes significantly to growth impairment.
We also assessed global RNA-DNA hybrid levels via slot blotting of genomic DNA with the S9.6 antibody that is specific for RNA-DNA hybrids (Phillips et al., 2013). A significant increase of S9.6 signal was observed in SETX knock-out compared to control cells, which was reduced by overexpression of recombinant human wild-type RNaseH1 by lentivirus (Fig. 4 E, quantification in Fig. 4 F). The elevated S9.6 signal was abolished with E. coli RNase H incubation in vitro, confirming the RNA-DNA specificity of the S9.6 antibody.
To validate these results with a different technique and to quantify RNA-DNA hybrids in our cell lines, we overexpressed exogenous catalytically inactive human RNaseH1 (D210N) in cells to capture R-loops in the human genome, followed by chromatin immunoprecipitation (ChIP) of the flag-tagged RNaseH1, a previously described method known as R-ChIP (Chen et al., 2017). Sequencing of these ChIP products showed, surprisingly, that U2OS SETX knock-out cells exhibit lower levels of R-loops compared to control cells at protein-coding genes (examples of genome browser views in Fig. 5 A). Analysis of accumulated signal at all annotated genes shows a lower signal at promoters (Fig. 5 B) and qPCR analysis of R-ChIP immunoprecipitated samples before library preparation also confirms lower levels of R-loops at annotated protein-coding genes (Fig. S2).

R-loops are increased at intergenic SETX-binding sites. (A) Genome browser views of R-ChIP and input control signal in wild-type and SETX knock-out U2OS cells at representative genome locations. Two biological replicates were used and ChIP signal for each line is shown after the removal of input contribution as well as read depth normalization. (B) Normalized R-ChIP signal from wild-type and SETX knock-out cells at promoter sites (TSS) with standard error. TSS locations determined from the dominant transcript for each protein-coding gene (highest number of reads) using poly(A)-selected RNAseq data from wild-type U2OS cells. N = 13,341. (C) Visual representation of gene body, intergenic, or promoter locations of R-ChIP peaks called by MACS2 call peak for wild-type and SETX knock-out R-ChIP as well as SETX ChIP (Cohen et al., 2018). (D) Genome browser views of R-ChIP and input control signal in wild-type and SETX knock-out U2OS cells at representative intergenic genome locations. (E) Visualization of SETX KO R-ChIP signal at locations of SETX binding (called peaks from SETX ChIP no DSB treatment SETX_mOHT from Cohen et al. [2018]); “center” is center of SETX ChIP peak. (F) Quantification of R-ChIP signal from wild-type and SETX KO U2OS cells at locations of SETX binding in the absence of DNA damage; graph showed input-normalized, log2 transformed ChIP signal. *** indicates P < 0.0001 by two-tailed Mann–Whitney test. (G) Accumulated SETX ChIP signal at locations within genes (left panel) and intergenic R-ChIP peak locations (right panel) in SETX knock-out cells.
R-loops are increased at intergenic SETX-binding sites. (A) Genome browser views of R-ChIP and input control signal in wild-type and SETX knock-out U2OS cells at representative genome locations. Two biological replicates were used and ChIP signal for each line is shown after the removal of input contribution as well as read depth normalization. (B) Normalized R-ChIP signal from wild-type and SETX knock-out cells at promoter sites (TSS) with standard error. TSS locations determined from the dominant transcript for each protein-coding gene (highest number of reads) using poly(A)-selected RNAseq data from wild-type U2OS cells. N = 13,341. (C) Visual representation of gene body, intergenic, or promoter locations of R-ChIP peaks called by MACS2 call peak for wild-type and SETX knock-out R-ChIP as well as SETX ChIP (Cohen et al., 2018). (D) Genome browser views of R-ChIP and input control signal in wild-type and SETX knock-out U2OS cells at representative intergenic genome locations. (E) Visualization of SETX KO R-ChIP signal at locations of SETX binding (called peaks from SETX ChIP no DSB treatment SETX_mOHT from Cohen et al. [2018]); “center” is center of SETX ChIP peak. (F) Quantification of R-ChIP signal from wild-type and SETX KO U2OS cells at locations of SETX binding in the absence of DNA damage; graph showed input-normalized, log2 transformed ChIP signal. *** indicates P < 0.0001 by two-tailed Mann–Whitney test. (G) Accumulated SETX ChIP signal at locations within genes (left panel) and intergenic R-ChIP peak locations (right panel) in SETX knock-out cells.

R-ChIP signal at annotated genes is lower in SETX-depleted cells and correlates with overall transcript level. (A and B) Wild-type or SETX KO U2OS cells expressing catalytically inactive RNaseH were used to perform R-ChIP with quantification by qPCR at the SNPRN and beta-actin loci (A) or two regions within the rDNA IGS (B). Three biological replicates were analyzed for each condition with Flag antibody (+Ab) as well as in the absence of antibody (−Ab). * indicates P < 0.05 or *P < 0.005 by two-sample unpaired t test. (C) R-ChIP signal from two biological replicates was quantified for each annotated gene in the promoter region (1,000 nt upstream of transcription start through 500 nt downstream) and plotted against transcript level for the gene in U2OS wild-type and SETX knock-out cell lines as indicated. Genes were grouped into bins according to transcript abundance in each cell line with the average R-ChIP signal and corresponding transcript abundance level shown.
R-ChIP signal at annotated genes is lower in SETX-depleted cells and correlates with overall transcript level. (A and B) Wild-type or SETX KO U2OS cells expressing catalytically inactive RNaseH were used to perform R-ChIP with quantification by qPCR at the SNPRN and beta-actin loci (A) or two regions within the rDNA IGS (B). Three biological replicates were analyzed for each condition with Flag antibody (+Ab) as well as in the absence of antibody (−Ab). * indicates P < 0.05 or *P < 0.005 by two-sample unpaired t test. (C) R-ChIP signal from two biological replicates was quantified for each annotated gene in the promoter region (1,000 nt upstream of transcription start through 500 nt downstream) and plotted against transcript level for the gene in U2OS wild-type and SETX knock-out cell lines as indicated. Genes were grouped into bins according to transcript abundance in each cell line with the average R-ChIP signal and corresponding transcript abundance level shown.
Although R-loops are lower at annotated genes in SETX knock-out cells, there are many called peaks in these datasets where the level of R-loops is higher than in wild-type cells (741 called peaks with >1.5-fold higher ChIP signal). Analysis of these regions shows that they are primarily in intergenic locations (Fig. 5 C). In addition, we analyzed previously published ChIP datasets for Senataxin-binding locations in wild-type U2OS cells in the absence of DNA damage (Cohen et al., 2018), ∼15,000 called peaks, and found that the vast majority of peaks called over input are also outside of known, annotated genes (Fig. 5 C). Analysis of our R-ChIP data shows that R-loops accumulate at these SETX-binding sites in SETX-deficient cells (Fig. 5 E). Levels of R-ChIP signal at these locations in SETX-depleted cells were significantly higher than signal than in wild-type cells (Fig 5 F), the opposite of our findings for R-ChIP at protein-coding genes. The accumulated signal at these intergenic sites may be the source of the higher levels of R-loops we observed by other methods (Fig. 4). Interestingly, many of these sites are peri-centromeric. Finally, analysis of previously published SETX ChIP signal at the sites of R-ChIP accumulation in SETX knock-out cells shows a clear, dual peak signal, particularly at sites of intergenic SETX knock-out R-ChIP peak locations (Fig. 5 G). Taken together, these results suggest that R-loops are higher in SETX-deficient cells at some genomic locations, not at canonical annotated genes but at intergenic sites where SETX binds in wild-type cells.
R-loops are associated with protein aggregation in SETX-depleted cells
To determine whether the accumulation of RNA-DNA hybrids and R-loops in SETX-deficient cells is related to the increase in protein aggregates described in Figs. 1 and 2, we induced human wild-type RNaseH1 expression in U2OS cells with control or SETX shRNA and isolated protein aggregates. PSMD2, PSMD8, and TDP-43 showed significantly higher enrichment in the aggregate fraction with SETX depletion, which was reduced by human wild-type RNaseH1 overexpression, consistent with the effects of human RNaseH1 on R-loops (Fig. 6 A, quantification in Fig. 6 B). We confirmed this result by showing that higher aggregates in the SETX knock-out line were also decreased by human RNaseH1 overexpression (Fig. 6 C, quantification in Fig. 6 D). Finally, 5,6-dichloro-l-β-D-ribofuranosyl benzimidazole (DRB), an inhibitor of RNA polymerase II elongation (Yankulov et al., 1995), also significantly reduced aggregate levels (Fig. 6 E, quantification in Fig. 6 F). Taken together, these results suggest that protein aggregation that occurs in SETX-depleted cells is dependent on both transcription and accumulation of RNA-DNA hybrids.
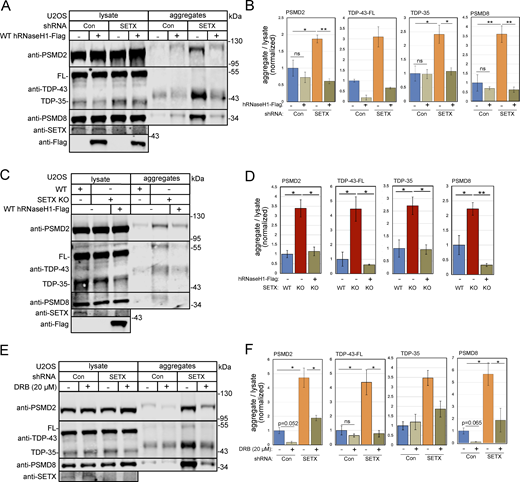
Protein aggregates caused by SETX depletion are reduced by human RNaseH1 overexpression or transcription inhibition. (A) Detergent-resistant aggregates were isolated in U2OS cells with shRNA-mediated depletion of SETX, and induction of human wild-type RNaseH1 expression as indicated. PSMD2, TDP-43, and PSMD8 in lysate and aggregate fractions are shown by Western blotting. (B) Three replicates of A were performed and quantified; levels of PSMD2, TDP-43, and PSMD8 in aggregate fractions normalized by lysate levels are shown relative to control cells. (C) Aggregation assays as in A with SETX knock-out and human wild-type RNaseH1 overexpression as indicated. (D) Three replicates of C were performed and quantified; levels of PSMD2, TDP-43, and PSMD8 in aggregate fractions normalized by lysate levels are shown relative to control cells. (E) Aggregation assays as in A with control or SETX shRNA and DRB (20 μM) added as indicated. (F) Three replicates of E were performed and quantified; levels of PSMD2, TDP-43, and PSMD8 in aggregate fractions normalized by lysate levels are shown relative to control cells. All P values are derived using a two-tailed t test assuming unequal variance, using three biological replicates (n = 3). Error bars indicate standard error. *, **, ***, and **** indicate P < 0.05, 0.01, 0.001, and 0.0001, respectively; ns = not significant. Source data are available for this figure: SourceData F6.
Protein aggregates caused by SETX depletion are reduced by human RNaseH1 overexpression or transcription inhibition. (A) Detergent-resistant aggregates were isolated in U2OS cells with shRNA-mediated depletion of SETX, and induction of human wild-type RNaseH1 expression as indicated. PSMD2, TDP-43, and PSMD8 in lysate and aggregate fractions are shown by Western blotting. (B) Three replicates of A were performed and quantified; levels of PSMD2, TDP-43, and PSMD8 in aggregate fractions normalized by lysate levels are shown relative to control cells. (C) Aggregation assays as in A with SETX knock-out and human wild-type RNaseH1 overexpression as indicated. (D) Three replicates of C were performed and quantified; levels of PSMD2, TDP-43, and PSMD8 in aggregate fractions normalized by lysate levels are shown relative to control cells. (E) Aggregation assays as in A with control or SETX shRNA and DRB (20 μM) added as indicated. (F) Three replicates of E were performed and quantified; levels of PSMD2, TDP-43, and PSMD8 in aggregate fractions normalized by lysate levels are shown relative to control cells. All P values are derived using a two-tailed t test assuming unequal variance, using three biological replicates (n = 3). Error bars indicate standard error. *, **, ***, and **** indicate P < 0.05, 0.01, 0.001, and 0.0001, respectively; ns = not significant. Source data are available for this figure: SourceData F6.
Alteration of R-loop and transcription patterns in SETX-deficient cells
We know from previous work that SETX influences the patterns of gene expression in mammalian cells (Skourti-Stathaki et al., 2011; Kanagaraj et al., 2022; Suraweera et al., 2009; Richard et al., 2021). Here, we used an recently developed variation of Thermostable Group II Intron Reverse Transcriptase sequencing (TGIRT-seq), which enables simultaneous quantification of mRNAs and small non-coding RNAs (sncRNAs) in a manner that is not possible with conventional RNA-seq methods employing retroviral reverse transcriptases (Xu et al., 2021; Wylie et al., 2023, Preprint) (see Materials and methods). Our results show that the cellular transcriptome is altered by SETX loss in a dose-dependent manner, with 1,888 protein-coding genes showing differential expression in shRNA-depleted cells and 2,503 genes affected in the SETX knock-out cells (Padj < 0.001 and log fold change >1, Fig. S3 and Table S3). Interestingly, we also observed many non-coding RNAs significantly altered in the SETX-depleted and SETX knock-out cells, including transposable elements (Fig. S3).
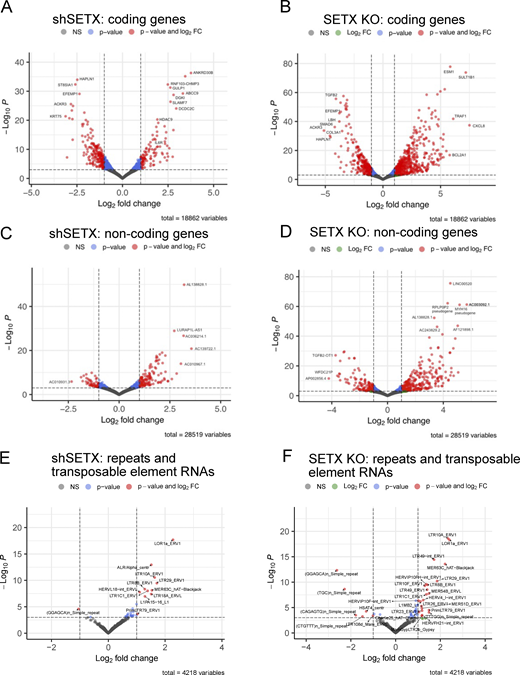
TGIRT RNAseq analysis shows transcription differences in shSETX and SETX knock-out U2OS cell lines. RNA samples from control, SETX shRNA (shSETX), and SETX knock-out (KO) U2OS cells were analyzed by TGIRTseq. Differential gene expression is shown in a volcano plot with q value (y axis) and log fold change (x axis) for shSETX compared to control cells (left panels) and SETX KO compared to control cells (right panels). (A–F) Analysis is shown for protein-coding genes (A and B), non-coding RNAs (C and D), and transposable elements (E and F). Transcripts with >1 log2 fold change difference between treatment and control groups and P values <0.001 are shown in red. See also Table S3.
TGIRT RNAseq analysis shows transcription differences in shSETX and SETX knock-out U2OS cell lines. RNA samples from control, SETX shRNA (shSETX), and SETX knock-out (KO) U2OS cells were analyzed by TGIRTseq. Differential gene expression is shown in a volcano plot with q value (y axis) and log fold change (x axis) for shSETX compared to control cells (left panels) and SETX KO compared to control cells (right panels). (A–F) Analysis is shown for protein-coding genes (A and B), non-coding RNAs (C and D), and transposable elements (E and F). Transcripts with >1 log2 fold change difference between treatment and control groups and P values <0.001 are shown in red. See also Table S3.
We also considered the possibility that the relationship between R-loops and transcript levels at protein-coding genes might be different in SETX knock-out cells compared to the correlations observed in wild-type cells. To examine this, we quantified the R-ChIP signal in the promoter region of every annotated protein-coding gene (1,000 nt upstream of the transcription start site to 500 nt downstream) and plotted these values against the transcript level for that gene, using bins of total gene expression to simplify the analysis (Fig. S2). This shows that R-loops increase with transcript level in wild-type cells as previously demonstrated (Niehrs and Luke, 2020) and that this relationship is also observed in SETX knock-out cells although the R-loop signal in the mutant cells is lower than in wild-type cells at all transcript levels.
Examination of TGIRT-seq signals at the SETX-binding sites identified previously (Cohen et al., 2018) shows that both wild-type and SETX knock-out cells produce RNAs centered on these binding sites (Fig. S4). The vast majority of these binding sites are intergenic (Fig. 5 C). The SETX knock-out cells exhibit higher levels of transcripts at these locations, consistent with the higher levels of R-loops found at these sites (Fig. 5 F). Interestingly, the SETX ChIP signal at these sites accumulates adjacent to the locations of RNA transcripts (Fig. S4).

SETX ChIP and TGIRT RNAseq patterns at SETX knock-out R-ChIP locations. Normalized SETX ChIP data (Cohen et al., 2018) and TGIRT RNAseq data are shown at the locations of intergenic R-ChIP accumulation in SETX knock-out cells (center, narrowpeak MACS output).
SETX ChIP and TGIRT RNAseq patterns at SETX knock-out R-ChIP locations. Normalized SETX ChIP data (Cohen et al., 2018) and TGIRT RNAseq data are shown at the locations of intergenic R-ChIP accumulation in SETX knock-out cells (center, narrowpeak MACS output).
SETX deficiency stimulates aggregate accumulation in the nucleolus
Our previous studies showed that aggregates formed in ATM-deficient cells accumulate in the nucleoplasm, not in the cytoplasm (Lee et al., 2021). Studies of ALS-related cell lines and model systems have shown both cytoplasmic and nuclear accumulation of protein aggregates, particularly TDP-43 (Tziortzouda et al., 2021; Blokhuis et al., 2013). To determine what cellular compartment the aggregates associate with in SETX-deficient cells, we used subcellular fractionation by sucrose gradient to separate U2OS cells into cytosolic, nucleoplasmic, and nucleolar fractions (Andersen et al., 2002; Li and Lam, 2015). Each of these fractions was used for isolation of protein aggregates as described above, normalizing for equivalent amounts of input protein from each fraction. Using this workflow, we observed that the aggregated forms of PSMD2 and PSMD8 proteins in SETX-depleted cells are primarily located in nucleoli (Fig. 7 A, quantification in Fig. 7 B), not in the nucleoplasm or the cytoplasm. To confirm this, we also used immunofluorescence staining of SETX-depleted cells for PSMD8, one of the proteins present in the aggregate fraction, and observed that it does in fact accumulate in the nucleolus in SETX-depleted cells (Fig. 7 C, quantification in Fig. 7 D).
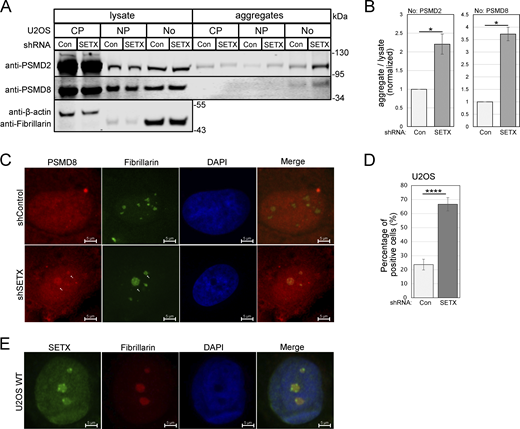
Aggregated proteins in SETX-depleted cells are localized primarily in nucleoli. (A) Cytosolic (CP), nucleoplasmic (NP), and nucleolar (No) fractions were isolated from U2OS cells with control or SETX shRNA by sucrose gradient, and each fraction was used to isolate detergent-resistant aggregates. Lysates and aggregates from different fractions were analyzed by Western blotting for PSMD2, PSMD8, β-actin (cytoplasmic markers), and fibrillarin (a nucleolar marker). (B) Three replicates of A were performed and quantified; levels of PSMD2 and PSMD8 in the aggregates of nucleolar fraction normalized by lysate levels are shown relative to control cells. (C) Localization of endogenous PSMD8 was performed by immunostaining with PSMD8 and fibrillarin antibodies in U2OS cells, with shRNA-mediated SETX depletion or mock treatment. Arrows indicate PSMD8 in nucleoli. (D) Quantification of control and SETX-depleted U2OS cells showing the percentage of cells with PSMD8-positive nucleoli in C. A total number of 165 cells were counted for the control group, and 90 cells were counted for SETX-depleted group. Error bars indicate standard error. *, **, ***, and **** indicate P < 0.05, 0.01, 0.001, and 0.0001, respectively, by two-tailed t test assuming unequal variance (B) and chi-square test (D), between control and SETX-deficient groups; ns = not significant. (E) Localization of endogenous SETX in U2OS cells was detected by immunostaining with SETX and fibrillarin antibodies. Source data are available for this figure: SourceData F7.
Aggregated proteins in SETX-depleted cells are localized primarily in nucleoli. (A) Cytosolic (CP), nucleoplasmic (NP), and nucleolar (No) fractions were isolated from U2OS cells with control or SETX shRNA by sucrose gradient, and each fraction was used to isolate detergent-resistant aggregates. Lysates and aggregates from different fractions were analyzed by Western blotting for PSMD2, PSMD8, β-actin (cytoplasmic markers), and fibrillarin (a nucleolar marker). (B) Three replicates of A were performed and quantified; levels of PSMD2 and PSMD8 in the aggregates of nucleolar fraction normalized by lysate levels are shown relative to control cells. (C) Localization of endogenous PSMD8 was performed by immunostaining with PSMD8 and fibrillarin antibodies in U2OS cells, with shRNA-mediated SETX depletion or mock treatment. Arrows indicate PSMD8 in nucleoli. (D) Quantification of control and SETX-depleted U2OS cells showing the percentage of cells with PSMD8-positive nucleoli in C. A total number of 165 cells were counted for the control group, and 90 cells were counted for SETX-depleted group. Error bars indicate standard error. *, **, ***, and **** indicate P < 0.05, 0.01, 0.001, and 0.0001, respectively, by two-tailed t test assuming unequal variance (B) and chi-square test (D), between control and SETX-deficient groups; ns = not significant. (E) Localization of endogenous SETX in U2OS cells was detected by immunostaining with SETX and fibrillarin antibodies. Source data are available for this figure: SourceData F7.
Previous studies have shown that SETX protein in mammalian cells is localized to the nucleoplasm and also found in nucleoli (Abraham et al., 2020; Chen et al., 2006). We confirmed the nucleolar localization of SETX in U2OS by immunostaining the endogenous protein with SETX antibody and found clear colocalization with the nucleolus marker fibrillarin (Fig. 7 E).
A series of studies from the Lee laboratory and colleagues have shown that proteins can be captured and immobilized in the nucleolus during a stress-induced process termed “nucleolar detention” (Abraham et al., 2020; Audas et al., 2012a, 2012b; Jacob et al., 2013; Wang et al., 2018). This was shown with acid exposure and with heat stress, and the protein association was shown to be dependent on stress-specific induction of non-coding RNAs from the intergenic spacer (IGS) region of rDNA loci. Low-complexity regions of the IGS ncRNAs were shown to facilitate interactions with short charged sequences in proteins that generate amyloid bodies in liquid-like foci (Wang et al., 2018). Here, we considered the possibility that the protein aggregates we have observed may be related to this phenomenon by measuring the levels of ncRNA generated from the IGS rDNA region.
ncRNAs derived from the rDNA intergenic spacer are upregulated in SETX-depleted cells
To characterize the expression changes associated with the rDNA, we detected the levels of ncRNAs within the IGS in U2OS cells treated with control or SETX shRNA by reverse transcription and qPCR (RT-qPCR), using primers targeting different IGS regions of rDNA as indicated in Fig. 8 A. We found that some IGS ncRNAs are induced upon SETX shRNA depletion by 1.2- to 3-fold, as shown in Fig. 8 B. Consistent with the effects of human RNaseH1 on R-loops and protein aggregation (Figs. 4 and 6), expression of human wild-type RNaseH1 reduced IGS ncRNAs in cells treated with SETX shRNA (Fig. 8 C). We also detected IGS ncRNAs directly by northern blotting using probes targeting the IGS18 and IGS22 regions and observed higher levels of IGS18 and IGS22 ncRNAs of ∼300 nucleotides in SETX knock-out cells (Fig. 8 D). The SETX knock-out cells show a higher upregulation of IGS transcripts compared to control cells, with the increases of 3- to 10-fold measured by RT-qPCR (Fig. 8 E). As in SETX shRNA-treated cells, expression of human wild-type RNaseH1 eliminated the excess levels of these ncRNAs (Fig. 8 E).
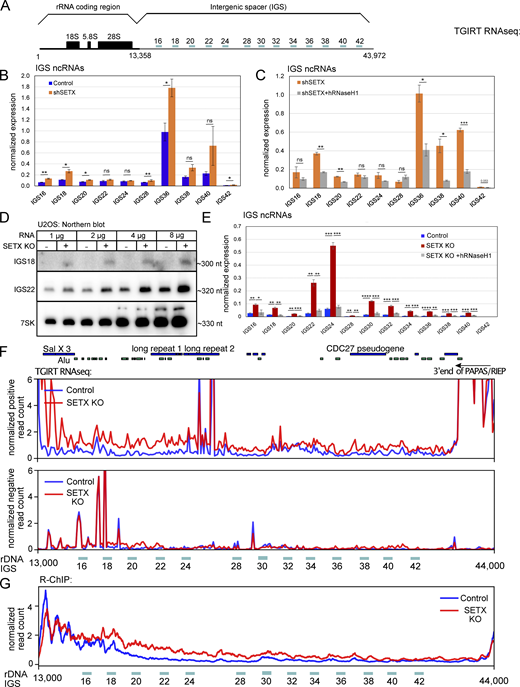
IGS ncRNAs are increased in human cells with SETX deficiency and rescued by human RNaseH1 expression. (A) Schematic diagram of a single copy of human rDNA cassette (∼43 kb) with locations of primer pairs used for reverse transcription with quantitative polymerase chain reaction (RT–qPCR). (B) Total RNA was extracted from U2OS cells with control or SETX shRNA. IGS ncRNAs were analyzed by RT-qPCR with primers as indicated in A and quantified in three independent experiments, normalized to levels of 7SK control RNA. (C) Total RNA was isolated from SETX-depleted U2OS cells with control or human wild-type RNaseH1 overexpression, and the levels of IGS ncRNAs were measured and quantified as in B. (D) RNA extracted from U2OS control or SETX knock-out cells was probed by northern blotting for IGS18 and IGS22 ncRNAs, with 7SK as an internal control. (E) Total RNA was extracted from U2OS cells with SETX knock-out and human RNaseH1 overexpression. IGS ncRNAs were analyzed and quantified by RT-qPCR and normalized to 7SK control gene as in B. (F) Total RNA was extracted from U2OS control or SETX knock-out cells and measured by TGIRT-seq. The peaks of IGS ncRNAs were visualized by IGV software. Top panel: positive-strand reads; bottom panel: negative-strand reads. Locations of repeats related to Alu elements as well as long repeat 1 and 2, Sal X 3, the CDC7 pseudogene, and the 3ʹ end of the PAPAS lncRNA are shown. (G) R-ChIP accumulation in the IGS region in WT and SETX KO U2OS cells. Error bars in B, C, and E indicate standard deviation. *, **, ***, and **** indicate P < 0.05, 0.01, 0.001, and 0.0001, respectively, by two-tailed t test assuming unequal variance between control and SETX-depleted groups, or between SETX-depleted cells with control or human RNaseH1 overexpression. Source data are available for this figure: SourceData F8.
IGS ncRNAs are increased in human cells with SETX deficiency and rescued by human RNaseH1 expression. (A) Schematic diagram of a single copy of human rDNA cassette (∼43 kb) with locations of primer pairs used for reverse transcription with quantitative polymerase chain reaction (RT–qPCR). (B) Total RNA was extracted from U2OS cells with control or SETX shRNA. IGS ncRNAs were analyzed by RT-qPCR with primers as indicated in A and quantified in three independent experiments, normalized to levels of 7SK control RNA. (C) Total RNA was isolated from SETX-depleted U2OS cells with control or human wild-type RNaseH1 overexpression, and the levels of IGS ncRNAs were measured and quantified as in B. (D) RNA extracted from U2OS control or SETX knock-out cells was probed by northern blotting for IGS18 and IGS22 ncRNAs, with 7SK as an internal control. (E) Total RNA was extracted from U2OS cells with SETX knock-out and human RNaseH1 overexpression. IGS ncRNAs were analyzed and quantified by RT-qPCR and normalized to 7SK control gene as in B. (F) Total RNA was extracted from U2OS control or SETX knock-out cells and measured by TGIRT-seq. The peaks of IGS ncRNAs were visualized by IGV software. Top panel: positive-strand reads; bottom panel: negative-strand reads. Locations of repeats related to Alu elements as well as long repeat 1 and 2, Sal X 3, the CDC7 pseudogene, and the 3ʹ end of the PAPAS lncRNA are shown. (G) R-ChIP accumulation in the IGS region in WT and SETX KO U2OS cells. Error bars in B, C, and E indicate standard deviation. *, **, ***, and **** indicate P < 0.05, 0.01, 0.001, and 0.0001, respectively, by two-tailed t test assuming unequal variance between control and SETX-depleted groups, or between SETX-depleted cells with control or human RNaseH1 overexpression. Source data are available for this figure: SourceData F8.
The IGS transcripts were also quantitated in our wild-type control, shSETX, and SETX knock-out TGIRT-seq datasets, which we mapped to the CHM13_T2T build of the human genome that includes the rDNA loci on Ch. 13, 14, 15, 21, and 22. Our analysis of the annotated IGS regions in this genome build shows higher levels of positive-strand transcripts across the IGS region in the SETX knock-out cells (Fig. 7 F, top panel). It has been suggested that anti-sense RNAs also accumulate in the IGS region in response to stress (Abraham et al., 2020), but our examination of the TGIRT-seq datasets showed minimal changes in the levels of anti-sense RNA formed from the IGS region in SETX knock-out cells compared to the control cells (Fig. 7 F, bottom panel; also see Figs. S5 and S6). Previous work from the Lee laboratory demonstrated that ncRNA generated from the IGS region in response to stress is exclusively from the same strand as the rRNA (positive-strand) (Audas et al., 2012a).

Comparisons of IGS-derived non-coding RNA in SETX knock-out compared to control cells: regions surrounding qPCR amplicons. Normalized TGIRT RNAseq data are shown at the locations in the IGS region of the rDNA surrounding locations of qPCR amplicons shown in Fig. 7 A. Positive-strand and negative-strand reads are shown in the control cells (black) or SETX KO cells (red) as indicated. Plus: Sense strand of rDNA; Minus: Antisense strand of rDNA.
Comparisons of IGS-derived non-coding RNA in SETX knock-out compared to control cells: regions surrounding qPCR amplicons. Normalized TGIRT RNAseq data are shown at the locations in the IGS region of the rDNA surrounding locations of qPCR amplicons shown in Fig. 7 A. Positive-strand and negative-strand reads are shown in the control cells (black) or SETX KO cells (red) as indicated. Plus: Sense strand of rDNA; Minus: Antisense strand of rDNA.

Comparisons of IGS-derived non-coding RNA in SETX knock-out compared to control cells: view of entire IGS region. IGV view of the entire rDNA IGS showing positive- and negative-strand reads in the control and SETX knock-out cells. Reads mapped to the human ribosomal DNA complete repeat unit (Genebank U13369.1) were divided by their orientation (plus or minus). Annotations of the IGS and repeat elements were shown on the top. The arrow bar indicates the location where the 3′ part of the PAPAS (promoter and pre-rRNA antisense) extends to. Reads were down-sampled to 100 reads if the maximum depth is over 100. Plus: sense strand of rDNA; Minus: antisense strand of rDNA.
Comparisons of IGS-derived non-coding RNA in SETX knock-out compared to control cells: view of entire IGS region. IGV view of the entire rDNA IGS showing positive- and negative-strand reads in the control and SETX knock-out cells. Reads mapped to the human ribosomal DNA complete repeat unit (Genebank U13369.1) were divided by their orientation (plus or minus). Annotations of the IGS and repeat elements were shown on the top. The arrow bar indicates the location where the 3′ part of the PAPAS (promoter and pre-rRNA antisense) extends to. Reads were down-sampled to 100 reads if the maximum depth is over 100. Plus: sense strand of rDNA; Minus: antisense strand of rDNA.
The effect of wild-type RNaseH1 on ncRNAs generated from rDNA suggested the possibility that R-loops are forming in the IGS region in SETX-depleted and SETX knock-out cells. We examined our R-ChIP data for R-loops in the IGS region and found that R-loop levels are higher in the SETX knock-out cell line compared to the control (Fig. 8 G). In addition, we monitored R-loops in the IGS region of the rDNA as well as per-centromeric regions by DRIP-qPCR in SETX KO cells, with or without wild-type RNaseH1 expression (Fig. S7). These results further demonstrate the presence of R-loops in SETX-deficient cells and also show that expression of wild-type RNaseH1 reduces R-loops at these genomic regions. Locations of increased R-loops in SETX-deficient cells are generally not overlapping with the location of the pre-rRNA antisense PAPAS lncRNA (Zhao et al., 2018) or the gene encoding the newly discovered RIEP protein within this RNA (Feng et al., 2023).

Wild-type hRNaseH overexpression reduces R-loops in SETX KO cells at IGS rDNA and peri-centromeric locations. (A and B) hRNaseH was expressed in U2OS SETX KO cells and R-loops were measured by DRIP immunoprecipitation followed by qPCR for (A) IGS locations in the rDNA and (B) several peri-centromeric regions. Results include three biological replicates per condition; error bars indicate standard deviation. *P < 0.05 or **P < 0.005 by two-sample unpaired t test, comparing the SETX KO to SETX KO +hRNaseH.
Wild-type hRNaseH overexpression reduces R-loops in SETX KO cells at IGS rDNA and peri-centromeric locations. (A and B) hRNaseH was expressed in U2OS SETX KO cells and R-loops were measured by DRIP immunoprecipitation followed by qPCR for (A) IGS locations in the rDNA and (B) several peri-centromeric regions. Results include three biological replicates per condition; error bars indicate standard deviation. *P < 0.05 or **P < 0.005 by two-sample unpaired t test, comparing the SETX KO to SETX KO +hRNaseH.
To confirm that IGS ncRNAs are transcribed by RNA polymerase I as previously suggested (Audas et al., 2012a), we tested an RNA polymerase I inhibitor (BMH-21) and observed inhibition of IGS ncRNA expression in both control and SETX-deficient cells (Fig. 9 A). Treatment of SETX knock-out cells with RNA polymerase I inhibitor also reduced aggregate formation by PSMD2, PSMD8, and TDP-43 (Fig. 9 B, quantification in Fig. 9 C), suggesting that IGS ncRNAs and protein aggregation are strongly correlated in SETX-depleted cells.
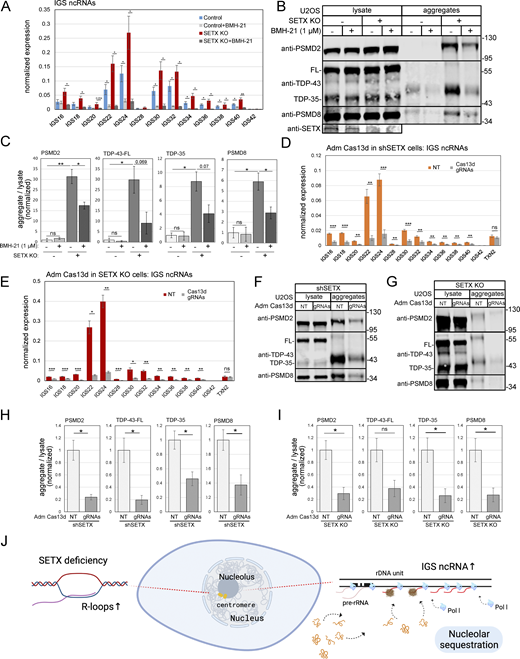
Protein aggregates in SETX-deficient cells are driven by RNA POL1 and non-coding RNAs from the rDNA loci. (A) Levels of IGS ncRNAs were measured in U2OS control or SETX knock-out cells with mock or BMH-21 (1 μM) treatment, as indicated, by RT-qPCR, normalized by 7SK RNA. Error bars indicate standard deviation. *, **, ***, and **** indicate P < 0.05, 0.01, 0.001, and 0.0001, respectively, by two-tailed t test assuming unequal variance between control cells with BMH-21 or mock treatment, and between SETX knock-out cells with BMH-21 or mock treatment. (B) Detergent-resistant aggregates were isolated from control or SETX knock-out U2OS cells with mock or BMH-21 (1 μM) treatment as indicated. Abundance of PSMD2, TDP-43, and PSMD8 in lysate and aggregate fractions are shown by Western blotting. (C) Levels of PSMD2, TDP-43, and PSMD8 in aggregate fractions were quantified in three independent experiments of B and normalized by lysate; shown relative to control cells. Error bars indicate standard error. *, **, ***, and **** indicate P < 0.05, 0.01, 0.001, and 0.0001 by two-tailed t test assuming unequal variance; ns = not significant. (D and E) Levels of IGS ncRNAs were measured in U2OS shSETX or SETX knock-out cells, respectively, with Adm Cas13d expression and either control vector (NT) or Cas13d gRNA expression by RT-qPCR, normalized by 7SK RNA. (F and G) Detergent-resistant aggregates were isolated from shSETX or SETX knock-out U2OS cells with Adm Cas13d expression and either control vector (NT) or Cas13d gRNA expression. PSMD2, TDP-43, and PSMD8 in lysate and aggregate fractions are shown by Western blotting. (H and I) Levels of PSMD2, TDP-43, and PSMD8 in aggregate fractions were quantified in three independent experiments of F and G, respectively, normalized by lysate; shown relative to control cells. Error bars and P values as in C. (J) Model showing non-coding RNA expression from the nucleolus in SETX-deficient cells with associated protein aggregates (nucleolar sequestration). Source data are available for this figure: SourceData F9.
Protein aggregates in SETX-deficient cells are driven by RNA POL1 and non-coding RNAs from the rDNA loci. (A) Levels of IGS ncRNAs were measured in U2OS control or SETX knock-out cells with mock or BMH-21 (1 μM) treatment, as indicated, by RT-qPCR, normalized by 7SK RNA. Error bars indicate standard deviation. *, **, ***, and **** indicate P < 0.05, 0.01, 0.001, and 0.0001, respectively, by two-tailed t test assuming unequal variance between control cells with BMH-21 or mock treatment, and between SETX knock-out cells with BMH-21 or mock treatment. (B) Detergent-resistant aggregates were isolated from control or SETX knock-out U2OS cells with mock or BMH-21 (1 μM) treatment as indicated. Abundance of PSMD2, TDP-43, and PSMD8 in lysate and aggregate fractions are shown by Western blotting. (C) Levels of PSMD2, TDP-43, and PSMD8 in aggregate fractions were quantified in three independent experiments of B and normalized by lysate; shown relative to control cells. Error bars indicate standard error. *, **, ***, and **** indicate P < 0.05, 0.01, 0.001, and 0.0001 by two-tailed t test assuming unequal variance; ns = not significant. (D and E) Levels of IGS ncRNAs were measured in U2OS shSETX or SETX knock-out cells, respectively, with Adm Cas13d expression and either control vector (NT) or Cas13d gRNA expression by RT-qPCR, normalized by 7SK RNA. (F and G) Detergent-resistant aggregates were isolated from shSETX or SETX knock-out U2OS cells with Adm Cas13d expression and either control vector (NT) or Cas13d gRNA expression. PSMD2, TDP-43, and PSMD8 in lysate and aggregate fractions are shown by Western blotting. (H and I) Levels of PSMD2, TDP-43, and PSMD8 in aggregate fractions were quantified in three independent experiments of F and G, respectively, normalized by lysate; shown relative to control cells. Error bars and P values as in C. (J) Model showing non-coding RNA expression from the nucleolus in SETX-deficient cells with associated protein aggregates (nucleolar sequestration). Source data are available for this figure: SourceData F9.
Non-coding RNAs from the IGS region promote protein aggregate formation
To test for a causal relationship between the ncRNAs generated from the rDNA IGS in SETX-deficient cells and the protein aggregates we observed, we sought to deplete these ncRNAs. Several different forms of RNA interference were unsuccessful in reducing the level of the ncRNAs, and thus, we turned to the CRISPR enzyme Cas13d which targets RNA molecules directed by a guide RNA (gRNA) sequence (Konermann et al., 2018). Specifically, we used Anaerobic digester metagenome 15706 (Adm) Cas13d which, unlike the more widely used Ruminococcus flavefaciens XPD3002 (Rfx) Cas13d, was shown to localize to the nucleolus in mammalian cells (Konermann et al., 2018). Constitutive expression of Adm Cas13d with multiple guides specific for several IGS regions successfully reduced the levels of IGS ncRNAs in SETX-depleted as well as SETX knock-out cells (Fig. 9, D and E). Quantification of protein aggregates by Western blotting in these cells showed significant reductions in the SETX-depleted and SETX knock-out cells (Fig. 9, F and G, respectively; quantitation in Fig. 9, H and I), consistent with the hypothesis that the aggregates are not only correlated with but dependent on the ncRNAs produced from the rDNA IGS. Upregulation of the unfolded protein response in the absence of SETX is also reduced by Cas13d-mediated ncRNA reduction (Fig. S8). Taken together, we propose that accumulation of transcription-dependent R-loops caused by SETX loss in human cultured cells induces the expression of IGS ncRNAs from the rDNA, which captures protein in the form of insoluble aggregates in the nucleolus (model in Fig. 9 J).

Cas13d expression with gRNAs specific for IGS ncRNA reduces ER stress in SETX KO U2OS cells. Activation of the unfolded protein response and ER stress was measured with a CHOP-mCherry reporter (Oh et al., 2012) by FACS with at least 10,000 cells per replicate, three replicates per condition. mCherry fluorescence levels per cell were quantified by FACS in U2OS cells in control cells or SETX KO cells with Cas13d and expression of IGS-specific gRNAs as indicated. Control and SETX KO data are also shown in Fig. 1 L. P values are derived using a two-tailed t test assuming unequal variance, using the mean of the fluorescence values from each biological replicate.** indicates P < 0.005, ** indicates P < 0.0005. Box plots show all measurements from all replicates.
Cas13d expression with gRNAs specific for IGS ncRNA reduces ER stress in SETX KO U2OS cells. Activation of the unfolded protein response and ER stress was measured with a CHOP-mCherry reporter (Oh et al., 2012) by FACS with at least 10,000 cells per replicate, three replicates per condition. mCherry fluorescence levels per cell were quantified by FACS in U2OS cells in control cells or SETX KO cells with Cas13d and expression of IGS-specific gRNAs as indicated. Control and SETX KO data are also shown in Fig. 1 L. P values are derived using a two-tailed t test assuming unequal variance, using the mean of the fluorescence values from each biological replicate.** indicates P < 0.005, ** indicates P < 0.0005. Box plots show all measurements from all replicates.
Discussion
In this work, we investigated whether loss of the Senataxin RNA-DNA helicase generates the loss of protein homeostasis in the form of insoluble aggregates and, if so, whether it resembles the effects of ATM loss (Lee et al., 2018, 2021). We found that insoluble protein species do arise at a significant level following knock-down or knock-out of the SETX gene; however, the causes, locations, and specific protein species affected are very different from the A-T scenario. Here, we found that the aggregates that accumulate in the absence of SETX function are not dependent on ROS or PARP activity but are instead driven by ncRNAs expressed from the rDNA loci and localize primarily in the nucleolus. Considering that loss of protein homeostasis is a common, nearly universal theme in neurodegenerative disease, these results may provide a novel framework to view SETX and the neurological disorders caused by mutations in this gene.
Protein aggregates in SETX-deficient cells
In this work, we document the aggregation of several hundred proteins in the absence of SETX function. The results show that these protein aggregates are triggered by increased ncRNAs derived from the IGS region of rDNA loci and localize in the nucleolus. IGS ncRNAs are known to be induced in response to different forms of stress, including heat shock, acidosis, and transcriptional stress (Audas et al., 2012a; Jacob et al., 2013; Marijan et al., 2019). In response to these stimuli, IGS ncRNAs promote the sequestration of specific stress-induced proteins and misfolded proteins within the nucleolus, preventing their deleterious effects on other cellular processes (Audas et al., 2012b). However, prolonged or excessive stress can overwhelm this protective mechanism, leading to nucleolar dysfunction and the formation of stress-induced aggregates. In our experiments, depletion of IGS ncRNAs reduced the accumulation of aggregates, demonstrating a direct causality between increased IGS ncRNAs and protein aggregates in SETX-depleted cells.
While there are nucleolar proteins identified in the aggregate species, including ribosome biogenesis protein BRX1 homolog (BRIX1) and DEAD-box helicase 47 (DDX47), the majority of proteins in the aggregates are normally localized to other cellular compartments, primarily the nucleoplasm, cytosol, and mitochondria. How are these proteins transported into nucleoli under stress? One suggestion from Lee et al. is that the proteins contain Nucleolar Detention Sequences (NoDS), which have the ability to be temporarily detained within the nucleolus (Wang et al., 2019; Mekhail et al., 2007). For instance, HSP70, an NoDS-containing protein, was found to be captured by IGS16 and IGS22 ncRNAs and accumulated in the nucleolus with heat shock (Audas et al., 2012a). Additionally, under acidosis, other NoDS-containing proteins, such as VHL, DNA (cytosine-5)-methyltransferase 1 (DNMT1), and the delta catalytic subunit of DNA polymerase (POLD1), are immobilized by IGS28 ncRNA. We also identified proteins containing NoDS sequences in our aggregates, including HSPA1A. However, we also observed many proteins without obvious NoDS that were also aggregated in the nucleoli, suggesting that these proteins can be actively transported into the nucleoli via other alternative pathways in the absence of SETX function.
Among the aggregated species, we found a large number of mitochondrial proteins (Tables S1 and S2). Dysfunctional mitochondria can lead to increased oxidative stress, impaired energy production, and an imbalance in calcium homeostasis, all of which contribute to impaired proteostasis (Burté et al., 2015). We also identified many proteins involved in DNA replication and the DNA damage response in the aggregated fraction, including Rad50, Ku70, and MCM proteins. Sequestration of these factors in actively replicating cells may contribute to the observed reduction in DNA damage survival as well as decreases in growth rate. RPA1, a subunit of the single-strand DNA-binding complex RPA, was also identified among the significantly aggregated species in differentiated SH-SY5Y cells. RPA was previously shown to accumulate in the nucleolus with SETX depletion (Feng and Manley, 2021), consistent with our observations of nucleolus-specific aggregate formation. Interestingly, this relocalization was shown to occur in response to R-loop formation.
In addition, we found many proteasome-associated proteins in the aggregates as well as E3 ubiquitin ligases including TRIM25 and TRIM33. The proteasome and Ubiquitin-proteasome system (UPS) are fundamental players in maintaining protein homeostasis through the degradation of misfolded or damaged proteins (Davidson and Pickering, 2023). In neurodegenerative diseases, there is evidence of impaired proteasomal function, leading to the accumulation of misfolded proteins and their subsequent aggregation (Kurtishi et al., 2019). The aggregation of these proteins may explain the deficient proteasome activity that we observe in SETX-depleted cells. Furthermore, heat shock proteins (HSPs), chaperones that facilitate protein folding and prevent aggregation under stress conditions, were also found in aggregates, including HSPA1A, HSPB1, HSPA4, and HSPH1. The deficiencies in proteasomal activity and chaperones may create a vicious cycle that further exacerbates the protein aggregation process.
We consistently observed aggregation of the TDP-43 protein in SETX-deficient cells, a protein that is found in insoluble cytosolic or nuclear aggregates in >95% of ALS patients (Prasad et al., 2019). Pathologic TDP-43 was reported to undergo caspase-dependent proteolytic cleavage to generate ∼35 and ∼25 kDa C-terminal fragments and to accumulate in the insoluble protein fraction in affected brain and spinal cord of frontotemporal lobar degeneration (FTLD) and ALS patients (Berning and Walker, 2019). Our results showed significantly higher TDP-43 truncated fragments (∼35 kDa; TDP-35) in the aggregate fraction of SETX-depleted cells.
Loss of SETX was reported to inhibit autophagy, leading to an accumulation of ubiquitinated proteins and reduced autophagic flux (Richard et al., 2021). This study ascribed the defects in autophagy to changes in transcription and splicing, leading to reduced expression of genes required for lysosome biogenesis and function. Autophagy certainly plays a critical role in aggregate clearance (Guo et al., 2018) and reduction in autophagic flux likely contributes to the accumulation of aggregates we observe here. Interestingly, one of the long non-coding RNA species we found to be significantly reduced in SETX knock-out cells is TGFB2-OT1, a transcript shown to be a positive regulator of autophagy (Huang et al., 2015).
It is important to note that, in addition to ATM deficiency, misfolded proteins have been observed in other disease states related to faulty DNA repair. In mismatch repair-deficient tumors for instance, high levels of mutations were shown to promote accumulation of misfolded protein aggregates (McGrail et al., 2020). The relationship between genome stability and proteome stability is an emerging field where loss of DNA repair capacity can lead to protein aggregation, and accumulation of aggregates also reduces the efficiency of DNA repair (Paull, 2021; Huiting and Bergink, 2021; Konopka and Atkin, 2018). Monitoring protein aggregation in living cells can be challenging, especially in situations where a minority of the protein in the cell converts to an aggregated state. We previously used a live-cell, fluorescence-based assay for association of proteins with PAR in the absence of ATM function (Lee et al., 2021) to address this issue. Other groups studying Alzheimer’s and Parkinson’s disease have used crosslinking mass spectrometry and also fluorescent-tagged molecular folding reporters for assays in live cells (Ye et al., 2022; Pukala, 2023). These techniques would be useful in monitoring SETX-related aggregates in future experiments.
Locations of R-loops in SETX-deficient cells
The SETX protein and its homolog Sen1 in budding yeast are known to have several cellular roles including transcription termination and mRNA splicing in addition to the enzymatic removal of RNA-DNA hybrids (Groh et al., 2017; Lavin et al., 2013; Yüce and West, 2013). The accumulation of ncRNAs and protein aggregates we observe is completely suppressed by overexpression of human RNaseH1, indicating that the key function that blocks these adverse outcomes in wild-type cells is the removal of RNA-DNA hybrids. One question that has been difficult to answer in the field is whether hybrids are actually higher in the absence of SETX, as one would expect. Previous work utilizing the S9.6 antibody and DRIP-seq in SETX-deficient U87 glioblastoma cells showed that loss of this enzyme generates cells with a lower level of R-loops compared to wild-type cells (Richard et al., 2021). Our findings in U2OS at annotated genes are very similar to this. Despite this evidence, our quantification of R-loops in SETX-deficient cells by other means (RNaseH1 immunofluorescence at laser damage sites, S9.6 DRIP slot blot) shows that SETX-deficient cells contain higher levels of R-loops compared to wild-type cells. Our finding that SETX-deficient cells do exhibit higher levels of R-loops but that these are not located within protein-coding genes may explain this discrepancy.
The locations of peaks where R-ChIP levels are significantly higher in SETX knock-out cells compared to wild-type cells are primarily intergenic. We also observed this at sites of SETX binding in U2OS cells from previously published ChIP data (Cohen et al., 2018) where a large fraction of sites are located in centromeric or peri-centromeric regions. Consistent with this observation, SEN1 ChIP in budding yeast showed association of the protein with centromeric regions in an RNAP2-independent manner in addition to highly transcribed RNAP2 and RNAP3 genes (Alzu et al., 2012; Rivosecchi et al., 2019). Notably, recent work in human cells indicates that centromere–nucleolus interactions regulate centromeric and peri-centromeric transcription (Bury et al., 2020), that centromere-associated alpha satellite RNA also localizes to the nucleolus in an RNAP1-dependent manner (Wong et al., 2007), and that other known nucleolus-localized proteins such as PARP1, PARP2, and borealin associate with both organelles (Rodriguez et al., 2006; Meder et al., 2005; Saxena et al., 2002; Fujimura et al., 2020).
In addition to the centromere-associated locations, we observed higher R-loops in SETX knock-out cells in the IGS region of the rDNA, primarily between 15 and 40 kb within the 45S rDNA gene unit. Previous work investigating SETX function in the nucleolus suggested that SETX-deficient cells exhibit lower levels of R-loops in the rDNA loci and concluded that the SETX protein actually generates R-loops in the nucleolus (Abraham et al., 2020). In contrast, we observe higher levels of R-ChIP signal in the IGS region of the rDNA in SETX knock-out cells compared to wild-type cells. The biochemical properties of the SETX and yeast SEN1 enzymes as RNA-DNA helicases (Martin-Tumasz and Brow, 2015; Hasanova et al., 2023) do not agree with a model in which SETX is creating R-loops. Instead, we hypothesize that higher R-loops in intergenic regions of the genome, in the rDNA and in peri-centromeric regions, generate a stress response in the IGS region of the rDNA loci that manifests with higher ncRNA expression. Interestingly, overexpression of SETX in human cells was previously shown to induce “nucleolus dissolution,” characterized by redistribution of fibrillarin from the nucleolus into the nucleoplasm (Bennett et al., 2020), indicating that the stoichiometry of SETX is critical for nucleolar structure.
Taken together, our findings suggest that loss of SETX function promotes destabilization of the proteome in a manner that is driven at least in part by non-coding RNA dynamics in the nucleolus. The activity of SETX as an RNA-DNA helicase appears to be the critical function in preventing this stress response and both rDNA and centromere-associated regions are the genomic locations where R-loops are higher in the absence of SETX. We do not know how R-loops in these locations lead to non-coding RNA expression, however, and it is not understood how other types of stress elicit this response. More work is necessary to elicit the mechanisms driving RNAP1-dependent IGS expression, to determine how different types of stress drive different expression patterns of non-coding originating from rDNA loci, and to understand the relevance of these stress responses for neurodegenerative disease using physiologically relevant cellular and organismal model systems.
Materials and methods
Gene expression constructs
Depletion of endogenous SETX was performed with lentivirus expressing shRNA targeting SETX (5′-AGATCGTATACAATTATAG-3′), pTP3655. SETX knock-out was performed by lentivirus containing LentiCrispr v2 plasmid with the gRNA targeting to exon 3 of SETX gene (5′-GCTGTTTGAAATTCACCGGA-3′), pTP5086. LentiCrispr v2 was a gift from Feng Zhang (plasmid #52961; http://n2t.net/addgene:52961; RRID:Addgene 52961; Addgene). Recombinant codon-optimized Senataxin expression in U2OS T-Rex FLP-in cells was performed with pcDNA5-FRT/TO-intron-derived vectors containing shRNA-resistant SETX alleles, including full-length WT (pTP4796), P413L (pTP4807), L1976R (pTP4776), ∆N-term (∆1-665; pTP5045), and ∆HD (∆1931-2456; pTP5075). Recombinant bacterial RNaseH1 (D10R-E48R)-NLS-mCherry (pTP3493) was cloned using a pcDNA5-FRT/TO derivative and pICE-RNaseH1 (D10R-E48R)-NLS-mCherry (Britton et al., 2014). pICE-RNaseHI-D10R-E48R-NLS-mCherry was a gift from Patrick Calsou (plasmid #60367; http://n2t.net/addgene:60367; RRID:Addgene 60367; Addgene). Human RNaseH1 without mitochondrial signal sequence (∆1-78 [Bubeck et al., 2011]) (108699; Addgene) was cloned into Tet-On pLentiHygro (Singh et al., 2012) (35635; Addgene) containing a C-terminal flag tag and expressed by lentivirus, including WT (pTP5108) and catalytic mutant D210N (pTP5135). pEGFP-RNASEH1 was a gift from Andrew Jackson & Martin Reijns (plasmid #108699; http://n2t.net/addgene:108699; RRID:Addgene 108699; Addgene). pLenti-PGK-ER-KRAS(G12V) was a gift from Daniel Haber (plasmid #35635; http://n2t.net/addgene:35635; RRID:Addgene 35635; Addgene). The proteasome sensor was constructed in the form of a BacMam using pAceBac1 and pTT083 (pcDNA mCherry-P2A-hUbL-YFP-eRR) to make pTP4566. The CHOP reporter was cloned from CHOP promoter (−649/+136)pmCherry-1 (36035; Addgene) into a BacMam using pAceBac1 to make pTP4665. CHOP promoter (−649/+136) pmCherry-1 was a gift from Quan Lu (plasmid #36035; http://n2t.net/addgene:36035; RRID:Addgene_36035; Addgene). Baculovirus was generated according to Bac-to-Bac instructions (Thermo Fisher Scientific).
Cloning of Adm Cas13d nuclease and gRNA plasmids
Gibson Assembly was used to clone Adm Cas13d protein (165075; Addgene) into pLentiRNACRISPR (138147; Addgene ) (pTP5334). p23-NES-AdmCas13d-msfGFP-NES-Flag was a gift from Ling-Ling Chen (http://n2t.net/addgene:165075; RRID:Addgene 165075). pLentiRNACRISPR_005 - hU6-DR_BsmBI-EFS-RfxCas13d-NLS-2A-Puro-WPRE was a gift from Neville Sanjana (http://n2t.net/addgene:138147; RRID:Addgene 138147). gRNAs targeting different IGS ncRNA were designed through the website (https://cas13design.nygenome.org). gRNA containing a 30 nt spacer (sequences are shown in table) flanked by two direct repeats (first repeat: 5′-AACCCCTACCAACTGGTCGGGGTTTGAAAC-3′, second repeat: 5′-GAACTACACCCGTGCAAAAATGCAGGGGTCTAAAAC-3′) was cloned into pRSITEP--U6Tet-(sh)-EF1-TetRep-2A-Puro (Cellecta) regulated by a tet-on U6 promoter (Table 1).
Cloning of Adm Cas13d nuclease and gRNA plasmids
| gRNAs for IGS ncRNAs | Site specific sequence (5′ → 3′) | Plasmid number |
|---|---|---|
| IGS18 | 5′-GATTCCACAAATGAAGGTCAGCGGTATCTA-3′ | pTP5379 |
| IGS20 | 5′-AAAACATTTAAAAATGAAGGCCGGGCGCGG-3′ | pTP5372 |
| IGS22 | 5′-GTTCAAGCAATTCTTCCACCCCAGCCTCCC-3′ | pTP5383 |
| IGS24 | 5′-TCAACCTATGGCAGAGAGGACACGTCATTC-3′ | pTP5387 |
| IGS28 | 5′-AACAGTTTATGTTGAAGTCGAGGAGCTTAT-3′ | pTP5371 |
| IGS30 | 5′-CAGAAGTGAAGAATTCAGGCCTTGGTAAGG-3′ | pTP5389 |
| IGS32 | 5′-ACTTTCACTATCATTAGCACAGTGTTTAAT-3′ | pTP5391 |
| IGS34 | 5′-AGTTTATGTCACAGACAGCCCGAGACCGTT-3′ | pTP5392 |
| IGS36 | 5′-ACTACGTCTTAACCACGCACCCACGAAGAA-3′ | pTP5380 |
| IGS38 | 5′-TGTATTGTATTGTATCGTATCCTATTGTAT-3′ | pTP5384 |
| IGS40 | 5′-AAGCAAGCAAGAAAGCAAGCATGAAAGAAA-3′ | pTP5385 |
Cell culture and recombinant protein induction
U2OS T-Rex FLP-in cells were obtained from B. Xhelmalce (University of Texas at Austin, Austin, TX, USA); SH-SY5Y neuroblastoma cells were obtained from ATCC (CRL-2266). U2OS cells with a plasmid encoding the full-length SETX gene were cultured in Dulbecco’s Modified Eagle Medium (DMEM; Invitrogen) supplemented with 10% fetal bovine serum (FBS; Invitrogen) containing 15 μg/ml Blasticidin (A1113903; Life Technology), 100 U/ml penicillin-streptomycin (15140-122; Life Technology), and 200 μg/ml Hygromycin (400052-50 ml; Life Technology). Depletion of endogenous SETX was performed by incubating cells with lentivirus containing shRNA cassettes overnight and selecting with media containing 1 μg/ml puromycin (Invitrogen) for 5–7 days. The SETX knock-out was generated by incubating cells with lentivirus containing LentiCrispr v2 plasmid overnight and selecting with media containing 1 μg/ml puromycin (Invitrogen) for 5–7 days. Single cells were isolated after selection by end-point dilution. To induce the genes introduced through the FLP-in system, doxycycline (#BP-2653-5; 1 μg/ml; Thermo Fisher Scientific) was added to the medium for 3 days before any treatment or experiment. Lentivirus was prepared in HEK-293T cells as previously described (Lee et al., 2018).
To generate Adm Cas13d U2OS cells with SETX depletion, AdmCas13d-expressing lentivirus was used to infect SETX-depleted U2OS cells and selected with 200 μg/ml Hygromycin (400052-50 ml; Life Technology). After selection, mixed lentivirus containing doxycycline-inducible gRNAs that target IGS18-IGS40 ncRNAs was used to infect Adm Cas13d U2OS cells with SETX depletion. To deplete IGS ncRNAs, doxycycline (#BP-2653-5; 1 μg/ml; Thermo Fisher Scientific) was added to the medium for 3 days before each experiment.
For BacMam-based expression experiments, 1 ml of second amplification BacMam was added to 106 number of exponentially growing U2OS cells and FACS measurements were obtained the following day.
Proteostat measurements
Cells were grown in DMEM (10% FBS) media in the presence of doxycycline (1 μg/ml) in 6-well plates for 3 days. Aggregation was measured using the PROTEOSTAT Aggresome detection kit (#ENZ-51035-K100; Enzo) following the manufacturer’s protocol. Cells (>10,000 per replicate) were analyzed with a BD LSRII Fortessa instrument.
DNA-RNA immunoprecipitation (DRIP) assay
Cells were harvested with trypsin, resuspended in 3 ml of phosphate bovine serum (PBS) supplemented with 0.5% SDS and 1 mg/μl Proteinase K (#P-480-500; Gold biotechnology), and incubated at 37°C overnight.
Genomic DNA was isolated using 1 volume of phenol:chloroform, followed by 1 volume of chloroform, and finally precipitated at 6,000 g for 5 min by 1 volume of isopropanol. The genomic DNA pellet was washed with 1 ml of 70% ethanol and then rehydrated in 1X TE buffer (10 mM Tris-HCl pH 8.0, 1 mM EDTA). Next, the genomic DNA was digested using a mixture of restriction enzymes (20 units each of EcoRI, HindIII, BsrGI, XbaI, and SSPI) (NEB) with 1X NEBuffer 2.1, and it was incubated overnight at 37°C. The concentration of digested DNA was measured using the Qubit dsDNA HS kit (Thermo Fisher Scientific). Subsequently, 10 µg of digested DNA was diluted in 1 ml of 1X DRIP buffer (10 mM sodium phosphate, 140 mM sodium chloride, 0.05% Triton X-100) and incubated with 100 µg of S9.6 antibody (purified from ATCC HB-8730) at 4°C overnight. The next day, 30 µl of Dynabeads M-280 Sheep Anti-Mouse lgG Beads (11202D; Life Technologies) was added and incubated at room temperature (RT) for an additional 2 h. Afterward, the beads were washed three times with 1 ml of 1× DRIP buffer for 10 min at RT with constant rotation. Then, the agarose slurry was resuspended in 100 µl of 1X TE containing 0.5% SDS and 1 mg/ml Proteinase K and incubated at 37°C for 1 h. The beads were then pelleted, and the supernatant was transferred to a new 1.5-ml low-bind tube. Then, the immuno-precipitated material was precipitated by adding 10 µl of 7.5 M ammonium acetate, 1 µg of glycogen, and 400 µl of 100% ice-cold ethanol, and kept at −20°C for at least 2 h (or overnight). Then, the pellet was precipitated by centrifugation in a microcentrifuge at maximum speed at 4°C for 30 min, followed by washing with 1 ml of cold 70% ethanol, air-drying, and finally resuspending in 100 µl of 1X TE. 20 μl reaction volume was used with PowerUp SYBR Green Master Mix (A25778; Thermo Fisher Scientific) for qPCR amplification of IGS locations in the rDNA and several peri-centromeric regions (see Table S4 for primer sequences). Reactions were incubated with the following program on a Viia 7 System (Life Technologies): 50°C 2 min, 95°C 10 min, 40 cycles of 95°C 15 sec, 64°C 1 min, followed by a melt curve: 95°C 15 sec, 60°C 1 min, 0.05°C/s to 95°C 15 sec. For each DRIP sample, the fold enrichment for a given locus was calculated using the 2−∆∆CT method (Schmittgen and Livak, 2008), with normalization of the samples to the control.
Western blotting
Western blotting was performed on PVDF membrane (Immobilon-FL, Thermo Fisher Scientific) using antibodies directed against SETX (QQ-7, sc-100319; Santa Cruz), PSMD2 (A1999; ABclonal), PSMD8 (A6955; Abclonal), TDP-43 (A17114; ABclonal), beta-actin (4970; Cell Signaling), tubulin (AC012; ABclonal), Flag epitope (M2, F1804; Sigma-Aldrich), and fibrillarin (A0850; ABclonal). Secondary antibodies used were anti-mouse IgG Alexa Fluor plus 800 (A32730; Thermo Fisher Scientific) and anti-rabbit Alexa Fluor 680 (A21076; Thermo Fisher Scientific). Membranes were blocked with Licor Blocking buffer (92770010; Licor) and analyzed using an Odyssey scanner (Licor).
R-loop slot blot
The preparation of nucleic acids followed a method similar to DRIP with a few adjustments. Briefly, after overnight digestion with restriction enzymes, half of the nucleic acid sample were treated with E. coli RNaseH (New England Biolabs, 20U) at 37°C for 3 h. Subsequently, 0.5 μg aliquots of nucleic acids were loaded onto a nylon membrane and crosslinked using a UV Crosslinker. To block the membranes, blocking buffer (927-40010; Licor) was used, and they were probed overnight at 4°C with S9.6 antibody and anti-ds DNA antibody (ab27156; Thermo Fisher Scientific). The S9.6 antibody used here was purified from hybridoma cells (HB-8730; ATCC) using Protein G resin (17-0405-01; Thermo Fisher Scientific), washing with PBS, and eluting with acidic buffer. Eluted fractions were neutralized, quantified, and exchanged into a storage buffer (e.g., PBS with 50% glycerol) by dialysis for long-term stability at −20°. The slot blot membranes were washed three times with PBST and probed with goat anti-mouse secondary antibody (IgG Alexa Fluor plus 800; A32730; Thermo Fisher Scientific) at RT for 1 h. Following these steps, the membranes were washed three times with PBST and quantified using an Odyssey imaging system (Licor). The obtained image was normalized to the control sample and quantified using ImageJ software.
RNaseH1 (D210N) chromatin immunoprecipitation (R-ChIP) assay
The R-ChIP assay was modified from a published protocol (Chen et al., 2019). U2OS cells with expression of human RNaseH1 (D210N)-flag (one 150 mm dish per biological replicate) were crosslinked by the addition of formaldehyde (1% final concentration) at RT for 7 min, followed by glycine (125 mM final concentration) at RT for 15 min. Cells were washed twice with cold PBS and harvested by scraping. Cells were pelleted at 3,000 rpm for 10 min in 15-ml Falcon tubes. Cell pellets were washed twice with 1 ml cell lysis buffer (10 mM Tris pH8, 10 mM NaCl, 0.5% [vol/vol] Igepal CA-630, and protease inhibitors [#A32955; Pierce; 1 tablet per 10 ml]). Then, each cell pellet was resuspended in 2.2 ml of RIPA buffer (50 mM Tris pH8, 150 mM NaCl, 2 mM EDTA, 0.1% SDS, 0.5% Sodium Deoxycholate, 1% NP40, and protease inhibitors) and sonicated with a Bioruptor sonicator for 2 × 15 min at high power 15 s on and 15 s off. The extract was cleared with 3,500 rpm centrifugation at 4°C for 5 min. A 50 μl aliquot of the supernatant was saved as the “Input” sample, 1 ml of supernatant was transferred to a 1.5-ml tube containing Pierce Protein A/G Magnetic Beads pre-incubated with anti-flag antibody (F1804-1MG; 5 μg; Sigma-Aldrich), and another 1 ml of supernatant was transferred to beads-only tube as negative control and immunoprecipitated overnight with rotation at 4°C. The next day, the beads were washed three times each with wash buffer I (20 mM Tris pH 8, 2 mM EDTA, 150 mM NaCl, 1% Triton, 0.1% SDS), wash buffer II (20 mM Tris pH 8, 2 mM EDTA, 500 mM NaCl, 1% Triton, 0.1% SDS), and one time with wash buffer III (10 mM Tris pH 8, 1 mM EDTA, 1% Sodium Deoxycholate, 250 mM LiCl, 1% NP40), each wash was 3 min at RT. Beads were then washed with TE buffer (10 mM Tris pH8, 1 mM EDTA) and transferred to a fresh tube with 100 μl elution buffer (1% SDS, 100 mM NaHCO3). Samples were eluted by shaking at 30°C for 30 min. The beads were then pelleted, and the supernatant was transferred into a fresh tube. The tube containing the supernatant was incubated at 65°C overnight. The DNA samples were purified (#28304; Qiagen quick nucleotide removal kit) and eluted with 50 μl TE buffer. R-ChIP samples (two biological replicates per condition plus input samples) were used to prepare DNA libraries using the NEBNext Ultra II DNA Library Prep Kit for Illumina (E7645S; NEB) with NEBNext Multiplex dual index primers using 12 amplification cycles and 2 additional AMPure XP clean-up steps at 0.8X according to the manufacturer’s instructions. Libraries were sequenced by the UT Genomic Sequencing and Analysis Facility (RRID:SCR_021713) using the Illumina NovaSeq SP platform with PE150 runs. Sequencing reads were cleaned using FASTP in paired end mode and mapped to the genome using BWA-MEM with default values and the CHM13_T2T genome build. Aligned reads were converted to bedgraph format via MACS2 (Zhang et al., 2008). Output bedgraph files were processed again using MACS2’s bdgcmp command with the ppois flag to approximately remove the ChIP input influence from the ChIP bedgraph files. Finally, bedgraph output was read depth normalized to make files equivalent in total signal by converting to bigwig format, quantification with multibigwigsummary, and scaling with bigwigcompare at 1 nt resolution.
TGIRT-seq
For TGIRT-seq analysis, cellular RNA was extracted from U2OS lysates using the mirVana miRNA isolation kit (Thermo Fisher Scientific) according to the manufacturer’s instructions. 10 μg RNA was incubated with Baseline-ZERO DNase (Lucigen; 2 U, 30 min at 37°C) to digest DNA followed by rRNA depletion using an Illumina RiboZero Gold (Human/Mouse/Rat) kit. To enable simultaneous quantitation of mRNAs, long non-coding RNAs, and small non-coding RNAs, the rRNA-depleted RNAs were cleaned up with a Zymo RNA clean and concentrator kit by using the manufacturer’s two-fraction protocol to separate long and short RNAs. The long RNAs (>200 nt) were then chemically fragmented to 70–90 nt length by using an NEBNext Magnesium RNA Fragmentation Module (New England Biolabs; 94°C for 5 min) and cleaned up with a Zymo RNA clean and concentrator kit using a modified 8X ethanol protocol (vol/vol ratio 1:2:8 for RNA sample:kit RNA Binding Buffer: 100% ethanol) to minimize loss of very small RNAs. The chemically fragmented long RNAs were then combined with the intact short RNAs (<200 nt) and treated with T4 polynucleotide kinase (Lucigen; 50 U for 30 min at 37°C) to remove 3′ phosphates and 2′,3′-cyclic phosphates, which impede TGIRT template switching, followed by a final clean-up with a Zymo RNA clean and concentrator kit using the modified 8X ethanol protocol above. For all samples, RNA concentration and quality were checked by mRNA assay with a Pico Kit on an Agilent 2100 Bioanalyzer. The recovered cellular RNAs (2–50 ng) were then used for TGIRT-seq library preparation.
TGIRT-seq libraries were constructed as described (Xu et al., 2019, 2021) by using TGIRT-template switching from a synthetic RNA template/DNA primer duplex to the 3′ end of the target RNA for 3′ RNA-seq adapter addition and a single-stranded DNA ligation to the 3′ end of the cDNA using Thermostable 5′ AppDNA/RNA Ligase (New England Biolabs) for 5′ RNA-seq adapter addition. The TGIRT-template switching reaction was done with 1 μM TGIRT-III RT (InGex, LLC) for 15 min at 60°C. The resulting cDNAs were amplified by PCR with primers that add capture sites and indices for Illumina sequence (denaturation 98°C for 5 s, followed by 12 cycles of 98°C for 5 s, 65°C for 10 s, and 72°C for 10 s) The PCR products were purified by using Agencourt AMPure XP beads (Beckman Coulter), and the libraries were sequenced on an Illumina NextSeq 500 to obtain 2 × 75-nt paired end reads.
For TGIRT-seq data analyses (Figs. S3 and S5), the raw sequencing reads were mapped to human genome reference sequence Hg38 and processed as described (Wylie et al., 2023, Preprint). Differential gene expression analyses were performed by using the DESeq2 package (Love et al., 2014) in R with the raw counts plus 1 pseudo-count as input. The downstream analyses were applied to the log-transformed DESeq2-normalized expression value with the ashr LFC shrinkage package (Stephens, 2017), and the differential gene expression was visualized with the EnhancedVolcano package in R version 1.18.0 (https://github.com/kevinblighe/EnhancedVolcano).
For analysis of TGIRT-seq data in the CHM13T2T build of the human genome that includes rDNA regions, sequencing reads were cleaned using FASTP in paired end mode and mapped to the genome using HISAT2 (Kim et al., 2019) with default values using the strand-specific flag FR. Bam files from biological replicates were merged using samtools merge and converted to bigwig format using bamcoverage (Ramírez et al., 2016). For non-strand-specific processing, bigwig files were read depth normalized to make files equivalent in total signal by quantification with multibigwigsummary followed by scaling with bigwigcompare at 1 nt resolution. For strand-specific processing, merged bam files were converted to sam format using BAM-to-SAM. Awk was used to extract positive-strand reads with {if(($1 ∼ /^@/) || ($0 ∼ /XS:A:\+/)) print $0} or negative-strand reads with {if(($1 ∼ /^@/) || ($0 ∼ /XS:A:-/)) print $0}. Sam files were converted back into bam format using SAM-to-BAM and then converted to bigwig format using bamcoverage (Ramírez et al., 2016). Bigwig files were read depth normalized to make files equivalent in total signal by scaling with bigwigcompare at 1 nt resolution with scaling factors derived from non-strand-specific comparison.
R-ChIP versus transcription analysis
For analysis shown in Fig. S2 C, final R-ChIP bedgraph files were separated into separate bedgraph files for each chromosome. Bedgraph files were converted into “extended” Numpy arrays where each array element represents a nucleotide on the genome and the element value is the bedgraph value at that location. Pandas rolling(window = 100) function was paired with mean() to calculate the 100 nt rolling mean ChIP signal across the genome. Processed data using these arrays for figures were all computed using Numpy and Pandas. Transcript abundance was determined from TGIRT-seq bam files using featureCounts v2.0.3. Plots were made using Matplotlib.
Aggregation assay
Cells were harvested with trypsin, resuspended in 1 ml of lysis buffer (20 mM Na-phosphate pH 6.8, 10 mM DTT, 1 mM EDTA, 0.1% Tween 20, 1 mM PMSF, and EDTA-free protease inhibitor mini tablets [#A32955; Thermo Fisher Scientific]) and rotated at 4°C for 30 min. Detergent-resistant protein aggregates were isolated as previously described (Lee et al., 2021). Lysates and aggregates were characterized by Western blotting or by label-free mass spectrometry using a Thermo Fisher Scientific Orbitrap Fusion instrument.
Sample preparation was performed as previously described (Lee et al., 2018) with the following changes. 8 µg of protein for lysates or whole samples for pellets in SDS loading buffer was boiled for 5 min before dilution to 800 µl of UA (8 M Urea, 0.1 M Tris-HCl pH 8.8) total volume. After filter aided sample preparation, label-free quantification LC-MS/MS was performed by the proteomics facility in the University of Texas at Austin following previously described procedures (Ryu et al., 2020), with three biological replicates per condition. The raw data that were processed by Proteome Discoverer 2.2. Mass spectrometry results from Proteome Discoverer 2.2 were further refined by removing commonly known contaminates and any proteins identified with less than two unique polypeptides. Then, refined data were normalized by total peptides in order to correct for variation in sample loading. Pellet over lysate values were generated by dividing pellet values with corresponding lysate values then taking log (base 2) of the results. Proteins with missing data were dropped for the analysis. The Benjamini–Hochberg procedure was used in order to control for multiple hypothesis testing using 0.05 FDR (Benjamini and Hochberg, 1995). Heatmap and hierarchical clustering were generated using R studio version 1.2.5001. with heatmap.2 function under gplots package in conjugation with colorRampPalette function in RColorBrewer package. The hierarchical clustering was performed using default hclust method with “euclidean” distance calculation and “complete” clustering.
Cell fractionation
A sucrose gradient method was used to extract cytosolic, nucleoplasmic, and nucleolar fractions from cells (Andersen et al., 2002). Cells were harvested with trypsin and washed three times with PBS. The cell pellets were then resuspended in 2 ml of buffer A (10 mM HEPES-KOH pH 7.9, 1.5 ml MgCl2, 10 mM KCL, 0.5 mM DTT, protease inhibitor) and homogenized using a dounce homogenizer with 20 strokes using a tight pestle. The homogenized lysis was subsequently centrifuged at 200 g for 6 min at 4°C. The supernatant was saved as cytoplasm. The resulting nuclear pellet was resuspended in 1 ml of buffer B (0.25 M sucrose, 10 mM MgCl2, protease inhibitor), which was then layered over 1 ml of buffer C (0.35 M sucrose and 0.5 mM MgCl2, protease inhibitor). This mixture was centrifuged at 1,400 g for 6 min at 4°C. The clean and pelleted nuclei were resuspended in 1 ml of buffer C (0.35 M sucrose, 0.5 mM MgCl2, protease inhibitor), followed by sonication using Bioruptor sonicator for 2 min at middle power 10 sec on and 10 sec off. Next, the sonicated sample was layered over 1 ml of buffer D (0.88 M sucrose, 0.5 mM MgCl2, protease inhibitor) and centrifuged at 2,800 g for 10 min at 4°C. This separation resulted in the pellet containing the nucleoli and the supernatant containing the nucleoplasmic fraction. The nucleoli were then subjected to a wash step by 500 μl of buffer C, followed by centrifugation at 2,000 g for 2 min at 4°C and resuspension in 1 ml lysis buffer used in aggregation experiment. The extracted cytosolic, nucleoplasmic, and nucleolar fractions were then used to do aggregation experiment.
Immunostaining
U2OS cells were seeded into 8-well Nunc Lab-Tek II Chamber Slides (#154534; Nalge Nunc International) 3 days before experiments. Prior to immunostaining, cells were washed with PBS and fixed with 2% paraformaldehyde for 5 min. Cells were then washed twice with PBS and permeabilized for 5 min with ice-cold methanol. After that, cells were washed with PBS and blocked with 8% BSA/PBS at RT for 1 h. After washed with PBS, cells were incubated with primary antibodies SETX (sc-100319; Santa Cruz) and fibrillarin (A0850; ABclonal), or PSMD8 (A6955; ABclonal) and fibrillarin (ab4566; Abcam) in 1% BSA/PBS at 4°C overnight. Cells were washed twice with PBS and incubated with appropriate secondary antibodies coupled to Alexa Fluor 488 or 594 fluorophores (A32723, A21207; Life Technologies, respectively) in 1% BSA/PBS at RT for 1 h. After two washes with PBS, coverslips were mounted on glass slides using In Situ Mounting Medium with DAPI (DUO82040-5ML; Sigma-Aldrich). Images were acquired with a Zeiss LSM 710 Laser Scanning confocal microscope with a 64× oil immersion objective.
RNaseH1 (D10R-E48R)-mCherry laser micro-irradiation
U2OS cells were seeded in glass bottom petri dishes (35 × 10 mm, 22 mm glass, WillCo-dish, HBST3522) and grown in DMEM/10% FBS media in the presence of 1 mg/ml doxycycline. After 36 h, media was replaced with media containing 10 mM BrdU. After an additional 36 h, laser micro-irradiation was performed with an inverted confocal microscope (FV1000; Olympus) equipped with a CO2 module and a 37°C heating chamber as previously described (Makharashvili et al., 2018). Data collected from 8 to 10 cells were normalized to their initial intensity and plotted against time.
RT-qPCR
U2OS cells with or without treatment were harvested by trypsinization (0.25% trypsin; Life Technologies) and pelleted at 1,000 g for 5 min in 1.5-ml Falcon tubes. Cell pellets were washed with PBS (Life Technologies), and RNA was purified by Vana miRNA isolation kit (AM1560; Thermo Fisher Scientific). Extracted RNA was treated with DNaseI and cleaned by Monarch RNA Cleanup kit (T2030L; New England BioLabs). 500 ng of RNA was retro-transcribed using SuperScript IV Reverse Transcriptase Thermo Fisher Scientific (8090050) kits with Random Nonamers (R7647-100UL; Sigma-Aldrich). qPCR was done using the same settings as those for DRIP-qPCR and 7SK used as a reference gene.
MTT assay
Cells were seeded in 96-well plates at a density of 2,000 cells/well. The proliferation of cells was measured by an MTT (methyl thiazoly tetrazolium) assay on days 1, 2, 3, 4, and 5 following the manufacturer’s protocol (V13154; Life Technologies).
Northern blotting
Cells were grown in DMEM (10% FBS) media in the presence of doxycycline (1 μg/ml) in 10 cm dish for 3 days and harvested with trypsin. Total RNA was isolated using Vana miRNA isolation kit (AM1560; Thermo Fisher Scientific). RNA was treated with DNase I (M0303S; NEB Kiosk) and purified using the Monarch RNA cleanup kit (T2040L; Thermo Fisher Scientific). The northern blot assay with isolated RNA was performed as described previously (Devanathan et al., 2021).
Thermostable group II intron reverse transcriptase (TGIRT) RNA sequencing
The total RNA was extracted from U2OS cells with the Vana miRNA isolation kit (AM1560; Thermo Fisher Scientific). The quantity of the RNA was checked by NanoDrop 2000. The RNA quality was then checked by the Agilent Bioanalyzer with mRNA pico assay. The integrity of 18 and 28S ribosomal RNA peaks was used as an indication of the RNA integrity and all RNA used in this study showed intact peaks of 18 and 28S rRNA and passed the RNA integrity quality control. 500 ng total RNA was treated with Baseline zero Dnase (0.1 U/μl) and Exonuclease I (1 U/μl) in the 1X Baseline zero Dnase buffer at 37°C for 15 min. The reaction was cleaned by Zymo RNA clean and concentrator kit (R1019; Zymo Research) with a modified 8× volume of ethanol to volume of sample protocol to maximize the short RNA recovery. The ribosomal RNA removal was performed by using the Illumina Ribo-zero Plus kit (20037135; illumine). The volume of the ribo-depletion reaction was added up to 100 μl with nuclease-free water. The first round of the cleanup was performed by using 0.45× volume of Ampure Beads (A63880; Beckman Coulter) to the volume of the sample ratio. After the magnetic separation, the beads, containing the long fraction of the RNA (>300 nt), were washed with 80% ethanol and elute by following the Ampure beads manufacturer’s protocol. The supernatant (∼140 μl), containing the short fraction of RNAs (<300 nt), was transferred in a new sterile tube. Then, the 250 μl (∼1.8× volume of beads to the volume of the sample ratio) new Ampure beads were added following with wash and elute to get the short RNA fraction. 1 μl RNA of long and short RNAs was used to check the RNA quality by Agilent Bioanalyzer RNA pico assay. All remaining fragmented long RNA was combined with the short fraction RNA. The combined RNA was then treated with T4 PNK (0.5 U/μl; Lucigen) at 37°C for 30 min to remove the 3′ phosphate. 1 μl of the combined RNA was used to check the final RNA quality by Agilent Bioanalyzer RNA pico assay.
About 6 ng RNA prepared by the combined two-fraction protocol was used as input to prepare the TGIRT-seq library as previously described (Xu et al., 2019, 2021). 1 μl of the final library was used to check the TGIRT-seq library quality by Agilent high sensitivity DNA assay (5067-4626; Agilent). Each genotype has three biological replicates. All libraries used for high-throughput sequencing passed the quality control standard, with very low amount of adapter-dimer peak (130 bp) and good library signals with expected size distribution (150–700 bp). The libraries were sequenced on the Illumina Novaseq platform with PE150 bp setting and each library was aimed to get around 20 million reads. The sequencing fastq file was used as input for the bioinformatic pipeline described previously (Yao et al., 2020). The raw count was used as input for DESeq analysis in R.
Differential gene expression analysis
TGIRT-seq BAM files were fed into FeatureCounts (v2.0.3) along with the Gencode v39 primary assembly annotation file (hg38). FeatureCount flags for paired end mode and gene counts were applied. The count matrix was input into DESeq2 (v1.34.0) for differential gene expression analysis. EnhancedVolcano (v1.12.0) was used to produce the volcano plots from DESeq2 output. Pheatmap (v1.0.12) was used to plot the 500 genes with the highest Log2FC and Padj < 0.01. Euclidean distance was the metric used in Pheatmap’s clustering scheme.
Statistical analysis
For measurements of aggregated proteins by Western blot, protein abundance in aggregate fractions as well as in lysates was determined by quantitative analysis of IR dye-labeled secondary antibodies (Licor Odyssey) from three independent experiments, normalized to the levels in control cells. All P values were derived using a two-tailed t test assuming unequal variance, using three biological replicates (n = 3). For measurements of fluorescence-based sensors using FACS, at least 10,000 cells were measured per replicate. P values were derived using a two-tailed t test assuming unequal variance, using the mean of the fluorescence values from three biological replicates (n = 3). Box plots in the figures show all (>30,000) measurements from all three replicates. For comparisons of ChIP signal at specific subsets of genomic sites (i.e., R-ChIP signal from wild-type and SETX KO U2OS cells at locations of SETX binding), P values were determined by two-tailed Mann–Whitney test. For measurements of RNA levels by RT-qPCR, RNA levels were quantified by qPCR with two technical replicates each from three biological replicates, with each measurement normalized to a control RNA as noted in the figure legends. P values were determined by two-tailed t test assuming unequal variance. The chi-squared test was used to evaluate the statistical significance of differences between TANGO scores (Fig. 3) and PSMD8 nucleolar localization (Fig. 7). Statistical analysis of differential expression data was performed using DESeq2 (v1.34.0) as described above.
Online supplemental material
Comparative analysis of protein aggregates isolated from SETX-depleted U2OS and differentiated SH-SY5Y cells is shown in Fig. S1. Analysis of R-ChIP signal at annotated genes as well as rDNA IGS regions is shown in Fig. S2, as well as correlations with overall transcript levels. TGIRT RNAseq analysis of transcription differences in shSETX and SETX knock-out U2OS cell lines is shown in Fig. S3. SETX ChIP and TGIRT RNAseq patterns at SETX knock-out R-ChIP locations are shown in Fig. S4. Comparisons of IGS-derived non-coding RNA in SETX knock-out compared to control cells is shown in Fig. S5, specifically the regions surrounding qPCR amplicons. Comparisons of IGS-derived non-coding RNA in SETX knock-out compared to control cells with a view of entire IGS region are shown in Fig. S6. Effects of hRNaseH overexpression on R-loops in SETX KO cells at IGS rDNA and peri-centromeric locations are shown in Fig. S7. Effects of Cas13d expression with gRNAs specific for IGS ncRNA on ER stress in SETX KO U2OS cells are shown in Fig. S8. Table S1 shows UNIPROT accession numbers, descriptions, and normalized abundances for U2OS cell line data (three biological replicates for shControl and shSETX separately). Table S2 shows overlap of aggregated proteins between U2OS and differentiated SH-SY5Y cells. Table S3 shows TGIRT RNAseq analysis of wild-type, shRNA-depleted SETX (shSETX), and SETX knock-out U2OS cell lines. Table S4 shows primers used in this study.
Data availability
Data are available in the article itself, in supplementary materials, and all sequencing datasets associated with this study are available at the GEO database under accession GSE240664.
Acknowledgments
We thank Kyle Miller and members of the Miller laboratory for help with laser micro-irradiation and members of the Paull laboratory for helpful discussion.
The funding was provided by National Institutes of Health R35 GM136216 to A.M. Lambowitz and R01 GM138548 to T.T. Paull.
Author contributions: X. Wen contributed to conceptualization, methodology, validation, formal analysis, investigation, visualization, and review and editing of the manuscript. H. Xu and P.R. Woolley contributed to methodology, validation, formal analysis, investigation, and review and editing of the manuscript. O.M. Conway and J. Yao contributed to methodology, validation, formal analysis, and investigation. A. Matouschek contributed to methodology and review of the manuscript. A.M. Lambowitz contributed to methodology, validation, formal analysis, investigation, data curation, and editing of the manuscript. T.T. Paull contributed to conceptualization, methodology, validation, formal analysis, investigation, resources, data curation, writing and editing of the manuscript, visualization, supervision, project administration, and funding acquisition.

