Skip to Main Content

Tissue-resident macrophages receive signals from their microenvironment that coordinate the activity of transcription factors (TFs) to establish distinct transcriptional profiles and identities. However, the molecular mechanisms whereby interactions with other cells of the niche imprint a distinct macrophage identity remain poorly understood. Here, we report that retinoid X receptors (RXRs) determine the differentiation and identity of alveolar macrophages (AM) by regulating chromatin accessibility and transcriptional activity of AM-core and function genes, enabling PPARγ-dependent programs. AM differentiation and maintenance in vivo require RXR upregulation in response to tissue-derived δ-like canonical Notch ligand 4 (DLL4), GM-CSF, and TGF β (TGFβ). Interplay among these signals leads to cooperation between RXRα, RBPJ, STAT5, and SMAD4 for the transcriptional and epigenetic regulation of key AM-core genes. These results underscore the role of RXRs as key TFs that cooperate with other regulatory elements to establish the AM population and determine AM identity.

Tissue-resident macrophages (TRMs) are specialized immune cells that reside in all tissues, play crucial roles in pathogen defense, and perform tissue-specific functions in their niche to maintain tissue homeostasis (Hashimoto et al., 2013). TRMs are derived from embryonic precursors and are known to self-renew locally in some tissues, maintaining a stable population throughout life (Mass et al., 2016; Epelman et al., 2014). TRM identity is dictated by instructive niche signals (Porcuna et al., 2020) that direct precursor cells to adopt finely tuned tissue-specific phenotypes. These signals prompt an orchestrated time-dependent expression of transcription factors (TFs) that TRMs require for their correct differentiation and maturation. The core of initial macrophage lineage-determining TFs (LDTFs) is composed of the myeloid pioneer TF PU.1, which is expressed by all TRMs, together with CCAAT/enhancer-binding protein α, MAF BZIP TF (c-MAF), and zinc finger E-box–binding homeobox 2 (ZEB2). Although these TFs work together to shape shared TRM functions (Bleriot et al., 2020), niche-specific signals induce a second group of TFs, known as signal-dependent TFs (SDTFs), that shape distinctive transcriptional programs and epigenetic landscapes (Porcuna et al., 2020; Bleriot et al., 2020; Lavin et al., 2014). SDTFs furthermore trigger the induction of specific functional modules in each subgroup of TRMs, allowing them to establish their identity and perform their tissue-specific functions (T'Jonck et al., 2018).

Alveolar macrophages (AMs) are TRMs residing in lung alveoli. They participate in airway pathogen clearance and the maintenance of correct levels of pulmonary cholesterol and surfactant (Dorr et al., 2022; Minutti et al., 2016). The diversity of lung macrophages results from their remarkable plasticity and their ability to respond to local environmental cues (Bain and MacDonald, 2022; Guilliams et al., 2013). The critical instructive signals that shape AM function, differentiation, and identity include cytokines, metabolites, surfactant proteins, and elevated oxygen levels in the alveolar space (Da Costa Loureiro et al., 2020; Izquierdo et al., 2018). Mouse AMs originate from myeloid precursors during embryonic development (Cohen et al., 2018; Gomez Perdiguero et al., 2015; Tan and Krasnow, 2016). Although AMs are able to self-renew, cell fate mapping studies reveal that a substantial proportion of adult AMs are descended from bone marrow (BM)-derived monocytes (Gomez Perdiguero et al., 2015; Joshi et al., 2018; Liu et al., 2019). AM identity and maturation are instructed by niche-derived CSF 2 (Csf2, GM-CSF) secreted by lung alveolar type II cells (ATIIs) (Gschwend et al., 2021) and autocrine-produced TGF β (TGFβ) (Yu et al., 2017). One of the key TFs for correct AM differentiation is the nuclear receptor PPARγ, which is required for the acquisition of the characteristic AM gene signature, including lipid metabolism-related genes (Porcuna et al., 2020; Schneider et al., 2014). Despite these advances, it remains largely unknown how the regulatory relationships between AM precursors and their niche lead to the induction of specific SDTFs and ultimately to AM differentiation.

The nuclear receptor superfamily comprises several TFs that act as transcriptional regulators upon ligand activation. Nuclear receptors are highly expressed in TRMs, and their tissue-dependent expression has been functionally validated in several studies (Porcuna et al., 2020). Retinoid X receptors (RXRs) form a distinctive subgroup within the nuclear receptor superfamily and can form homo- and heterodimers with other nuclear receptors (Rőszer et al., 2013). RXRs can be activated by vitamin A derivatives, such as 9-cis retinoic acid and dietary lipids. Hematopoietic cells, including tissue macrophages, express RXRα (NR2B1) and RXRβ (NR2B2) but not RXRγ (NR2B3) (Casanova-Acebes et al., 2020). Elevated expression of these receptors is a shared feature of the macrophage lineage (Mass et al., 2016). RXRs regulate a wide range of biological processes in macrophages, including cell differentiation, proliferation, survival, immune responses, and metabolism (Rőszer et al., 2013). RXR signaling ensures correct bone homeostasis and remodeling by maintaining osteoclast differentiation, proliferation, and activity (Menendez-Gutierrez et al., 2015; Menendez-Gutierrez and Ricote, 2017). RXRs also ensure the neonatal expansion of peritoneal macrophages (PMs) by modulating chromatin accessibility and regulate survival and lipid homeostasis in adult cells (Casanova-Acebes et al., 2020).

In the present study, we show that targeted RXR deficiency impairs the maturation of precursors into fully differentiated and functional AMs. Genome-wide analysis revealed that RXRα acts as a master macrophage LDTF, controlling AM identity through the expression of AM-specific TFs. We also demonstrate that the maintenance of adult AM populations and the RXR-controlled AM core program require signaling via δ-like canonical Notch ligand 4 (DLL4) expressed on endothelial cells of the pulmonary microvasculature. RXR expression was induced in AM precursors upon exposure to the alveolar lung-derived signals DLL4, GM-CSF, and TGFβ in vitro. Chromatin immunoprecipitation (ChIP) analysis revealed that RXRs establish the core program that defines AM identity through orchestrated cooperation with the TFs RBPJ, STAT5, and SMAD4, activated downstream of the identified niche signals.

Deletion of RXRα and RXRβ reduces AM numbers and impairs AM maturation and function

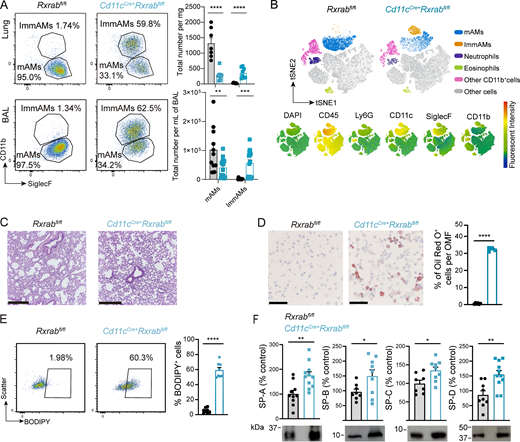
We first analyzed the expression of RXRα and RXRβ in circulating monocytes and AMs. Although AMs express both RXR subtypes, only Rxra showed increased expression compared with undifferentiated blood monocytes (Fig. S1 A). We previously reported that RXRα deletion with the pan-myeloid driver LysMCre+ (LysMCre+Rxrafl/fl mice) produced no significant changes in AMs (Casanova-Acebes et al., 2020). However, several studies have shown that RXR redundancy allows one RXR subtype to compensate the lack of another (Rőszer et al., 2013; Casanova-Acebes et al., 2020; Menendez-Gutierrez et al., 2023). We therefore crossed LysMCre+ mice with Rxrabfl/fl mice to generate LysMCre+Rxrabfl/fl mice and analyzed lung homogenates by FACS, finding a reduction in the number of mature AMs (mAMs, CD11b/SiglecF+) (Fig. S1, B–D). To generate a more specific model for the deletion of RXRs in AMs, we deleted Rxra and Rxrb using the Cd11cCre driver (Brocker et al., 1997), which provided efficient deletion in mAM and immature AM (ImmAM) populations (Fig. S1 E) without Rxrg upregulation (CT values >35, data not shown). The lack of RXRα and RXRβ signaling in AMs led to a pronounced reduction in the mAM population and a significant increase in ImmAMs (ImmAMs: CD11b+/SiglecF+) in both whole lung and bronchoalveolar lavage (BAL) of 9-wk-old mice (Fig. 1, A and B; and Fig. S1 F). The cDC1 and cDC2 populations and interstitial macrophages (IMs) remained unchanged under steady-state conditions in RXR-deficient lungs (Fig. S1, G and H). Analysis of other lung myeloid populations in Cd11cCre+Rxrabfl/fl mice revealed a reduction in the numbers of lung neutrophils, with no changes in eosinophils (Fig. 1 B and Fig. S1 I). BM hematopoiesis was maintained, and no changes were observed in peripheral blood (PB) neutrophil, eosinophil, or monocyte numbers (Fig. S1 J), suggesting that the reduction in lung neutrophils is due to impaired pulmonary recruitment of these cells in Cd11cCre+Rxrabfl/fl mice.

Histological analysis of lung sections demonstrated normal lung structure and alveolarization in Cd11cCre+Rxrabfl/fl mice (Fig. 1 C and Fig. S1 K). Notably, Oil Red O staining of BAL demonstrated a significant enrichment of foam cells (∼30% of total cells) (Fig. 1 D), and BODIPY staining showed significant lipid accumulation in RXR-deficient mAMs (Fig. 1 E and Fig. S1 L). Consistent with these findings, Cd11cCre+Rxrabfl/fl mice developed pulmonary alveolar proteinosis, evident from increased content of total proteins and phospholipids in BAL (Fig. S1 M), with no signs of lung edema (Fig. S1 N). Defective surfactant recycling by RXR-deficient AMs led to accumulation of all four surfactant proteins: SP-A, SP-B, SP-C, and SP-D (Fig. 1 F).

These results show that RXR signaling is required for the correct development of the AM population, including the reduction of CD11b surface marker expression. Additionally, the intracellular lipid accumulation in Cd11cCre+Rxrabfl/fl AMs demonstrates impaired AM function in the absence of RXRs, likely contributing to the accumulation of pulmonary alveolar surfactant proteins and phospholipids.

RXR-deficient AMs have reduced survival linked to lipotoxicity

To dissect the mechanism by which AM numbers are reduced after RXR deletion, we studied the balance between proliferation and apoptosis. Daily BrdU administration for 7 days revealed a higher rate of proliferation by mAMs from Cd11cCre+Rxrabfl/fl mice (Fig. 2, A–C), and the increased proliferation capacity of RXR-deficient mAMs was confirmed by Ki-67 and DAPI staining. The mAM population in Cd11cCre+Rxrabfl/fl mice contained ∼2% more cells in G2-S-M phase than the equivalent population in Rxrabfl/fl mice (Fig. 2, D and E), suggesting that RXR-deficient mAMs proliferate in an attempt to overcome the low cell numbers. Analysis of apoptosis by annexin V staining revealed a ∼15% higher proportion of apoptotic cells in the Cd11cCre+Rxrabfl/fl mAM population (Fig. 2, F and G). This result is in line with findings in RXR-deficient large cavity PMs (LPMs), which showed significant lipid accumulation in apoptotic cells (Casanova-Acebes et al., 2020). We found that the number of apoptotic cells with lipid accumulation was also higher in Cd11cCre+Rxrabfl/fl mAMs than in their Rxrabfl/fl counterparts (Fig. 2, H and I). Within the Cd11cCre+Rxrabfl/fl mAM population, the number of lipid–laden apoptotic cells was almost double that of lipid-free apoptotic cells (Fig. 2 H). These results indicate that the lower AM numbers in RXR-deficient mice is the consequence of lipotoxicity-induced apoptosis.

RXR controls postnatal AM maturation

Given the embryonic origin of AMs, we next explored the role of RXRs in early development. Rxra expression increased continuously from E18.5 to the first day after birth (DAB1) in preAMs and subsequently up to DAB10 in AMs (Fig. 3 A). The Cd11cCre model allows efficient recombination of floxed alleles from DAB5 (Schneider et al., 2014), allowing us to study the importance of RXR signaling for lung development in the postnatal period. Immediately after birth, AMs exist in a precursor state (preAMs), and Cre-mediated recombination of Pparg leads to the disruption of maturation into CD11b/CD11c+ mAMs (Schneider et al., 2014). The DAB1 preAM populations segregated into two subpopulations according to CD11b maturity marker expression in both Rxrabfl/fl and Cd11cCre+Rxrabfl/fl DAB1 mice (Fig. 3, B and C). However, by DAB5, Rxrabfl/f preAMs had already downregulated CD11b surface marker expression and matured into AMs, whereas DAB5 Cd11cCre+Rxrabfl/fl preAMs failed to downregulate CD11b and did not fully acquire a mature phenotype (Fig. 3, B and C). This immature state due to impaired CD11b downregulation in Cd11cCre+Rxrabfl/fl mice was maintained through DAB35 (Fig. 3, B and C) and up to 9 wk (Fig. 1, A and B). Taken together, these results demonstrate the importance of RXRs for the correct transition from initial AM precursors to the fully mAM phenotype.

RXRs regulate AM lipid metabolism, proliferation, and identity

We next investigated the molecular mechanism underlying the phenotype of RXR-deficient AMs by RNA sequencing (RNA-seq) in Rxrabfl/fl mAMs and Cd11cCre+Rxrabfl/fl mAMs and ImmAMs. The analysis revealed differences between the three groups, which were further analyzed by pairwise comparisons (Table S1). RXR deficiency in Cd11cCre+Rxrabfl/fl mAMs was characterized by 527 differentially expressed genes (adjusted P value [p-adj] ≤0.05) (Fig. 4, A and B). Among the >280 downregulated genes were several AM core genes, including Cd2, Cidec, Krt79, Cpne5, and Fabp1 (Gautier et al., 2012), as well as the myeloid master LDTF gene Spi1 (Gautier et al., 2012) and other AM-specific TF-encoding genes such as Lima1 and Maff (Gautier et al., 2012). The >230 upregulated genes included those encoding other metabolic enzymes such as Fbp1 (Li et al., 2020) and Sat1 (Fig. 4 B). PANTHER gene ontology (GO) term enrichment analysis indicated an association of the upregulated genes with cell activation and immune responses, whereas the downregulated genes were associated with metabolism-related terms, especially lipid metabolism (Fig. 4 C). Altered fatty-acid metabolism was confirmed by the specific detection of dysregulated genes (Fig. 5 A) and gene set enrichment analysis (GSEA) (Fig. 5 B). We also observed upregulation of genes involved in apoptosis (Fig. 5, C and D), confirming the results of the annexin V flow cytometry assays.

The largest transcriptional differences were found, however, in Cd11cCre+Rxrabfl/fl ImmAMs (Fig. 5, E and F), which had >6,000 dysregulated genes compared with Rxrabfl/fl mAMs (Fig. 5 G). The >3,000 downregulated genes included AM core genes (Ucp3 and Cidec) and AM canonical genes (Siglecf). Upregulated genes in Cd11cCre+Rxrabfl/fl ImmAMs included genes related to the complement response (C1qa, C1qb, and C1qc) and the monocyte gene Ccr2 (Fig. 5 G). GSEA analysis revealed downregulation of DNA repair and the E2F proliferation pathway (Fig. 5 H), supported by the large number of downregulated proliferation-related genes (Fig. 5 I). GO term enrichment analysis with PANTHER revealed that upregulated genes were related to cell differentiation, proliferation, and division, whereas downregulated genes were related to DNA replication and the cell cycle (Fig. 5 J). The gene expression profile of Cd11cCre+Rxrabfl/fl ImmAMs was more similar to that of a monocyte than of a mAM, suggesting that these CD11b+ AMs correspond to a less differentiated state (Fig. 4 D). These results support a model in which RXRs are required for AM maturation, such that their loss leads to an undifferentiated ImmAM phenotype in which lipid metabolism and survival are compromised. In addition, RXR may act through heterodimeric transcriptional complexes to regulate these processes.

Ingenuity pathway analysis (IPA) of upstream regulators identified RXRs and PPARγ as the most significant transcriptional regulators, supporting the idea that the RXR–PPARγ heterodimer controls many AM core genes, as well as those involved in AM-specific TF-encoding programs, lipid metabolism, apoptosis, and proliferation (Fig. S2 A). To further investigate co-regulation of these genes in AMs, we performed a comparative transcriptomic analysis integrating our RNA-seq data with publicly available PPARγ expression data in AMs (GSE60249) (Fig. S2, B–D). The gene expression profile confirmed co-regulation of numerous genes (Fig. S2, E–I). PANTHER GO enrichment analysis revealed functional similarities with our bulk RNA-seq data. Upregulated genes were predominantly linked to cell differentiation, migration, proliferation, apoptosis, and division, while downregulated genes were associated with cell cycle regulation and lipid metabolism (Fig. S2 J). These findings suggest that RXR–PPARγ heterodimerization plays a central role in orchestrating key biological processes in AMs.

To investigate the regulatory landscape of RXRs in AMs, we assayed chromatin accessibility by assay for transposase-accessible chromatin sequencing (ATAC-seq), revealing a marked correlation between chromatin accessibility and RNA-seq–based gene expression profiles (Fig. S3 A). Of the 9,662 differentially accessible regions identified, 5,962 were less accessible in the RXR-depleted mAMs (false discovery rate [FDR] ≤ 0.05), demonstrating a more closed chromatin status (Fig. 4 E and Table S2). Analysis of the distribution of distances between differentially accessible regions and the nearest gene transcription start site (TSS) revealed no significant differences between Rxrabfl/fl and Cd11cCre+Rxrabfl/fl mAMs, and similarly there were no differences in the association of these regions with a variety of genomic features (Fig. S3, B and C). To examine the functions potentially affected by the redistribution of chromatin accessibility in RXR-depleted mAMs, we compared the lists of genes associated, by proximity, with differentially accessible regions, defining those genes that were exclusively associated with open regions (1,928 genes) or closed regions (3,074 genes) in RXR-deficient mAMs (Fig. S3 D). Consistent with the RNA-seq analysis and phenotypic characterization, functional enrichment analysis revealed that genes exclusively linked to open regions were associated with terms related to apoptosis, migration, or proliferation, whereas genes exclusively linked to closed regions were associated with terms related to lipid metabolism (Fig. S3 E). Motif enrichment analysis showed that closed regions in Cd11cCre+Rxrabfl/fl mAMs were enriched in binding sites for key TFs for AM identity, including PU.1, ELF5, CEBP, PPAR, RXR, bHLH, and RUNX1 (McCowan et al., 2021; Sajti et al., 2020) (Fig. 4 F).

These alterations provide evidence that RXRs are key regulators of AM chromatin landscape and identity. To confirm this, we generated a genome-wide profile of RXR binding in mAMs by high-throughput ChIP combined with tagmentation-based library preparation (HT-ChIPmentation) (Gustafsson et al., 2019) in Rxrabfl/fl and Cd11cCre+Rxrabfl/fl mAMs (Table S3). Immunoprecipitation with anti-RXRα antibody identified 6,365 regions exclusive to Rxrabfl/fl mAMs, and a collection of 2,867 genes was identified as nearest to RXR-bound regions. Comparison of this gene collection with the genes detected as differentially expressed in bulk RNA-seq of Cd11cCre+Rxrabfl/fl mAMs suggested that RXRs directly control ∼30% of the dysregulated genes (Fig. 4 G). Among the genes assumed to be directly controlled by RXRs, we identified key TFs for AM specification (Spi1, Cebpb, Pparg, Bhlhe40, Bhlhe41, and Runx1), AM identity genes (Siglecf, Ucp3, Ctsk, Cd69, and Tlr2), receptors for AM-shaping cytokines (Csf2r2b and Tgfbr1/2), lipid metabolism genes (Fabp1, Abca1, and Abcg1), and apoptosis-related genes (Cd2, Prune, Klf6, and Naip1) (Fig. S3 F). Consistent with the phenotypic characterization, the genes directly controlled by RXRs were associated with terms related to cell death, proliferation, differentiation, and lipid metabolism (Fig. S3 G). Motif enrichment analysis for RXR-bound regions revealed RXR colocalization with many of the key TFs for AM identity, including STAT5 and SMAD4, the TFs downstream of GM-CSF and TGFβ (Fig. 4 H). This finding supports the idea that cooperation of RXRs with other TFs is needed to maintain the mAM regulatory landscape and mAM identity. Genome distribution analysis revealed that 10.82% of RXR peaks were located in promoters, 34.4% in intergenic regions, and 50% in intronic regions, indicating RXR action through enhancers in mAMs (Fig. 4 I). In parallel, we ran a histone H3 lysine 27 acetylation (H3K27ac) HT-ChIPmentation assay in mAMs, classifying H3K27ac peaks located outside a ±3 kb window around a TSS as putative enhancers (Table S4). The intersection of RXRα peaks with distance-discriminated H3K27ac peaks showed that RXR-binding sites were significantly more frequently associated with H3K27ac distal sites, implying that the most frequent interactions of RXRs are through putative enhancers (Fig. 4 J and Fig. S3 H). To gain comprehensive insight into the importance of RXR interactions and chromatin accessibility programming, we overlapped the differentially accessible ATAC-seq and RXRα HT-ChIPmentation peaks, revealing that ∼22% of the open peaks in Cd11cCre+Rxrabfl/fl mAMs coincided with RXR peaks. The coincidence increased to ∼34% for the closed peaks in Cd11cCre+Rxrabfl/fl mAMs (Fig. S3 I). ATAC-seq differential accessibility correlated with RXR and H3K27ac peaks for key identity TFs, AM-specific genes, and metabolic genes, exemplified, respectively, by Spi1, Ucp3, and Fabp1 (Fig. 4 K). To address whether the regulatory network is associated with PPARγ, we performed PPARγ HT-ChIPmentation (Table S5), finding that PPARγ-binding overlapped with RXR occupancy, consistent with RXR–PPARγ heterodimer-mediated transcriptional regulation (Fig. S2, K–O). These results substantiate the role of RXRs as key TFs in AMs, essential for the maintenance of a precise chromatin regulatory landscape and for the expression of the receptors for instructive cytokines and differentiation TFs.

RXR signaling is required for AM differentiation and maturation

Having shown the critical role of RXRs in AM maturation and identity, we next investigated if RXR signaling was also necessary for differentiation. For this, we characterized the recruitment of circulating monocytes into the lung and their differentiation into mAMs by crossing Cd11cCre+ mice with R26LSL-DTR mice. Following intratracheal administration of diphtheria toxin (DT), we analyzed myeloid populations in the lungs of Cd11cCre+R26LSL-DTR mice at 1, 4, 7, and 10 days (Fig. 6 A). DT treatment resulted in specific depletion of AMs and the recruitment of circulating monocytes within the first 24 h (Fig. 6 B). Repopulating AM-like cells continued to increase their CD11c and SiglecF expression at days 4 and 7 after DT. By 10 days after DT administration, repopulating cells differentiated into indistinguishable AMs (Fig. 6 B). We next measured key gene expression kinetics in monocytes, recruited monocytes, differentiating cells, and AMs. The recruited monocytes and repopulating AMs progressively acquired a gene expression profile similar to that of mature steady-state AMs. Differentiation and maturation over 10 days after DT treatment were accompanied by increasing expression of AM-core genes, including Cdh1, Ctsk, CD11a, and Mmp8 (Fig. 6 C); the pan-macrophage identity TF PU.1, encoding gene Spi1 (Fig. 6 D); and other AM-specific genes such as Cd11c and SiglecF (Fig. 6 E). Conversely, the expression of the monocyte-specific Ccr2 and CD11b were downregulated in the repopulating AMs (Fig. 6 F). Irf7, whose expression is needed for AM differentiation and development (Ning et al., 2011), was transiently upregulated in the first days after DT administration, but its expression had decreased by day 10 after DT (Fig. 6 F). Rxra expression also increased during the differentiation of recruited monocytes into AMs, suggesting that RXRα is needed for AM maturation and differentiation, whereas Rxrb expression was unaltered (Fig. 6 G). The expression of the RXR partner PPARγ (Pparg) increased (Fig. 6 G). The expression of the RXR targets Csf2rb and Tgfbr1, encoding the GM-CSF and TGFβ receptors, was increased upon recruitment of monocytes to the lung (Fig. 6 H). Tgfb1 gene expression was unaltered during differentiation (Fig. 6 I); however, Notch1, but not Notch2, was transiently upregulated (Fig. 6 J), suggesting a role of the Notch pathway during the initial differentiation stages. In addition, the M-CSF and G-CSF receptor genes, Csf1r and Csf3r, showed significant declines in expression following cell differentiation (Fig. 6 K). These results support the idea that lung-recruited monocytes gain a distinct gene expression pattern that includes AM-specific genes, cytokine receptors, and Rxra expression during their differentiation into mAMs.

The pattern of increasing Rxra expression in preAMs/AMs after birth (Fig. 3 A) and in differentiating recruited cells (Fig. 6 G) suggests that RXR signaling is necessary for AM differentiation and maturation. To confirm this, we used two approaches. First, we deleted RXRs during embryogenesis to study AM differentiation; for this, we used the VaviCre+ model, which drives efficient recombination in all hematopoietic cells (Georgiades et al., 2002). Early deletion of Rxra and Rxrb led to impaired differentiation and maturation of preAMs from E18.5 (Fig. 7, A and B). During postnatal development, the few remaining AMs were found exclusively with an immature phenotype up to 9 wk (Fig. 7, B and C). These results indicate that RXR signaling is necessary for embryonic and postnatal AM maturation and differentiation. Second, BM from either Rxrabfl/fl or Cd11cCre+Rxrabfl/fl CD45.2+ mice was combined with BM from WT CD45.1+ competitor mice in a 1:1 proportion and transplanted into lethally irradiated CD45.1+ CD45.2+ recipient mice (Fig. 7 D). No differences were observed in PB chimerism between recipients of Rxrabfl/fl or Cd11cCre+Rxrabfl/fl BM (Fig. 7 E). Transplanted Cd11cCre+Rxrabfl/fl BM cells failed to reconstitute the mAM population when in competition with WT cells (Fig. 7, F and G). Moreover, the ImmAM population was enriched in recipients of Cd11cCre+Rxrabfl/fl-derived cells (Fig. 7, F and G). This result shows that the deletion of RXR confers a competitive disadvantage for AM maturation. Together, our findings strongly support the idea that RXR signaling is critical for AM maturation and differentiation from embryonic development, through neonatal stages, and into adult life.

GM-CSF, TGFβ, and DLL4 induce RXR expression in AMs

To investigate the niche signals responsible for RXR gene induction in AMs, we analyzed cell-to-cell communication in the lung niche through a CellPhoneDB-based analysis (Efremova et al., 2020) using publicly available single-cell RNA-seq (scRNA-seq) data (Cohen et al., 2018). This analysis identified significant putative ligand–receptor pairs signaling either to AMs or to lung monocytes (Fig. S4 A). These interactions indicated that the known instructive niche-derived signals GM-CSF and TGFβ were signaling to AMs (Fig. 8 A), corroborating previous reports (Gschwend et al., 2021; Schneider et al., 2014; Cohen et al., 2018; Yu et al., 2017). We next differentiated BM progenitors by treating them for 3 days with M-CSF (generating M-BMprogs), followed by treatment with GM-CSF or TGFβ. Both treatments induced Rxra (Fig. 8, B and C) but failed to induce Rxrb, likely because Rxrb expression is characteristic of less committed cells (Menendez-Gutierrez et al., 2023). The treatment with GM-CSF also induced the Pparg gene (Fig. S4 B). Other putative interactions predicted by CellPhoneDB included TNFα, M-CSF, IL-4, IL-6, IL-1, IL-33, CCL3, CCL5, FGF2, and fibronectin (Fig. S4 A). None of these signals induced Rxra or Rxrb in differentiating progenitors (Fig. S4, C–G). Another ligand–receptor pairing identified in the CellPhoneDB analysis was endothelial DLL4 signaling to lung monocytes through NOTCH receptors (Fig. 8 A). DLL4 signaling has been shown to induce the expression of key LDTFs in differentiating monocytes and to be indispensable for Kupffer cell identity (Sakai et al., 2019; Bonnardel et al., 2019). Using RT-qPCR, we confirmed that in vitro DLL4 signaling induced Rxra and Rxrb expression in M-BMprogs (Fig. 8 D). Analysis of published RNA-seq data on M-BMprogs and BM monocytes demonstrated that cooperation between DLL4 and TGFβ can induce Rxra and Rxrb expression (Sakai et al., 2019) (Fig. 8 E). These cytokines also induced the RXR target genes Csf2rb and Tgfb1r, as well as other AM-related genes such as Siglecf, Cd11c, Cd11a, Mcam, and Kynu (Gautier et al., 2012) (Fig. 8 E). Considering the prevalence of GM-CSF expression in the alveolar niche, we also conducted in vitro experiments using GM-CSF as the background signal for progenitor differentiation. We differentiated BM progenitors with GM-CSF (GM-BMprogs) for 3 days and then tested the effect of exposure to TGFβ, DLL4, or both signals simultaneously (Fig. 8 F). Treatment with DLL4 alone induced the expression of Csf2rb, and TGFβ and DLL4 both individually induced Tgfb1r, with combined treatment having a greater effect (Fig. 8 G). These findings suggest that DLL4 signaling primes the differentiating cells to receive other signals from the alveolar niche, such as GM-CSF and TGFβ. TGFβ induced expression of Rxra and Pparg in GM-BMprogs (Fig. 8 H and Fig. S4 H), but treatment with DLL4 alone was unable to induce Rxra (Fig. 8 H), suggesting that Rxra expression induced by GM-CSF pre-treatment was already high and may have masked the DLL4-induced Rxra expression observed in M-BMprogs (Fig. 8, B and D). Rxrb expression in GM-BMprogs was induced only with DLL4 and not with TGFβ (Fig. 8 H). TGFβ and DLL4 were also required for the induction of many RXR target genes, including AM-specific genes such as Cd11c and Siglecf (Fig. S4 I), Abca1 and Tgfb1 (Fig. S4, J and K), and the AM-core genes CD11a and Ucp3 (Fig. S4 L). Although TGFβ and DLL4 did not affect gene expression of Notch2, TGFβ induced expression of Notch1, and the combination of both signals produced a synergistic effect (Fig. S4 M).

These results provide evidence that GM-CSF, TGFβ, and DLL4 act as cooperative niche signals necessary for the induction of Rxra and Rxrb in differentiating macrophages and for the expression of key genes for AM identity, some of these being direct RXR targets.

DLL4–NOTCH signaling is required for monocyte recruitment and AM maintenance

To investigate the importance of DLL4 signaling in AM differentiation, we used Cdh5Cre+ERTDll4fl/fl mice, which allowed us to delete Dll4 in ECs after tamoxifen injection in 9-wk-old mice (Fig. 8 I), from which time the contribution of monocytes to the AM pool is exponential (Liu et al., 2019). 2 wk after DLL4 deletion, the AM population was reduced by twofold relative to Dll4fl/fl mice (Fig. 8, J and K). Cdh5Cre+ERTDll4fl/fl mice had elevated numbers of circulating monocytes and blood neutrophils, excluding altered myelopoiesis as a possible cause of AM depletion (Fig. 8 L). To block NOTCH downstream signaling during monocyte recruitment and differentiation, we depleted the AM population in Cd11cCre+R26LSL-DTR mice by DT administration (Fig. 6 A) and then treated the mice with daily i.p. injections of the γ-secretase inhibitor LY-41157 (Sakai et al., 2019). Treatment with LY-41157 alone did not affect AM numbers (Fig. S4, N and O), as previously reported (Wong et al., 2004). FACS analysis at 1, 4, 7, and 10 days after treatment showed that, while Cd11cCre+R26LSL-DTR mice treated only with DT recovered lung AMs, mice treated with DT and LY-411575 failed to replenish the AM population from circulating monocytes (Fig. 8, M and N). These results led us to postulate that in vivo DLL4 directs the extravasation of circulating monocytes from the lung microcirculation to the alveolar lumen, where they receive GM-CSF and TGFβ signals from the cells of the niche. These niche-derived signals induce the expression of Rxr genes, which cooperatively promote the transcriptional and epigenetic changes that drive the differentiating monocytes to acquire final AM identity. To ascertain the extent to which our results reflect the human context, we examined publicly available scRNA-seq data from human lung (Travaglini et al., 2020). We identified >30 distinct cell types, encompassing epithelial cells, immune cells, interstitial cells, and cells of the lung vasculature (Fig. S4 P), and analyzed the expression of DLL4, GM-CSF, TGFβ, and their respective receptors. CellPhoneDB analysis showed DLL4 expression predominantly in the ECs of arteries and capillaries; moreover, consistent with our hypothesis, NOTCH2 was found in classical and nonclassical monocytes, as well as in other perivascular cells, including pericytes and ionocytes (Fig. S4 Q). ATII cells predominantly expressed GM-CSF, whereas the receptors for this cytokine were expressed on other cells, including AMs. The expression of TGFβ was widespread across various lung cell types, with their corresponding receptors also detected in a diverse range of cells that included macrophages. The analysis of human lung signals thus identified GM-CSF, TGFβ, DLL4, and their receptors as conserved features of the lung regulatory landscape and its preserved signaling niche.

Cooperation between RBPJ, RXR, SMAD, and STAT5 orchestrates AM identity

We next explored the potential interactions of RXR with the TFs acting downstream of GM-CSF, TGFβ, and DLL4: STAT5, SMAD4, and RBPJ, respectively. We used HT-ChIPmentation to generate a genome-wide profile of SMAD4 and RBPJ binding (Tables S6 and S7) and additionally accessed publicly available peak sets for STAT5 (GSM5625231, GM-CSF–treated cells) and RBPJ (GSE128662, DLL4-treated cells). HOMER motif enrichment analysis of STAT5, SMAD4, and RBPJ peaks showed enriched binding sites for key TFs for AM identity (ELF5, CEBP, PPARs, and bHLHE41), as well as the pan-macrophage LDTF PU.1 (Fig. 9 A). These peak sets were also enriched for motifs specific to RXRs and to the corresponding TF in each case (Fig. 9 A). To analyze the extent to which these factors collaborate in the determination of AM identity, we first explored the coinciding binding patterns of STAT5, SMAD4, RBPJ, and RXRα in the vicinities of the PU.1 gene Spi1, key AM-signaling elements for Csf2rb2 and Tgfbr2, and the AM-core genes Cdh1 and Mmp8 (Fig. 9 B). Matching peaks were also found in the regulatory elements of the macrophage transcriptional modulator Zeb2, the AM-specific integrin Cd11c, the apoptosis-related genes Casp4 and Ppt1, and the fatty-acid homeostasis-related genes Abca1 and Cd36 (Fig. S5, A and B). We found a set of 756 peaks that overlapped by at least one nucleotide across all four TF-binding patterns. Genome distribution analysis revealed that 5.95% of these shared peaks were located in promoters, 43.52% in intergenic regions, and 46.30% in intronic regions, indicating that the combined action of the four TFs in AMs takes place primarily through enhancers (Fig. 9 C). The intersection of the shared peaks with distance-discriminated H3K27ac showed an association with distal H3K27ac sites, confirming that cooperation among the four TFs occurs more frequently in enhancers (Fig. 9 D). The binding regions shared by STAT5, SMAD4, RBPJ, and RXR are preferentially and significantly located at distal regions (Fig. 9 D). Comparison of annotated genes for each experiment identified 1,342 overlapping genes for the four analyzed TFs (Fig. 9 E), including Spi1, Csf2rb2, and Tgfbr2 and nearly 40% of the AM-core genes (Fig. S5 C). Analysis of the differential combination of the three other TFs with RXRα revealed that they were responsible for the regulation of 87% of the AM-core genes (Fig. 9 F and Fig. S5 D). For RBPJ, our in vivo data and the published in vitro dataset revealed similar binding patterns, suggesting that the in vitro data constitute a valid tool for defining the in vivo RBPJ-binding landscape (Fig. S5, E and F). Consistent with these findings, analysis of batch-corrected publicly available RNA expression data confirmed that TGFβ (E-MTAB-6028), GM-CSF (GSE140645 and GSE193537), and DLL4 (GSE128662) regulate the expression of a large set of AM genes (Fig. S5 G).

The results presented here demonstrate that alveolar GM-CSF and TGFβ, together with DLL4 expressed on the ECs of the alveolar vasculature, induce the expression in AM precursors of a set of TFs that cooperate with RXRα during the induction and regulation of mAM identity. Through these interactions, RXR signaling controls AM maturation, maintenance, and function. The absence of phenotype upon Rxra deletion in myeloid cells (Casanova-Acebes et al., 2020; Menendez-Gutierrez et al., 2015; Menendez-Gutierrez et al., 2023) indicates that RXR subtypes can compensate for each other in AMs. Recent work has suggested differential roles for these receptors in AMs (Wang et al., 2024); however, the limited transcriptional impact of RXRβ targeting and the low efficiency of CRISPR/Cas9 editing reported in that study raise concerns about incomplete RXRβ deletion, which may underlie the apparent discrepancies between studies. We therefore crossed Rxrabfl/fl mice with mice harboring the driver Cd11cCre+ to generate Cd11cCre+Rxrabfl/fl mice, with deletion of Rxra and Rxrb in the AM lineage. RXR deletion in this model disrupted lipid processing, resulting in lipotoxicity-induced cell death and a low number of mAMs, with altered gene expression. In addition, the lack of RXRs resulted in the accumulation of ImmAMs arrested at an intermediate stage of AM differentiation and characterized by high CD11b expression and failure to upregulate SiglecF. Supporting this hypothesis, competitive BM transplantation showed that RXR-deficient cells fail to contribute to the mAM pool, supporting a cell-intrinsic role for RXRs in AM maturation. A similar phenotype has been described in RXR-deficient LPMs (Casanova-Acebes et al., 2020), suggesting that RXRs might be an indispensable TF for embryo-derived TRMs.

Recent studies have challenged the classical view that AMs are exclusively embryo-derived, suggesting that they can also be replenished by BM-derived monocytes. When BM-derived monocytes infiltrate tissues, they undergo transcriptional changes resulting in phenocopy of embryo-derived macrophages (Bain et al., 2016; Cain et al., 2013). This maturation process could be also impaired in the absence of RXRs. Further dissection of this phenomenon would require cell-tracking assays or mouse models allowing the apoptotic and remaining embryo-derived AMs to be distinguished from the incoming BM cells.

Our transcriptomic data indicate that RXR-deficient AMs downregulate lipid metabolic processes and have an enhanced rate of cell death. The RNA-seq data revealed that RXRs control the expression of many AM-core genes and TFs important for AM identity. Furthermore, lack of RXRs also disrupted expression of the receptors for two key instructive signals of AM identity, GM-CSF and TGFβ (Guilliams et al., 2013; Yu et al., 2017). Unable to receive these instructive niche signals, RXR-deficient AM precursors do not undergo the required definitive transcriptional changes. This could account for the observed immature phenotype of RXR-deficient AMs. Our findings also show that RXRs are needed to maintain a chromatin landscape that allows AM-identity TFs to bind and function. Deleting RXRs in AMs results in a general loss of chromatin accessibility without a reorganization of specific genomic sites. Interestingly, studies with RXR-deficient LPMs showed that there were no changes in chromatin openness and that open peaks were rearranged toward distal regions (Casanova-Acebes et al., 2020). Other studies have also shown that the lack of RXR in dormant long-term hematopoietic stem cells results in chromatin opening and a reorganization of promoters and intergenic regions (Menendez-Gutierrez et al., 2023). These differing patterns of altered chromatin accessibility upon RXR deletion might suggest that RXRs control chromatin structure in a cell type–specific manner.

The results of our combined transcriptomic and HT-ChIPmentation analysis highlight the pivotal role of RXRs in establishing AM population and identity, demonstrating that they control the expression of LDTFs that regulate the macrophage-core program, including Spi1, Cebpb, and Runx1, as well as other important AM TFs, such as Pparg and Bhlhe40/41, that drive the functional specialization of AMs in the alveolus. The functional identity of TRMs develops through the activation of specific functional modules by distinct TFs, shaping and complementing the core macrophage program to specialize each macrophage subset (T'Jonck et al., 2018). In this regard, the large downstream TF network governed by RXRs in AMs, together with the regulation of key identity and function genes, explains the nonfunctional immature phenotype observed upon their deletion. The motif enrichment analysis of the RXR peaks indicates that RXRs cooperate with other nuclear receptors, including PPARs. Interestingly, PPARγ-deficient lungs exhibit reduced numbers of AMs in adulthood and during development, and these cells have an immature phenotype and accumulate lipids (Schneider et al., 2014). The similar transcriptomic profiles of RXR and PPARγ, together with their overlapping binding site occupancy in the HT-ChIPmentation analysis, provide strong evidence for a shared gene regulatory network driven by RXR–PPARγ heterodimerization in AMs. This suggests that the phenotype of RXR-deficient AMs might be explained by the loss of heterodimerization with PPARγ. However, RXRs also form heterodimers with other nuclear receptors expressed in AMs, such as RAR or LXR (Gautier et al., 2012), as well as RXR homodimers, and possible roles for these pairings cannot be discarded. Although the survival of the macrophage in its niche often depends on the activation of functional specialization modules, this specialization may not be significant in steady-state conditions (T'Jonck et al., 2018). Further investigation of the importance of RXRs in the functional specialization of AMs would therefore require the use of damage and inflammation models.

The induced depletion of AMs showed that circulating monocytes are recruited to the lung and rapidly downregulate monocyte-specific genes while initiating the expression of AM-specific genes and the receptors for the alveolar cytokines GM-CSF and TGFβ. In this transcriptional shift, the expression of RXRs is promptly induced, supporting the idea that RXRs are key TFs for AM differentiation and identity acquisition. The contribution of circulating monocytes to the AM population requires DLL4, as demonstrated both by the inducible deletion of DLL4 in 9-wk-old mice and by the blockade of the NOTCH signaling pathway in AM-depleted lungs. Previous studies in TRMs indicated that AMs are maintained locally, with a minimal contribution from BM-derived monocytes (Hashimoto et al., 2013; Hu and Christman, 2019; Ginhoux and Guilliams, 2016). However, our observations show that AMs are not a fully self-sufficient population and that they receive a time-dependent contribution from circulating monocytes. Consistent with our results, published fate mapping studies show that age-dependent lung growth indeed requires a contribution to the AM pool from BM cells (Joshi et al., 2018), especially from 8 wk of age (Gomez Perdiguero et al., 2015; Liu et al., 2019). Our results demonstrate that DLL4, through its collaboration with GM-CSF and TGFβ, is necessary for the complete induction of Rxra and Rxrb. Importantly, the receptors of GM-CSF and TGFβ are targets of RXRs, implying that DLL4 signaling triggers an RXR-dependent positive feedback loop. The AM population was completely reconstituted within the first 10 days after treatment of Cd11cCre+R26LSL-DTR mice with DT. However, AM reconstitution was blocked in mice treated with the Notch pathway inhibitor LY-411575. This suggests that at least in this time frame, the alveoli are repopulated predominantly by recruited monocytes and that the contribution to the AM pool from other cells, such as IMs, is not significant. The induction of a specific macrophage transcriptional landscape is dependent on the sensing of specific niche-derived signals (T'Jonck et al., 2018). For example, PMs transplanted into the alveolar niche receive lung-derived signals that induce the loss of peritoneal markers and the acquisition of those characteristic of AM identity (Lavin et al., 2014). Moreover, AMs extracted from the lungs change their phenotype even in the presence of GM-CSF, although phenotype is restored upon reinsertion into the alveolar niche (Subramanian et al., 2022). In this regard, our results demonstrate that not only the instructive GM-CSF and TGFβ but also endothelial cell–expressed DLL4 act as cooperative lung signals through RXRs to shape the epigenetic and transcriptional footprint of AMs in recruited and repopulating cells and might be essential for maintenance of the AM phenotype ex vivo. The cross validation between our in vitro studies and the human scRNA-Seq data underscores the physiological relevance of these conserved signaling pathways to both mouse and human lung biology. Our discovery paves the way for future translational research, offering a promising field for the development of targeted interventions and therapeutic strategies. Taken together, our results demonstrate that DLL4 acts as an initial signal that permits the recruitment of differentiating monocytes to the lung and triggers the RXR-dependent program to receive AM key niche cytokines.

Our results further highlight the importance of tissue signals as determinants of TRM identity (Guilliams et al., 2020). We provide evidence that RXRs interact collaboratively with other TFs to specify the AM regulatory landscape and the core AM gene network. Our comprehensive analysis, including ChIP sequencing (ChIP-seq) and motif-enrichment analysis, establishes a hierarchical relationship among STAT5, SMAD4, RBPJ, and RXR. RBPJ has binding peaks at the Rxra and Rxrb loci, indicating direct regulation of RXRs. STAT5 and SMAD4 also have peaks at the Rxra locus, confirming the role of GM-CSF and TGFβ in the induction of RXR expression. The analysis of motif enrichments in the peaks of each of these TFs confirmed the presence of binding motifs for the other TFs in the set, reaffirming the cooperation between them. The colocalization of these proteins in the vicinity of genes such as Spi1 and Zeb2 suggests a mechanism in which the collaboration of these TFs creates positive feedback loops that reinforce the expression of key LDTFs for macrophage differentiation. Moreover, the importance of cooperation between STAT5, SMAD4, RBPJ, and RXRs is underscored by the existence of common peaks for these TFs in genes involved in alveolar niche signaling and AM-core gene expression. Although our study focuses on these TFs, it would be premature to rule out possible roles in AM-identity acquisition of other TFs such as CEBP or ELF5, TF repressors such as bHLHEs, or other nuclear receptors, including PPARs. Together with the results of the AM depletion experiments, the ChIP-seq and motif-enrichment analysis support a model in which interaction with ECs in the alveolar vasculature induces infiltrating monocytes to extravasate to the alveoli, where they receive coordinated niche signals that rapidly upregulate the expression of RXRs. In turn, RXRs act as master TFs and collaborate with STAT5, SMAD4, and RBPJ to regulate the expression of AM-core genes. Thus, in this model, DLL4 from the endothelium and TGFβ and GM-CSF from the alveolar niche trigger a process of specialization in which the infiltrating monocyte acquires the phenotypic and functional characteristics that define AM identity.

The importance of macrophage RXR expression has been substantiated in several pathological contexts (Lefebvre et al., 2010; Perez et al., 2012; Rőszer et al., 2013). Future studies are warranted to further explore the signaling pathways and TF cooperation elucidated here. Furthermore, elucidation of the specific RXR ligand in AMs holds promise for the development of treatments for diseases associated with AM dysfunction, including alveolar proteinosis, cancer, and COVID-19. Our approach, encompassing in vitro, in vivo, and genome-wide analyses, unveils the intricate regulation, organization, and functional importance of TFs in response to described instructive niche signals. Moreover, we provide insight into the mechanism underlying the differentiation of circulating monocytes into mAMs, with a particular emphasis on the indispensable role of the nuclear receptor RXR in determining AM identity.

Mice

All mice used in this study (both male and female) had the C57BL/6J background and were housed (from two to five animals per cage) under a 12 h light/dark cycle at a constant temperature of 23°C with ad libitum access to food and water. All experiments were performed according to local ethical guidelines and were approved by the Animal Subjects Committee of the Instituto de Salud Carlos III (Madrid, Spain) in accordance with EU Directive 86/609/EEC. The mouse models used in this study were LysMCre+ (Clausen et al., 1999), Cd11cCre+ (Brocker et al., 1997), and VaviCre+ (de Boer et al., 2003). To conditionally delete Rxra and Rxrb, these lines were crossed with Rxrabfl/fl mice, generating LysMCre+Rxrafl/flRxrbfl/fl mice (LysMCre+Rxrabfl/fl), Cd11cCre+Rxrafl/flRxrbfl/fl mice (Cd11cCre+Rxrabfl/fl), and VaviCre+Rxrafl/flRxrbfl/fl mice (VaviCre+Rxrabfl/fl) (Casanova-Acebes et al., 2020; Menendez-Gutierrez et al., 2023). Rxrabfl/fl littermates were used as controls. Rxrbfl/fl mice were kindly provided by D. Metzger (Institute of Genetics, Molecular and Cellular Biology, Illkirch-Graffenstaden, France). To conditionally delete Dll4 in ECs, we crossed Tg(Cdh5-CreERT2) mice with Dll4fl/fl mice (Fernández-Chacón et al., 2023). To induce CreERT2 activity in adult mice, mice received i.p. injections of 2 mg tamoxifen dissolved in corn oil on three consecutive days, as previously described (Fernández-Chacón et al., 2023), and were analyzed 2 wk after the last injection. Littermates carrying the Dll4fl/fl allele but no Cre transgene also received tamoxifen injections and were used as controls. To characterize the recruitment of monocytes upon AM ablation, we crossed Cd11cCre+ mice with R26LSL-DTR mice (Buch et al., 2005). The resulting Cd11cCre+R26LSL-DTR mice were intratracheally instilled with a saline solution of 100 ng unnicked Corynebacterium DT (Sigma-Aldrich). Male and female mice were studied from E18.5 to 9–11 wk of age. Before tissue harvesting, embryos and neonatal mice from DAB0-DAB5 were sacrificed by decapitation. For DAB10-11 wk-old and older mice, mice were sacrificed by asphyxiation in a carbon dioxide (CO2) chamber.

Mice were genotyped by PCR with the following primers: P1 and P2 for floxed Rxra (800 bp floxed band); XO141 and WS55 for floxed Rxrb (270 bp floxed band); Cre1 and Cre2 for Cre in Cre-baring models (450 bp); DLL4fl-F and DLL4fl-R primers for the floxed Dll4 allele (500 bp floxed band). The Cre allele in Cdh5Cre+ERT mice was directly detected with CreM-F and CreM-R primers (550 bp). Primer sequences are provided in Table S8.

Cell isolation

Cell suspensions were obtained from lungs, BAL, and PB. For BAL, the alveolar cavities of adult mice were washed seven times with 1 ml of sterile PBS containing 1% FBS and 10 mM EDTA. PB samples (20–100 μl) were obtained by puncture of the facial vein and subsequent erythrocyte lysis for 5 min with 1 ml of RBC Lysis Buffer (eBioscience). For lung homogenates, lungs were chopped finely and digested at 37°C for 30 min with 0.8 mg/ml collagenase type IV (Sigma-Aldrich). The lung homogenates were then syringed through an 18-G needle 15 times, and the resulting cell suspension was passed through a 100-µM nylon filter. Any remaining RBCs were lysed by addition of 500 μl RBC Lysis Buffer and incubation for 3 min. After lysis, cell preparations were centrifuged at 1,500 rpm for 5 min, and pelleted cells were resuspended for subsequent assays.

Flow cytometry

Cell suspensions (up to 10 × 106 cells) were blocked with an anti-CD16/32 antibody (BioLegend) and then stained for 30 min at 4°C with appropriate antibodies (full list in Table S9). Unbound antibodies were washed off with 500 μl of 0.5% BSA in PBS. Cell suspensions were prepared for flow cytometry analysis in 250 μl 0.5% BSA/PBS containing 10 µg/ml DAPI. For apoptosis studies, cells were labeled with anti-Annexin-V antibody (BioLegend) in Annexin-V buffer (BD Biosciences). After washing, cells were stained with DAPI and analyzed by FACS within 1 h after labeling. For the study of BrdU incorporation in proliferating cells, mice received seven daily i.p. injections of 1 mg BrdU (BD Biosciences). Lungs were harvested 24 h after the last BrdU injection. Incorporated BrdU was detected according to the FITC BrdU flow kit instruction manual (BD Biosciences). For Ki-67 assay, cells were fixed and permeabilized with the Foxp3 staining buffer set (Thermo Fischer Scientific) and incubated with anti-Ki-67 antibody (BioLegend) and DAPI. For BODIPY staining, cells were incubated for 20 min at 4°C with BODIPY493/503. Flow cytometry was performed with Spectral (SONY), Fortessa (BD, Biosciences), and Canto 3L (BD, Biosciences) analyzers, and data analysis (including t-SNE representation) was performed with FlowJo 10.4.2 software. For sorting, we used customized FACSAria II and FACSAria Fusion flow cytometers (BD Biosciences) or a customized SY3200 Cell Sorter (SONY).

Histological analysis

Lungs were fixed for 48 h in 4% paraformaldehyde (PFA). Lung preparations were incubated in 70% ethanol and subsequently embedded in paraffin for sectioning Microtome sections (5 μm) were cut and stained with H&E or processed for elastic Van Gieson staining. Tissue sections were scanned using NanoZoomer-2.0RS C110730, and images were analyzed with the NDP.2 viewer.

Oil Red O staining

Cell suspensions obtained from BAL were cytospun at 600 rpm for 5 min at room temperature (RT). Cytospin preparations were washed with PBS, and cells were fixed for 24 h with 4% PFA. Cells were washed once with 60% isopropanol and left to dry overnight. Preparations were then stained with 500 μl Oil Red O for 15 min at RT and washed once with distilled water. Preparations were then incubated in hematoxylin for 30 s and received a final distilled water wash. NanoZoomer-2.0RS C110730 was used to scan tissue sections and later analyzed using the NDP.2 viewer.

Quantification of BAL proteins and phospholipids

Cell-free BAL supernatant was obtained by centrifugation for 5 min at 700 g and 4°C. Total BAL protein concentration was measured in cell-free BAL supernatants by the Lowry method modified by the addition of SDS (Casals et al., 1998). Lipids were extracted with chloroform and methanol (Casals et al., 1989; Casals et al., 1998). BAL phospholipids were quantified by phosphorus analysis, and phosphatidylcholine concentration was measured with enzymatic methods (Spinreact) (Casals et al., 2003).

Western blot analysis of surfactant proteins

The four surfactant proteins SP-A, -B, -C, and -D were detected by western blot, as described (Casals et al., 2003). SP-A and SP-B were detected using anti–human-SP-A and anti-porcine SP-B polyclonal antibodies prepared in our laboratory. SP-C was detected using an anti-recombinant human SP-C polyclonal antibody kindly provided by Nycomed Pharma. SP-D was detected with an anti-SP-D mAb (1A10A9; Seven Hills Bioreagents). Bound primary antibodies were detected by incubation of blots with appropriate secondary antibodies (Sigma-Aldrich) and revealed with chemiluminescence (Amersham ECL Select, GE Healthcare). Protein bands were quantified by densitometry using Quantity One software (Bio-Rad Laboratories).

Competitive BM transplant

CD45.1+CD45.2+ recipient mice were lethally irradiated with two doses of 5.5 Gy, with doses separated by a 4-h interval. Mice were reconstituted 1 h after the final radiation dose with 2.5 × 10⁶ BM cells from Rxrabfl/fl or Cd11cCre+Rxrabfl/fl CD45.2+ mice together with an equal number of BM cells from CD45.1+ WT mice. Chimerism was assessed in PB 4, 8, or 16 wk after reconstitution. Lung cells were collected and analyzed at the experimental endpoint.

qPCR

Total RNA was isolated with Trizol (Sigma-Aldrich) and Max Extract High Density tubes (Qiagen) or with the Arcturus PicoPure RNA Isolation Kit (Thermo Fischer Scientific). Transcripts were quantified using the AB7900-FAST-384 system with a two-step reverse-transcription qPCR process. Gene expression values were normalized to the housekeeping genes 36b4 and cyclophilin and presented as relative mRNA levels or fold differences compared with littermate control mice. Data were analyzed using qBASE software (Biogazelle). Primer sequences are listed in Table S8.

Bulk RNA-seq

Total RNA was extracted from sorted mAMs and ImmAMs from BAL (40,000 cells). Cells were lysed in RLT buffer, and RNA was extracted according to the RNeasy Mini Kit protocol (Qiagen). RNA quality and concentration were measured by RNA 6000 Nano Assay (Agilent Technologies) in a Bioanalyzer 2100 instrument. RNA-seq libraries were prepared with the NEBNext Ultra II Directional RNA Library preparation kit (New England Biolabs). Sequencing was performed in a NextSeq 2000 system (Illumina) to generate 60-base single-end reads. Sequencing reads were preprocessed with a pipeline that used FastQC to assess read quality and Cutadapt to trim sequencing reads, eliminate Illumina adapter contaminations, and discard reads <30 bp. The resulting reads were mapped against reference transcriptome GRCm38_99 and quantified using RSEM (Li and Dewey, 2011). The percentage of reads participating in at least one reported alignment was ∼84%. Expected expression counts calculated with RSEM were then processed with an analysis pipeline that used the Bioconductor package Limma (Ritchie et al., 2015) to normalize (by the TMM method) and to test differential expression, taking into account only those genes expressed with at least 1 count per million in at least three samples. Changes in gene expression were considered significant if associated with a Benjamini and Hochberg p-adj <0.05. Functional enrichment analyses were performed with PANTHER (http://pantherdb.org/), QIAGEN’s IPA and GSEA (https://www.gsea-msigdb.org/gsea/index.jsp). Significantly enriched functions or regulators were identified by applying Benjamini and Hochberg p-adj thresholds <0.05 for PANTHER and IPA and FDR q_value <0.25 for GSEA. RNA-seq quality data are provided in Table S10.

ATAC-seq

Epigenomic profiling of chromatin accessibility was assessed by ATAC-seq as described by Buenrostro et al. (2015). The protocol was as described by Menendez-Gutierrez et al. (2023). AMs from BAL (20,000 per replicate) were centrifuged at 500 g for 20 min at 4°C. Cells were lysed (10 mM Tris-HCl, pH 7.4, 10 mM MgCl2, and 0.1% IGEPAL CA-630), and nuclei were pelleted. For the transposase reaction, 20,000 isolated nuclei were incubated for 30 min at 37°C with 2.5 μl per sample of Tn5 from the Nextera DNA Library Preparation Kit (Illumina). SDS was then added to 1% vol/vol, and the incubation continued for 5 min at RT. DNA was purified with the ChIP DNA Clean & Concentrator kit (Zymo). PCR amplification and barcoding were done with the primers described by Buenrostro et al. (2015). PCR reactions included 11 μl NEB2 × PCR Mix (New England Biolabs), 10 μl tagmented DNA, 0.2 μl primer Ad_ no Mx (forward), and 0.2 μl barcoded reverse primer (Ad_2.1 to Ad_2.8) (primer sequences are listed in Table S8). The first PCR program was 72°C for 5 min; 98°C for 30 s; and 5 cycles of 98°C for 10 s, 63°C for 30 s, and 72°C for 1 min, with the temperature reducing to 4°C after the final cycle. DNA was size selected with 0.65 × volume SPRI beads (Agencourt AMPure, Beckman Coulter) and cleaned with 1.5 × SPRI beads. The second PCR program was 98°C for 30 s, followed by four cycles of 98°C for 10 s, 63°C for 30 s, and 72°C for 1 min. Libraries were purified with 1.5 × SPRI beads, concentration was measured with the Qbit dsDNA HS Assay kit (Thermo Fischer Scientific), and fragment profiles were analyzed with the Bioanalyzer DNA High Sensitivity Kit (Agilent). Libraries were sequenced in 2 × 50 HiSeq 3000 instrument (Illumina), with an average of 25 million paired-end reads per sample.

Reads were analyzed as in Menendez-Gutierrez et al. (2023). After merging of reads corresponding to the same sample, Cutadapt version 1.7.1 was used to trim adapters (Martin, 2011). Trimmed paired-end reads were aligned to the mm10 mouse reference genome using Bowtie2 version 4.1.2 (Langmead and Salzberg, 2012) with settings “-X 2000 -very-sensitive” in paired-end mode. Duplicates were marked with PICARD tools (http://picard.sourceforge.net). Alignments were filtered with samtools version 0.1.18 (Li et al., 2009) to keep only non-duplicated, paired, and properly mapped reads, as well as by alignment quality (>Q30). Peak calling was performed with MACS3 version 3.0.0a5 (Zhang et al., 2008) with parameters “-nomodel -shift −100 -extsize 200 -qval 0.05.” A consensus peak set of peaks detected in at least two samples was generated using DiffBind R package version 2.6.6 (function dba.counts) (Stark and Brown, 2011; Ross-Innes et al., 2012). EdgeR version 3.20.9 (Robinson et al., 2010) was used to perform differential accessibility using DiffBind functions (dba.analyze). Regions with differential accessibility were defined by FDR <0.05. Peak annotation, including the identification of the nearest gene TSS, was attained with the command annotatePeaks.pl in HOMER version 4.10.3 (Heinz et al., 2010). TF motif enrichment analyses were performed with the HOMER command findMotifsGenome.pl. RXR-deficient model-specific peaks with increased accessibility were compared with Rxrabfl/fl-specific peaks and vice versa, and genomic heatmaps were created with deepTools2 [62] via Galaxy (https://usegalaxy.org/). ATAC-seq quality data are provided in Table S10.

ChIP and sequencing with HT-ChIPmentation

Binding of RXR, SMAD4, RBPJ, PPARγ, and H3K27Ac was assessed by HT-ChIPmentation in AMs isolated from BAL (100,000–200,000 cells) of 9-wk-old WT C57BL/6J mice, following the protocol of Gustafsson et al. (2019). Briefly, after cell labeling for flow cytometry, cells were fixed in 2% FBS/PBS containing 1% formaldehyde for 10 min at RT. Fixation was stopped by adding 1 volume of 1 M glycine and incubating for an additional 10 min at RT. Cells were centrifuged at 2,000 g for 10 min at 4°C, then washed with 1 volume of 0.1 M glycine and centrifuged again. Cells were sorted, resuspended in 100 μl lysis buffer (50 mM Tris/HCL, pH 8.0, 0.5% SDS, and 10 mM EDTA), supplemented with complete EDTA-free protease inhibitor (Roche), and stored at −80°C overnight. The next day, cell suspensions were kept at 4°C for >20 min prior to sonication. For RXR, SMAD4, and H3K27ac, samples were placed in 130-μl Covaris AFA fiber tubes and sonicated with a Covaris S220 sonicator for 12 min (duty 5%, cycles per burst: 200, and PIP 140). For RBPJ, PPARγ, and H3K27ac, samples were transferred to eight-tube AFA bead strips and sonicated for 15 min using a Covaris E220 sonicator (duty 5%, cycles per burst: 200, and PIP 140). After sonication, SDS was neutralized by adding 6 μl 20% Triton X-100 (final concentration ≈1%), and 2 μl 50× protease inhibitors were added. Lysed cell suspensions were mixed with 50 μl ChIPmentation dilution buffer (50 mM Tris/HCL, pH 8.0, 225 mM NaCl, 0.15% Na deoxycholate [DOC], and 1.5% Triton X 100) containing previously coupled 10 μl protein G dynabeads (Thermo Fischer Scientific and Invitrogen) with 4 μg anti-RXRα (Proteintech), 3 μg anti-SMAD4 (Cell Signaling), 0.5 μg anti-RBPJ (Abcam), 1 μg anti-PPARγ (Diagenode), or 0.5 μg anti-H3K27ac (Active Motif, Cell Signaling). The mixture was incubated overnight at 4°C with rotation. Bead-bound chromatin was washed sequentially once each with the following buffers using the SMARTer-Seq Magnetic Separator for PCR strips (Takara Bio): wash buffer I (50 mM Tris/HCL, pH 8.0, 150 mM NaCl, 0.1% SDS, 0.1% NaDOC, 1% Triton X 100, and 1 mM EDTA, pH 8.0), wash buffer II (50 mM Tris/HCL, pH 8.0, 500 mM NaCl, 0.1% SDS, 0.1% NaDOC, 1% Triton X 100, and 1 mM EDTA, pH 8.0), and wash buffer III (10 mM Tris/HCL, pH 8.0, 250 mM LiCl, 0.5% NP-40, 0.5% NaDOC, and 1 mM EDTA, pH 8.0). These steps were followed by two washes with TE (10 mM Tris/HCl and 1 mM EDTA, pH 8.0) and another two washes with cold Tris/HCl 10 mM, pH 8.0. Washed bead-bound chromatin was resuspended in 30 μl 1× tagmentation buffer +1 μl Tagment DNA enzyme (Illumina) and incubated for 10 min at 37°C. Samples were then washed twice with wash buffer I, and the bead-bound tagmented chromatin was resuspended in a solution combining 25 μl NEB2 × PCR Mix (New England Biolabs), 23 μl distilled water, and the primers described by Buenrostro et al. (2015) for barcoding: 1 μl Ad_no Mx forward nonbarcoded primer + 1 μl barcoded primers (Ad_2.1 to Ad_2.7 sequences are listed in Table S8). The PCR program was 72°C for 5 min; 95°C for 5 min; 98°C for 30 s; and 11 cycles of 98°C for 10 s, 63°C for 30 s, and 72°C for 3 min, with the temperature reducing to 4°C after the final cycle. After library preparation, DNA was size selected with SPRI beads (Agencourt AMPure, Beckman Coulter) in a 1:1 proportion. Library DNA was released from SPRI beads by incubation with 14 μl distilled water. Sequencing reads were processed as described for ATAC-seq, but using input sample controls and default parameters for peak calling with MACS3, including the use of “-q 0.05” as the FDR cutoff. Genomic heatmaps were generated with deepTools2 (Ramírez et al., 2016). Other data manipulations and graphical representations (bar and volcano plots) were produced with R and GraphPad Prism version 9. Quality data for HT-ChIPmentation sequencing are provided in Table S10.

CellPhoneDB ligand–receptor analysis

To infer cell–cell communication in the lung, we used publicly available mouse and human lung scRNA-seq data (GSE119228 and EGAS00001004344, respectively) (Cohen et al., 2018; Travaglini et al., 2020). For mouse data, we reanalyzed the experiment from the raw counts provided using the R packages scater (McCarthy et al., 2017) and Seurat (Hao et al., 2021). First, we selected high quality cells based on the following criteria: annotated as a single cell per well, between 500 and 20,000 counts, over 250 genes detected, below 15% MT content, below 25% counts on ERCC control probes, below 65% counts in the top 50 expressed genes, and below 0.1% counts in hemoglobin genes. Resulting cells were clustered with the following main parametrization: top 1,000 variable genes, 10 principal components for neighbor graph and umap generation, and 0.5 as clustering resolution. Resulting clusters were manually annotated according to marker expression: neumocyte type 1 (AT1) (Akap5), neumocyte type 2 (AT2) (Lamp3), B cells (Cd19), basophils (Cd69), ciliated cells (Sec14l3), endothelial cells (Cdh5), eosinophils (Csf1r and Siglecf), fibroblasts (Col1a2 and Mfap4), ILC (Rora), macrophages (Ear2), mesenchymal stromal cells (Ly6a), monocytes (F13a1), neutrophils (S1009a and Retnlg), NK cells (Ccl5), other epithelial cells (Igf2), pericytes (Col1a2, Gucy1a3), smooth muscle cells (Enpp2), and T cells (Trbc2). Then, batches from MER1 experiment were removed, and the remaining data were analyzed for curated ligand–receptor pairs using CellPhoneDB version 2.0 statistical_analysis method as described in the published protocol with the following parameters: database v4.0.0, result-precision 7, threshold 0.005, and 500 iterations (Efremova et al., 2020). Selected significant interactions with monocytes and macrophages as targets were represented using R tools. (Some CellPhone version 4 database interactions were inverted to reflect the receptor nature of the molecule as target and ligand as source). For human data, we selected the normal lung datasets (Seurat objects) from patients 1–3 and integrated them using the reciprocal PCA method implemented in Seurat. Some cell labels from similar cell types were fused to simplify the analysis. Cell communication was inferred using LIANA version 0.1.12 (Dimitrov et al., 2022). The liana_wrap function was run with default parameters, and the output was aggregated using the liana_aggregate function. Results were filtered using an aggregate_rank <0.01, and LIANA plot functions were used to display them. Ligand–receptor expression plots were generated using normalized data from the integrated Seurat object.

In vitro treatments

Cells were cultured at 37°C and 5% CO2 in complete RPMI supplemented with 10% FBS and 1% penicillin + streptomycin. To obtain BM progenitor cultures, 10 million flushed BM cells from C57BL/6J mice were cultured for 24 h in non-tissue culture dishes. Progenitors were then differentiated for 3 days with 20 ng/ml M-CSF to generate M-CSF–derived BM progenitors (M-BMprogs) or with 30 ng/ml GM-CSF to generate GM-CSF–derived BM progenitors (GM-BMprogs). After differentiation, adherent cells were re-cultured in 24-well culture plates as follows: 0.5 × 10⁶ cells per well were cultured in 0.5 ml fresh medium supplemented with 20 ng/ml M-CSF or 30 ng/ml GM-CSF plus 0.5 ml of the corresponding previous cell culture medium. During replating, the following stimuli were added alone or in the required combination for 24 h: DLL4 (1 μg/ml, R&D systems), GM-CSF (10 ng/ml, PeproTech), TGF-β1 (10 ng/ml, Abcam), TNFα (10 ng/ml, Sigma-Aldrich), M-CSF (10 ng/ml, PeproTech), IL-4 (10 ng/ml, R&D systems), IL-6 (10 ng/ml, Chemicon International), IL-1 (10 ng/ml, PeproTech), IL-33 (30 ng/ml, PeproTech), CCL3 (10 ng/ml, PeproTech), CCL5 (20 ng/ml, PeproTech), and FGF2 (50 ng/ml, Thermo Fischer Scientific). For DLL4 stimulation, culture-treated plates were previously coated with 1 μg/ml DLL4 for 1 h at RT. A similar pre-coating procedure was used for fibronectin (5 μg/ml, Sigma-Aldrich).

DLL4 signaling inhibition

To induce AM ablation, Cd11cCre+R26LSL-DTR mice were intratracheally instilled with PBS containing 100 ng unnicked Corynebacterium DT (Sigma-Aldrich). When required, mice subsequently received daily i.p. injections of 10 mg/kg LY-411575 (MedChem) dissolved in 1:9 DMSO:corn oil for 1, 4, 7, or 10 days. Lungs were then isolated and processed, and lung populations were analyzed by FACS.

Statistics

The statistical significance of differences between conditions and treatments was analyzed with GraphPad Prism. The statistical tests used were the Student t test and one- or two-way ANOVA. For experiments with the LY-411575 inhibitor, statistical analysis included Tukey’s multiple comparison test. In all graphs, data are presented as mean ± SEM. Regardless of the test applied, differences were considered statistically significant at P ≤ 0.05. Specific tests and statistical values are indicated in each figure legend.

Online supplemental material

Fig. S1 shows additional data relevant to Fig. 1. Fig. S2 shows a comparative transcriptomic analysis of bulk RNA-seq and public array data. Fig. S3 provides a comprehensive ATAC-seq analysis and genome-wide binding of RXR signaling for AM function, identity, and chromatin regulation. Fig. S4 shows cell-to-cell communication analysis and provides in vitro and in vivo evidence that DLL4 signaling is necessary for AM maturation and differentiation. Fig. S5 shows RBPJ, RXR, SMAD, and STAT5 cooperate in the regulation of AM-core gene expression. Table S1 lists the deregulated genes in Cd11cCre+Rxrabfl/fl versus Rxrabfl/fl AM ([FC] ≤ −1.5, p-adj ≤0.1). Table S2 shows the closed peaks in Cd11cCre+Rxrabfl/fl versus Rxrabfl/fl mAMs (log2[FC] ≥1, [FDR] ≤0.05). Table S3 shows lists of RXRa peaks in Cd11cCre+Rxrabfl/fl versus Rxrabfl/fl mAMs ([FDR] ≤0.05). FOLD values are calculated as log2(KO/WT), and therefore negative values represent higher ocupation in WT. Table S4 shows the H3K27ac HT-ChIPmentation peaks in WT mAMs. Table S5 shows PPARγ-binding peaks in WT mAMs ([FDR] ≤0.05). Table S6 shows SMAD4 binding peaks in WT mAMs ([FDR] ≤0.05). Table S7 shows RBPJ binding peaks in WT mAMs ([FDR] ≤0.05). Table S8 indicates the primers used for mouse genotyping, qPCR experiments, and indexed library preparation for ATAC-seq and HT-ChIPmentation. Table S9 indicates all the antibodies used in this study. Table S10 provides detailed sequencing quality metrics.

RNA-seq, ATAC-seq, and HT-ChIP-mentation-seq data are deposited in the National Center for Biotechnology Information Gene Expression Omnibus, with accession number GSE243165. All other data are present in the article and supplementary information.

We thank the staff of the Centro Nacional de Investigaciones Cardiovasculares (CNIC) Microscopy, Flow Cytometry, Genomics, and Animal Facilities for technical support and S. Bartlett (CNIC) for English editing.

This work was supported by grants to M. Ricote: S2022/BMD-7227 Comunidad de Madrid, PID2021-122552OB-I00, PID2024-155614OB-I00, and CNS2023-143622 funded by Ministerio de Ciencia e Innovación (MICIN)/Agencia Estatal de Investigación (AEI)/10.13039/501100011033 and by European Regional Development Fund (ERDF), European Union, and European Union NextGenerationEU/PRTR; grant PID2022-142616OB-I00 funded by Ministerio de Ciencia, Innovación y Universidades (MICIU)/AEI/10.13039/501100011033 and by ERDF, European Union, to T. Fischer and PID2021-123044OB-I00 MICIN/AEI to C. Casals. J. Mínguez-Martínez was supported by an PRE2019-087964 fellowship funded by MICIU, J. Porcuna by an FPU17/01731 fellowship funded by Ministerio de Educación, Cultura y Deporte (MECD), and L. Casablanca by an PRE2022-101483 fellowship funded by MICIN. The CNIC is supported by the Instituto de Salud Carlos III, the MICIN, and the Pro CNIC Foundation and is a Severo Ochoa Center of Excellence (grant CEX2020-001041-S funded by MICIN/AEI/10.13039/501100011033). Centro Nacional de Biotecnología is a Severo Ochoa Center of Excellence (CEX2023-001386-S funded by MICIN/AEI/10.13039/501100011033). Open Access funding provided by Consejo Superior de Investigaciones Científicas.

Author contributions: Jorge Mínguez-Martínez: conceptualization, formal analysis, investigation, methodology, visualization, writing—original draft and writing - review and editing. Jesús Porcuna: conceptualization, formal analysis, investigation, methodology, visualization, writing - original draft and writing - review and editing. Laura Casablanca: formal analysis, investigation, methodology, visualization, and writing—review and editing. Manuel J. Gómez: data curation, formal analysis, methodology, software, visualization and writing - review and editing. Hooman Aghelpasand: formal analysis, investigation, methodology, and writing—review and editing. Pontus Höjer: formal analysis. Belén García-Fojeda: formal analysis, investigation, and methodology. Vanessa Núñez: investigation, methodology. Carlos Torroja: data curation, formal analysis, methodology and visualization. Severin Mühleder: methodology. Charlotte Gustafsson: methodology. Thierry Fischer: conceptualization, methodology and writing—review and editing. Rui Benedito: resources. Cristina Casals: formal analysis, methodology, validation, and writing—review and editing. Robert Månsson: methodology and resources. Fátima Sánchez-Cabo: formal analysis, resources and visualization. Mercedes Ricote: conceptualization, formal analysis, funding acquisition, project administration, resources, supervision, visualization, and writing—original draft, review, and editing.

Bain
,
C.C.
,
C.A.
Hawley
,
H.
Garner
,
C.L.
Scott
,
A.
Schridde
,
N.J.
Steers
,
M.
Mack
,
A.
Joshi
,
M.
Guilliams
,
A.M.
Mowat
, et al
.
2016
.
Long-lived self-renewing bone marrow-derived macrophages displace embryo-derived cells to inhabit adult serous cavities
.
Nat. Commun.
7
:
ncomms11852
.
Bain
,
C.C.
, and
A.S.
MacDonald
.
2022
.
The impact of the lung environment on macrophage development, activation and function: Diversity in the face of adversity
.
Mucosal. Immunol.
15
:
223
234
.
Bleriot
,
C.
,
S.
Chakarov
, and
F.
Ginhoux
.
2020
.
Determinants of resident tissue macrophage identity and function
.
Immunity
.
52
:
957
970
.
Bonnardel
,
J.
,
W.
T’jonck
,
D.
Gaublomme
,
R.
Browaeys
,
C.L.
Scott
,
L.
Martens
,
B.
Vanneste
,
S.
De Prijck
,
S.A.
Nedospasov
,
A.
Kremer
, et al
.
2019
.
Stellate cells, hepatocytes, and endothelial cells imprint the Kupffer cell identity on monocytes colonizing the liver macrophage niche
.
Immunity
.
51
:
638
654.e9
.
Brocker
,
T.
,
M.
Riedinger
, and
K.
Karjalainen
.
1997
.
Targeted expression of major histocompatibility complex (MHC) class II molecules demonstrates that dendritic cells can induce negative but not positive selection of thymocytes in vivo
.
J. Exp. Med.
185
:
541
550
.
Buch
,
T.
,
F.L.
Heppner
,
C.
Tertilt
,
T.J.
Heinen
,
M.
Kremer
,
F.T.
Wunderlich
,
S.
Jung
, and
A.
Waisman
.
2005
.
A Cre-inducible diphtheria toxin receptor mediates cell lineage ablation after toxin administration
.
Nat. Methods
.
2
:
419
426
.
Buenrostro
,
J.D.
,
B.
Wu
,
H.Y.
Chang
, and
W.J.
Greenleaf
.
2015
.
ATAC-seq: A method for assaying chromatin accessibility genome-wide
.
Curr. Protoc. Mol. Biol.
109
:
21.29.1
21.29.9
.
Cain
,
D.W.
,
E.G.
O’koren
,
M.J.
Kan
,
M.
Womble
,
G.D.
Sempowski
,
K.
Hopper
,
M.D.
Gunn
, and
G.
Kelsoe
.
2013
.
Identification of a tissue-specific, C/EBPbeta-dependent pathway of differentiation for murine peritoneal macrophages
.
J. Immunol.
191
:
4665
4675
.
Casals
,
C.
,
J.
Arias-Diaz
,
F.
Valino
,
A.
Saenz
,
C.
Garcia
,
J.L.
Balibrea
, and
E.
Vara
.
2003
.
Surfactant strengthens the inhibitory effect of C-reactive protein on human lung macrophage cytokine release
.
Am. J. Physiol. Lung Cell Mol. Physiol.
284
:
L466
L472
.
Casals
,
C.
,
L.
Herrera
,
E.
Miguel
,
P.
Garcia-Barreno
, and
A.M.
Municio
.
1989
.
Comparison between intra- and extracellular surfactant in respiratory distress induced by oleic acid
.
Biochim. Biophys. Acta
.
1003
:
201
203
.
Casals
,
C.
,
A.
Varela
,
M.L.
Ruano
,
F.
Valino
,
J.
Perez-Gil
,
N.
Torre
,
E.
Jorge
,
F.
Tendillo
, and
J.L.
Castillo-Olivares
.
1998
.
Increase of C-reactive protein and decrease of surfactant protein A in surfactant after lung transplantation
.
Am. J. Respir. Crit. Care Med.
157
:
43
49
.
Casanova-Acebes
,
M.
,
M.P.
Menendez-Gutierrez
,
J.
Porcuna
,
D.
Alvarez-Errico
,
Y.
Lavin
,
A.
Garcia
,
S.
Kobayashi
,
J.
Le Berichel
,
V.
Nunez
,
F.
Were
, et al
.
2020
.
RXRs control serous macrophage neonatal expansion and identity and contribute to ovarian cancer progression
.
Nat. Commun.
11
:
1655
.
Clausen
,
B.E.
,
C.
Burkhardt
,
W.
Reith
,
R.
Renkawitz
, and
I.
Forster
.
1999
.
Conditional gene targeting in macrophages and granulocytes using LysMcre mice
.
Transgenic Res.
8
:
265
277
.
Cohen
,
M.
,
A.
Giladi
,
A.D.
Gorki
,
D.G.
Solodkin
,
M.
Zada
,
A.
Hladik
,
A.
Miklosi
,
T.M.
Salame
,
K.B.
Halpern
,
E.
David
, et al
.
2018
.
Lung single-cell signaling interaction map reveals basophil role in macrophage imprinting
.
Cell
.
175
:
1031
1044.e18
.
Da Costa Loureiro
,
L.
,
L.
Da Costa Loureiro
,
E.A.
Gabriel-Junior
,
F.A.
Zambuzi
,
C.
Fontanari
,
H.
Sales-Campos
,
F.G.
Frantz
,
L.H.
Faccioli
, and
C.A.
Sorgi
.
2020
.
Pulmonary surfactant phosphatidylcholines induce immunological adaptation of alveolar macrophages
.
Mol. Immunol.
122
:
163
172
.
De Boer
,
J.
,
A.
Williams
,
G.
Skavdis
,
N.
Harker
,
M.
Coles
,
M.
Tolaini
,
T.
Norton
,
K.
Williams
,
K.
Roderick
,
A.J.
Potocnik
, and
D.
Kioussis
.
2003
.
Transgenic mice with hematopoietic and lymphoid specific expression of Cre
.
Eur. J. Immunol.
33
:
314
325
.
Dimitrov
,
D.
,
D.
Turei
,
M.
Garrido-Rodriguez
,
P.L.
Burmedi
,
J.S.
Nagai
,
C.
Boys
,
R.O.
Ramirez Flores
,
H.
Kim
,
B.
Szalai
,
I.G.
Costa
, et al
.
2022
.
Comparison of methods and resources for cell-cell communication inference from single-cell RNA-Seq data
.
Nat. Commun.
13
:
3224
.
Dorr
,
D.
,
B.
Obermayer
,
J.M.
Weiner
,
K.
Zimmermann
,
C.
Anania
,
L.K.
Wagner
,
E.M.
Lyras
,
V.
Sapozhnikova
,
D.
Lara-Astiaso
,
F.
Prosper
, et al
.
2022
.
C/EBPbeta regulates lipid metabolism and Pparg isoform 2 expression in alveolar macrophages
.
Sci. Immunol.
7
:eabj0140.
Efremova
,
M.
,
M.
Vento-Tormo
,
S.A.
Teichmann
, and
R.
Vento-Tormo
.
2020
.
CellPhoneDB: Inferring cell-cell communication from combined expression of multi-subunit ligand-receptor complexes
.
Nat. Protoc.
15
:
1484
1506
.
Epelman
,
S.
,
K.J.
Lavine
, and
G.J.
Randolph
.
2014
.
Origin and functions of tissue macrophages
.
Immunity
.
41
:
21
35
.
Fernández-Chacón
,
M.
,
S.
Mühleder
,
A.
Regano
,
L.
Garcia-Ortega
,
S.F.
Rocha
,
C.
Torroja
,
M.S.
Sanchez-Muñoz
,
M.
Lytvyn
,
V.
Casquero-Garcia
,
M.
De Andrés-Laguillo
, et al
.
2023
.
Incongruence between transcriptional and vascular pathophysiological cell states
.
Nat. Cardiovasc. Res.
2
:
2023530
2023549
.
Gautier
,
E.L.
,
T.
Shay
,
J.
Miller
,
M.
Greter
,
C.
Jakubzick
,
S.
Ivanov
,
J.
Helft
,
A.
Chow
,
K.G.
Elpek
,
S.
Gordonov
, et al
.
2012
.
Gene-expression profiles and transcriptional regulatory pathways that underlie the identity and diversity of mouse tissue macrophages
.
Nat. Immunol.
13
:
1118
1128
.
Georgiades
,
P.
,
S.
Ogilvy
,
H.
Duval
,
D.R.
Licence
,
D.S.
Charnock-Jones
,
S.K.
Smith
, and
C.G.
Print
.
2002
.
VavCre transgenic mice: A tool for mutagenesis in hematopoietic and endothelial lineages
.
Genesis
.
34
:
251
256
.
Ginhoux
,
F.
, and
M.
Guilliams
.
2016
.
Tissue-resident macrophage ontogeny and homeostasis
.
Immunity
.
44
:
439
449
.
Gomez Perdiguero
,
E.
,
K.
Klapproth
,
C.
Schulz
,
K.
Busch
,
E.
Azzoni
,
L.
Crozet
,
H.
Garner
,
C.
Trouillet
,
M.F.
De Bruijn
,
F.
Geissmann
, and
H.R.
Rodewald
.
2015
.
Tissue-resident macrophages originate from yolk-sac-derived erythro-myeloid progenitors
.
Nature
.
518
:
547
551
.
Gschwend
,
J.
,
S.P.M.
Sherman
,
F.
Ridder
,
X.
Feng
,
H.E.
Liang
,
R.M.
Locksley
,
B.
Becher
, and
C.
Schneider
.
2021
.
Alveolar macrophages rely on GM-CSF from alveolar epithelial type 2 cells before and after birth
.
J. Exp. Med.
218
:e20210745.
Guilliams
,
M.
,
I.
De Kleer
,
S.
Henri
,
S.
Post
,
L.
Vanhoutte
,
S.
De Prijck
,
K.
Deswarte
,
B.
Malissen
,
H.
Hammad
, and
B.N.
Lambrecht
.
2013
.
Alveolar macrophages develop from fetal monocytes that differentiate into long-lived cells in the first week of life via GM-CSF
.
J. Exp. Med.
210
:
1977
1992
.
Guilliams
,
M.
,
G.R.
Thierry
,
J.
Bonnardel
, and
M.
Bajenoff
.
2020
.
Establishment and maintenance of the macrophage niche
.
Immunity
.
52
:
434
451
.
Gustafsson
,
C.
,
A.
De Paepe
,
C.
Schmidl
, and
R.
Mansson
.
2019
.
High-throughput ChIPmentation: Freely scalable, single day ChIPseq data generation from very low cell-numbers
.
BMC Genomics
.
20
:
59
.
Hao
,
Y.
,
S.
Hao
,
E.
Andersen-Nissen
,
W.M.
Mauck 3rd
,
S.
Zheng
,
A.
Butler
,
M.J.
Lee
,
A.J.
Wilk
,
C.
Darby
,
M.
Zager
, et al
.
2021
.
Integrated analysis of multimodal single-cell data
.
Cell
.
184
:
3573
3587.e29
.
Hashimoto
,
D.
,
A.
Chow
,
C.
Noizat
,
P.
Teo
,
M.B.
Beasley
,
M.
Leboeuf
,
C.D.
Becker
,
P.
See
,
J.
Price
,
D.
Lucas
, et al
.
2013
.
Tissue-resident macrophages self-maintain locally throughout adult life with minimal contribution from circulating monocytes
.
Immunity
.
38
:
792
804
.
Heinz
,
S.
,
C.
Benner
,
N.
Spann
,
E.
Bertolino
,
Y.C.
Lin
,
P.
Laslo
,
J.X.
Cheng
,
C.
Murre
,
H.
Singh
, and
C.K.
Glass
.
2010
.
Simple combinations of lineage-determining transcription factors prime cis-regulatory elements required for macrophage and B cell identities
.
Mol. Cell
.
38
:
576
589
.
Hu
,
G.
, and
J.W.
Christman
.
2019
.
Editorial: Alveolar macrophages in lung inflammation and resolution
.
Front. Immunol.
10
:
2275
.
Izquierdo
,
H.M.
,
P.
Brandi
,
M.J.
Gómez
,
R.
Conde-Garrosa
,
E.
Priego
,
M.
Enamorado
,
S.
Martínez-Cano
,
I.
Sánchez
,
L.
Conejero
,
D.
Jimenez-Carretero
, et al
.
2018
.
Von Hippel-Lindau protein is required for optimal alveolar macrophage terminal differentiation, self-renewal, and function
.
Cell Rep.
24
:
1738
1746
.
Joshi
,
N.
,
J.M.
Walter
, and
A.V.
Misharin
.
2018
.
Alveolar macrophages
.
Cell Immunol.
330
:
86
90
.
Langmead
,
B.
, and
S.L.
Salzberg
.
2012
.
Fast gapped-read alignment with Bowtie 2
.
Nat. Methods
.
9
:
357
359
.
Lavin
,
Y.
,
D.
Winter
,
R.
Blecher-Gonen
,
E.
David
,
H.
Keren-Shaul
,
M.
Merad
,
S.
Jung
, and
I.
Amit
.
2014
.
Tissue-resident macrophage enhancer landscapes are shaped by the local microenvironment
.
Cell
.
159
:
1312
1326
.
Lefebvre
,
P.
,
Y.
Benomar
, and
B.
Staels
.
2010
.
Retinoid X receptors: Common heterodimerization partners with distinct functions
.
Trends Endocrinol. Metab.
21
:
676
683
.
Li
,
B.
, and
C.N.
Dewey
.
2011
.
RSEM: Accurate transcript quantification from RNA-seq data with or without a reference genome
.
BMC Bioinformatics
.
12
:
323
.
Li
,
F.
,
P.
Huangyang
,
M.
Burrows
,
K.
Guo
,
R.
Riscal
,
J.
Godfrey
,
K.E.
Lee
,
N.
Lin
,
P.
Lee
,
I.A.
Blair
, et al
.
2020
.
FBP1 loss disrupts liver metabolism and promotes tumorigenesis through a hepatic stellate cell senescence secretome
.
Nat. Cell Biol.
22
:
728
739
.
Li
,
H.
,
B.
Handsaker
,
A.
Wysoker
,
T.
Fennell
,
J.
Ruan
,
N.
Homer
,
G.
Marth
,
G.
Abecasis
,
R.
Durbin
, and
S.
Genome Project Data Processing
.
2009
.
The sequence alignment/map format and SAMtools
.
Bioinformatics
.
25
:
2078
2079
.
Liu
,
Z.
,
Y.
Gu
,
S.
Chakarov
,
C.
Bleriot
,
I.
Kwok
,
X.
Chen
,
A.
Shin
,
W.
Huang
,
R.J.
Dress
,
C.A.
Dutertre
, et al
.
2019
.
Fate mapping via Ms4a3-expression history traces monocyte-derived cells
.
Cell
.
178
:
1509
1525.e19
.
Martin
,
M.
2011
.
Cutadapt removes adapter sequences from high-throughput sequencing reads
.
EMBnet J.
17
:
10
12
.
Mass
,
E.
,
I.
Ballesteros
,
M.
Farlik
,
F.
Halbritter
,
P.
Gunther
,
L.
Crozet
,
C.E.
Jacome-Galarza
,
K.
Handler
,
J.
Klughammer
,
Y.
Kobayashi
, et al
.
2016
.
Specification of tissue-resident macrophages during organogenesis
.
Science
.
353
:
aaf4238
.
Mccarthy
,
D.J.
,
K.R.
Campbell
,
A.T.
Lun
, and
Q.F.
Wills
.
2017
.
Scater: Pre-processing, quality control, normalization and visualization of single-cell RNA-seq data in R
.
Bioinformatics
.
33
:
1179
1186
.
Mccowan
,
J.
,
F.
Fercoq
,
P.M.
Kirkwood
,
W.
T’jonck
,
L.M.
Hegarty
,
C.M.
Mawer
,
R.
Cunningham
,
A.S.
Mirchandani
,
A.
Hoy
,
D.C.
Humphries
, et al
.
2021
.
The transcription factor EGR2 is indispensable for tissue-specific imprinting of alveolar macrophages in health and tissue repair
.
Sci. Immunol.
6
:eabj2132.
Menendez-Gutierrez
,
M.P.
,
J.
Porcuna
,
R.
Nayak
,
A.
Paredes
,
H.
Niu
,
V.
Nunez
,
A.
Paranjpe
,
M.J.
Gomez
,
A.
Bhattacharjee
,
D.J.
Schnell
, et al
.
2023
.
Retinoid X receptor promotes hematopoietic stem cell fitness and quiescence and preserves hematopoietic homeostasis
.
Blood
.
141
:
592
608
.
Menendez-Gutierrez
,
M.P.
, and
M.
Ricote
.
2017
.
The multi-faceted role of retinoid X receptor in bone remodeling
.
Cell Mol. Life Sci.
74
:
2135
2149
.
Menendez-Gutierrez
,
M.P.
,
T.
Roszer
,
L.
Fuentes
,
V.
Nunez
,
A.
Escolano
,
J.M.
Redondo
,
N.
De Clerck
,
D.
Metzger
,
A.F.
Valledor
, and
M.
Ricote
.
2015
.
Retinoid X receptors orchestrate osteoclast differentiation and postnatal bone remodeling
.
J. Clin. Invest.
125
:
809
823
.
Minutti
,
C.M.
,
B.
Garcia-Fojeda
,
A.
Saenz
,
M.
De Las Casas-Engel
,
R.
Guillamat-Prats
,
A.
De Lorenzo
,
A.
Serrano-Mollar
,
A.L.
Corbi
, and
C.
Casals
.
2016
.
Surfactant protein A prevents IFN-gamma/IFN-gamma receptor interaction and attenuates classical activation of human alveolar macrophages
.
J. Immunol.
197
:
590
598
.
Ning
,
S.
,
J.S.
Pagano
, and
G.N.
Barber
.
2011
.
IRF7: Activation, regulation, modification and function
.
Genes Immun.
12
:
399
414
.
Perez
,
E.
,
W.
Bourguet
,
H.
Gronemeyer
, and
A.R.
De Lera
.
2012
.
Modulation of RXR function through ligand design
.
Biochim. Biophys. Acta
.
1821
:
57
69
.
Porcuna
,
J.
,
M.P.
Menendez-Gutierrez
, and
M.
Ricote
.
2020
.
Molecular control of tissue-resident macrophage identity by nuclear receptors
.
Curr. Opin. Pharmacol.
53
:
27
34
.
Ramírez
,
F.
,
D.P.
Ryan
,
B.
Grüning
,
V.
Bhardwaj
,
F.
Kilpert
,
A.S.
Richter
,
S.
Heyne
,
F.
Dündar
, and
T.
Manke
.
2016
.
deepTools2: a next generation web server for deep-sequencing data analysis
.
Nucleic Acids Res
.
44
:
W160
W165
.
Ritchie
,
M.E.
,
B.
Phipson
,
D.
Wu
,
Y.
Hu
,
C.W.
Law
,
W.
Shi
, and
G.K.
Smyth
.
2015
.
Limma powers differential expression analyses for RNA-sequencing and microarray studies
.
Nucleic Acids Res.
43
:e47.
Robinson
,
M.D.
,
D.J.
Mccarthy
, and
G.K.
Smyth
.
2010
.
edgeR: A bioconductor package for differential expression analysis of digital gene expression data
.
Bioinformatics
.
26
:
139
140
.
Ross-Innes
,
C.S.
,
R.
Stark
,
A.E.
Teschendorff
,
K.A.
Holmes
,
H.R.
Ali
,
M.J.
Dunning
,
G.D.
Brown
,
O.
Gojis
,
I.O.
Ellis
,
A.R.
Green
, et al
.
2012
.
Differential oestrogen receptor binding is associated with clinical outcome in breast cancer
.
Nature
.
481
:
389
393
.
Rőszer
,
T.
,
M.P.
Menendez-Gutierrez
,
M.
Cedenilla
, and
M.
Ricote
.
2013
.
Retinoid X receptors in macrophage biology
.
Trends Endocrinol. Metab.
24
:
460
468
.
Sajti
,
E.
,
V.M.
Link
,
Z.
Ouyang
,
N.J.
Spann
,
E.
Westin
,
C.E.
Romanoski
,
G.J.
Fonseca
,
L.S.
Prince
, and
C.K.
Glass
.
2020
.
Transcriptomic and epigenetic mechanisms underlying myeloid diversity in the lung
.
Nat. Immunol.
21
:
221
231
.
Sakai
,
M.
,
T.D.
Troutman
,
J.S.
Seidman
,
Z.
Ouyang
,
N.J.
Spann
,
Y.
Abe
,
K.M.
Ego
,
C.M.
Bruni
,
Z.
Deng
,
J.C.M.
Schlachetzki
, et al
.
2019
.
Liver-derived signals sequentially reprogram myeloid enhancers to initiate and maintain Kupffer cell identity
.
Immunity
.
51
:
655
670.e8
.
Schneider
,
C.
,
S.P.
Nobs
,
M.
Kurrer
,
H.
Rehrauer
,
C.
Thiele
, and
M.
Kopf
.
2014
.
Induction of the nuclear receptor PPAR-gamma by the cytokine GM-CSF is critical for the differentiation of fetal monocytes into alveolar macrophages
.
Nat. Immunol.
15
:
1026
1037
.
Stark
,
R.
, and
G.
Brown
.
2011
.
DiffBind: Differential binding analysis of ChIP-seq peak data
.
Subramanian
,
S.
,
C.J.
Busch
,
K.
Molawi
,
L.
Geirsdottir
,
J.
Maurizio
,
S.
Vargas Aguilar
,
H.
Belahbib
,
G.
Gimenez
,
R.A.A.
Yuda
,
M.
Burkon
, et al
.
2022
.
Long-term culture-expanded alveolar macrophages restore their full epigenetic identity after transfer in vivo
.
Nat. Immunol.
23
:
458
468
.
T’jonck
,
W.
,
M.
Guilliams
, and
J.
Bonnardel
.
2018
.
Niche signals and transcription factors involved in tissue-resident macrophage development
.
Cell Immunol.
330
:
43
53
.
Tan
,
S.Y.
, and
M.A.
Krasnow
.
2016
.
Developmental origin of lung macrophage diversity
.
Development
.
143
:
1318
1327
.
Travaglini
,
K.J.
,
A.N.
Nabhan
,
L.
Penland
,
R.
Sinha
,
A.
Gillich
,
R.V.
Sit
,
S.
Chang
,
S.D.
Conley
,
Y.
Mori
,
J.
Seita
, et al
.
2020
.
A molecular cell atlas of the human lung from single-cell RNA sequencing
.
Nature
.
587
:
619
625
.
Wang
,
Y.
,
Y.
Zhang
,
K.
Kim
,
J.
Han
,
D.
Okin
,
Z.
Jiang
,
L.
Yang
,
A.
Subramaniam
,
T.K.
Means
,
F.O.
Nestlé
, et al
.
2024
.
A pan-family screen of nuclear receptors in immunocytes reveals ligand-dependent inflammasome control
.
Immunity
.
57
:
2737
2754.e12
.
Wong
,
G.T.
,
D.
Manfra
,
F.M.
Poulet
,
Q.
Zhang
,
H.
Josien
,
T.
Bara
,
L.
Engstrom
,
M.
Pinzon-Ortiz
,
J.S.
Fine
,
H.J.
Lee
, et al
.
2004
.
Chronic treatment with the gamma-secretase inhibitor LY-411,575 inhibits beta-amyloid peptide production and alters lymphopoiesis and intestinal cell differentiation
.
J. Biol. Chem.
279
:
12876
12882
.
Yu
,
X.
,
A.
Buttgereit
,
I.
Lelios
,
S.G.
Utz
,
D.
Cansever
,
B.
Becher
, and
M.
Greter
.
2017
.
The cytokine TGF-beta promotes the development and homeostasis of alveolar macrophages
.
Immunity
.
47
:
903
912.e4
.
Zhang
,
Y.
,
T.
Liu
,
C.A.
Meyer
,
J.
Eeckhoute
,
D.S.
Johnson
,
B.E.
Bernstein
,
C.
Nusbaum
,
R.M.
Myers
,
M.
Brown
,
W.
Li
, and
X.S.
Liu
.
2008
.
Model-based analysis of ChIP-seq (MACS)
.
Genome Biol.
9
:
R137
.

Author notes

*

J. Mínguez-Martínez and J. Porcuna contributed equally to this paper.

Disclosures: The authors declare no competing interests exist.

This article is available under a Creative Commons License (Attribution 4.0 International, as described at https://creativecommons.org/licenses/by/4.0/).

Data & Figures

+ Expand view − Collapse view
Figure S1
Figure S1. Refer to the image caption for details. Panel A shows bar graphs comparing relative Rxra and Rxrb mRNA expression levels in monocytes and alveolar macrophages. Panel B shows sequential flow cytometry gating plots identifying neutrophils, alveolar macrophages, and eosinophils from single CD45 positive lung cells. Panel C shows bar graphs quantifying Rxra and Rxrb deletion efficiency in mature and immature alveolar macrophages from control and LysMCre mice. Panel D shows representative flow cytometry plots of CD11b and SiglecF gated alveolar macrophage populations with accompanying bar graph quantifying mature and immature alveolar macrophage numbers per tissue mass. Panel E shows bar graphs of Rxra and Rxrb relative expression in mature and immature alveolar macrophages from control and Cd11cCre mice. Panel F shows bar graphs comparing percentages of mature and immature alveolar macrophages among CD45 positive lung and bronchoalveolar lavage cells. Panel G shows representative flow cytometry plots identifying cDC1 and cDC2 dendritic cell populations with bar graphs quantifying dendritic cell numbers and percentages. Panel H shows representative flow cytometry plots identifying interstitial macrophages with bar graph quantifying total interstitial macrophage numbers per tissue mass. Panel I shows representative flow cytometry plots identifying neutrophils and eosinophils with accompanying bar graphs quantifying immune cell numbers per tissue mass. Panel J shows bar graphs quantifying peripheral blood neutrophils, eosinophils, and monocytes as total numbers and percentages of CD45 positive cells. Panel K shows representative Van Gieson stained lung histology images from control and Cd11cCre mice. Panel L shows flow cytometry density plots and histogram overlays of BODIPY positive mature alveolar macrophages with bar graph quantifying mean fluorescence intensity. Panel M shows bar graphs quantifying total protein and phospholipid content in bronchoalveolar lavage fluid from control and Cd11cCre mice. Panel N shows bar graph comparing protein to phospholipid ratios in bronchoalveolar lavage fluid between control and Cd11cCre mice.

Deletion of RXRα and RXRβ signaling alters AM phenotype. (A) mRNA relative expression of Rxra and Rxrb in monocytes (Mon) and AMs, n = 3; each sample was pooled from four mice. (B) Gating strategy used to analyze AMs. (C) mRNA relative expression analysis of Rxra and Rxrb deletion in mAMs and ImmAMs from 9-wk-old Rxrabfl/fl and LysMCre+Rxrabfl/fl mice, n = 3 per genotype. (D) Representative flow cytometry dot plots showing CD11b and SiglecF-gated AMs in whole digested lung from 9-wk-old Rxrabfl/fl and LysMCre+Rxrabfl/fl mice; the graph shows total numbers of mAMs and ImmAMs per mg of tissue. n = 5–6 per genotype; data are from two pooled independent experiments. (E) mRNA relative expression analysis of Rxra and Rxrb deletion in mAMs and ImmAMs from 9-wk-old Rxrabfl/fl and Cd11cCre+Rxrabfl/fl mice, n = 3 per genotype. (F) Percentages of CD45+ mAMs and ImmAMs in whole lung homogenates and BAL. n = 7–12 per genotype and method of isolation; data are from two independent experiments. (G) (Left) Representative flow cytometry dot plots showing the populations of DCs (cDC1 and cDC2), and (right) graphs showing the total number of cells per mg of tissue and the percentage of each DC population in 9-wk-old Rxrabfl/fl and LysMCre+Rxrabfl/fl mice. n = 5–7 per genotype; data are from two independent experiments. (H) (Left) Representative flow cytometry dot plots showing IMs in 9-wk-old Rxrabfl/fl and LysMCre+Rxrabfl/fl, and (right) percentage of CD45+ cells. n = 3–7 per genotype; data are from two independent experiments. (I) (Left) Representative flow cytometry dot plots showing neutrophils (gated on Single/DAPI/CD45+ cells) and eosinophils (gated on Single/DAPI/CD45+/Cd11c/Ly6G cells) in the whole digested lung, and (right) graph showing total numbers per mg of tissue from 9-wk-old Rxrabfl/fl and Cd11cCre+Rxrabfl/fl mice. n = 7–8 per genotype and method of isolation; data are from two pooled independent experiments. (J) Quantification of PB neutrophils, eosinophils, and monocytes as (top) total number per μl blood and (bottom) percentage of CD45+ cells in 9-wk-old Rxrabfl/fl and Cd11cCre+Rxrabfl/fl mice. n = 5–6 per genotype. (K) Lung Van Gieson histology images; scale bar, 250 μm. (L) (Left) FACS plots showing BODIPY+ mAMs, and (right) BODIPY mean fluorescence intensity (MFI) in mAMs from 9-wk-old Rxrabfl/fl and Cd11cCre+Rxrabfl/fl mice. n = 8 per genotype; data are from two independent experiments. (M) Total protein (left) and phospholipid (right) content in BAL from 9-wk-old Rxrabfl/fl and Cd11cCre+Rxrabfl/fl mice. n = 10-11 mice per genotype. (N) Protein-phospholipid ratio in BAL from 9-wk-old Rxrabfl/fl and Cd11cCre+Rxrabfl/fl mice. n = 9–10 mice per genotype. All data are shown as means ± SEM; **P ≤ 0.01; ***P ≤ 0.001; ****P ≤ 0.0001; unpaired Student t test.

Figure S1.
A multi-part image depicts the effects of RXR and RXR signaling deletion on alveolar macrophage phenotype. Panel A shows bar graphs comparing relative Rxra and Rxrb mRNA expression levels in monocytes and alveolar macrophages. Panel B shows sequential flow cytometry gating plots identifying neutrophils, alveolar macrophages, and eosinophils from single CD45 positive lung cells. Panel C shows bar graphs quantifying Rxra and Rxrb deletion efficiency in mature and immature alveolar macrophages from control and LysMCre mice. Panel D shows representative flow cytometry plots of CD11b and SiglecF gated alveolar macrophage populations with accompanying bar graph quantifying mature and immature alveolar macrophage numbers per tissue mass. Panel E shows bar graphs of Rxra and Rxrb relative expression in mature and immature alveolar macrophages from control and Cd11cCre mice. Panel F shows bar graphs comparing percentages of mature and immature alveolar macrophages among CD45 positive lung and bronchoalveolar lavage cells. Panel G shows representative flow cytometry plots identifying cDC1 and cDC2 dendritic cell populations with bar graphs quantifying dendritic cell numbers and percentages. Panel H shows representative flow cytometry plots identifying interstitial macrophages with bar graph quantifying total interstitial macrophage numbers per tissue mass. Panel I shows representative flow cytometry plots identifying neutrophils and eosinophils with accompanying bar graphs quantifying immune cell numbers per tissue mass. Panel J shows bar graphs quantifying peripheral blood neutrophils, eosinophils, and monocytes as total numbers and percentages of CD45 positive cells. Panel K shows representative Van Gieson stained lung histology images from control and Cd11cCre mice. Panel L shows flow cytometry density plots and histogram overlays of BODIPY positive mature alveolar macrophages with bar graph quantifying mean fluorescence intensity. Panel M shows bar graphs quantifying total protein and phospholipid content in bronchoalveolar lavage fluid from control and Cd11cCre mice. Panel N shows bar graph comparing protein to phospholipid ratios in bronchoalveolar lavage fluid between control and Cd11cCre mice.

Deletion of RXRα and RXRβ signaling alters AM phenotype. (A) mRNA relative expression of Rxra and Rxrb in monocytes (Mon) and AMs, n = 3; each sample was pooled from four mice. (B) Gating strategy used to analyze AMs. (C) mRNA relative expression analysis of Rxra and Rxrb deletion in mAMs and ImmAMs from 9-wk-old Rxrabfl/fl and LysMCre+Rxrabfl/fl mice, n = 3 per genotype. (D) Representative flow cytometry dot plots showing CD11b and SiglecF-gated AMs in whole digested lung from 9-wk-old Rxrabfl/fl and LysMCre+Rxrabfl/fl mice; the graph shows total numbers of mAMs and ImmAMs per mg of tissue. n = 5–6 per genotype; data are from two pooled independent experiments. (E) mRNA relative expression analysis of Rxra and Rxrb deletion in mAMs and ImmAMs from 9-wk-old Rxrabfl/fl and Cd11cCre+Rxrabfl/fl mice, n = 3 per genotype. (F) Percentages of CD45+ mAMs and ImmAMs in whole lung homogenates and BAL. n = 7–12 per genotype and method of isolation; data are from two independent experiments. (G) (Left) Representative flow cytometry dot plots showing the populations of DCs (cDC1 and cDC2), and (right) graphs showing the total number of cells per mg of tissue and the percentage of each DC population in 9-wk-old Rxrabfl/fl and LysMCre+Rxrabfl/fl mice. n = 5–7 per genotype; data are from two independent experiments. (H) (Left) Representative flow cytometry dot plots showing IMs in 9-wk-old Rxrabfl/fl and LysMCre+Rxrabfl/fl, and (right) percentage of CD45+ cells. n = 3–7 per genotype; data are from two independent experiments. (I) (Left) Representative flow cytometry dot plots showing neutrophils (gated on Single/DAPI/CD45+ cells) and eosinophils (gated on Single/DAPI/CD45+/Cd11c/Ly6G cells) in the whole digested lung, and (right) graph showing total numbers per mg of tissue from 9-wk-old Rxrabfl/fl and Cd11cCre+Rxrabfl/fl mice. n = 7–8 per genotype and method of isolation; data are from two pooled independent experiments. (J) Quantification of PB neutrophils, eosinophils, and monocytes as (top) total number per μl blood and (bottom) percentage of CD45+ cells in 9-wk-old Rxrabfl/fl and Cd11cCre+Rxrabfl/fl mice. n = 5–6 per genotype. (K) Lung Van Gieson histology images; scale bar, 250 μm. (L) (Left) FACS plots showing BODIPY+ mAMs, and (right) BODIPY mean fluorescence intensity (MFI) in mAMs from 9-wk-old Rxrabfl/fl and Cd11cCre+Rxrabfl/fl mice. n = 8 per genotype; data are from two independent experiments. (M) Total protein (left) and phospholipid (right) content in BAL from 9-wk-old Rxrabfl/fl and Cd11cCre+Rxrabfl/fl mice. n = 10-11 mice per genotype. (N) Protein-phospholipid ratio in BAL from 9-wk-old Rxrabfl/fl and Cd11cCre+Rxrabfl/fl mice. n = 9–10 mice per genotype. All data are shown as means ± SEM; **P ≤ 0.01; ***P ≤ 0.001; ****P ≤ 0.0001; unpaired Student t test.

Close modal
Figure 1.
A multi-part image depicts the analysis of lung sections and cell populations in mice with different genotypes.Panel A shows representative flow cytometry plots of mature and immature alveolar macrophages from lung and bronchoalveolar lavage samples with accompanying bar graphs quantifying macrophage numbers per tissue mass and lavage volume. Panel B shows annotated t-SNE plots identifying alveolar macrophages, neutrophils, eosinophils, and other immune cell populations with corresponding fluorescence intensity maps for DAPI, CD45, Ly6G, CD11c, SiglecF, and CD11b markers. Panel C shows representative hematoxylin and eosin stained lung histology images from control and Cd11cCre positive Rxrab deficient mice. Panel D shows Oil Red O stained bronchoalveolar lavage cytospin images with accompanying bar graph quantifying Oil Red O positive cells per microscopy field. Panel E shows representative flow cytometry density plots of BODIPY positive mature alveolar macrophages with bar graph quantifying percentages of lipid positive macrophages. Panel F shows bar graphs quantifying surfactant proteins A, B, C, and D with representative western blot bands displayed below each quantification plot.

Deletion of RXRα and RXRβ in AMs generates an immature cell phenotype and pulmonary proteinosis. (A) (Left) Representative flow cytometry dot plots showing AMs gated onto CD11b and SiglecF in whole digested lung and BAL, and (right) graphs showing total numbers of mAMs and ImmAMs, per mg of tissue or ml of BAL, respectively. n = 7–12 per genotype and method of isolation; data from two independent experiments. (B) (Top) Annotated t-SNE plots generated with lung-homogenate FACS data for unbiased classification of the different cell populations found in CD45+ AMs (n = 3 per genotype) and (bottom) biexponential transformed selected marker expression levels. (C) Lung H&E histology images; scale bar, 250 μm. (D) (Left) Oil Red O staining of BAL cytospin cells; scale bar, 100 μm, and (right) percentage of Oil Red O+ cells per optical microscopy field (OMF). Quantifications were obtained by analysis of 10 OMFs per sample with n = 4–6 per genotype. (E) (Left) FACS plots showing BODIPY+ mAMs, and (right) quantification of BODIPY+ mAMs, with n = 8 per genotype; data representative from two independent experiments. (F) Quantification western blot of surfactant proteins A, B, C, and D, with n = 8–11 per genotype; data representative from two independent experiments. All data were obtained from 9-wk-old Rxrabfl/fl and Cd11cCre+Rxrabfl/fl mice and are shown as means ± SEM; *P ≤ 0.05; **P ≤ 0.01; ***P ≤ 0.001; ****P ≤ 0.0001; unpaired Student t test. Source data are available for this figure: SourceData F1.

Close modal
Figure 2.
A multi-panel image showing cell proliferation and apoptosis in mice. Panel A shows a schematic timeline of daily BrdU injections followed by sacrifice and flow cytometry analysis in control and Cd11cCre positive Rxrab deficient mice. Panel B shows representative flow cytometry plots of BrdU incorporation in mature alveolar macrophages from control and Cd11cCre positive Rxrab deficient mice. Panel C shows a bar graph quantifying percentages of BrdU positive mature alveolar macrophages between genotypes. Panel D shows representative flow cytometry plots of Ki67 and DAPI staining used for cell cycle analysis in mature alveolar macrophages. Panel E shows bar graphs quantifying Ki67 positive mature alveolar macrophages distributed across G1, G2-S-M, and G0 cell cycle phases. Panel F shows representative flow cytometry plots of Annexin V labeling in mature alveolar macrophages from control and Cd11cCre positive Rxrab deficient mice. Panel G shows a bar graph quantifying percentages of Annexin V positive mature alveolar macrophages between genotypes. Panel H shows representative flow cytometry plots of Annexin V and BODIPY staining identifying lipid positive apoptotic mature alveolar macrophages in both genotypes. Panel I shows a bar graph quantifying percentages of Annexin V positive and BODIPY positive mature alveolar macrophages between genotypes.

RXR-depleted mAMs are more proliferative but have an exacerbated cell death rate linked to lipotoxicity. (A) Scheme of BrdU assay. (B) Representative flow cytometry plots showing BrdU incorporation in mAMs. (C) Quantification of BrdU+ mAMs. n = 8 per genotype; data are from two pooled independent experiments. (D) Representative flow cytometry plots showing Ki67/DAPI staining in mAMs. (E) Quantification of cell cycle distribution analysis in mAMs according to Ki67 and DAPI levels. n = 6–8 per genotype; data are from two pooled independent experiments. (F) Representative flow cytometry plots showing Annexin V labeling in mAMs. (G) Quantification of Annexin V+ mAMs. n = 6–8 per genotype; data are from two pooled independent experiments. (H) Representative flow cytometry plots showing BODIPY stain analysis in Annexin V+ mAMs. (I) Quantification of Annexin V+/BODIPY+ mAMs. n = 6–7 per genotype; data are from two pooled independent experiments. All data were obtained from 9-wk-old Rxrabfl/fl and Cd11cCre+Rxrabfl/fl mice and are shown as means ± SEM; analysis were performed based on FMO controls; ****P ≤ 0.0001; unpaired Student t test.

Close modal
Figure 3.
A multi-panel image depicts the role of RXRs in AM maturation. Panel A shows bar graphs of Rxra and Rxrb relative mRNA expression across embryonic fetal monocytes, prealveolar macrophages, and postnatal alveolar macrophage developmental stages. Panel B shows representative flow cytometry plots gated on live CD45 positive single cells identifying prealveolar macrophages, mature alveolar macrophages, and immature alveolar macrophages at different developmental timepoints in control and Cd11cCre positive Rxrab deficient mice. Panel C shows bar graphs quantifying total numbers of prealveolar macrophages, mature alveolar macrophages, and immature alveolar macrophages per milligram tissue across postnatal developmental stages in both genotypes.

RXRs are necessary for postnatal AM maturation. (A) Rxra and Rxrb relative mRNA expression at different AM developmental stages, from embryonic fetal monocytes and preAMs to postnatal populations. n = 4–6 samples from four pooled mice; data are representative from two independent experiments. (B) Representative flow cytometry plots gated on alive CD45+ cells showing the expression of maturity markers in postnatal preAM and AM populations from Rxrabfl/fl and Cd11cCre+Rxrabfl/fl mice. (C) Total numbers of the populations in B. n = 6–10 mice per genotype and stage; data are from two pooled independent experiments. All data are shown as means ± SEM; *P ≤ 0.05; **P ≤ 0.01; ****P ≤ 0.0001; (A) two-way ANOVA with Tukey’s multiple comparisons test; (C) unpaired Student t test.

Close modal
Figure 4.
A multi-panel image depicts the molecular mechanism underlying the phenotype of RXR-deficient alveolar macrophages. Panel A shows a heatmap of differentially expressed genes between control and Cd11cCre positive Rxrab deficient mature alveolar macrophages. Panel B shows a volcano plot highlighting significantly upregulated and downregulated genes in Cd11cCre positive Rxrab deficient mature alveolar macrophages compared with controls. Panel C shows a bubble plot of significantly enriched Gene Ontology biological processes associated with altered transcriptional programs in Cd11cCre positive Rxrab deficient mature alveolar macrophages. Panel D shows a heatmap comparing expression of alveolar macrophage core genes and monocyte associated genes between control mature alveolar macrophages and Cd11cCre positive Rxrab deficient immature alveolar macrophages. Panel E shows genomic heatmaps of ATAC sequencing accessibility signals around transcription start sites in control and Cd11cCre positive Rxrab deficient mature alveolar macrophages. Panel F shows motif enrichment analysis identifying transcription factor binding motifs enriched in chromatin regions closed in Cd11cCre positive Rxrab deficient mature alveolar macrophages. Panel G shows a Venn diagram comparing RXR binding associated genes with significantly upregulated and downregulated genes in Cd11cCre positive Rxrab deficient mature alveolar macrophages. Panel H shows motif enrichment analysis of RXR chromatin immunoprecipitation peaks identifying enriched transcription factor motifs in alveolar macrophages. Panel I shows a donut chart illustrating genomic feature distribution of RXR binding peaks across promoter, intronic, exonic, intergenic, untranslated, and transcription termination regions. Panel J shows a bar graph quantifying associations between RXR peaks and proximal or distal H3K27ac chromatin regions in alveolar macrophages. Panel K shows UCSC genome browser tracks of ATAC sequencing, RXR binding, and H3K27ac chromatin peaks across key alveolar macrophage genes including Ucp3 and Fabp1.

RXRs act as LDTFs in AMs. (A) Heatmap representing all DEGs detected in the comparison of Rxrabfl/fl mAMs (n = 4 mice) with Cd11cCre+Rxrabfl/fl mAMs (n = 3 mice) from 9-wk-old mice. (B) Volcano plot showing global transcriptomic changes in Cd11cCre+Rxrabfl/fl mAMs. Colored dots represent DEGs with significant upregulation (p-adj <0.05 and FC >0; red) or significant downregulation (p-adj <0.05 and FC <0; blue). (C) Significantly enriched GO terms derived from the bulk RNA-seq data comparison between Cd11cCre+Rxrabfl/fl and Rxrabfl/fl mAMs, detected with the PANTHER statistical enrichment test tool (P < 0.05 with Bonferroni correction). (D) Heatmap showing expression values of previously described typical AM-upregulated and -downregulated core genes and monocyte genes [20] in Rxrabfl/fl mAMs (n = 4 mice) versus Cd11cCre+Rxrabfl/fl ImmAMs (n = 3 mice). (E) Genomic heatmap of ATAC-seq signals located in TSS-flanking regions (±5 kb) in sorted mAMs from 9-wk-old Rxrabfl/fl and Cd11cCre+Rxrabfl/fl mice (n = 4 per genotype) (log2(FC) ≤ −1 or ≥1, FDR <0.05). (F) HOMER motif enrichment analysis in closed ATAC-seq peaks in Cd11cCre+Rxrabfl/fl mAMs. (G) Overlapping analysis for the collection of 2,867 genes that were identified as nearest to RXRα HT-ChIPmentation peaks and for the collection of 527 DEGs obtained in bulk RNA-seq. (H) HOMER motif enrichment analysis of RXR peaks. (I) Genome feature distribution analysis of RXR peaks. (J) Bar plot showing the association between RXRα peaks and H3K27ac peaks classified as proximal or distal peaks according to their distance from the nearest gene. (K) UCSC genome browser plots showing ATAC-seq, RXRα and H3K27ac (distal and proximal) HT-ChIPmentation peaks in key AM genes. Blue boxes label differentially accessible regions showing RXR binding in Cd11cCre+Rxrabfl/fl versus Rxrabfl/fl mAMs. *P ≤ 0.05; Test of equal or given proportions (prop.test function in R).

Close modal
Figure 5.
A multi-panel image depicts RNA-seq analysis of RXR signaling in macrophages. Panel A shows heatmaps of fatty acid homeostasis related genes dysregulated in control and Cd11cCre positive Rxrab deficient mature alveolar macrophages. Panel B shows a gene set enrichment analysis plot demonstrating reduced fatty acid metabolism pathway enrichment in Cd11cCre positive Rxrab deficient mature alveolar macrophages. Panel C shows heatmaps of apoptosis related genes differentially expressed between control and Cd11cCre positive Rxrab deficient mature alveolar macrophages. Panel D shows a gene set enrichment analysis plot demonstrating positive enrichment of apoptosis pathways in Cd11cCre positive Rxrab deficient mature alveolar macrophages. Panel E shows a heatmap of differentially expressed genes comparing control mature alveolar macrophages, Cd11cCre positive Rxrab deficient mature alveolar macrophages, and immature alveolar macrophages. Panel F shows a principal component analysis plot separating transcriptomic profiles of control mature alveolar macrophages, Cd11cCre positive Rxrab deficient mature alveolar macrophages, and immature alveolar macrophages. Panel G shows a volcano plot highlighting significantly upregulated and downregulated genes between immature alveolar macrophages and control mature alveolar macrophages. Panel H shows gene set enrichment analysis plots demonstrating reduced DNA repair and E2F pathway activity in immature alveolar macrophages compared with control mature alveolar macrophages. Panel I shows heatmaps of proliferation associated genes differentially expressed between control mature alveolar macrophages and immature alveolar macrophages. Panel J shows a bubble plot of significantly enriched Gene Ontology biological processes associated with altered proliferation, apoptosis, migration, and DNA replication pathways in immature alveolar macrophages.

Bulk RNA-seq analysis reveals that RXR signaling is necessary for AM identity, metabolism, and proliferation. (A) Heatmap showing dysregulated genes related to fatty acid homeostasis in Cd11cCre+Rxrabfl/fl mAMs (n = 3 mice) versus Rxrabfl/fl mAMs (n = 4 mice). (B) GSEA plot showing a negative normalized enrichment score (NES = −1.30) for the fatty acid metabolism gene set in Cd11cCre+Rxrabfl/fl mAMs versus Rxrabfl/fl mAMs. (C) Heatmap showing dysregulated apoptosis-related genes in Cd11cCre+Rxrabfl/fl mAMs (n = 3 mice) versus Rxrabfl/fl mAMs (n = 4 mice). (D) GSEA plot showing positive enrichment (NES = 1.26) for the apoptosis gene set. (E) Heatmap representing all DEGs obtained after the comparison of Rxrabfl/fl mAMs (n = 4 mice) versus Cd11cCre+Rxrabfl/fl mAMs (n = 3 mice) versus Cd11cCre+Rxrabfl/fl ImmAMs (n = 3 mice) sorted from 9-wk-old mice. (F) PCA plot obtained using the transcriptomes of the previous samples. (G) Volcano plot showing global transcriptomic differences between Rxrabfl/fl mAMs (n = 4 mice) and Cd11cCre+Rxrabfl/fl ImmAMs (n = 3 mice). Colored dots represent DEGs with significant upregulation (p-adj <0.05 and FC >0; red) or significant downregulation (p-adj <0.05 and FC <0; blue). (H) GSEA plots showing negative enrichment for the DNA repair and E2F pathway gene sets in Cd11cCre+Rxrabfl/fl ImmAMs versus Rxrabfl/fl mAMs. (I) Heatmap showing proliferation-related dysregulated genes in the previous samples. (J) Significantly enriched GO terms derived from the bulk RNA-seq data comparison of Cd11cCre+Rxrabfl/fl ImmAMs versus Rxrabfl/fl mAMs, detected with the PANTHER statistical enrichment test tool (P < 0.05 with Bonferroni correction).

Close modal
+ Expand view − Collapse view
Figure S2
Figure S2. Refer to the image caption for details. Panel A shows a bar graph of predicted upstream transcriptional regulators enriched among differentially expressed genes in Cd11cCre positive Rxrab deficient mature alveolar macrophages versus control. Panel B shows a Venn diagram comparing overlaps between differentially expressed genes in Cd11cCre positive Rxrab deficient mature alveolar macrophages and published Cd11cCre positive Pparγ deficient alveolar macrophage datasets. Panel C shows a Venn diagram of overlapping downregulated genes shared between Cd11cCre positive Rxrab deficient and Cd11cCre positive Pparγ deficient alveolar macrophages. Panel D shows a Venn diagram of overlapping upregulated genes shared between Cd11cCre positive Rxrab deficient and Cd11cCre positive Pparγ deficient alveolar macrophages. Panel E shows heatmaps of apoptosis related genes differentially expressed across control, Cd11cCre positive Rxrab deficient mature alveolar macrophages, immature alveolar macrophages, and Cd11cCre positive Pparγ deficient alveolar macrophages. Panel F shows heatmaps of transcription factor identity genes differentially expressed across control, Cd11cCre positive Rxrab deficient mature alveolar macrophages, immature alveolar macrophages, and Cd11cCre positive Pparγ deficient alveolar macrophages. Panel G shows heatmaps of lipid metabolism related genes dysregulated across control, Cd11cCre positive Rxrab deficient mature alveolar macrophages, immature alveolar macrophages, and Cd11cCre positive Pparγ deficient alveolar macrophages. Panel H shows heatmaps of proliferation related genes differentially expressed across control, Cd11cCre positive Rxrab deficient mature alveolar macrophages, immature alveolar macrophages, and Cd11cCre positive Pparγ deficient alveolar macrophages. Panel I shows heatmaps of alveolar macrophage core identity genes differentially expressed across control, Cd11cCre positive Rxrab deficient mature alveolar macrophages, immature alveolar macrophages, and Cd11cCre positive Pparγ deficient alveolar macrophages. Panel J shows a bubble plot of significantly enriched Gene Ontology biological processes associated with inflammatory responses, metabolism, proliferation, and lipid regulation in Cd11cCre positive Pparγ deficient alveolar macrophages. Panel K shows motif enrichment analysis identifying transcription factor binding motifs enriched within PPARγ chromatin binding peaks. Panel L shows UCSC genome browser tracks displaying RXR, PPARγ, and H3K27ac chromatin peaks at representative alveolar macrophage genes including Spi1, Fabp1, Cd36, and Cidec. Panel M shows a Venn diagram comparing overlap between genes nearest to PPARγ and RXR chromatin binding peaks identified by HT-ChIPmentation. Panel N shows a donut chart illustrating genomic feature distribution of overlapping PPARγ and RXR chromatin binding peaks across promoters, introns, exons, untranslated regions, and intergenic regions. Panel O shows a bar graph quantifying associations between overlapping PPARγ-RXR peaks and proximal or distal H3K27ac chromatin regions.

Comparative transcriptomic analysis reveals RXR–PPARγ-driven co-regulation in AMs. (A) Selected upstream transcriptional regulators identified by IPA of DEGs from the comparison between Cd11cCre+Rxrabfl/fl and Rxrabfl/fl mAMs. Significant regulators were defined as –log10 (Benjamini–Hochberg P value) >1.3. (B) Venn diagram of overlaps between DEGs identified in Cd11cCre+Rxrabfl/fl mAMs (bulk RNA-seq) and DEGs from publicly available Cd11cCre+Pparγfl/fl AM transcriptomic data. (C and D) Venn diagrams showing overlapping downregulated (C) and upregulated (D) genes between our Cd11cCre+Rxrabfl/fl RNA-seq dataset and the publicly available Cd11cCre+Pparγfl/fl AM dataset. (E–I) Heatmap of dysregulated genes associated with selected biological processes in Rxrabfl/fl mAMs, Cd11cCre+Rxrabfl/fl mAMs, and Cd11cCre+Rxrabfl/fl ImmAMs, compared with Pparγfl/fl AMs and Cd11cCre+Pparγfl/fl AMs. (J) Significantly enriched GO terms derived from the comparison between Cd11cCre+Pparγfl/fl and Pparγfl/fl AMs (PPARγ array data), identified using the PANTHER statistical enrichment test tool (P < 0.05, Bonferroni correction). (K) HOMER motif enrichment analysis of PPARγ peaks. (L) UCSC genome browser tracks showing RXRα, PPARγ, and H3K27ac HT-ChIPmentation peaks at representative AM genes. Blue boxes indicate regions with peaks identified across datasets. (M) Overlap analysis of genes nearest to PPARγ and RXRα peaks identified by HT-ChIPmentation. (N) Genomic feature distribution of the 4,547 overlapping PPARγ–RXRα peaks. (O) Bar plot showing the association between the 4,547 overlapping PPARγ–RXRα peaks and H3K27ac regions classified as proximal or distal according to distance from the nearest gene.*P <; Test of equal or given proportions (prop.test function in R).

Figure S2.
A multi-panel image illustrates the regulatory roles of RXR and PPAR in various biological processes and gene expressions. Panel A shows a bar graph of predicted upstream transcriptional regulators enriched among differentially expressed genes in Cd11cCre positive Rxrab deficient mature alveolar macrophages versus control. Panel B shows a Venn diagram comparing overlaps between differentially expressed genes in Cd11cCre positive Rxrab deficient mature alveolar macrophages and published Cd11cCre positive Pparγ deficient alveolar macrophage datasets. Panel C shows a Venn diagram of overlapping downregulated genes shared between Cd11cCre positive Rxrab deficient and Cd11cCre positive Pparγ deficient alveolar macrophages. Panel D shows a Venn diagram of overlapping upregulated genes shared between Cd11cCre positive Rxrab deficient and Cd11cCre positive Pparγ deficient alveolar macrophages. Panel E shows heatmaps of apoptosis related genes differentially expressed across control, Cd11cCre positive Rxrab deficient mature alveolar macrophages, immature alveolar macrophages, and Cd11cCre positive Pparγ deficient alveolar macrophages. Panel F shows heatmaps of transcription factor identity genes differentially expressed across control, Cd11cCre positive Rxrab deficient mature alveolar macrophages, immature alveolar macrophages, and Cd11cCre positive Pparγ deficient alveolar macrophages. Panel G shows heatmaps of lipid metabolism related genes dysregulated across control, Cd11cCre positive Rxrab deficient mature alveolar macrophages, immature alveolar macrophages, and Cd11cCre positive Pparγ deficient alveolar macrophages. Panel H shows heatmaps of proliferation related genes differentially expressed across control, Cd11cCre positive Rxrab deficient mature alveolar macrophages, immature alveolar macrophages, and Cd11cCre positive Pparγ deficient alveolar macrophages. Panel I shows heatmaps of alveolar macrophage core identity genes differentially expressed across control, Cd11cCre positive Rxrab deficient mature alveolar macrophages, immature alveolar macrophages, and Cd11cCre positive Pparγ deficient alveolar macrophages. Panel J shows a bubble plot of significantly enriched Gene Ontology biological processes associated with inflammatory responses, metabolism, proliferation, and lipid regulation in Cd11cCre positive Pparγ deficient alveolar macrophages. Panel K shows motif enrichment analysis identifying transcription factor binding motifs enriched within PPARγ chromatin binding peaks. Panel L shows UCSC genome browser tracks displaying RXR, PPARγ, and H3K27ac chromatin peaks at representative alveolar macrophage genes including Spi1, Fabp1, Cd36, and Cidec. Panel M shows a Venn diagram comparing overlap between genes nearest to PPARγ and RXR chromatin binding peaks identified by HT-ChIPmentation. Panel N shows a donut chart illustrating genomic feature distribution of overlapping PPARγ and RXR chromatin binding peaks across promoters, introns, exons, untranslated regions, and intergenic regions. Panel O shows a bar graph quantifying associations between overlapping PPARγ-RXR peaks and proximal or distal H3K27ac chromatin regions.

Comparative transcriptomic analysis reveals RXR–PPARγ-driven co-regulation in AMs. (A) Selected upstream transcriptional regulators identified by IPA of DEGs from the comparison between Cd11cCre+Rxrabfl/fl and Rxrabfl/fl mAMs. Significant regulators were defined as –log10 (Benjamini–Hochberg P value) >1.3. (B) Venn diagram of overlaps between DEGs identified in Cd11cCre+Rxrabfl/fl mAMs (bulk RNA-seq) and DEGs from publicly available Cd11cCre+Pparγfl/fl AM transcriptomic data. (C and D) Venn diagrams showing overlapping downregulated (C) and upregulated (D) genes between our Cd11cCre+Rxrabfl/fl RNA-seq dataset and the publicly available Cd11cCre+Pparγfl/fl AM dataset. (E–I) Heatmap of dysregulated genes associated with selected biological processes in Rxrabfl/fl mAMs, Cd11cCre+Rxrabfl/fl mAMs, and Cd11cCre+Rxrabfl/fl ImmAMs, compared with Pparγfl/fl AMs and Cd11cCre+Pparγfl/fl AMs. (J) Significantly enriched GO terms derived from the comparison between Cd11cCre+Pparγfl/fl and Pparγfl/fl AMs (PPARγ array data), identified using the PANTHER statistical enrichment test tool (P < 0.05, Bonferroni correction). (K) HOMER motif enrichment analysis of PPARγ peaks. (L) UCSC genome browser tracks showing RXRα, PPARγ, and H3K27ac HT-ChIPmentation peaks at representative AM genes. Blue boxes indicate regions with peaks identified across datasets. (M) Overlap analysis of genes nearest to PPARγ and RXRα peaks identified by HT-ChIPmentation. (N) Genomic feature distribution of the 4,547 overlapping PPARγ–RXRα peaks. (O) Bar plot showing the association between the 4,547 overlapping PPARγ–RXRα peaks and H3K27ac regions classified as proximal or distal according to distance from the nearest gene.*P <; Test of equal or given proportions (prop.test function in R).

Close modal
+ Expand view − Collapse view
Figure S3
Figure S3. Refer to the image caption for details. Panel A shows a dot plot correlating RNA sequencing differential gene expression with ATAC sequencing chromatin accessibility changes in Cd11cCre positive Rxrab deficient immature alveolar macrophages. Panel B shows bar graphs of genomic distances between differentially accessible chromatin regions and nearest transcription start sites in control and Cd11cCre positive Rxrab deficient immature alveolar macrophages. Panel C shows donut charts illustrating genomic feature distributions of chromatin regions closed or opened in Cd11cCre positive Rxrab deficient immature alveolar macrophages. Panel D shows a Venn diagram comparing genes associated with chromatin regions opened or closed in Cd11cCre positive Rxrab deficient mature alveolar macrophages. Panel E shows a bubble plot of significantly enriched Gene Ontology biological processes associated with genes linked to open and closed chromatin regions. Panel F shows genomic heatmaps of RXR chromatin binding signals around transcription start sites in control and Cd11cCre positive Rxrab deficient mature alveolar macrophages. Panel G shows a bubble plot of enriched Gene Ontology biological processes associated with RXR controlled genes involved in apoptosis, lipid metabolism, proliferation, and differentiation. Panel H shows MA plots of RXR chromatin immunoprecipitation peaks highlighting proximal and distal H3K27ac associated binding regions in alveolar macrophages. Panel I shows an MA plot illustrating overlap between differentially accessible ATAC sequencing peaks and RXR chromatin binding peaks in mature alveolar macrophages.

ATAC-seq and genome-wide binding show the importance of RXR signaling for AM function, identity, and chromatin regulation. (A) Dot plot showing the correlation between the logFC values of RNA-seq–based DEGs and the logFC values of differentially accessible regions (DARs) obtained by ATAC-seq in Cd11cCre+Rxrabfl/fl ImmAMs versus Rxrabfl/fl mAMs. DARs and DEGs were paired according to the nearest gene detected for each DAR. (B) Distribution of nearest gene TSS distances for DARs in Cd11cCre+Rxrabfl/fl ImmAMs and Rxrabfl/fl mAMs. (C) Distribution of genomic feature associations for DARs in Cd11cCre+Rxrabfl/fl ImmAMs and Rxrabfl/fl mAMs. (D) Venn diagram comparing the collections of genes identified as nearest to open and closed DARs, as identified by ATAC-seq. (E) Significantly enriched GO terms detected with the PANTHER statistical enrichment test tool (P < 0.05 with Bonferroni correction) for the collections of genes exclusively associated with closed regions (green) or open regions (orange), as described by the Venn diagram in E. (F) Genomic heatmaps of RXRα binding signals located in TSS-flanking regions (±5 kb) in sorted mAMs from 9-wk-old Rxrabfl/fl and Cd11cCre+Rxrabfl/fl mice (n = 2 per genotype) (FC ≤ −2 or ≥2, FDR <0.05). (G) Significantly enriched GO terms from RXR-controlled genes detected with the PANTHER statistical overrepresentation test tool (P ≤ 0.05 with Bonferroni correction). (H) MA plots for RXRα ChIPmentation peaks. Orange and blue dots represent 6,365 peaks immunoprecipitated with anti-RXRα antibody exclusively in Rxrabfl/fl mAMs. Dots outlined in black represent peaks that overlap with H3K27ac regions classified as proximal to genes (left plot) or distal (right plot). (I) MA plot showing the overlap between differentially accessible ATAC-seq peaks (FDR <0.05) with RXRα HT-ChIPmentation peaks in mAMs. Colored dots correspond to differentially accessible ATAC-seq peaks with a Log2(FC)xLog2(concentration) value ≥0.65; light red, differentially open peaks with no RXR peak; light blue, differentially closed peaks with no RXR peak; dark red, differentially open peaks colocalizing with RXR peaks; dark blue, differentially closed peaks colocalizing with RXR peaks.

Figure S3.
A multi-panel image illustrates the role of RXR signaling in AM function and chromatin regulation. Panel A shows a dot plot correlating RNA sequencing differential gene expression with ATAC sequencing chromatin accessibility changes in Cd11cCre positive Rxrab deficient immature alveolar macrophages. Panel B shows bar graphs of genomic distances between differentially accessible chromatin regions and nearest transcription start sites in control and Cd11cCre positive Rxrab deficient immature alveolar macrophages. Panel C shows donut charts illustrating genomic feature distributions of chromatin regions closed or opened in Cd11cCre positive Rxrab deficient immature alveolar macrophages. Panel D shows a Venn diagram comparing genes associated with chromatin regions opened or closed in Cd11cCre positive Rxrab deficient mature alveolar macrophages. Panel E shows a bubble plot of significantly enriched Gene Ontology biological processes associated with genes linked to open and closed chromatin regions. Panel F shows genomic heatmaps of RXR chromatin binding signals around transcription start sites in control and Cd11cCre positive Rxrab deficient mature alveolar macrophages. Panel G shows a bubble plot of enriched Gene Ontology biological processes associated with RXR controlled genes involved in apoptosis, lipid metabolism, proliferation, and differentiation. Panel H shows MA plots of RXR chromatin immunoprecipitation peaks highlighting proximal and distal H3K27ac associated binding regions in alveolar macrophages. Panel I shows an MA plot illustrating overlap between differentially accessible ATAC sequencing peaks and RXR chromatin binding peaks in mature alveolar macrophages.

ATAC-seq and genome-wide binding show the importance of RXR signaling for AM function, identity, and chromatin regulation. (A) Dot plot showing the correlation between the logFC values of RNA-seq–based DEGs and the logFC values of differentially accessible regions (DARs) obtained by ATAC-seq in Cd11cCre+Rxrabfl/fl ImmAMs versus Rxrabfl/fl mAMs. DARs and DEGs were paired according to the nearest gene detected for each DAR. (B) Distribution of nearest gene TSS distances for DARs in Cd11cCre+Rxrabfl/fl ImmAMs and Rxrabfl/fl mAMs. (C) Distribution of genomic feature associations for DARs in Cd11cCre+Rxrabfl/fl ImmAMs and Rxrabfl/fl mAMs. (D) Venn diagram comparing the collections of genes identified as nearest to open and closed DARs, as identified by ATAC-seq. (E) Significantly enriched GO terms detected with the PANTHER statistical enrichment test tool (P < 0.05 with Bonferroni correction) for the collections of genes exclusively associated with closed regions (green) or open regions (orange), as described by the Venn diagram in E. (F) Genomic heatmaps of RXRα binding signals located in TSS-flanking regions (±5 kb) in sorted mAMs from 9-wk-old Rxrabfl/fl and Cd11cCre+Rxrabfl/fl mice (n = 2 per genotype) (FC ≤ −2 or ≥2, FDR <0.05). (G) Significantly enriched GO terms from RXR-controlled genes detected with the PANTHER statistical overrepresentation test tool (P ≤ 0.05 with Bonferroni correction). (H) MA plots for RXRα ChIPmentation peaks. Orange and blue dots represent 6,365 peaks immunoprecipitated with anti-RXRα antibody exclusively in Rxrabfl/fl mAMs. Dots outlined in black represent peaks that overlap with H3K27ac regions classified as proximal to genes (left plot) or distal (right plot). (I) MA plot showing the overlap between differentially accessible ATAC-seq peaks (FDR <0.05) with RXRα HT-ChIPmentation peaks in mAMs. Colored dots correspond to differentially accessible ATAC-seq peaks with a Log2(FC)xLog2(concentration) value ≥0.65; light red, differentially open peaks with no RXR peak; light blue, differentially closed peaks with no RXR peak; dark red, differentially open peaks colocalizing with RXR peaks; dark blue, differentially closed peaks colocalizing with RXR peaks.

Close modal
Figure 6.
A multi-panel image depicts gene expression and flow cytometry analysis upon AM depletion. Panel A: A schematic diagram shows the experimental setup for diphtheria toxin (DT) treatment in Cd11cCre+R26LSL-DTR mice to deplete alveolar macrophages (AMs) and monitor repopulation. Panel B: Flow cytometry plots illustrate the repopulation of AMs from recruited monocytes at days 1, 4, 7, and 10 post-DT treatment. The plots are gated on DAPI- CD45+ Ly6G- single cells, showing the expression of SiglecF and CD11c. Panels C to K: Bar graphs display the mRNA relative expression levels of various genes (Cdh1, Ctsk, Itgal, Mmp8, Spi1, Itgax, Slc9F, Ccr2, Itgam, Irf7, Rxra, Rxrb, Pparg, Csfr2b, Tgfbr1, Tgfb1, Notch1, Notch2, Csfr1, Csfr3r) in circulating monocytes (Circ Mon), recruited monocytes (Rec Mon), repopulating/differentiating cells at days 4-10 post-DT, and mature AMs. Each bar graph has the x-axis labeled with the cell types and the y-axis labeled with mRNA relative expression. Data points represent mean values with standard error of the mean (SEM), and statistical significance is indicated with asterisks.

Differentiating recruited monocytes increased expression of AM-specific genes and Rxra upon AM depletion. (A) DT treatment for AM depletion in Cd11cCre+R26LSL-DTR mice. (B) Representative flow cytometry plots illustrating AM repopulation from recruited monocytes after AM depletion. (C–K) Gene expression patterns in circulating monocytes (Circ Mon), recruited monocytes (Rec Mon), repopulating/differentiating cells at 4–10 days after DT, and mAMs, n = 3–5 mice per group. Data are representative of two independent experiments and presented as mean ± SEM; *P ≤ 0.05; **P ≤ 0.01; ***P ≤ 0.001; ****P ≤ 0.0001; one-way ANOVA.

Close modal
Figure 7.
A multi-panel image depicts the role of RXR signaling in alveolar macrophage differentiation and maturation. Panel A: Flow cytometry plots show embryonic and postnatal pre-alveolar macrophage (preAM) and alveolar macrophage (AM) populations at different developmental stages including embryonic day 17.5 (E17.5), embryonic day 18.5 (E18.5), day after birth 1 (DAB1), day after birth 5 (DAB5), and day after birth 10 (DAB10) in Rxrabfl/fl and VaviCre+Rxrabfl/fl mice. The plots are gated on DAPI- CD45+ CD11c+ F4/80int cells and DAPI- CD45+ Ly6G- single cells. Different marker combinations including CD11b, SiglecF, Ly6C, and F4/80 distinguish preAM and AM populations and demonstrate altered maturation in VaviCre+Rxrabfl/fl mice. Panel B: A bar graph quantifies the total cell numbers of embryonic and postnatal macrophage populations shown in panel A for Rxrabfl/fl and VaviCre+Rxrabfl/fl mice. Significant reductions or increases between genotypes are indicated by asterisks representing statistical significance levels. Panel C: Flow cytometry plots on the left show mature alveolar macrophage (mAM) and immature alveolar macrophage (ImmAM) subpopulations in 9-week-old Rxrabfl/fl and VaviCre+Rxrabfl/fl mice. The accompanying bar graph on the right quantifies the proportions or total numbers of these AM subpopulations and highlights significant genotype-dependent differences. Panel D: A schematic diagram illustrates the competitive bone marrow (BM) transplantation procedure in which donor bone marrow cells from different genotypes are transplanted into recipient mice to evaluate alveolar macrophage reconstitution and competitive fitness. Panel E: A bar graph quantifies peripheral blood (PB) chimerism among CD11b-positive cells following bone marrow transplantation, demonstrating the contribution of donor-derived hematopoietic cells in recipient mice. Panel F: Flow cytometry plots show mature alveolar macrophages (mAMs) and immature alveolar macrophages (ImmAMs) in lung tissue following bone marrow transplantation for different donor genotypes, illustrating altered macrophage differentiation capacity. Panel G: A bar graph quantifies the proportion or number of Rxrabfl/fl-derived versus Cd11cCre positive Rxrabfl/fl-derived mature and immature alveolar macrophages after bone marrow transplantation, with significant differences marked by asterisks.

RXR signaling is necessary for correct AM differentiation and maturation. (A) Representative flow cytometry plots showing embryonic and postnatal preAM and AM populations. (B) Quantification of A, showing total cell numbers of the selected populations in Rxrabfl/fl and VaviCre+Rxrabfl/fl mice. n = 7–10 per genotype from two independent experiments. (C) (Left) Representative flow cytometry plots showing AM subpopulations and (right) quantification in 9-wk-old Rxrabfl/fl and VaviCre+Rxrabfl/fl mice. n = 4–5 per genotype; data representative from two independent experiments. (D) Competitive BM transplant procedure. (E) Quantification of PB chimerism in CD11b+ cells. (F) Representative flow cytometry plots showing mAMs and ImmAMs in lungs after BM transplant. (G) Quantification of Rxrabfl/fl versus Cd11cCre+Rxrabfl/fl-derived mAMs and ImmAMs after BM transplant. n = 9–10 per genotype; data are from two pooled independent experiments. All data are shown as means ± SEM; *P ≤ 0.05; **P ≤ 0.01; ****P ≤ 0.0001; unpaired Student T test.

Close modal
+ Expand view − Collapse view
Figure S4
Figure S4. Refer to the image caption for details. Panel A shows a bubble plot identifying ligand-receptor communication networks between alveolar macrophages and lung cell populations. Panel B shows a bar graph demonstrating strong Pparg induction following GM-CSF treatment in progenitor cells. Panel C shows a schematic diagram outlining cytokine treatment conditions for GM-CSF-differentiated bone marrow progenitors. Panel D shows bar graphs comparing Rxra and Rxrb expression after TNF alpha or M-CSF cytokine stimulation. Panel E shows bar graphs demonstrating minimal Rxra and Rxrb expression changes after IL4 or IL6 treatment. Panel F shows bar graphs comparing Rxra and Rxrb expression following IL1, IL33, CCL3, CCL5, and FGF2 stimulation. Panel G shows bar graphs demonstrating unchanged Rxra and Rxrb expression after fibronectin treatment. Panel H shows bar graphs illustrating increased Pparg expression after combined TGF beta and DLL4 stimulation treatments. Panel I shows bar graphs demonstrating elevated Itgax and Siglecf expression after DLL4 and TGF beta co-treatment. Panel J shows a bar graph demonstrating increased Abca1 expression following combined TGF beta and DLL4 treatment conditions. Panel K shows a bar graph illustrating strong induction of Tgfbr1 expression after combined cytokine stimulation treatments. Panel L shows bar graphs demonstrating elevated Itgal and Ucp3 expression following DLL4 and TGF beta co-treatment. Panel M shows bar graphs showing altered Notch1 and Notch2 expression after DLL4 and TGF beta stimulation. Panel N shows a bar graph quantifying stable alveolar macrophage numbers during LY411575 treatment across multiple timepoints. Panel O shows a bar graph demonstrating stable percentages of CD45+ alveolar macrophages during LY411575 treatment. Panel P shows a UMAP plot identifying diverse human lung immune, stromal, epithelial, and vascular cell populations. Panel Q shows a CellPhoneDB bubble plot analyzing signaling ligand and receptor expression across human lung cell populations.

Cell-to-cell communication analysis reveals DLL4 signaling as a key niche signal for Rxr gene induction and AM maturation. (A) Bubble plot showing CellPhoneDB-identified ligand–receptor interaction pairs for different lung cell pairs. Ligands and secretor/surface-expressing cells are in red type, receptors and receptor cells in green type. The color code represents the Log2 mean expression value of the cytokine/receptor genes in the predicted interacting cells. (B) Normalized mRNA expression of Pparg in BM progenitors treated with GM-CSF for 72 h. n = 5–6 per condition. (C) Experimental design of the treatment with different cytokines of GM-CSF differentiated BM progenitors (GM-BMprog). (D–G) Normalized mRNA expression of Rxra and Rxrb in differentiated GM-BMprogs treated with the indicated cytokines for 24 h. n = 3–8 per condition; data are from up to two independent experiments. (H–M) Normalized mRNA expression of different genes in GM-BMprogs treated with TGFβ, DLL4, or TGFβ+DLL4 for 24 h. n > 7 per condition; data are from two pooled independent experiments. (N and O) Quantification of AMs as total cell number (N) and the percentage of CD45+ cells (O) after LY411575 treatment for 0, 1, 4, 7, or 10 days. n > 4 per condition; data are from two independent experiments. (P) UMAP plots showing the analyzed cell populations identified in publicly available scRNA-seq data of human lung. (Q) CellPhoneDB plot analyzing the expression of different signals and receptors in human lung cells. All data are shown as means ± SEM; *P ≤ 0.05; **P ≤ 0.01; ***P ≤ 0.001; ****P ≤ 0.0001; (B–M) unpaired Student t test; (N and O) one-way ANOVA with Tukey’s multiple comparisons test.

Figure S4.
A multi-panel image presents multiple graphs and illustrations related to cell-to-cell communication analysis in the lung niche. Panel A shows a bubble plot identifying ligand-receptor communication networks between alveolar macrophages and lung cell populations. Panel B shows a bar graph demonstrating strong Pparg induction following GM-CSF treatment in progenitor cells. Panel C shows a schematic diagram outlining cytokine treatment conditions for GM-CSF-differentiated bone marrow progenitors. Panel D shows bar graphs comparing Rxra and Rxrb expression after TNF alpha or M-CSF cytokine stimulation. Panel E shows bar graphs demonstrating minimal Rxra and Rxrb expression changes after IL4 or IL6 treatment. Panel F shows bar graphs comparing Rxra and Rxrb expression following IL1, IL33, CCL3, CCL5, and FGF2 stimulation. Panel G shows bar graphs demonstrating unchanged Rxra and Rxrb expression after fibronectin treatment. Panel H shows bar graphs illustrating increased Pparg expression after combined TGF beta and DLL4 stimulation treatments. Panel I shows bar graphs demonstrating elevated Itgax and Siglecf expression after DLL4 and TGF beta co-treatment. Panel J shows a bar graph demonstrating increased Abca1 expression following combined TGF beta and DLL4 treatment conditions. Panel K shows a bar graph illustrating strong induction of Tgfbr1 expression after combined cytokine stimulation treatments. Panel L shows bar graphs demonstrating elevated Itgal and Ucp3 expression following DLL4 and TGF beta co-treatment. Panel M shows bar graphs showing altered Notch1 and Notch2 expression after DLL4 and TGF beta stimulation. Panel N shows a bar graph quantifying stable alveolar macrophage numbers during LY411575 treatment across multiple timepoints. Panel O shows a bar graph demonstrating stable percentages of CD45+ alveolar macrophages during LY411575 treatment. Panel P shows a UMAP plot identifying diverse human lung immune, stromal, epithelial, and vascular cell populations. Panel Q shows a CellPhoneDB bubble plot analyzing signaling ligand and receptor expression across human lung cell populations.

Cell-to-cell communication analysis reveals DLL4 signaling as a key niche signal for Rxr gene induction and AM maturation. (A) Bubble plot showing CellPhoneDB-identified ligand–receptor interaction pairs for different lung cell pairs. Ligands and secretor/surface-expressing cells are in red type, receptors and receptor cells in green type. The color code represents the Log2 mean expression value of the cytokine/receptor genes in the predicted interacting cells. (B) Normalized mRNA expression of Pparg in BM progenitors treated with GM-CSF for 72 h. n = 5–6 per condition. (C) Experimental design of the treatment with different cytokines of GM-CSF differentiated BM progenitors (GM-BMprog). (D–G) Normalized mRNA expression of Rxra and Rxrb in differentiated GM-BMprogs treated with the indicated cytokines for 24 h. n = 3–8 per condition; data are from up to two independent experiments. (H–M) Normalized mRNA expression of different genes in GM-BMprogs treated with TGFβ, DLL4, or TGFβ+DLL4 for 24 h. n > 7 per condition; data are from two pooled independent experiments. (N and O) Quantification of AMs as total cell number (N) and the percentage of CD45+ cells (O) after LY411575 treatment for 0, 1, 4, 7, or 10 days. n > 4 per condition; data are from two independent experiments. (P) UMAP plots showing the analyzed cell populations identified in publicly available scRNA-seq data of human lung. (Q) CellPhoneDB plot analyzing the expression of different signals and receptors in human lung cells. All data are shown as means ± SEM; *P ≤ 0.05; **P ≤ 0.01; ***P ≤ 0.001; ****P ≤ 0.0001; (B–M) unpaired Student t test; (N and O) one-way ANOVA with Tukey’s multiple comparisons test.

Close modal
Figure 8.
A multi-panel image depicts the role of GM-CSF, TGF, and DLL4 in alveolar macrophage differentiation and maturation. Panel A shows a bubble plot summarizing ligand-receptor interactions between alveolar macrophages and lung stromal populations. Panel B shows bar graphs demonstrating GM-CSF-induced upregulation of Rxra and Rxrb in macrophage progenitors. Panel C shows bar graphs illustrating altered Rxra and Rxrb expression following TGF beta stimulation in macrophage progenitors. Panel D shows bar graphs demonstrating DLL4-mediated induction of Rxra and Rxrb expression in macrophage progenitors. Panel E shows heatmaps displaying cytokine signaling and alveolar macrophage-specific gene expression after combined cytokine treatments. Panel F shows a schematic diagram outlining GM-CSF-derived macrophage progenitor differentiation and cytokine stimulation workflow. Panel G shows bar graphs quantifying increased cytokine receptor expression after DLL4 and TGF beta co-treatment conditions. Panel H shows bar graphs demonstrating enhanced Rxra and Rxrb expression following combined DLL4 and TGF beta stimulation. Panel I shows a schematic diagram illustrating tamoxifen-induced endothelial DLL4 deletion experimental strategy in adult mice. Panel J shows flow cytometry plots identifying reduced alveolar macrophage populations in endothelial DLL4-deficient mouse lungs. Panel K shows bar graphs quantifying significantly decreased alveolar macrophage numbers after endothelial DLL4 deletion in mice. Panel L shows bar garphs quantifying altered peripheral blood leukocyte populations following endothelial DLL4 deletion treatment. Panel M shows flow cytometry plots demonstrating impaired alveolar macrophage recovery after LY411575 and diphtheria toxin treatment. Panel N shows a line graph quantifying suppressed alveolar macrophage repopulation following LY411575-mediated Notch signaling inhibition.

GM-CSF, TGFβ, and DLL4 are necessary for AM differentiation and maturation. (A) Bubble plot showing CellPhoneDB-identified ligand–receptor interaction pairs for different lung–cell pairs. Ligands and secretor/presenter cells are in red type, receptors and receptor cells in green type. The color code represents the Log2 mean expression values of the cytokine and receptor genes in the predicted interacting cells. (B) Normalized mRNA expression of Rxra and Rxrb in M-CSF–derived BM progenitors (M-BMprog) treated with GM-CSF for 72 h. n = 5–6 per condition; data are representative from two independent experiments. (C) Normalized mRNA expression of Rxra and Rxrb in M-BMprogs treated with TGFβ for 24 h. n = 7–8 per condition; data are representative from two independent experiments. (D) Normalized mRNA expression of Rxra and Rxrb in M-BMprogs treated with DLL4 for 24 h. n = 4–5 per condition; data are representative from two independent experiments. (E) Heatmap showing AM-related genes in M-BMprogs and BM monocytes (BMmono) treated with DLL4 and/or TGFβ or DLL4-Dapt. Orange values are >8. (F) Experimental design for the treatment of GM-CSF–derived BM progenitors (GM-BMprogs) with TGFβ, DLL4, or both molecules for 24 h. (G) Normalized mRNA expression of AM cytokine receptors. n > 7 per condition; data are from two pooled independent experiments. (H) Normalized mRNA expression of Rxra and Rxrb. n > 7 per condition; data are from two pooled independent experiments. (I) Experimental design of tamoxifen injection in Dll4fl/fl and Cdh5Cre+ERTDll4fl/fl mice. (J) Representative flow cytometry plot of AMs gated on Single/DAPI/CD45+/Ly6G cells in tamoxifen-treated Dll4fl/fl and Cdh5Cre+ERTDll4fl/fl adult mice. (K) AM quantification in 11-wk-old Dll4fl/fl versus Cdh5Cre+ERTDll4fl/fl mice. (L) PB leukocyte populations as a percentage of CD45+ cells in tamoxifen-treated Dll4fl/fl and Cdh5Cre+ERTDll4fl/fl adult mice. n > 6 per genotype; data are from two pooled independent experiments. (M) Representative flow cytometry dot plots of lung homogenates (based on Fig. 8 J gating strategy), showing AM recovery after treatment with DT or DT+LY411575. (N) Total numbers of AMs after DT or DT+LY411575 treatment. n = 5–8 per genotype; data are from two independent experiments. All data are shown as means ± SEM; *P ≤ 0.05; **P ≤ 0.01; ***P ≤ 0.001; ****P ≤ 0.0001; ####P ≤ 0.0001; (B–D and K–L) unpaired Student t test; (G and H) one-way ANOVA with Tukey’s multiple comparisons test; (N) two-way ANOVA with Tukey’s multiple comparisons test.

Close modal
Figure 9.
A multi-panel image depicts the interactions and binding sites of transcription factors STAT5, SMAD4, RBPJ, and RXR in macrophage-specific genes. Panel A shows HOMER motif enrichment tables identifying STAT5, SMAD4 and RBPJ-associated transcription factor binding motifs. Panel B shows UCSC genome browser tracks displaying overlapping STAT5, SMAD4, RBPJ, and RXR chromatin binding regions. Panel C shows a donut chart summarizing genomic feature distribution of shared transcription factor binding peaks. Panel D shows a bar graph quantifying shared transcription factor peaks associated with distal H3K27ac regions. Panel E shows a Venn diagram comparing overlapping target genes regulated by STAT5, SMAD4, RBPJ, and RXR. Panel F shows a combinatorial heatmap summarizing coordinated transcription factor regulation across annotated alveolar macrophage core genes.

AM identity depends on cooperation between RBPJ, RXR, SMAD, and STAT5. (A) HOMER motif enrichment analysis for STAT5, SMAD4, and in vivo RBPJ peaks. (B) UCSC genome browser plots showing STAT5, SMAD4, RBPJ, and RXRα ChIP data peaks in macrophage-specific genes, Rxra, the GM-CSF and TGFβ receptor genes (Csf2rb2 and Tgfbr2), and AM-core genes. The blue boxes indicate the areas with peaks identified in the different datasets. (C) Genomic feature distribution for 756 STAT5, SMAD4, RBPJ, and RXRα overlapping peaks. (D) Bar plot showing the association between 756 STAT5, SMAD4, RBPJ, and RXRα overlapping peaks and H3K27ac regions classified as proximal or distal according to their distance from the nearest gene. (E) Overlapping analysis of the collections of genes identified as nearest to STAT5, SMAD4, RBPJ, and RXRα regions detected by ChIP techniques. (F) Analysis of STAT5, SMAD4, RBPJ, and RXRα combinatorial regulation of annotated AM-core genes. *P ≤ 0.05; Test of equal or given proportions (prop.test function in R).

Close modal
+ Expand view − Collapse view
Figure S5
Figure S5. Refer to the image caption for details. Panel A shows UCSC genome browser tracks identifying shared STAT5, SMAD4, RBPJ, and RXR binding regions in Zeb2 and Cd11c genes. Panel B shows UCSC genome browser tracks highlighting transcription factor binding at apoptosis and lipid metabolism-associated genes. Panel C shows a Venn diagram comparing shared STAT5, SMAD4, RBPJ, RXR targets with alveolar macrophage core genes. Panel D shows a combinatorial regulation heatmap summarizing transcription factor occupancy across annotated alveolar macrophage core genes. Panel E shows a Venn diagram comparing overlap between in vivo and in vitro RBPJ chromatin binding datasets. Panel F shows motif enrichment tables identifying transcription factor motifs enriched within in vitro RBPJ chromatin peaks. Panel G shows a heatmap summarizing alveolar macrophage core gene expression after DLL4, GM-CSF, and TGFr-KO treatments.

RBPJ, RXR, SMAD, and STAT5 cooperate in the regulation of AM-core gene expression. (A and B) UCSC genome browser plots showing STAT5, SMAD4, RBPJ, and RXRα ChIP data peaks in (A) Zeb2 and Cd11c and (B) apoptosis- and lipid metabolism–related genes. The blue boxes indicate the areas with peaks identified in the different datasets. (C) Overlapping analysis between 1,342 genes identified as nearest to all STAT5, SMAD4, RBPJ, and RXRα ChIPmentation peak sets with AM-core genes. (D) STAT5, SMAD4, RBPJ, and RXRα combinatorial regulation of annotated AM-core genes. (E) Venn diagram showing overlap analysis between in vivo and in vitro RBPJ HT-ChIPmentation data in AMs. (F) HOMER motif enrichment analysis for in vitro RBPJ peaks. (G) Heatmap obtained using publicly available data, showing the expression values of AM-core genes upregulated after DLL4 or GM-CSF treatment and downregulated in TGFβr-KO AMs; NT, non-treated.

Figure S5.
A multi-panel image depicts gene regulation and transcription factor interactions. Panel A shows UCSC genome browser tracks identifying shared STAT5, SMAD4, RBPJ, and RXR binding regions in Zeb2 and Cd11c genes. Panel B shows UCSC genome browser tracks highlighting transcription factor binding at apoptosis and lipid metabolism-associated genes. Panel C shows a Venn diagram comparing shared STAT5, SMAD4, RBPJ, RXR targets with alveolar macrophage core genes. Panel D shows a combinatorial regulation heatmap summarizing transcription factor occupancy across annotated alveolar macrophage core genes. Panel E shows a Venn diagram comparing overlap between in vivo and in vitro RBPJ chromatin binding datasets. Panel F shows motif enrichment tables identifying transcription factor motifs enriched within in vitro RBPJ chromatin peaks. Panel G shows a heatmap summarizing alveolar macrophage core gene expression after DLL4, GM-CSF, and TGFr-KO treatments.

RBPJ, RXR, SMAD, and STAT5 cooperate in the regulation of AM-core gene expression. (A and B) UCSC genome browser plots showing STAT5, SMAD4, RBPJ, and RXRα ChIP data peaks in (A) Zeb2 and Cd11c and (B) apoptosis- and lipid metabolism–related genes. The blue boxes indicate the areas with peaks identified in the different datasets. (C) Overlapping analysis between 1,342 genes identified as nearest to all STAT5, SMAD4, RBPJ, and RXRα ChIPmentation peak sets with AM-core genes. (D) STAT5, SMAD4, RBPJ, and RXRα combinatorial regulation of annotated AM-core genes. (E) Venn diagram showing overlap analysis between in vivo and in vitro RBPJ HT-ChIPmentation data in AMs. (F) HOMER motif enrichment analysis for in vitro RBPJ peaks. (G) Heatmap obtained using publicly available data, showing the expression values of AM-core genes upregulated after DLL4 or GM-CSF treatment and downregulated in TGFβr-KO AMs; NT, non-treated.

Close modal

References

Bain
,
C.C.
,
C.A.
Hawley
,
H.
Garner
,
C.L.
Scott
,
A.
Schridde
,
N.J.
Steers
,
M.
Mack
,
A.
Joshi
,
M.
Guilliams
,
A.M.
Mowat
, et al
.
2016
.
Long-lived self-renewing bone marrow-derived macrophages displace embryo-derived cells to inhabit adult serous cavities
.
Nat. Commun.
7
:
ncomms11852
.
Bain
,
C.C.
, and
A.S.
MacDonald
.
2022
.
The impact of the lung environment on macrophage development, activation and function: Diversity in the face of adversity
.
Mucosal. Immunol.
15
:
223
234
.
Bleriot
,
C.
,
S.
Chakarov
, and
F.
Ginhoux
.
2020
.
Determinants of resident tissue macrophage identity and function
.
Immunity
.
52
:
957
970
.
Bonnardel
,
J.
,
W.
T’jonck
,
D.
Gaublomme
,
R.
Browaeys
,
C.L.
Scott
,
L.
Martens
,
B.
Vanneste
,
S.
De Prijck
,
S.A.
Nedospasov
,
A.
Kremer
, et al
.
2019
.
Stellate cells, hepatocytes, and endothelial cells imprint the Kupffer cell identity on monocytes colonizing the liver macrophage niche
.
Immunity
.
51
:
638
654.e9
.
Brocker
,
T.
,
M.
Riedinger
, and
K.
Karjalainen
.
1997
.
Targeted expression of major histocompatibility complex (MHC) class II molecules demonstrates that dendritic cells can induce negative but not positive selection of thymocytes in vivo
.
J. Exp. Med.
185
:
541
550
.
Buch
,
T.
,
F.L.
Heppner
,
C.
Tertilt
,
T.J.
Heinen
,
M.
Kremer
,
F.T.
Wunderlich
,
S.
Jung
, and
A.
Waisman
.
2005
.
A Cre-inducible diphtheria toxin receptor mediates cell lineage ablation after toxin administration
.
Nat. Methods
.
2
:
419
426
.
Buenrostro
,
J.D.
,
B.
Wu
,
H.Y.
Chang
, and
W.J.
Greenleaf
.
2015
.
ATAC-seq: A method for assaying chromatin accessibility genome-wide
.
Curr. Protoc. Mol. Biol.
109
:
21.29.1
21.29.9
.
Cain
,
D.W.
,
E.G.
O’koren
,
M.J.
Kan
,
M.
Womble
,
G.D.
Sempowski
,
K.
Hopper
,
M.D.
Gunn
, and
G.
Kelsoe
.
2013
.
Identification of a tissue-specific, C/EBPbeta-dependent pathway of differentiation for murine peritoneal macrophages
.
J. Immunol.
191
:
4665
4675
.
Casals
,
C.
,
J.
Arias-Diaz
,
F.
Valino
,
A.
Saenz
,
C.
Garcia
,
J.L.
Balibrea
, and
E.
Vara
.
2003
.
Surfactant strengthens the inhibitory effect of C-reactive protein on human lung macrophage cytokine release
.
Am. J. Physiol. Lung Cell Mol. Physiol.
284
:
L466
L472
.
Casals
,
C.
,
L.
Herrera
,
E.
Miguel
,
P.
Garcia-Barreno
, and
A.M.
Municio
.
1989
.
Comparison between intra- and extracellular surfactant in respiratory distress induced by oleic acid
.
Biochim. Biophys. Acta
.
1003
:
201
203
.
Casals
,
C.
,
A.
Varela
,
M.L.
Ruano
,
F.
Valino
,
J.
Perez-Gil
,
N.
Torre
,
E.
Jorge
,
F.
Tendillo
, and
J.L.
Castillo-Olivares
.
1998
.
Increase of C-reactive protein and decrease of surfactant protein A in surfactant after lung transplantation
.
Am. J. Respir. Crit. Care Med.
157
:
43
49
.
Casanova-Acebes
,
M.
,
M.P.
Menendez-Gutierrez
,
J.
Porcuna
,
D.
Alvarez-Errico
,
Y.
Lavin
,
A.
Garcia
,
S.
Kobayashi
,
J.
Le Berichel
,
V.
Nunez
,
F.
Were
, et al
.
2020
.
RXRs control serous macrophage neonatal expansion and identity and contribute to ovarian cancer progression
.
Nat. Commun.
11
:
1655
.
Clausen
,
B.E.
,
C.
Burkhardt
,
W.
Reith
,
R.
Renkawitz
, and
I.
Forster
.
1999
.
Conditional gene targeting in macrophages and granulocytes using LysMcre mice
.
Transgenic Res.
8
:
265
277
.
Cohen
,
M.
,
A.
Giladi
,
A.D.
Gorki
,
D.G.
Solodkin
,
M.
Zada
,
A.
Hladik
,
A.
Miklosi
,
T.M.
Salame
,
K.B.
Halpern
,
E.
David
, et al
.
2018
.
Lung single-cell signaling interaction map reveals basophil role in macrophage imprinting
.
Cell
.
175
:
1031
1044.e18
.
Da Costa Loureiro
,
L.
,
L.
Da Costa Loureiro
,
E.A.
Gabriel-Junior
,
F.A.
Zambuzi
,
C.
Fontanari
,
H.
Sales-Campos
,
F.G.
Frantz
,
L.H.
Faccioli
, and
C.A.
Sorgi
.
2020
.
Pulmonary surfactant phosphatidylcholines induce immunological adaptation of alveolar macrophages
.
Mol. Immunol.
122
:
163
172
.
De Boer
,
J.
,
A.
Williams
,
G.
Skavdis
,
N.
Harker
,
M.
Coles
,
M.
Tolaini
,
T.
Norton
,
K.
Williams
,
K.
Roderick
,
A.J.
Potocnik
, and
D.
Kioussis
.
2003
.
Transgenic mice with hematopoietic and lymphoid specific expression of Cre
.
Eur. J. Immunol.
33
:
314
325
.
Dimitrov
,
D.
,
D.
Turei
,
M.
Garrido-Rodriguez
,
P.L.
Burmedi
,
J.S.
Nagai
,
C.
Boys
,
R.O.
Ramirez Flores
,
H.
Kim
,
B.
Szalai
,
I.G.
Costa
, et al
.
2022
.
Comparison of methods and resources for cell-cell communication inference from single-cell RNA-Seq data
.
Nat. Commun.
13
:
3224
.
Dorr
,
D.
,
B.
Obermayer
,
J.M.
Weiner
,
K.
Zimmermann
,
C.
Anania
,
L.K.
Wagner
,
E.M.
Lyras
,
V.
Sapozhnikova
,
D.
Lara-Astiaso
,
F.
Prosper
, et al
.
2022
.
C/EBPbeta regulates lipid metabolism and Pparg isoform 2 expression in alveolar macrophages
.
Sci. Immunol.
7
:eabj0140.
Efremova
,
M.
,
M.
Vento-Tormo
,
S.A.
Teichmann
, and
R.
Vento-Tormo
.
2020
.
CellPhoneDB: Inferring cell-cell communication from combined expression of multi-subunit ligand-receptor complexes
.
Nat. Protoc.
15
:
1484
1506
.
Epelman
,
S.
,
K.J.
Lavine
, and
G.J.
Randolph
.
2014
.
Origin and functions of tissue macrophages
.
Immunity
.
41
:
21
35
.
Fernández-Chacón
,
M.
,
S.
Mühleder
,
A.
Regano
,
L.
Garcia-Ortega
,
S.F.
Rocha
,
C.
Torroja
,
M.S.
Sanchez-Muñoz
,
M.
Lytvyn
,
V.
Casquero-Garcia
,
M.
De Andrés-Laguillo
, et al
.
2023
.
Incongruence between transcriptional and vascular pathophysiological cell states
.
Nat. Cardiovasc. Res.
2
:
2023530
2023549
.
Gautier
,
E.L.
,
T.
Shay
,
J.
Miller
,
M.
Greter
,
C.
Jakubzick
,
S.
Ivanov
,
J.
Helft
,
A.
Chow
,
K.G.
Elpek
,
S.
Gordonov
, et al
.
2012
.
Gene-expression profiles and transcriptional regulatory pathways that underlie the identity and diversity of mouse tissue macrophages
.
Nat. Immunol.
13
:
1118
1128
.
Georgiades
,
P.
,
S.
Ogilvy
,
H.
Duval
,
D.R.
Licence
,
D.S.
Charnock-Jones
,
S.K.
Smith
, and
C.G.
Print
.
2002
.
VavCre transgenic mice: A tool for mutagenesis in hematopoietic and endothelial lineages
.
Genesis
.
34
:
251
256
.
Ginhoux
,
F.
, and
M.
Guilliams
.
2016
.
Tissue-resident macrophage ontogeny and homeostasis
.
Immunity
.
44
:
439
449
.
Gomez Perdiguero
,
E.
,
K.
Klapproth
,
C.
Schulz
,
K.
Busch
,
E.
Azzoni
,
L.
Crozet
,
H.
Garner
,
C.
Trouillet
,
M.F.
De Bruijn
,
F.
Geissmann
, and
H.R.
Rodewald
.
2015
.
Tissue-resident macrophages originate from yolk-sac-derived erythro-myeloid progenitors
.
Nature
.
518
:
547
551
.
Gschwend
,
J.
,
S.P.M.
Sherman
,
F.
Ridder
,
X.
Feng
,
H.E.
Liang
,
R.M.
Locksley
,
B.
Becher
, and
C.
Schneider
.
2021
.
Alveolar macrophages rely on GM-CSF from alveolar epithelial type 2 cells before and after birth
.
J. Exp. Med.
218
:e20210745.
Guilliams
,
M.
,
I.
De Kleer
,
S.
Henri
,
S.
Post
,
L.
Vanhoutte
,
S.
De Prijck
,
K.
Deswarte
,
B.
Malissen
,
H.
Hammad
, and
B.N.
Lambrecht
.
2013
.
Alveolar macrophages develop from fetal monocytes that differentiate into long-lived cells in the first week of life via GM-CSF
.
J. Exp. Med.
210
:
1977
1992
.
Guilliams
,
M.
,
G.R.
Thierry
,
J.
Bonnardel
, and
M.
Bajenoff
.
2020
.
Establishment and maintenance of the macrophage niche
.
Immunity
.
52
:
434
451
.
Gustafsson
,
C.
,
A.
De Paepe
,
C.
Schmidl
, and
R.
Mansson
.
2019
.
High-throughput ChIPmentation: Freely scalable, single day ChIPseq data generation from very low cell-numbers
.
BMC Genomics
.
20
:
59
.
Hao
,
Y.
,
S.
Hao
,
E.
Andersen-Nissen
,
W.M.
Mauck 3rd
,
S.
Zheng
,
A.
Butler
,
M.J.
Lee
,
A.J.
Wilk
,
C.
Darby
,
M.
Zager
, et al
.
2021
.
Integrated analysis of multimodal single-cell data
.
Cell
.
184
:
3573
3587.e29
.
Hashimoto
,
D.
,
A.
Chow
,
C.
Noizat
,
P.
Teo
,
M.B.
Beasley
,
M.
Leboeuf
,
C.D.
Becker
,
P.
See
,
J.
Price
,
D.
Lucas
, et al
.
2013
.
Tissue-resident macrophages self-maintain locally throughout adult life with minimal contribution from circulating monocytes
.
Immunity
.
38
:
792
804
.
Heinz
,
S.
,
C.
Benner
,
N.
Spann
,
E.
Bertolino
,
Y.C.
Lin
,
P.
Laslo
,
J.X.
Cheng
,
C.
Murre
,
H.
Singh
, and
C.K.
Glass
.
2010
.
Simple combinations of lineage-determining transcription factors prime cis-regulatory elements required for macrophage and B cell identities
.
Mol. Cell
.
38
:
576
589
.
Hu
,
G.
, and
J.W.
Christman
.
2019
.
Editorial: Alveolar macrophages in lung inflammation and resolution
.
Front. Immunol.
10
:
2275
.
Izquierdo
,
H.M.
,
P.
Brandi
,
M.J.
Gómez
,
R.
Conde-Garrosa
,
E.
Priego
,
M.
Enamorado
,
S.
Martínez-Cano
,
I.
Sánchez
,
L.
Conejero
,
D.
Jimenez-Carretero
, et al
.
2018
.
Von Hippel-Lindau protein is required for optimal alveolar macrophage terminal differentiation, self-renewal, and function
.
Cell Rep.
24
:
1738
1746
.
Joshi
,
N.
,
J.M.
Walter
, and
A.V.
Misharin
.
2018
.
Alveolar macrophages
.
Cell Immunol.
330
:
86
90
.
Langmead
,
B.
, and
S.L.
Salzberg
.
2012
.
Fast gapped-read alignment with Bowtie 2
.
Nat. Methods
.
9
:
357
359
.
Lavin
,
Y.
,
D.
Winter
,
R.
Blecher-Gonen
,
E.
David
,
H.
Keren-Shaul
,
M.
Merad
,
S.
Jung
, and
I.
Amit
.
2014
.
Tissue-resident macrophage enhancer landscapes are shaped by the local microenvironment
.
Cell
.
159
:
1312
1326
.
Lefebvre
,
P.
,
Y.
Benomar
, and
B.
Staels
.
2010
.
Retinoid X receptors: Common heterodimerization partners with distinct functions
.
Trends Endocrinol. Metab.
21
:
676
683
.
Li
,
B.
, and
C.N.
Dewey
.
2011
.
RSEM: Accurate transcript quantification from RNA-seq data with or without a reference genome
.
BMC Bioinformatics
.
12
:
323
.
Li
,
F.
,
P.
Huangyang
,
M.
Burrows
,
K.
Guo
,
R.
Riscal
,
J.
Godfrey
,
K.E.
Lee
,
N.
Lin
,
P.
Lee
,
I.A.
Blair
, et al
.
2020
.
FBP1 loss disrupts liver metabolism and promotes tumorigenesis through a hepatic stellate cell senescence secretome
.
Nat. Cell Biol.
22
:
728
739
.
Li
,
H.
,
B.
Handsaker
,
A.
Wysoker
,
T.
Fennell
,
J.
Ruan
,
N.
Homer
,
G.
Marth
,
G.
Abecasis
,
R.
Durbin
, and
S.
Genome Project Data Processing
.
2009
.
The sequence alignment/map format and SAMtools
.
Bioinformatics
.
25
:
2078
2079
.
Liu
,
Z.
,
Y.
Gu
,
S.
Chakarov
,
C.
Bleriot
,
I.
Kwok
,
X.
Chen
,
A.
Shin
,
W.
Huang
,
R.J.
Dress
,
C.A.
Dutertre
, et al
.
2019
.
Fate mapping via Ms4a3-expression history traces monocyte-derived cells
.
Cell
.
178
:
1509
1525.e19
.
Martin
,
M.
2011
.
Cutadapt removes adapter sequences from high-throughput sequencing reads
.
EMBnet J.
17
:
10
12
.
Mass
,
E.
,
I.
Ballesteros
,
M.
Farlik
,
F.
Halbritter
,
P.
Gunther
,
L.
Crozet
,
C.E.
Jacome-Galarza
,
K.
Handler
,
J.
Klughammer
,
Y.
Kobayashi
, et al
.
2016
.
Specification of tissue-resident macrophages during organogenesis
.
Science
.
353
:
aaf4238
.
Mccarthy
,
D.J.
,
K.R.
Campbell
,
A.T.
Lun
, and
Q.F.
Wills
.
2017
.
Scater: Pre-processing, quality control, normalization and visualization of single-cell RNA-seq data in R
.
Bioinformatics
.
33
:
1179
1186
.
Mccowan
,
J.
,
F.
Fercoq
,
P.M.
Kirkwood
,
W.
T’jonck
,
L.M.
Hegarty
,
C.M.
Mawer
,
R.
Cunningham
,
A.S.
Mirchandani
,
A.
Hoy
,
D.C.
Humphries
, et al
.
2021
.
The transcription factor EGR2 is indispensable for tissue-specific imprinting of alveolar macrophages in health and tissue repair
.
Sci. Immunol.
6
:eabj2132.
Menendez-Gutierrez
,
M.P.
,
J.
Porcuna
,
R.
Nayak
,
A.
Paredes
,
H.
Niu
,
V.
Nunez
,
A.
Paranjpe
,
M.J.
Gomez
,
A.
Bhattacharjee
,
D.J.
Schnell
, et al
.
2023
.
Retinoid X receptor promotes hematopoietic stem cell fitness and quiescence and preserves hematopoietic homeostasis
.
Blood
.
141
:
592
608
.
Menendez-Gutierrez
,
M.P.
, and
M.
Ricote
.
2017
.
The multi-faceted role of retinoid X receptor in bone remodeling
.
Cell Mol. Life Sci.
74
:
2135
2149
.
Menendez-Gutierrez
,
M.P.
,
T.
Roszer
,
L.
Fuentes
,
V.
Nunez
,
A.
Escolano
,
J.M.
Redondo
,
N.
De Clerck
,
D.
Metzger
,
A.F.
Valledor
, and
M.
Ricote
.
2015
.
Retinoid X receptors orchestrate osteoclast differentiation and postnatal bone remodeling
.
J. Clin. Invest.
125
:
809
823
.
Minutti
,
C.M.
,
B.
Garcia-Fojeda
,
A.
Saenz
,
M.
De Las Casas-Engel
,
R.
Guillamat-Prats
,
A.
De Lorenzo
,
A.
Serrano-Mollar
,
A.L.
Corbi
, and
C.
Casals
.
2016
.
Surfactant protein A prevents IFN-gamma/IFN-gamma receptor interaction and attenuates classical activation of human alveolar macrophages
.
J. Immunol.
197
:
590
598
.
Ning
,
S.
,
J.S.
Pagano
, and
G.N.
Barber
.
2011
.
IRF7: Activation, regulation, modification and function
.
Genes Immun.
12
:
399
414
.
Perez
,
E.
,
W.
Bourguet
,
H.
Gronemeyer
, and
A.R.
De Lera
.
2012
.
Modulation of RXR function through ligand design
.
Biochim. Biophys. Acta
.
1821
:
57
69
.
Porcuna
,
J.
,
M.P.
Menendez-Gutierrez
, and
M.
Ricote
.
2020
.
Molecular control of tissue-resident macrophage identity by nuclear receptors
.
Curr. Opin. Pharmacol.
53
:
27
34
.
Ramírez
,
F.
,
D.P.
Ryan
,
B.
Grüning
,
V.
Bhardwaj
,
F.
Kilpert
,
A.S.
Richter
,
S.
Heyne
,
F.
Dündar
, and
T.
Manke
.
2016
.
deepTools2: a next generation web server for deep-sequencing data analysis
.
Nucleic Acids Res
.
44
:
W160
W165
.
Ritchie
,
M.E.
,
B.
Phipson
,
D.
Wu
,
Y.
Hu
,
C.W.
Law
,
W.
Shi
, and
G.K.
Smyth
.
2015
.
Limma powers differential expression analyses for RNA-sequencing and microarray studies
.
Nucleic Acids Res.
43
:e47.
Robinson
,
M.D.
,
D.J.
Mccarthy
, and
G.K.
Smyth
.
2010
.
edgeR: A bioconductor package for differential expression analysis of digital gene expression data
.
Bioinformatics
.
26
:
139
140
.
Ross-Innes
,
C.S.
,
R.
Stark
,
A.E.
Teschendorff
,
K.A.
Holmes
,
H.R.
Ali
,
M.J.
Dunning
,
G.D.
Brown
,
O.
Gojis
,
I.O.
Ellis
,
A.R.
Green
, et al
.
2012
.
Differential oestrogen receptor binding is associated with clinical outcome in breast cancer
.
Nature
.
481
:
389
393
.
Rőszer
,
T.
,
M.P.
Menendez-Gutierrez
,
M.
Cedenilla
, and
M.
Ricote
.
2013
.
Retinoid X receptors in macrophage biology
.
Trends Endocrinol. Metab.
24
:
460
468
.
Sajti
,
E.
,
V.M.
Link
,
Z.
Ouyang
,
N.J.
Spann
,
E.
Westin
,
C.E.
Romanoski
,
G.J.
Fonseca
,
L.S.
Prince
, and
C.K.
Glass
.
2020
.
Transcriptomic and epigenetic mechanisms underlying myeloid diversity in the lung
.
Nat. Immunol.
21
:
221
231
.
Sakai
,
M.
,
T.D.
Troutman
,
J.S.
Seidman
,
Z.
Ouyang
,
N.J.
Spann
,
Y.
Abe
,
K.M.
Ego
,
C.M.
Bruni
,
Z.
Deng
,
J.C.M.
Schlachetzki
, et al
.
2019
.
Liver-derived signals sequentially reprogram myeloid enhancers to initiate and maintain Kupffer cell identity
.
Immunity
.
51
:
655
670.e8
.
Schneider
,
C.
,
S.P.
Nobs
,
M.
Kurrer
,
H.
Rehrauer
,
C.
Thiele
, and
M.
Kopf
.
2014
.
Induction of the nuclear receptor PPAR-gamma by the cytokine GM-CSF is critical for the differentiation of fetal monocytes into alveolar macrophages
.
Nat. Immunol.
15
:
1026
1037
.
Stark
,
R.
, and
G.
Brown
.
2011
.
DiffBind: Differential binding analysis of ChIP-seq peak data
.
Subramanian
,
S.
,
C.J.
Busch
,
K.
Molawi
,
L.
Geirsdottir
,
J.
Maurizio
,
S.
Vargas Aguilar
,
H.
Belahbib
,
G.
Gimenez
,
R.A.A.
Yuda
,
M.
Burkon
, et al
.
2022
.
Long-term culture-expanded alveolar macrophages restore their full epigenetic identity after transfer in vivo
.
Nat. Immunol.
23
:
458
468
.
T’jonck
,
W.
,
M.
Guilliams
, and
J.
Bonnardel
.
2018
.
Niche signals and transcription factors involved in tissue-resident macrophage development
.
Cell Immunol.
330
:
43
53
.
Tan
,
S.Y.
, and
M.A.
Krasnow
.
2016
.
Developmental origin of lung macrophage diversity
.
Development
.
143
:
1318
1327
.
Travaglini
,
K.J.
,
A.N.
Nabhan
,
L.
Penland
,
R.
Sinha
,
A.
Gillich
,
R.V.
Sit
,
S.
Chang
,
S.D.
Conley
,
Y.
Mori
,
J.
Seita
, et al
.
2020
.
A molecular cell atlas of the human lung from single-cell RNA sequencing
.
Nature
.
587
:
619
625
.
Wang
,
Y.
,
Y.
Zhang
,
K.
Kim
,
J.
Han
,
D.
Okin
,
Z.
Jiang
,
L.
Yang
,
A.
Subramaniam
,
T.K.
Means
,
F.O.
Nestlé
, et al
.
2024
.
A pan-family screen of nuclear receptors in immunocytes reveals ligand-dependent inflammasome control
.
Immunity
.
57
:
2737
2754.e12
.
Wong
,
G.T.
,
D.
Manfra
,
F.M.
Poulet
,
Q.
Zhang
,
H.
Josien
,
T.
Bara
,
L.
Engstrom
,
M.
Pinzon-Ortiz
,
J.S.
Fine
,
H.J.
Lee
, et al
.
2004
.
Chronic treatment with the gamma-secretase inhibitor LY-411,575 inhibits beta-amyloid peptide production and alters lymphopoiesis and intestinal cell differentiation
.
J. Biol. Chem.
279
:
12876
12882
.
Yu
,
X.
,
A.
Buttgereit
,
I.
Lelios
,
S.G.
Utz
,
D.
Cansever
,
B.
Becher
, and
M.
Greter
.
2017
.
The cytokine TGF-beta promotes the development and homeostasis of alveolar macrophages
.
Immunity
.
47
:
903
912.e4
.
Zhang
,
Y.
,
T.
Liu
,
C.A.
Meyer
,
J.
Eeckhoute
,
D.S.
Johnson
,
B.E.
Bernstein
,
C.
Nusbaum
,
R.M.
Myers
,
M.
Brown
,
W.
Li
, and
X.S.
Liu
.
2008
.
Model-based analysis of ChIP-seq (MACS)
.
Genome Biol.
9
:
R137
.

or Create an Account

Close Modal
Close Modal

Gift article access

As a benefit of your subscription, you can share temporary access to restricted articles.

Each link will stop working after 30 days or 10 uses. You may create up to 10 links in a 30 day period.

Please sign in to your personal account to gift article access.

Register

Gift article access

As a benefit of your subscription, you can share temporary access to restricted articles.

Each link will stop working after 30 days or 10 uses. You may create up to 10 links in a 30 day period.

Gift articles remaining: --

Gift article access

Each link will stop working after 30 days or 10 uses. You may create up to 10 links in a 30 day period.

Gift articles remaining: --

Gift article access

As a benefit of your subscription, you can share temporary access to restricted articles.

Each link will stop working after 30 days or 10 uses.

You have reached the limit of 10 links within a 30 day period.