Skip to article sections

Loss of the lariat debranching enzyme DBR1 causes cytoplasmic accumulation of intron lariats, but why this reduces cell-intrinsic immunity is unclear. Here, we show that intronic inverted repeats Alu (IR Alus), normally degraded after splicing, form long double-stranded RNA (dsRNA) structures when lariats escape recycling. Viral introns evolve under pressure to avoid dsRNA, whereas human introns are enriched for them. Using computational, immunostaining, and genomic approaches, we demonstrate that DBR1 deficiency elevates cytoplasmic dsRNA and attenuates RNase L and PKR signaling. Our data suggest high levels of IR Alu dsRNA titrate PKR, potentially providing a mechanistic explanation for viral susceptibility in DBR1-deficient cells. Cytoplasmic RIP-seq against dsRNA finds introns to be a more abundant source of IR Alus than 3′ UTRs in WT cells. Our findings suggest the high load of IR Alus in introns creates a situation where the efficiency of lariat recycling is a powerful modulator of endogenous dsRNA levels in human cells.

The excision of introns from pre-mRNA is an essential step in the production of mature mRNA transcripts. Intron removal is catalyzed by the spliceosome through two sequential nucleophilic attacks by sugar hydroxides on the phosphates in a phosphodiester bond that connects introns to exons (Wahl et al., 2009; Wilkinson et al., 2020). The first attack separates the upstream exon from the 5′ end of the intron, which forms a 2′–5′ linkage at the branchpoint to create the lariat intermediate. The second step involves a nucleophilic attack by the free hydroxyl of the upstream exon on the downstream 3′ splice site, resulting in exon ligation and the excision of the intron lariat (Padgett et al., 1984; Ruskin and Green, 1985; Ruskin et al., 1984). The vast majority of lariats are quickly linearized by the lariat debranching enzyme DBR1, which hydrolyzes the 2′–5′ branchpoint bond (Chapman and Boeke, 1991; Montemayor et al., 2014; Ruskin and Green, 1985). After debranching, intron lariats undergo further digestion into small RNAs or free nucleotides available for the next cycle of transcription. In addition, lariat RNAs and their branchpoints can be sequenced and characterized using specialized approaches, including Shapeshifter, lariat sequencing, and co-transcriptional lariat sequencing (Awan et al., 2013; Mercer et al., 2015; Pineda and Bradley, 2018; Taggart et al., 2012; Taggart and Fairbrother, 2018; Zeng et al., 2022).

Studies in mice and humans have revealed a range of pathologies caused by the loss of DBR1 activity (Findlay et al., 2014; Zheng et al., 2015). Deficiencies in human DBR1 may lead to conditions such as cancer or impact hinder HIV replication (Galvis et al., 2014; Han et al., 2017; Xu et al., 2022; Ye et al., 2005). Homozygous DBR1 variants lead to the accumulation of RNA lariats and are associated with a congenital ichthyosis-like phenotype (Shamseldin et al., 2023). Moreover, biallelic severely hypomorphic DBR1 variants confer increased susceptibility to viral encephalitis due to herpes simplex virus 1 (HSV-1) infection. Elevated lariat levels were observed upon HSV-1 infection in WT cells, which were enhanced by DBR1 deficiency in the host (Zhang et al., 2018). More recent, Chan et al. found that a homozygous pathogenic mutation in DBR1 (DBR1 I120T/I120T) resulted in the accumulation of RNA lariats, which impaired antiviral immune responses and allowed uncontrolled SARS-CoV-2 replication in hindbrain neurons, leading to severe encephalitis (Chan et al., 2024; Valeri and Kajaste-Rudnitski, 2025). These findings suggest that defects in lariat metabolism in the absence of DBR1 are linked to impaired cell-intrinsic immunity.

However, the specific mechanisms by which lariats modulate antiviral response have yet to be elucidated. The best-characterized antiviral RNA-sensing pathways detect cytosolic double-stranded RNA (dsRNA). For example, MDA5 and RIG-I recognize viral dsRNA and trigger signaling cascades that lead to the production of interferons and pro-inflammatory cytokines, initiating an antiviral immune response (Chen and Hur, 2022; Hur, 2019). The OAS/RNase L pathway, activated by interferon signaling, degrades both viral and host RNA, promoting apoptosis and inhibiting viral replication (Cooper et al., 2014; Zhou et al., 1997). Similarly, PKR, another dsRNA sensor, phosphorylates the eukaryotic initiation factor eIF2α, resulting in global shutdown of protein synthesis and inhibition of viral replication (García et al., 2006; Hur, 2019). One of the challenges dsRNA sensors face is making a distinction between pathogenic signal and the low levels of endogenous dsRNA expressed during normal cellular function (Schlee and Hartmann, 2016). To achieve this, these sensors employ distinct physical criteria that collectively integrate duplex length, structure, and concentration. A key determinant is duplex length. OAS1 requires stems of at least 17 bp to produce 2′–5′ oligoadenylates (Calderon and Conn, 2018; Vachon et al., 2015), while PKR is activated by duplexes of ∼33 bp, reflecting the requirement for dimerization and interdimeric phosphorylation (Chen and Hur, 2022; Zheng and Bevilacqua, 2004). RIG-I preferentially recognizes short to intermediate duplexes (22–500 bp), with additional sensitivity to 5′-triphosphate or diphosphate ends, whereas MDA5 requires long continuous stems of 0.5–1 kb or more to assemble extended filaments along the RNA backbone (Chen and Hur, 2022). Structural integrity further modulates recognition, as bulges, mismatches, and internal loops attenuate activation, particularly for PKR and OAS, which depend on helical continuity (Calderon and Conn, 2018; Heinicke et al., 2011). Finally, maximal response depends on an optimal stoichiometry of dsRNA to dsRNA sensor concentration. For PKR, this property creates a characteristic “bell-shaped” activation profile with low concentrations of dsRNA stimulating activity until a peak and then higher concentrations reducing activity. This behavior has been explained in previous in vitro studies by a model in which low dsRNA concentrations allow PKR to dimerize on the same RNA, whereas high dsRNA levels redistribute PKR onto excess RNA, dispersing dimers into monomers and thereby limiting activation (Galabru and Hovanessian, 1987; Katze et al., 1991; Lemaire et al., 2008; Williams et al., 1979). Given PKR’s central role in antiviral defense, its loss or functional impairment increases susceptibility to infection, including influenza and HSV-1, by allowing enhanced viral replication and, in some cases, severe outcomes, as observed with vesicular stomatitis virus (Balachandran et al., 2000; Khabar et al., 2000).

In this study, we tested the hypothesis that the dsRNA-sensing antiviral response is impaired by the stable lariat introns that accumulate in DBR1-deficient cells. We analyzed both viral and host introns, finding intronic dsRNA structure to be underrepresented in viruses and overrepresented in humans. The dominant source of secondary structure in human introns comes from inverted repeat (IR) Alu elements. In the absence of DBR1 activity, we visualized lariat accumulation in the cytoplasm and an increase of cytoplasmic dsRNA. There is also a loss of RNase L activity and lower levels of PKR and eIF2α phosphorylation in DBR1-depleted cells, which can be rescued by the add-back of DBR1. We characterized the sequence diversity of IR Alus and define how the frequent bulges and mismatches break otherwise long duplex stems into arrays of shorter dsRNA stretches. Finally, we proposed a titration model (similar to the in vitro model) to explain these findings. We suggest cellular PKR that could dimerize on dsRNA is dispersed as monomers across separate dsRNA molecules in the presence of an excess of dsRNA.

Multiple viruses inhibit intron turnover in cells with DBR1 deficiency

Individuals with severely hypomorphic biallelic DBR1 gene variants can be vulnerable to life-threatening brainstem lesions when exposed to HSV-1, norovirus, or other viruses (Zhang et al., 2018). Previous research demonstrated that while HSV-1 infection leads to increased lariat levels in cells derived from both healthy controls and DBR1 mutant patients, the lariat increase is significantly larger in DBR1 mutant cells. Here, we utilize influenza virus to infect fibroblasts derived from control and DBR1 mutant patients (DBR1 I120T/I120T and DBR1 Y17H/Y17H) to confirm that this connection between virus infection and decreased intron recycling can be extended to other viruses. We observed significant 41% (I201T) and 64% (Y17H) increases in human lariats postinfluenza infection in DBR1 mutant patient cell lines (Fig. S1). As the influenza and HSV-1 genomes are both composed of intron-containing genes, it is possible that some feature of viral introns could dominantly inhibit human lariat turnover. To test this hypothesis, we performed sequence analysis on the set of human introns and all annotated introns from viruses known to infect humans.

Viral introns evolve under strong selective pressure against RNA secondary structure

We downloaded the sequences of 43 human-tropic viruses and their 126 introns from the National Center for Biotechnology Information (NCBI) Virus database (Hatcher et al., 2017). While GC content does not significantly differ between human and viral introns (Fig. 1 A), viral introns exhibit lower levels of predicted structure. On average, viral introns are shorter than human introns (Fig. S2 A, 9.3-fold, P = 7.08e−154). However, even after normalizing for length, minimum free energy (MFE) values from RNA-folding predictions are strikingly higher for viral introns, with the median viral intron MFE falling in the lower 10% of stability in the human intron MFE distribution (Fig. 1 B, P = 1.09e−09). While this result implies selection against secondary structure, we sought a more robust measure that did not rely on structure prediction. We developed a maximum base pairing (MBP) metric that measured the maximum proportion of positions that could be paired. MBP potential equals 1.0 when complementary bases occur with equal frequency in the sequence (accounting for G-U wobble base pairing; see Materials and methods). The median viral intron has 7% lower MBP potential than the median human intron, suggesting the possibility that viral sequences utilize nucleic acids in an unbalanced combination that would ensure unpaired bases and therefore less secondary structure formation (Fig. 1 C, P = 2.12e−10). We further interrogated the difference between the observed structure of an intron and the structure expected based on sequence composition. To do this, we generated an ensemble of 10 shuffled intron sequences for each intron and calculated the mean MFE of this shuffled ensemble (Fig. 1 D). Deviations between the observed and shuffled MFEs indicate introns with more or less structure than expected from their nucleotide composition. The distribution of observed and shuffled MFEs for human introns indicates that, while there is often agreement between these values, there are subsets of introns for which the observed MFE is much lower than the mean shuffled MFE (Fig. 1 E). In contrast, similar experiments for viral introns resulted in little difference between the observed MFEs and the expectation based on the ensemble of shuffled sequences (Fig. 1, F and G). These results suggest that viral introns face selective pressure toward less secondary structure. This trend was also observed for 5′ untranslated regions (UTRs), exons, and 3′ UTRs, which, similar to viral introns, are adapted to exist at high levels in the cytoplasm (Fig. S2 B).

IR Alu elements contribute to human intron structure

We sought to better understand the divergence between observed and expected structure that human introns exhibited in Fig. 1 E. The proliferation of short interspersed nuclear elements, such as Alu, within introns could be a major contributing factor to the formation of intronic secondary structure. The presence of multiple Alu elements inserted within a single intron in an inverted orientation creates the potential for long stretches of base pairing due to their complementarity. To assess the relationship between Alu elements and intron structure, we subdivided the data into the following categories of introns containing: no Alu (152,194 introns), 1 Alu (44,285), multiple Alu in the same insertion orientation (24,687), or multiple Alu with at least one pair in opposite insertion orientations (IR; 87,437). We hypothesized that introns with IR Alu elements would have the largest differences between observed and shuffled MFE, as the opposing orientation of Alu insertions in these introns provides extensive regions of near perfect complementarity. For all intron Alu content categories except IR Alu, there was a very strong correlation between the MFE of the observed intron and sequence-shuffled introns (Fig. 2 A). In contrast, introns with IR Alu had a markedly weaker correlation, with many introns in this category possessing much more extensive structure than the expectation based on the ensemble of shuffled intron sequences. The ability of IR Alu to form long RNA hairpins within introns suggests the large fraction (28%) of introns that contain IR Alu would trigger cytoplasmic dsRNA surveillance pathways if they were exported to the cytoplasm. Quantifying the presence of Alu elements within different gene regions shows that the parts of mRNA transcripts that are exported to the cytoplasm contain fewer Alu than nuclear introns (Fig. 2 B). While the majority of introns contain Alu, ∼10% of 3′ UTR also contain at least one Alu insertion (Fig. 2 B). Lariat mapping of total RNA sequencing (RNA-seq) samples from DBR1 KO and WT cell lines indicate lariat levels for introns containing IR Alu increase 43-fold in the absence of DBR1 activity (Fig. 2 C).

Lariats accumulate in the cytoplasm in the absence of DBR1

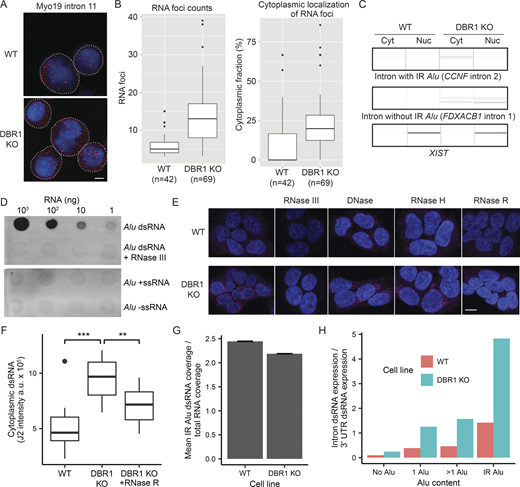
Given that IR Alu sequences can form dsRNA structures, the 43-fold increase in IR Alu-containing lariats suggests potential interactions with cellular dsRNA-sensing mechanisms. As dsRNA sensors, such as MDA5, RIG-I, PKR, TLR3, and OASes, are typically situated in the cytosol (Brubaker et al., 2015; Chen and Hur, 2022; Robinson and Moehle, 2014), a key question is whether lariats that avoid debranching accumulate in the cytoplasm. To measure the distribution of lariats across different subcellular compartments, MYO19 intron 11 was chosen as an exemplar intron, and its location was visualized through single-molecule fluorescence in situ hybridization (FISH) performed in wildtype and DBR1 KO cells (Fig. 3 A). Consistent with the elevated level of lariats in the absence of DBR1, the median FISH signal was ∼2.5-fold greater in the DBR1 KO cells compared with WT cells (Fig. 3 B, left). The cytoplasmic proportion of the FISH signal also increased, suggesting that lariats accumulate in the cytoplasm following a loss of DBR1 activity (Fig. 3 B, right). To directly test whether lariats from IR Alu–containing introns accumulate in the cytoplasm upon DBR1 loss, we performed lariat PCR on fractionated nuclear and cytoplasmic RNA. We observed that lariat derived from an IR Alu–containing intron was specifically enriched in the cytoplasm of DBR1 KO cells, whereas lariat from a non–IR Alu intron was detected in both the nuclear and cytoplasmic fractions (Fig. 3 C). Furthermore, to investigate whether these lariats can form dsRNA in the cytoplasm, we performed immunofluorescence (IF) staining using the J2 antibody. To ensure J2 specificity for RNA duplexes, we synthesized Alu dsRNA by in vitro transcription (IVT) and confirmed by dot blot that J2 specifically detected the duplex form, but not Alu sense single-stranded RNA (Alu +ssRNA) or Alu antisense ssRNA (Alu –ssRNA) (Fig. 3 D). Moreover, RNase III treatment, which selectively degrades dsRNA, abolished the J2 signal. Having validated antibody specificity, we next performed IF and observed that the cytoplasmic dsRNA signal was increased by ∼1.85-fold in DBR1 KO cells compared with WT controls (Fig. 3, E and F). After RNase R treatment, which degrades linear RNAs, the cytoplasmic dsRNA signal in DBR1 KO cells was reduced by ∼26%. The retention of the majority (∼74%) of dsRNA signal in these cells is consistent with the presence of some circular RNAs or lariat introns (Fig. 3, E and F). DNase and RNase H treatments did not appreciably alter the intensity of the J2 signal. While these experiments identify dsRNA in the cytoplasm, it is always possible incomplete digestion affects interpretation of these results. Furthermore, J2 identifies IR Alu in vitro, but the signal observed in vivo may arise from unrelated dsRNA. To address this specificity, RNA immunoprecipitation followed by sequencing (RIP-seq) was performed with the J2 antibody on cytoplasmic RNA extracts. Quantification of the RNA-seq alignment coverage at IR Alu insertion sites indicate a 2–2.5× enrichment in the J2-immunoprecipitation (J2-IP) cytosolic samples relative to cytosolic RNA for both cell lines, confirming the antibody’s recognition of endogenous IR Alu (Fig. 3 G). Read coverage of introns and 3′ UTRs in the J2-IP samples was used to estimate the relative dsRNA expression of these regions. In WT cells, the total dsRNA signal originating from IR Alu introns is only slightly greater than the signal from IR Alu 3′ UTRs (Fig. 3 H). In DBR1 KO cells, IR Alu introns have dsRNA expression ∼5 times that of IR Alu 3′ UTRs, indicating the importance of DBR1 for controlling the cytoplasmic accumulation of this dsRNA source.

DBR1 deficiency attenuates dsRNA sensors

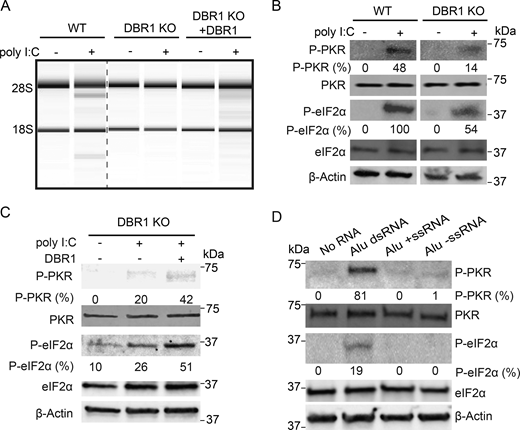
The accumulation of dsRNA from cytoplasmic lariats in DBR1 KO cells results in high levels of cytoplasmic dsRNA, which is a potent stimulator of cellular dsRNA-sensing mechanisms. However, the patient phenotype for DBR1 loss of function includes a hypersusceptibility to viral infection. To determine whether our DBR1 KO cells recapitulate this phenotype, we transfected WT and DBR1 KO cells with polyinosinic:polycytidylic acid (poly I:C), a widely used mimic of the pathogenic dsRNAs present during viral infection. We observed greatly reduced rRNA degradation and decreased phosphorylation levels of PKR and eIF2α in DBR1 KO cells compared with WT cells in response to poly I:C (Fig. 4, A and B). Furthermore, upon reintroducing DBR1 by transfecting KO cells with a DBR1 vector, rRNA degradation activity and PKR and eIF2α phosphorylation levels upon treatment with poly I:C were both restored (Fig. 4, A and C). These results suggest that the elevation of lariats in DBR1-null cells attenuates dsRNA-sensing pathways.

Alu dsRNA can activate PKR sensor

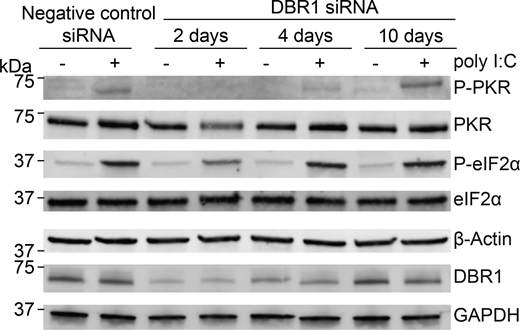
IR Alus are the most abundant class of cellular dsRNAs (Kim et al., 2018) and can act as immunogenic endogenous dsRNAs (Ahmad et al., 2018; Chung et al., 2018; Wu et al., 2018). To further characterize the role of IR Alus in innate immunity, we transfected IVT Alu dsRNA, validated by J2, into WT cells. The western blot analysis revealed that only Alu dsRNA significantly led to increased phosphorylation of both PKR and eIF2α (Fig. 4 D). In the absence of DBR1, IR Alus embedded in lariats accumulate in the cytoplasm (Fig. 3). Here, we demonstrate Alu dsRNA triggers multiple dsRNA-sensing pathways. Taken together, these two observations would predict chronic stimulation of dsRNA receptors in the absence of DBR1. However, the opposite is true: we find dsRNA sensors that are less responsive in DBR1-deficient cells. Initially, we thought this attenuation was a receptor desensitization from chronic exposure to lariat dsRNA. However, we performed a siRNA time course knockdown of DBR1 (Fig. S3) and found PKR response correlated with the levels of DBR1 protein without the time lag predicted by a model of receptor desensitization.

High concentrations of Alu dsRNA attenuate PKR activation by titrating PKR dimerization

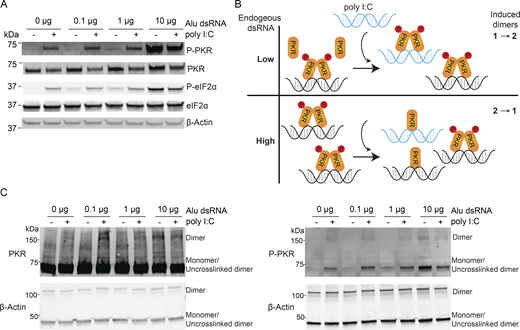
To understand the relationship between a cell’s endogenous dsRNA level and ability to respond to exogenous dsRNA, we sought to model the low and high basal levels of cytoplasmic dsAlu seen in DBR1 + and − lines with pre-stimulation Alu dsRNA transfections. WT (HEK293T) cells were transfected with different amounts of Alu dsRNA and, after a 6-h incubation period, were subjected to a second (poly I:C or mock) transfection. The PKR signaling pathway was then tested. Cells treated with low and moderate amounts of Alu dsRNA maintain their ability to react to subsequent transfection with poly I:C, as evidenced by the increased levels of phosphorylated PKR and eIF2α in poly I:C–treated samples (Fig. 5 A). In contrast, transfection with high concentrations of Alu dsRNA interferes with the innate immune response to poly I:C treatment with P-PKR and P-eIF2α levels decreasing in this sample relative to the untreated sample. The control transfection of excessive single-stranded Alu RNA did not produce this attenuation effect (Fig. S4 A). These dynamics, together with the interdimeric phosphorylation mechanism of PKR activation, suggest a titration model of innate immune signaling: When endogenous dsRNA levels are low, unbound immune sensors are present at sufficient levels to respond to external dsRNA stimulus (Fig. 5 B, top), but when the cell has already been subjected to high dsRNA concentrations, exposure to additional dsRNA could redistribute dimerized molecules of PKR across unoccupied dsRNA molecules (which are in excess), thereby preventing productive dimerizations that are required for activation (Fig. 5 B, bottom). Seeking direct evidence of an excess of dsRNA reducing PKR dimers, we performed in vivo disuccinimidyl suberate (DSS) cross-linking followed by western blotting. High level of transfected Alu dsRNA led to a marked accumulation of cross-linked PKR dimers. Upon poly I:C rechallenge, cells with high levels of preexisting Alu dsRNA showed a reduction in PKR dimer signal (Fig. 5 C), indicating that additional dsRNA did not promote further productive PKR–PKR interactions and instead reduced dimers. This pattern aligns with the proposed titration model. Moreover, our DBR1 KO cells, which already harbor high levels of endogenous Alu dsRNA, were transfected with additional Alu dsRNA alongside WT cells. As expected, DBR1 KO cells exhibited lower levels of phosphorylated PKR and eIF2α compared with WT cells, consistent with the titration model (Fig. S4 B).

Sequence variations in IR Alu decrease the length of dsRNA stretches and reduce PKR activation

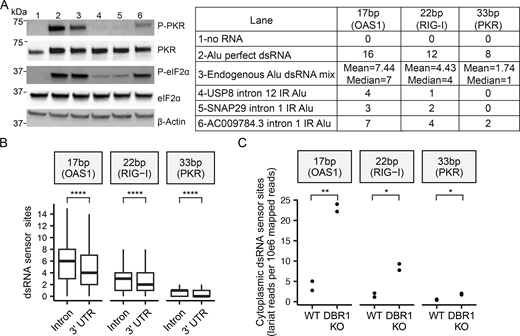
While these experiments utilized perfectly complimentary Alu dsRNA, genetic drift between two elements of an IR Alu creates mismatches. To investigate the effect of structural irregularities, such as mismatches and bulges within IR-Alus, we synthesized Alu + ssRNA and Alu – ssRNA from three different human introns by IVT, reannealed them, and transfected the resulting RNA into cells. Two of these RNAs, predicted to lack long duplex regions (>33 bp) (Fig. S4 C), failed to activate PKR (Fig. 6 A, lanes 4 and 5). Another RNA, containing two predicted longer duplexes (Fig. S4 C), activated PKR less efficiently than Alu perfect dsRNA (Fig. 6 A, lane 6 vs. lane 2). Similarly, a mixture of endogenous Alu dsRNA—formed by annealing sense and antisense Alu RNA amplified from human genomic DNA—was also less efficient at activating PKR than Alu perfect dsRNA (Fig. 6 A, lane 3 vs. lane 2). To assess the prevalence within introns and 3′ UTRs of dsRNA segments from IR Alu capable of activating innate immune sensors, we performed in silico prediction to obtain the MFE structure for each of IR Alu–containing intron and 3′ UTR with length ≤5,000 nt (length was limited due to the computational expense of folding very long RNA sequences). Compared with 3′ UTRs, IR Alu within introns have higher numbers of predicted dsRNA segments with sufficient length to activate OAS1 (17 bp), RIGI-I (22 bp), and PKR (33 bp) despite there being no significant difference in the overall lengths of the two sets of tested regions (Fig. 6 B). This result implies a greater selection against long dsRNA created by IR Alu inserts in 3′ UTR relative to intronic IR Alus. Additionally, normalized counts of dsRNA segments meeting OAS1, RIG-I, and PKR thresholds showed that cytoplasmic lariats from DBR1 KO cells contain more dsRNA sensor sites than those from WT cells (Fig. 6 C).

We previously reported that loss-of-function mutations in DBR1 impair antiviral responses to HSV-1 infections (Zhang et al., 2018). In that original report, it was noted that lariat abundance increased upon HSV-1 infection regardless of DBR1 status. Here, we extend this observation to influenza virus, where cellular lariats increase upon influenza infection. It is not clear if the accumulation of host lariats that follows viral infection could act as an immunostimulant. Some DNA methylation inhibitors in chemotherapy appear to bolster an immune response by derepressing endogenous retroviruses (Chiappinelli et al., 2015; Mehdipour et al., 2020). The importance of dsRNA in cell-intrinsic immunity is well established, and our analysis provides evidence for a selective pressure to avoid secondary structure in viral introns (Fig. 1) and human 3′ UTR (Fig. 6). While the GC content of human and viral introns are similar, viral introns are much less structured (Fig. 1, A and B). Viral introns are encoded by an unbalanced composition of nucleotides, such that at least 12% of bases are unpaired in the median viral intron (Fig. 1 C). In contrast, the median human intron has at least 5% of its bases unpaired. It is therefore much less likely for viral introns to fold in a way that achieves the long stretches of dsRNA required to trigger the dsRNA responses in the cytosol. While this difference appears modest, we used these MBP values in simulations to determine the likelihood that a random 17mer (OAS1), 22mer (RIG-I), or 33mer (PKR) had all bases paired. This analysis revealed that viral introns contain these stretches of dsRNA capable of triggering host sensors at 53.7% (OAS1), 50.1% (RIG-I), and 46.1% (PKR) of the frequencies predicted in human introns (Table S1). Some of this difference may be explained by the shorter length of viral introns, but the same trend is observed in our MFE analysis, which is length corrected (Fig. 1 B). Human-intronic sequences folded with more secondary structure than expected by chance, much of it due to the hairpins formed by IR Alu that were long enough to trigger the dsRNA sensors. These hairpins, found in 28% of human introns, are formed from multiple Alus inserted in opposite orientations within the same intron (Fig. 2). While these IR Alus have been recognized as the major source of endogenous dsRNA, prior studies mostly focused on these elements in 3′ UTR (Liddicoat et al., 2015). The vast majority of transcribed IR Alus are intronic, but as introns are rapidly processed, they were not thought to be a major source of endogenous dsRNA. Here, we show this may not be correct. Even in WT cells, introns containing IR Alu are more abundant than IR Alu 3′ UTRs in the cytoplasmic dsRNA fraction (Fig.3 H, WT >1) and have more dsRNA sensor-binding sites (Fig. 6 B). However, in the absence of DBR1, there is a 43-fold increase in the abundance of lariats containing these endogenous dsRNA that could be recognized by the dsRNA sensors. For this recognition, lariats need to accumulate in the cytoplasm (confirmed in Fig. 3, A–C) and contribute to increased cytoplasmic dsRNA signal (confirmed in Fig. 3, E and F). In the absence of DBR1, the lariats from these introns can escape to the cytosol and act as an endogenous source of dsRNA that interacts with cellular pathogenic dsRNA sensing. Performing RIP-seq with the J2 dsRNA antibody on the cytosolic fraction of RNA results in enrichment of Alu dsRNAs (Fig. 3 G). Interestingly, dsRNA that originates from introns with IR Alus is slightly more abundant than the dsRNA from their 3′ UTR counterparts in WT cells. After DBR1 KO, the dsRNA expression of IR Alu introns increases to five times the level of IR Alu 3′ UTR (Fig. 3 H). This increase in dsRNA has also been seen with small molecular inhibition of the spliceosome and knockdown of splicing factors that presumably expose dsRNA sensors to intron duplexes comprised of IR Alus (Bowling et al., 2021; Zheng et al., 2024). We observe similar effects across an array of different innate immune sensors. DBR1 KO cells exhibited impairments in RNase L and PKR responses to dsRNA (Fig. 4).

Cellular accumulation of dsRNA is a common molecular signature associated with viral infections (i.e., pathogen-associated molecular pattern), and its presence in the cell typically activates dsRNA sensors like MDA5, RIG-I, and PKR, leading to an antiviral response. However, the sensitivity of the dsRNA sensor needs to be sufficiently low to prevent false activation by endogenous sources of dsRNA. To add to the complexity, dsRNA recognition plays a biological role during mitosis—PKR activation shuts down translation during M phase (Kim et al., 2014; Kim et al., 2018). We demonstrated that double-stranded Alus are potent ligands for recognition by PKR sensor (Fig. 4 D). However, in our study, we found that the excessive accumulation of these ligands (i.e., structured IR Alu–containing lariats) in the absence of DBR1 attenuates dsRNA sensors like RNase L and PKR. Our observations that cells with accumulated IR Alu lariats show reduced PKR phosphorylation upon poly I:C treatment support a PKR titration model. In this model, when cells are already exposed to high concentrations of dsRNA, additional dsRNA can lead to a redistribution of PKR binding across separate dsRNA molecules (Fig. 5 B). We demonstrate a loss of poly I:C response in cells pretreated with excessive IR Alu dsRNA (Fig. 5 A). Furthermore, the loss of PKR dimers and activated dimers (Fig. 5 C) suggests the inhibitory effect of excess dsRNA is acting at the step of PKR dimer formation on dsRNA.

As IR Alu insertion sites undergo genetic drift, most IR Alus do not form perfect helices. We demonstrate how more realistic versions of Alu hairpins are less activating than perfect hairpins and that there is substantial variation in activation efficiency between IR Alu pairs (Fig. 6 A). Finally, the comparison of 3′ UTR IR Alu with intronic IR Alu shows shorter dsRNA segments with fewer predicted dsRNA sensor-binding sites in 3′ UTR IR Alus that are presumably adapted for the cytoplasm (Fig. 6 B). As 3′ UTR in mRNA spend most of their life cycle in the cytoplasm, this difference suggests purifying selection against dsRNA in the cytoplasm, similar to the results from prior studies on longer repeats (Barak et al., 2020). While both studies show a greater degree of selection on IR Alu in 3′ UTR, Barak et al. still finds selection against intronic structures. Our finding that in WT cells introns with IR Alu are in total a more abundant source of cytoplasmic dsRNA compared with IR Alu 3′ UTRs supports the idea that introns may be under negative selection to avoid structure. The selection on each intron may be small as the large number of IR Alu introns results in each intron comprising a smaller fraction of the pool than each IR Alu 3′ UTR. However, selection on viral introns is easier to detect because of large population size, high mutability, and short generation time. The reduced RNA secondary structure in viral introns may reflect the degree to which this lariat leakage into the cytoplasm can drive selection. Given the role of PKR activation in mitosis, the attenuated PKR we observe in the absence of DBR1 may result in the growth defects observed in DBR1 KO cells (Buerer et al., 2024; Kim et al., 2014; Kim et al., 2018). Consistent with our study, the most recent research demonstrated that RNA lariat accumulation in DBR1-deficient cells hinders PKR activation (Ru et al., 2025). The authors found that accumulated RNA lariats resulting from DBR1 insufficiency impair stress granule assembly and reduce PKR activation by promoting the degradation of G3BP1 and G3BP2, which are crucial for stress granule formation. However, we did not detect reduced stress granule assembly upon poly I:C transfection in our DBR1 KO cells (Fig. S5). We speculate that this may be because PKR inhibition of activation occurs upstream of translation inhibition. Together, these findings suggest that RNA lariat accumulation dampens PKR activation through multiple pathways, highlighting the complex nature of the interactions between RNA lariats and the antiviral response.

Influenza infection

DBR1 I120T/I120T and DBR1 Y17H/Y17H human primary fibroblasts cell lines were from a previous study (Zhang et al., 2018). For influenza infection, 4 × 10⁵ primary fibroblasts per well were added to 6-well plates and infected with influenza, at a multiplicity of infection (MOI) of 5, in DMEM supplemented with 2% fetal calf serum (FCS) (Everett, 1984; Gelman and Silverstein, 1985). After 2 h, the cells were washed and incubated in 500 μl of medium. Cells were collected at 8 h and 24 h and frozen.

Viral intron analysis

Sequence data for viral introns were obtained via the NCBI Virus database (“RefSeq” > “Homo sapiens [human], taxid:9606”) (Hatcher et al., 2017). The locations and sequences were extracted from the GenBank data. This dataset was filtered to remove duplicates, resulting in a final dataset of 127 viral introns. Sequence data for 210,290 human introns from the consensus coding sequence (CCDS) annotation were obtained via the UCSC Table Browser tool (“Feb. 2009 (GRCh37/hg19” > “Genes and Gene Predictions” > “CCDS” > “ccdsGene”) (Karolchik et al., 2004).

MBP can be calculated as follows:

A, T, C, and G = proportions of each nucleotide in sequence

MBP = 1 – [max(A − T, 0) + max(C − G, 0) + |max(T − A, 0) − max(G − C, 0)|]

For example: sequence = 5′-AAAATTCC-3′

A = 0.5, T = 0.25, C = 0.25, G = 0

MBP = 1 – [max(0.5 − 0.25, 0) + max(0.25 – 0, 0) + |max(0.25 – 0.5, 0) – max(0 − 0.25, 0)|]

MBP = 1 – (0.25 + 0.25 + |0 – 0|) = 0.5

For comparisons of observed with shuffled sequences, sequences were randomly shuffled 10 times followed by RNA folding prediction described below.

RNA secondary structure prediction

Viral introns along with human introns and 3′ UTRs ≤5,000 nt in length were processed with RNAfold from the ViennaRNA package using default options (Lorenz et al., 2011). Length was limited due to the high computational cost of in silico structure prediction for very long RNA sequences. The MFE of each output structure was normalized by the length of the region to obtain comparable MFE values. When computing the count of dsRNA segments within a given region capable of activating innate immune sensors, the following minimum dsRNA lengths were used: OAS1 = 17 bp, RIG-I = 22 bp, and PKR = 33 bp. The predicted structure for each region was split into its component dsRNA stretches, and the total dsRNA sensor-binding sites for a given sensor was calculated as ∑_i floor(length of dsRNA stretch i/minimum activating length of sensor).

CRISPR DBR1 KO

DBR1 KO cell lines were derived from HEK293T cells as described by Buerer et al. (2024). Cells were cultured in DMEM and 10% FBS on 10-cm plates 24 h prior to transfection at 40% confluency. Each plate was transfected with either 3.6 µg DBR1 sgRNA (5′-AGA​CGC​TGG​CGC​TGG​CAG​AG-3′) or scramble control (OriGene) as well as 3.6 µg GFP-puro donor DNA (OriGene), 15 µg GeneArt Platinum Cas9 nuclease (Thermo Fisher Scientific), and 43 μl Lipofectamine 2000 (Thermo Fisher Scientific). 48 h after transfection, cells were split 1:10 every 3 days (seven times in total), and single colonies were expanded under 0.5 µg/ml puromycin selection. Minute Total Protein Extraction kit (Invent Biotechnologies) was used, and DBR1 KO was confirmed on single colonies #19 (C19) and #22 (C22) by anti-Dbr1 western blot.

RNA-seq and lariat identification

Total RNA was extracted with the miRNeasy Mini Kit (Cat# 217004; QIAGEN) and treated with DNase (Ambion) to remove residual genomic DNA. Total RNA quality and integrity were assessed using the Agilent 2100 Bioanalyzer with the RNA Nano kit (Ibberson et al., 2009). RNA-seq libraries were prepared with the Illumina RiboZero TruSeq Stranded Total RNA Library Prep Kit (Cat# RS-122-2201; Illumina) and sequenced on the Illumina NextSeq platform in the 150 nt paired-end configuration. Each library was sequenced three times.

Sequencing reads (GEO accession code GSE195586) were processed using previously described lariat mapping scripts (Buerer et al., 2024). First, reads are filtered out if they contain >5% ambiguous characters. Then, reads are mapped to the genome, and aligned reads are discarded. A mapping index is then created based on the unaligned reads, and a FASTA file containing the first 20 nt of each annotated intron in the transcriptome is mapped to the unaligned reads. Reads are then identified where only one 5′ splice site maps to them, and the alignment has no mismatches or indels. These reads are then trimmed of the sequence from the start of the 5′ SS alignment to the end of the read, and reads where the trimmed portion is <20 nt are filtered out. The remaining trimmed reads are mapped back to the genome, and the trimmed read alignments are then filtered to only consider those with ≤5 mismatches, ≤10% mismatch rate, and no more than one indel of ≤3 nt. For each trimmed read, the highest scoring alignment was chosen after restricting to alignments in the same gene as the 5′ SS alignment and those with the expected inverted mapping order of the 5′ and 3′ segments. The end of this highest scoring alignment is then taken to be the branchpoint of the lariat, from which the read is derived.

FISH

To visualize lariat RNA species from intron 11 of the MYO19 gene, Quasar 570–labeled smRNA-FISH probes were ordered from Stellaris RNA-FISH (LGC Biosearch Technologies). smRNA-FISH was performed according to the manufacturer’s instructions. Briefly, 1 × 10⁶ cells were fixed in 3.7% (vol/vol) formaldehyde and then permeabilized in 70% ethanol at 4°C. For in situ hybridization, permeabilized cells were incubated with 1.25 µM probes in the hybridization buffer (10% formamide, 10% dextran sulfate, 1 mg/ml Escherichia coli RNA, and 0.2 mg/ml BSA in 2× SSC) at 37°C overnight. Afterward, cells were washed sequentially with wash buffer A (10% formamide in 2× SSC), wash buffer B (0.1% Triton X-100 in 2× SSC), wash buffer C (1× SSC with 1 µg/ml DAPI), and 1× PBS. Finally, these cells were plated onto the coverslip and mounted in ProLong Gold Antifade Mountant (Cat# P36930; Thermo Fisher Scientific). The mounted cells were imaged using an Olympus IX81 inverted widefield microscope equipped with Hamamatsu Orca Flash 4.0 camera with 4 megapixels and a 100 × 1.45 NA oil objective lens. Single RNA molecule counting was done using ImageJ, and statistical analysis was conducted in R.

IF

For J2 staining, cells were seeded in 24-well and grown on coverslips for 24 h, fixed for 15 min using 4% PFA/PBS. Fixed cells were permeabilized for 15 min using 0.2% Triton X-100/PBS. Cells were treated with 10 U/ml DNase (Cat# M0303S; New England Biolabs), RNase H (Cat# M0297L; New England Biolabs), 20 U/ml RNase III (Cat# M0245L; New England Biolabs), and RNase R (Cat# RNASR-200; MCLAB) for 2 h at 37°C. Cells were then blocked in 5% BSA/PBST for 1 h. Primary antibody incubation was carried out overnight at 4°C using J2 (Cat# 76651L; Cell Signaling Technology) and secondary antibody Donkey anti-Mouse IgG, Alexa Fluor 647 (Cat# A31571; Thermo Fisher Scientific) for 1 h at room temperature.

Microscopy and image analysis

Cells were imaged using a Zeiss LSM 800 Confocal Microscope. Images of fixed cells were acquired as 32-slice z-stacks with 0.2-µm intervals. Signal intensities were quantified using Fiji software. To calculate the average cytoplasmic signal intensity, the signal from the DAPI-stained nuclei was subtracted from the total signal of the image, and the result was divided by the number of cells in the field.

In vitro synthesis of different types of Alu dsRNAs

The consensus Alu DNA sequence (5′-GGC​CGG​GCG​CGG​TGG​CTC​ACG​CCT​GTA​ATC​CCA​GCA​CTT​TGG​GAG​GCC​GAG​GCG​GGC​GGA​TCA​CCT​GAG​GTC​AGG​AGT​TCG​AGA​CCA​GCC​TGG​CCA​ACA​TGG​TGA​AAC​CCC​GTC​TCT​ACT​AAA​AAT​ACA​AAA​ATT​AGC​CGG​GCG​TGG​TGG​CGG​GCG​CCT​GTA​ATC​CCA​GCT​ACT​CGG​GAG​GCT​GAG​GCA​GGA​GAA​TCG​CTT​GAA​CCC​GGG​AGG​CGG​AGG​TTG​CAG​TGA​GCC​GAG​ATC​GCG​CCA​CTG​CAC​TCC​AGC​CTG​GGC​GAC​AGA​GCG​AGA​CTC​CGT​CTC-3′) was synthesized by Twist Bioscience. For the preparation of sense and antisense Alu templates, a T7 promoter sequence was appended to the 5′ end of the forward or reverse primer, respectively. PCR products were purified using the QIAquick PCR Purification Kit (Cat# 28106; Qiagen). IVT of Alu +ss and Alu –ss RNAs was performed using the HiScribe T7 Quick High Yield RNA Synthesis Kit (Cat# E2050S; New England Biolabs). The synthesized RNAs were subsequently treated with DNase I to remove residual DNA template, followed by treatment with calf intestinal phosphatase (Cat# M0525S; New England Biolabs) to eliminate 5′-triphosphates. Final products were purified using the Monarch RNA Cleanup Kit (Cat# T2030L; New England Biolabs). To generate Alu perfect dsRNA, equimolar amounts of Alu +ss and Alu –ss RNAs were mixed in annealing buffer (10 mM Tris-HCl, pH 7.5; 100 mM NaCl), denatured at 75°C for 5 min, and slowly cooled to room temperature to allow duplex formation.

Endogenous Alu dsRNA mix and IR Alus from human introns were prepared in the same manner by PCR amplification of their respective templates from human genomic DNA (Cat# G3041; Promega), followed by IVT and annealing of the positive and negative strand RNAs.

RNA dot blot

The Alu perfect dsRNA, Alu +ssRNA, and Alu −ssRNA were serially diluted and dotted onto a nylon membrane. In parallel, the Alu dsRNA was treated with RNase III (New England Biolabs) according to the manufacturer’s protocol. The RNAs were cross-linked to the membrane using UV light at 125 mJ/cm2 at 254 nm. The blot was probed with the dsRNA-specific J2 antibody (Cat# 76651L; Cell Signaling Technology).

Subcellular fractionation, lariat PCR, and immunoprecipitation of dsRNA

Subcellular fractions were prepared as previously described (Bhatt et al., 2012), with modifications. Briefly, 1 × 10⁷ cells were gently trypsinized, collected from the plate, and pelleted by centrifugation at 1,500 rpm for 2 min at 4°C. Pellets were resuspended in 200 μl cold cytoplasmic lysis buffer (0.15% NP-40, 10 mM Tris, pH 7.5, and 150 mM NaCl) and incubated on ice for 5 min. Lysates were layered onto 500 μl cold sucrose buffer (24% wt/vol sucrose, 10 mM Tris, pH 7.5, and 150 mM NaCl) and centrifuged at 13,000 rpm for 10 min at 4°C. The supernatant was collected as the cytoplasmic fraction.

The nuclear pellet was resuspended in 200 μl cold glycerol buffer (20 mM Tris, pH 8.0, 75 mM NaCl, 0.5 mM EDTA, 50% glycerol, and 0.85 mM DTT), followed by addition of 200 μl cold nuclei lysis buffer (20 mM HEPES, pH 7.6, 7.5 mM MgCl2, 0.2 mM EDTA, 0.3 M NaCl, 1 M urea, 1% NP-40, and 1 mM DTT). The mixture was pulse-vortexed, incubated on ice for 2 min, and centrifuged at 14,000 rpm for 2 min at 4°C. The resulting supernatant was collected as the nucleoplasmic fraction.

RNA from both cytoplasmic and nucleoplasmic fractions was isolated and purified using the RNeasy Mini Kit (Cat# 74104; Qiagen) according to the manufacturer’s instructions. Following DNase treatment, cDNA was synthesized using SuperScript IV Reverse Transcriptase (Cat# 18090050; Thermo Fisher Scientific). Lariat PCR was then performed on the cDNA using a nested amplification strategy. The primers for lariat PCR were listed in Table 1.

Purified RNA was immunoprecipitated using the dsRNA-specific J2 antibody. Briefly, 5 µg of J2 antibody was incubated with 30 μl of pre-washed Protein A/G magnetic beads (Cat# 88803; Thermo Fisher Scientific) and rotated at 4°C for 1 h to allow antibody bead binding. Then, 5 µg of cytoplasmic RNA was incubated with the antibody bead complex in binding buffer (150 mM NaCl, 50 mM Tris pH 8.0, 1 mM EDTA, and 1% NP-40) and rotated overnight at 4°C. The beads were subsequently washed five times with cold binding buffer, and RNA was extracted using the Monarch RNA Clean up Kit (Cat# T2030L; New England Biolabs).

RNA-seq of cytoplasmic total and J2-IP RNA

Using HEK293T WT and DBR1 KO cell lines, two replicates each were performed of the cytoplasmic RNA extraction described above. For each replicate, an aliquot of total cytoplasmic RNA was taken, and the remaining cytoplasmic RNA underwent immunoprecipitation with the J2 antibody. The total and J2-IP RNA samples were sent to Azenta Life Sciences for library preparation and RNA-seq. Strand-specific RNA-seq library was prepared using NEBNext Ultra II Directional RNA Library Prep Kit for Illumina following the manufacturer’s instructions. Briefly, the enriched RNAs were fragmented for 8 min at 94°C. First strand and second strand cDNA were subsequently synthesized. The second strand of cDNA was marked by incorporating dUTP during the synthesis. cDNA fragments were adenylated at 3′ ends, and indexed adapter was ligated to cDNA fragments. Limited cycle PCR was used for library enrichment. The sequencing library was validated on the Agilent TapeStation and quantified by using Qubit 4.0 Fluorometer as well as by quantitative PCR. Illumina 2 × 150 bp paired-end sequencing was performed at a target depth of 50 million reads/sample. Adapter trimming and quality filtering were performed using fastp version 0.24.0 with default options (Chen, 2023). Reads were aligned to human genome assembly hg38 with HISAT2 version2.2.1 using option “--rna-strandness RF” (Kim et al., 2019). Reads originating from transcripts on the positive and negative genomic strands were sorted into separate files with samtools version 1.17, and the number of reads aligning to IR Alu insertions within genes on each strand was tallied with bedtools version 2.31.0 (Danecek et al., 2021; Quinlan and Hall, 2010). Similarly, bedtools was used to tally region counts for all introns and 3′ UTR, and these counts were normalized to obtain RPKM values. RPKM values were converted to TPM values, which were used for comparing the relative expression of introns and 3′ UTRs in the J2-IP dsRNA-sequencing samples. The sequencing data have been deposited in the NCBI Sequence Read Archive under accession number PRJNA1400086.

poly I:C treatment

Both WT (HEK293T) and DBR1 KO cells were cultured in DMEM containing 10% FBS and 100 U/ml P/S. Prior to poly I:C transfection, the culture medium was replaced with serum-free DMEM. Poly I:C (Cat# HY-107202; MedChem Express) was transfected at a final concentration of 1 μg/ml using Lipofectamine 3000 (Invitrogen) in serum-free medium, and cells were incubated at 37°C for the indicated times.

RNA structure analysis of endogenous Alu mix

Samples of endogenous positive and negative Alu were separately amplified from human genomic DNA (Cat# G3041; Promega) and sent to Massachusetts General Hospital for low-throughput 2 × 142 bp paired-end sequencing. Reads were adapter trimmed and quality filtered using fastp version 0.24.0 with default options (Chen, 2023). Reads were aligned to human genome assembly hg38 with HISAT2 version 2.2.1 using default options (Kim et al., 2019). The read alignments were used to calculate the relative representation of genomic Alus within the positive and negative Alu samples. To determine the distribution of secondary structures assuming random pairing of positive and negative Alus, 10,000 trials of the following procedure were performed: (1) one positive and one negative Alu were sampled with probabilities determined by the relative representation from the read alignments, (2) the hybridization structure of the sampled Alus was computed using RNAduplex from the ViennaRNA package with default options (Lorenz et al., 2011), (3) and the dsRNA stretches from the predicted structure were used to compute the total immune sensor-binding sites of the hybridized Alu pair as described in the Materials and methods section “RNA secondary structure prediction.#x201d;

Western blot

For DBR1 add-back, 5 μg of DBR1 expression vector (Cat# OHu11162; GenScript) was transfected into cells using Lipofectamine 3000 (Invitrogen) 24 h prior to the poly I:C treatment. Cell lysates were prepared using radioimmunoprecipitation assay lysis buffer containing protease and phosphatase inhibitors. Protein samples were separated on 4–20% Mini-PROTEAN gel (Cat# 4561093EDU and Cat# 4561096EDU; Bio-Rad) and transferred to a polyvinylidene difluoride membrane. The blot was then probed with anti-PKR (phospho T446) rabbit antibody [E120] (Cat# ab32036; Abcam), phospho-eIF2α (Ser51) rabbit antibody (Cat# 9721; Cell Signaling Technology)/anti-EIF2S1 (phospho S51) antibody [E90] (Cat# ab32157; Abcam), anti-PKR antibody [Y117] (Cat# ab32506; Abcam), EIF2S1 recombinant antibody (Cat# 82936-8-RR; Proteintech), and β-actin antibody (Cat# 66009-1-Ig; Proteintech). Goat anti-rabbit IgG (H+L) highly cross-adsorbed secondary antibody, Alexa Fluor Plus 800 (Cat# A32735; Invitrogen) and goat anti-mouse IgG (H+L) highly cross-adsorbed secondary antibody, Alexa Fluor Plus 680 (Cat# A32729; Invitrogen) were used according to the manufacturer’s instructions. The Bio-Rad imager was used to capture the images.

In vivo cross-linking assay

Cells were washed with ice-cold PBS. DSS (#21655; Thermo Fisher Scientific) was added to a final concentration of 2 mM, and the reaction was incubated for 30 min at room temperature. The cross-linking reaction was then quenched by adding 1 M Tris (pH 7.5) to a final concentration of 20 mM and incubating for 10 min at room temperature. Cell lysates were subsequently analyzed by SDS-PAGE.

Online supplemental material

Fig. S1 shows cellular lariats increase in DBR1 mutant cells upon influenza virus infection. Fig. S2 shows a comparison of viral and human intron lengths and secondary structure in human transcripts. Fig. S3 shows time course depletion of DBR1 and corresponding changes in PKR activation. Fig. S4 shows PKR activation in response to single-stranded and double-stranded Alu RNAs and predicted structures of IR Alus from different introns. Fig. S5 shows IF staining of G3BP1 and G3BP2 in WT and DBR1 KO cells. Table S1 shows the probability that a random k-mer is fully paired, based on the MBP metric.

All original code has been deposited at GitHub (https://github.com/fairbrother-lab/lariat_virus_paper) and is publicly available as of the date of publication.

The authors thank Dr. Weihan Li, Dr. Jiangtian Chen, and Dr. Wenjing Zheng for their technical support and insightful suggestions during this study. We are profoundly grateful to Dr. Alger Fredericks for his insight and dedication to this work. He passed away during the preparation of this manuscript. This publication is dedicated to his memory.

This work was supported by the National Institute of General Medical Sciences of the National Institutes of Health (NIH) under awards R01 GM127472, R01 GM105681, and R35 GM142638. The Laboratory of Human Genetics of Infectious Diseases was funded in part by the National Center for Advancing Translational Sciences, NIH, Clinical and Translational Science Award program (UL1TR001866), NIH (R01AI088364 and R01NS072381), the French National Research Agency (ANR) under the France 2030 program (ANR-10-IAHU-01), the Integrative Biology of Emerging Infectious Diseases Laboratory of Excellence (ANR-10-LABX-62-IBEID), ANR CNSVIRGEN (ANR-19-CE15-0009-01), French Foundation for Medical Research (EQU202503020018), the Square Foundation, Grandir - Fonds de solidarité pour l’enfance, William E. Ford, General Atlantic’s Chairman and Chief Executive Officer, Gabriel Caillaux, General Atlantic’s Co-President, Managing Director and Head of Business in EMEA, and the General Atlantic Foundation, Institut National de la Santé et de la Recherche Médicale, and Paris Cité University.

Author contributions: Chaorui Duan: conceptualization, data curation, formal analysis, investigation, methodology, project administration, validation, visualization, and writing—original draft, review, and editing. Luke Buerer: conceptualization, formal analysis, visualization, and writing—review and editing. Cory Bowers: conceptualization, data curation, investigation, and visualization. Allison J Taggart: conceptualization, data curation, and investigation. Mara H O'Brien: formal analysis, investigation, methodology, validation, and visualization. Sarah Gunasekera: data curation, formal analysis, and visualization. Chien-Ling Lin: Resources, Jing Wang: investigation, methodology, and validation. Yi Zeng: data curation. Jonathan P Staley: investigation. Sean Monaghan: funding acquisition, resources, supervision, and writing—review and editing. Anastasia Welch: investigation. Nathaniel E Clark: conceptualization and methodology. Daxing Gao: data curation and investigation. Nico Marr: supervision. Shen-Ying Zhang: funding acquisition, investigation, resources, supervision, and writing—review and editing. Jean-Laurent Casanova: conceptualization, investigation, supervision, and writing—review and editing. William G Fairbrother: conceptualization, funding acquisition, methodology, project administration, supervision, and writing—original draft, review, and editing.

Ahmad
,
S.
,
X.
Mu
,
F.
Yang
,
E.
Greenwald
,
J.W.
Park
,
E.
Jacob
,
C.Z.
Zhang
, and
S.
Hur
.
2018
.
Breaching self-tolerance to Alu duplex RNA underlies MDA5-mediated inflammation
.
Cell
.
172
:
797
810.e713
.
Awan
,
A.R.
,
A.
Manfredo
, and
J.A.
Pleiss
.
2013
.
Lariat sequencing in a unicellular yeast identifies regulated alternative splicing of exons that are evolutionarily conserved with humans
.
P Natl. Acad. Sci. USA
.
110
:
12762
12767
.
Balachandran
,
S.
,
P.C.
Roberts
,
L.E.
Brown
,
H.
Truong
,
A.K.
Pattnaik
,
D.R.
Archer
, and
G.N.
Barber
.
2000
.
Essential role for the dsRNA-dependent protein kinase PKR in innate immunity to viral infection
.
Immunity
.
13
:
129
141
.
Barak
,
M.
,
H.T.
Porath
,
G.
Finkelstein
,
B.A.
Knisbacher
,
I.
Buchumenski
,
S.H.
Roth
,
E.Y.
Levanon
, and
E.
Eisenberg
.
2020
.
Purifying selection of long dsRNA is the first line of defense against false activation of innate immunity
.
Genome Biol.
21
:
26
.
Bhatt
,
D.M.
,
A.
Pandya-Jones
,
A.J.
Tong
,
I.
Barozzi
,
M.M.
Lissner
,
G.
Natoli
,
D.L.
Black
, and
S.T.
Smale
.
2012
.
Transcript dynamics of proinflammatory genes revealed by sequence analysis of subcellular RNA fractions
.
Cell
.
150
:
279
290
.
Bowling
,
E.A.
,
J.H.
Wang
,
F.
Gong
,
W.
Wu
,
N.J.
Neill
,
I.S.
Kim
,
S.
Tyagi
,
M.
Orellana
,
S.J.
Kurley
,
R.
Dominguez-Vidana
, et al
.
2021
.
Spliceosome-targeted therapies trigger an antiviral immune response in triple-negative breast cancer
.
Cell
.
184
:
384
403 e321
.
Brubaker
,
S.W.
,
K.S.
Bonham
,
I.
Zanoni
, and
J.C.
Kagan
.
2015
.
Innate immune pattern recognition: A cell biological perspective
.
Annu. Rev. Immunol.
33
:
257
290
.
Buerer
,
L.
,
N.E.
Clark
,
A.
Welch
,
C.R.
Duan
,
A.J.
Taggart
,
B.A.
Townley
,
J.
Wang
,
R.
Soemedi
,
S.P.
Rong
,
C.L.
Lin
, et al
.
2024
.
The debranching enzyme Dbr1 regulates lariat turnover and intron splicing
.
Nat. Commun.
15
:
4617
.
Calderon
,
B.M.
, and
G.L.
Conn
.
2018
.
A human cellular noncoding RNA activates the antiviral protein 2'-5'-oligoadenylate synthetase 1
.
J. Biol. Chem.
293
:
16115
16124
.
Chan
,
Y.H.
,
V.
Lundberg
,
J.
Le Pen
,
J.
Yuan
,
D.
Lee
,
F.
Pinci
,
S.
Volpi
,
K.
Nakajima
,
V.
Bondet
,
S.
Akesson
, et al
.
2024
.
SARS-CoV-2 brainstem encephalitis in human inherited DBR1 deficiency
.
J. Exp. Med.
221
. e20231725.
Chapman
,
K.B.
, and
J.D.
Boeke
.
1991
.
Isolation and characterization of the gene encoding yeast debranching enzyme
.
Cell
.
65
:
483
492
.
Chen
,
S.
2023
.
Ultrafast one-pass FASTQ data preprocessing, quality control, and deduplication using fastp
.
Imeta
.
2
:e107.
Chen
,
Y.G.
, and
S.
Hur
.
2022
.
Cellular origins of dsRNA, their recognition and consequences
.
Nat. Rev. Mol. Cell Bio
.
23
:
286
301
.
Chiappinelli
,
K.B.
,
P.L.
Strissel
,
A.
Desrichard
,
H.
Li
,
C.
Henke
,
B.
Akman
,
A.
Hein
,
N.S.
Rote
,
L.M.
Cope
,
A.
Snyder
, et al
.
2015
.
Inhibiting DNA methylation causes an interferon response in cancer via dsRNA including endogenous retroviruses
.
Cell
.
162
:
974
986
.
Chung
,
H.
,
J.J.A.
Calis
,
X.
Wu
,
T.
Sun
,
Y.
Yu
,
S.L.
Sarbanes
,
V.L.
Dao Thi
,
A.R.
Shilvock
,
H.H.
Hoffmann
,
B.R.
Rosenberg
, and
C.M.
Rice
.
2018
.
Human ADAR1 prevents endogenous RNA from triggering translational shutdown
.
Cell
.
172
:
811
824.e814
.
Cooper
,
D.A.
,
B.K.
Jha
,
R.H.
Silverman
,
J.R.
Hesselberth
, and
D.J.
Barton
.
2014
.
Ribonuclease L and metal-ion-independent endoribonuclease cleavage sites in host and viral RNAs
.
Nucleic Acids Res.
42
:
5202
5216
.
Danecek
,
P.
,
J.K.
Bonfield
,
J.
Liddle
,
J.
Marshall
,
V.
Ohan
,
M.O.
Pollard
,
A.
Whitwham
,
T.
Keane
,
S.A.
McCarthy
,
R.M.
Davies
, and
H.
Li
.
2021
.
Twelve years of SAMtools and BCFtools
.
Gigascience
.
10
:
giab008
.
Everett
,
R.D.
1984
.
Trans activation of transcription by herpes virus products: Requirement for two HSV-1 immediate-early polypeptides for maximum activity
.
EMBO J.
3
:
3135
3141
.
Findlay
,
G.M.
,
E.A.
Boyle
,
R.J.
Hause
,
J.C.
Klein
, and
J.
Shendure
.
2014
.
Saturation editing of genomic regions by multiplex homology-directed repair
.
Nature
.
513
:
120
123
.
Galabru
,
J.
, and
A.
Hovanessian
.
1987
.
Autophosphorylation of the protein-kinase dependent on double-stranded-Rna
.
J. Biol. Chem.
262
:
15538
15544
..
Galvis
,
A.E.
,
H.E.
Fisher
,
T.
Nitta
,
H.
Fan
, and
D.
Camerini
.
2014
.
Impairment of HIV-1 cDNA synthesis by DBR1 knockdown
.
J. Virol.
88
:
7054
7069
.
García
,
M.A.
,
J.
Gil
,
I.
Ventoso
,
S.
Guerra
,
E.
Domingo
,
C.
Rivas
, and
M.
Esteban
.
2006
.
Impact of protein kinase PKR in cell biology: From antiviral to antiproliferative action
.
Microbiol. Mol. Biol. Rev.
70
:
1032
1060
.
Gelman
,
I.H.
, and
S.
Silverstein
.
1985
.
Identification of immediate early genes from herpes-simplex virus that transactivate the virus thymidine kinase gene
.
Proc. Natl. Acad. Sci. USA
.
82
:
5265
5269
.
Han
,
B.
,
H.
Kpark
,
T.
Ching
,
J.
Panneerselvam
,
H.
Wang
,
Y.
Shen
,
J.
Zhang
,
L.
Li
,
R.
Che
,
L.
Garmire
, and
P.
Fei
.
2017
.
Human DBR1 modulates the recycling of snRNPs to affect alternative RNA splicing and contributes to the suppression of cancer development
.
Oncogene
.
36
:
5382
5391
.
Hatcher
,
E.L.
,
S.A.
Zhdanov
,
Y.M.
Bao
,
O.
Blinkova
,
E.P.
Nawrocki
,
Y.
Ostapchuck
,
A.A.
Schäffer
, and
J.R.
Brister
.
2017
.
Virus Variation Resource - improved response to emergent viral outbreaks
.
Nucleic Acids Res.
45
:
D482
D490
.
Heinicke
,
L.A.
,
S.R.
Nallagatla
,
C.M.
Hull
, and
P.C.
Bevilacqua
.
2011
.
RNA helical imperfections regulate activation of the protein kinase PKR: Effects of bulge position, size, and geometry
.
RNA
.
17
:
957
966
.
Hur
,
S.
2019
.
Double-Stranded RNA sensors and modulators in innate immunity
.
Annu. Rev. Immunol.
37
:
349
375
.
Ibberson
,
D.
,
V.
Benes
,
M.U.
Muckenthaler
, and
M.
Castoldi
.
2009
.
RNA degradation compromises the reliability of microRNA expression profiling
.
BMC Biotechnol.
9
:
102
.
Karolchik
,
D.
,
A.S.
Hinrichs
,
T.S.
Furey
,
K.M.
Roskin
,
C.W.
Sugnet
,
D.
Haussler
, and
W.J.
Kent
.
2004
.
The UCSC Table Browser data retrieval tool
.
Nucleic Acids Res.
32
:
D493
D496
.
Katze
,
M.G.
,
M.
Wambach
,
M.L.
Wong
,
M.
Garfinkel
,
E.
Meurs
,
K.
Chong
,
B.R.G.
Williams
,
A.G.
Hovanessian
, and
G.N.
Barber
.
1991
.
Functional expression and RNA-binding analysis of the interferon-induced, double-stranded RNA-activated, 68,000-Mr protein kinase in a cell-free system
.
Mol. Cell Biol.
11
:
5497
5505
.
Khabar
,
K.S.
,
M.
Dhalla
,
Y.
Siddiqui
,
A.
Zhou
,
M.N.
Al-Ahdal
,
S.D.
Der
,
R.H.
Silverman
, and
B.R.
Williams
.
2000
.
Effect of deficiency of the double-stranded RNA-dependent protein kinase, PKR, on antiviral resistance in the presence or absence of ribonuclease L: HSV-1 replication is particularly sensitive to deficiency of the major IFN-mediated enzymes
.
J. Interferon Cytokine Res.
20
:
653
659
.
Kim
,
D.
,
J.M.
Paggi
,
C.
Park
,
C.
Bennett
, and
S.L.
Salzberg
.
2019
.
Graph-based genome alignment and genotyping with HISAT2 and HISAT-genotype
.
Nat. Biotechnol.
37
:
907
915
.
Kim
,
Y.
,
J.H.
Lee
,
J.E.
Park
,
J.
Cho
,
H.
Yi
, and
V.N.
Kim
.
2014
.
PKR is activated by cellular dsRNAs during mitosis and acts as a mitotic regulator
.
Gene Dev.
28
:
1310
1322
.
Kim
,
Y.
,
J.
Park
,
S.
Kim
,
M.
Kim
,
M.G.
Kang
,
C.
Kwak
,
M.
Kang
,
B.
Kim
,
H.W.
Rhee
, and
V.N.
Kim
.
2018
.
PKR senses nuclear and mitochondrial signals by interacting with endogenous double-stranded RNAs
.
Mol. Cell
.
71
:
1051
1063.e1056
.
Lemaire
,
P.A.
,
E.
Anderson
,
J.
Lary
, and
J.L.
Cole
.
2008
.
Mechanism of PKR activation by dsRNA
.
J. Mol. Biol.
381
:
351
360
.
Liddicoat
,
B.J.
,
R.
Piskol
,
A.M.
Chalk
,
G.
Ramaswami
,
M.
Higuchi
,
J.C.
Hartner
,
J.B.
Li
,
P.H.
Seeburg
, and
C.R.
Walkley
.
2015
.
RNA editing by ADAR1 prevents MDA5 sensing of endogenous dsRNA as nonself
.
Science
.
349
:
1115
1120
.
Lorenz
,
R.
,
S.H.
Bernhart
,
C.
Honer Zu Siederdissen
,
H.
Tafer
,
C.
Flamm
,
P.F.
Stadler
, and
I.L.
Hofacker
.
2011
.
ViennaRNA package 2.0
.
Algorithms Mol. Biol.
6
:
26
.
Mehdipour
,
P.
,
S.A.
Marhon
,
I.
Ettayebi
,
A.
Chakravarthy
,
A.
Hosseini
,
Y.
Wang
,
F.A.
de Castro
,
H.
Loo Yau
,
C.
Ishak
,
S.
Abelson
, et al
.
2020
.
Epigenetic therapy induces transcription of inverted SINEs and ADAR1 dependency
.
Nature
.
588
:
169
173
.
Mercer
,
T.R.
,
M.B.
Clark
,
S.B.
Andersen
,
M.E.
Brunck
,
W.
Haerty
,
J.
Crawford
,
R.J.
Taft
,
L.K.
Nielsen
,
M.E.
Dinger
, and
J.S.
Mattick
.
2015
.
Genome-wide discovery of human splicing branchpoints
.
Genome Res.
25
:
290
303
.
Montemayor
,
E.J.
,
A.
Katolik
,
N.E.
Clark
,
A.B.
Taylor
,
J.P.
Schuermann
,
D.J.
Combs
,
R.
Johnsson
,
S.P.
Holloway
,
S.W.
Stevens
,
M.J.
Damha
, and
P.J.
Hart
.
2014
.
Structural basis of lariat RNA recognition by the intron debranching enzyme Dbr1
.
Nucleic Acids Res.
42
:
10845
10855
.
Padgett
,
R.A.
,
M.M.
Konarska
,
P.J.
Grabowski
,
S.F.
Hardy
, and
P.A.
Sharp
.
1984
.
Lariat RNA's as intermediates and products in the splicing of messenger RNA precursors
.
Science
.
225
:
898
903
.
Pineda
,
J.M.B.
, and
R.K.
Bradley
.
2018
.
Most human introns are recognized via multiple and tissue-specific branchpoints
.
Gene Dev.
32
:
577
591
.
Quinlan
,
A.R.
, and
I.M.
Hall
.
2010
.
BEDTools: A flexible suite of utilities for comparing genomic features
.
Bioinformatics
.
26
:
841
842
.
Robinson
,
J.A.
, and
K.
Moehle
.
2014
.
Structural aspects of molecular recognition in the immune system. Part II: Pattern recognition receptors
.
Pure Appl. Chem.
86
:
1483
1538
.
Ru
,
S.
,
S.
Tang
,
H.
Xu
,
J.
Yin
,
Y.
Guo
,
L.
Song
,
Z.
Jin
,
D.
Lee
,
Y.H.
Chan
,
X.
Chen
, et al
.
2025
.
Human DBR1 deficiency impairs stress granule-dependent PKR antiviral immunity
.
J. Exp. Med.
222
. e20240010.
Ruskin
,
B.
, and
M.R.
Green
.
1985
.
An RNA processing activity that debranches RNA lariats
.
Science
.
229
:
135
140
.
Ruskin
,
B.
,
A.R.
Krainer
,
T.
Maniatis
, and
M.R.
Green
.
1984
.
Excision of an intact intron as a novel lariat structure during pre-mRNA splicing in vitro
.
Cell
.
38
:
317
331
.
Schlee
,
M.
, and
G.
Hartmann
.
2016
.
Discriminating self from non-self in nucleic acid sensing
.
Nat. Rev. Immunol.
16
:
566
580
.
Shamseldin
,
H.E.
,
M.
Sadagopan
,
J.
Martini
,
R.
Al-Ali
,
M.
Radefeldt
,
M.
Ataei
,
S.
Lemke
,
Z.
Rahbeeni
,
F.
Al Mutairi
,
F.
Ababneh
, et al
.
2023
.
A founder DBR1 variant causes a lethal form of congenital ichthyosis
.
Hum. Genet.
142
:
1491
1498
.
Taggart
,
A.J.
,
A.M.
DeSimone
,
J.S.
Shih
,
M.E.
Filloux
, and
W.G.
Fairbrother
.
2012
.
Large-scale mapping of branchpoints in human pre-mRNA transcripts in vivo
.
Nat. Struct. Mol. Biol.
19
:
719
721
.
Taggart
,
A.J.
, and
W.G.
Fairbrother
.
2018
.
ShapeShifter: A novel approach for identifying and quantifying stable lariat intronic species in RNAseq data
.
Quant Biol.
6
:
267
274
.
Vachon
,
V.K.
,
B.M.
Calderon
, and
G.L.
Conn
.
2015
.
A novel RNA molecular signature for activation of 2'-5' oligoadenylate synthetase-1
.
Nucleic Acids Res.
43
:
544
552
.
Valeri
,
E.
, and
A.
Kajaste-Rudnitski
.
2025
.
Antiviral immunity lassoed down by excess RNA
.
J. Exp. Med.
222
:e20241743.
Wahl
,
M.C.
,
C.L.
Will
, and
R.
Luhrmann
.
2009
.
The spliceosome: Design principles of a dynamic RNP machine
.
Cell
.
136
:
701
718
.
Wilkinson
,
M.E.
,
C.
Charenton
, and
K.
Nagai
.
2020
.
RNA splicing by the spliceosome
.
Annu. Rev. Biochem.
89
:
359
388
.
Williams
,
B.R.
,
C.S.
Gilbert
, and
I.M.
Kerr
.
1979
.
The respective roles of the protein kinase and pppA2' p5' A2' p5 A-activated endonuclease in the inhibition of protein synthesis by double stranded RNA in rabbit reticulocyte lysates
.
Nucleic Acids Res.
6
:
1335
1350
.
Wu
,
Y.
,
W.
Zhao
,
Y.
Liu
,
X.
Tan
,
X.
Li
,
Q.
Zou
,
Z.
Xiao
,
H.
Xu
,
Y.
Wang
, and
X.
Yang
.
2018
.
Function of HNRNPC in breast cancer cells by controlling the dsRNA-induced interferon response
.
EMBO J.
37
:e99017.
Xu
,
X.Q.
,
X.
Yang
,
X.
Liu
,
Y.H.
Bi
,
P.Z.
Kong
,
Y.Q.
Wang
,
X.L.
Cheng
, and
Y.F.
Xi
.
2022
.
The Role of DBR1 as a candidate prognosis biomarker in esophageal squamous cell carcinoma
.
Technol. Cancer Res. T.
21
:
15330338221083105
.
Ye
,
Y.
,
J.
De Leon
,
N.
Yokoyama
,
Y.
Naidu
, and
D.
Camerini
.
2005
.
DBR1 siRNA inhibition of HIV-1 replication
.
Retrovirology
.
2
:
63
.
Zeng
,
Y.
,
B.J.
Fair
,
H.
Zeng
,
A.
Krishnamohan
,
Y.
Hou
,
J.M.
Hall
,
A.J.
Ruthenburg
,
Y.I.
Li
, and
J.P.
Staley
.
2022
.
Profiling lariat intermediates reveals genetic determinants of early and late co-transcriptional splicing
.
Mol. Cell
.
82
:
4681
4699.e4688
.
Zhang
,
S.Y.
,
N.E.
Clark
,
C.A.
Freije
,
E.
Pauwels
,
A.J.
Taggart
,
S.
Okada
,
H.
Mandel
,
P.
Garcia
,
M.J.
Ciancanelli
,
A.
Biran
, et al
.
2018
.
Inborn errors of RNA lariat metabolism in humans with brainstem viral infection
.
Cell
.
172
:
952
965.e918
.
Zheng
,
R.
,
M.
Dunlap
,
G.O.M.
Bobkov
,
C.
Gonzalez-Figueroa
,
K.J.
Patel
,
J.
Lyu
,
S.E.
Harvey
,
T.W.
Chan
,
G.
Quinones-Valdez
,
M.
Choudhury
, et al
.
2024
.
hnRNPM protects against the dsRNA-mediated interferon response by repressing LINE-associated cryptic splicing
.
Mol. Cell
.
84
:
2087
2103.e2088
.
Zheng
,
S.
,
B.Q.
Vuong
,
B.
Vaidyanathan
,
J.Y.
Lin
,
F.T.
Huang
, and
J.
Chaudhuri
.
2015
.
Non-coding RNA generated following lariat debranching mediates targeting of AID to DNA
.
Cell
.
161
:
762
773
.
Zheng
,
X.
, and
P.C.
Bevilacqua
.
2004
.
Activation of the protein kinase PKR by short double-stranded RNAs with single-stranded tails
.
RNA
.
10
:
1934
1945
.
Zhou
,
A.
,
J.
Paranjape
,
T.L.
Brown
,
H.
Nie
,
S.
Naik
,
B.
Dong
,
A.
Chang
,
B.
Trapp
,
R.
Fairchild
,
C.
Colmenares
, and
R.H.
Silverman
.
1997
.
Interferon action and apoptosis are defective in mice devoid of 2',5'-oligoadenylate-dependent RNase L
.
EMBO J.
16
:
6355
6363
.

Author notes

Disclosures: S. Monaghan reported personal fees from Danaher outside the submitted work and is the founder of Alcini, LLC. No other disclosures were reported.

This article is available under a Creative Commons License (Attribution 4.0 International, as described at https://creativecommons.org/licenses/by/4.0/).

Data & Figures

+ Expand view − Collapse view
Figure S1
Figure S1. Refer to the image caption for details. The vertical bar graph compares human lariat reads per one million mapped reads across different genotypes (D B R 1 plus slash plus, D B R 1 I 120 T slash I 120 T, and D B R 1 Y 17 H slash Y 17 H) upon I A V infection. The x-axis represents the infection conditions: N I, 8 h, and 24 h. The y-axis represents the number of human lariat reads per one million mapped reads. There are three grouped sets of vertical bars, each corresponding to a different genotype. Each group contains three gray bars representing N I, 8 h, and 24 h. Error bars are shown on each bar, indicating variability. For the D B R 1 plus slash plus genotype, the bars show no significant change across N I, 8 h, and 24 h, as indicated by n s. For the D B R 1 I 120 T slash I 120 T genotype, there is a significant increase at 24 h compared with N I, indicated by an asterisk. The 8 h bar is higher than N I but not marked as significant. For the D B R 1 Y 17 H slash Y 17 H genotype, there is a significant increase at 24 h compared with N I, indicated by a double asterisk. The 8 h value is increased relative to N I but is not marked with a significance symbol. Statistical annotations shown are n s, asterisk, and double asterisk. The bracket lines above bars indicate the specific comparisons. The x-axis label I A V infection is centered below the grouped conditions. Values are approximate based on visual inspection of the bar heights.

Cellular lariats increase in DBR1 mutant cells upon influenza virus infection. Human lariat levels in RNA-seq data from WT (DBR1 +/+) and DBR1 mutant (DBR1 I120T/I120T and DBR1 Y17H/Y17H) patient cell lines that were not infected (NI), infected with influenza virus (IAV) for 8 h, and infected with IAV for 24 h (P value from two-sided t test; ns, not significant; *P < 0.05, **P < 0.01).

Figure S1.
A vertical bar graph showing human lariat reads in different genotypes upon Influenza virus infection. The vertical bar graph compares human lariat reads per one million mapped reads across different genotypes (D B R 1 plus slash plus, D B R 1 I 120 T slash I 120 T, and D B R 1 Y 17 H slash Y 17 H) upon I A V infection. The x-axis represents the infection conditions: N I, 8 h, and 24 h. The y-axis represents the number of human lariat reads per one million mapped reads. There are three grouped sets of vertical bars, each corresponding to a different genotype. Each group contains three gray bars representing N I, 8 h, and 24 h. Error bars are shown on each bar, indicating variability. For the D B R 1 plus slash plus genotype, the bars show no significant change across N I, 8 h, and 24 h, as indicated by n s. For the D B R 1 I 120 T slash I 120 T genotype, there is a significant increase at 24 h compared with N I, indicated by an asterisk. The 8 h bar is higher than N I but not marked as significant. For the D B R 1 Y 17 H slash Y 17 H genotype, there is a significant increase at 24 h compared with N I, indicated by a double asterisk. The 8 h value is increased relative to N I but is not marked with a significance symbol. Statistical annotations shown are n s, asterisk, and double asterisk. The bracket lines above bars indicate the specific comparisons. The x-axis label I A V infection is centered below the grouped conditions. Values are approximate based on visual inspection of the bar heights.

Cellular lariats increase in DBR1 mutant cells upon influenza virus infection. Human lariat levels in RNA-seq data from WT (DBR1 +/+) and DBR1 mutant (DBR1 I120T/I120T and DBR1 Y17H/Y17H) patient cell lines that were not infected (NI), infected with influenza virus (IAV) for 8 h, and infected with IAV for 24 h (P value from two-sided t test; ns, not significant; *P < 0.05, **P < 0.01).

Close modal
Figure 1.
A multi-part image compares G C content, M F E, base pairing, and shuffled sequence analysis of human and viral introns. The box plots in panels A, B, and C compare G C content, normalized predicted minimum free energy (M F E), and maximum base pairing of human introns (length less than 5000 nucleotides) to introns from human viruses. The x-axis represents the categories Human and Virus, and the y-axis represents G C content percentage (panel A), M F E in kilocalories per mole per base (panel B), and maximum base pairing (panel C). The data are shown as box-and-whisker plots rather than simple bars. Human introns are represented in teal, and viral introns are represented in pink. Panel A shows no significant difference in G C content between human and viral introns, indicated by n s. Panel B shows that viral introns have significantly higher normalized predicted MFE compared to human introns, indicated by four asterisks. Panel C shows that viral introns have significantly lower maximum base pairing compared to human introns, also indicated by four asterisks. Panel D presents a schematic of the computational experiment. The observed M F E of each intron is compared to the expected MFE derived from shuffled versions of the same intron. The shuffle sequence preserves dinucleotide content (as indicated in the diagram). For each intron, 10 shuffled sequences are generated, the M F E is calculated for each, and the mean M F E of the shuffled ensemble is obtained. Panels E and F plot the minimum M F E of shuffled ensemble versus observed M F E for human introns (panel E) and viral introns (panel F), respectively. The plots show strong correlations, with r squared equals 0.84 for human introns and r squared equals 0.89 for viral introns. Panel G shows the density distribution of Observed MFE minus Mean M F E of the shuffled ensemble for human and viral introns. Viral introns show a significantly different distribution compared to human introns, indicated by four asterisks. All values are approximated based on the figure.

Viral introns are less structured than 90% of human introns. (A–C) Human introns (length <5,000 nt) compared with 126 introns from human viruses according to their distributions of (A) GC content, (B) normalized predicted MFE intron length ≤5,000 nt), and (C) potential for intron base pairing (MBP, see Materials and methods). P values were from t test. ns, not significant; ****P < 0.0001. (D) Schematic describing computational experiments comparing the observed predicted MFE of an intron to the expected value (predicted MFE of an ensemble of 10 shuffles of the same intron). (E) For human introns, each intron’s observed MFE is plotted against the mean MFE derived from the intron’s shuffled ensemble described in D. (F) For human virus introns, each intron’s observed MFE is plotted against the mean MFE derived from the intron’s shuffled ensemble described in D. (G) The distribution of the difference between observed MFE and mean MFE of shuffled ensemble for human and viral introns. P value was from t test. ****P < 0.0001.

Figure 1.
A multi-part image compares G C content, M F E, base pairing, and shuffled sequence analysis of human and viral introns. The box plots in panels A, B, and C compare G C content, normalized predicted minimum free energy (M F E), and maximum base pairing of human introns (length less than 5000 nucleotides) to introns from human viruses. The x-axis represents the categories Human and Virus, and the y-axis represents G C content percentage (panel A), M F E in kilocalories per mole per base (panel B), and maximum base pairing (panel C). The data are shown as box-and-whisker plots rather than simple bars. Human introns are represented in teal, and viral introns are represented in pink. Panel A shows no significant difference in G C content between human and viral introns, indicated by n s. Panel B shows that viral introns have significantly higher normalized predicted MFE compared to human introns, indicated by four asterisks. Panel C shows that viral introns have significantly lower maximum base pairing compared to human introns, also indicated by four asterisks. Panel D presents a schematic of the computational experiment. The observed M F E of each intron is compared to the expected MFE derived from shuffled versions of the same intron. The shuffle sequence preserves dinucleotide content (as indicated in the diagram). For each intron, 10 shuffled sequences are generated, the M F E is calculated for each, and the mean M F E of the shuffled ensemble is obtained. Panels E and F plot the minimum M F E of shuffled ensemble versus observed M F E for human introns (panel E) and viral introns (panel F), respectively. The plots show strong correlations, with r squared equals 0.84 for human introns and r squared equals 0.89 for viral introns. Panel G shows the density distribution of Observed MFE minus Mean M F E of the shuffled ensemble for human and viral introns. Viral introns show a significantly different distribution compared to human introns, indicated by four asterisks. All values are approximated based on the figure.

Viral introns are less structured than 90% of human introns. (A–C) Human introns (length <5,000 nt) compared with 126 introns from human viruses according to their distributions of (A) GC content, (B) normalized predicted MFE intron length ≤5,000 nt), and (C) potential for intron base pairing (MBP, see Materials and methods). P values were from t test. ns, not significant; ****P < 0.0001. (D) Schematic describing computational experiments comparing the observed predicted MFE of an intron to the expected value (predicted MFE of an ensemble of 10 shuffles of the same intron). (E) For human introns, each intron’s observed MFE is plotted against the mean MFE derived from the intron’s shuffled ensemble described in D. (F) For human virus introns, each intron’s observed MFE is plotted against the mean MFE derived from the intron’s shuffled ensemble described in D. (G) The distribution of the difference between observed MFE and mean MFE of shuffled ensemble for human and viral introns. P value was from t test. ****P < 0.0001.

Close modal
+ Expand view − Collapse view
Figure S2
Figure S2. Refer to the image caption for details. In panel A, the box plot compares intron lengths between humans and viruses. Human introns are significantly longer than viral introns, as indicated by four asterisks above the comparison bracket. The y-axis is labeled Intron length and ranges up to approximately 12,000. Human introns show a much wider distribution and higher median compared to viral introns, which are shorter and more tightly distributed. The figure indicates statistical significance but does not specify the test in the image. In panel B, the scatter plots show the relationship between observed minimum folding energy (M F E) and mean M F E of the shuffled ensemble for three transcript regions: 3 prime U T R, 5 prime U T R, and Exon. The x-axis represents Observed M F E, and the y-axis represents Mean M F E of the shuffled ensemble. Each plot contains many data points clustered along a diagonal reference line (y equals x). The correlation coefficients (r squared) are 0.9 for 3 prime U T R, 0.92 for 5 prime U T R, and 0.88 for Exon, indicating strong positive correlations between observed and shuffled M F E values.

Comparison of viral and human intron lengths and secondary structure in human transcripts. (A) Viral introns are shorter than human introns. P value was from t test, ****P < 0.0001. (B) Transcript regions exported to the cytoplasm possess secondary structure in line with random expectation. For human 3′ UTRs, 5′ UTRs, and exons, each region’s observed MFE is plotted against the mean MFE derived from the region’s shuffled ensemble described in Fig. 1 D.

Figure S2.
A box plot compares intron lengths, and scatter plots show strong M F E correlations. In panel A, the box plot compares intron lengths between humans and viruses. Human introns are significantly longer than viral introns, as indicated by four asterisks above the comparison bracket. The y-axis is labeled Intron length and ranges up to approximately 12,000. Human introns show a much wider distribution and higher median compared to viral introns, which are shorter and more tightly distributed. The figure indicates statistical significance but does not specify the test in the image. In panel B, the scatter plots show the relationship between observed minimum folding energy (M F E) and mean M F E of the shuffled ensemble for three transcript regions: 3 prime U T R, 5 prime U T R, and Exon. The x-axis represents Observed M F E, and the y-axis represents Mean M F E of the shuffled ensemble. Each plot contains many data points clustered along a diagonal reference line (y equals x). The correlation coefficients (r squared) are 0.9 for 3 prime U T R, 0.92 for 5 prime U T R, and 0.88 for Exon, indicating strong positive correlations between observed and shuffled M F E values.

Comparison of viral and human intron lengths and secondary structure in human transcripts. (A) Viral introns are shorter than human introns. P value was from t test, ****P < 0.0001. (B) Transcript regions exported to the cytoplasm possess secondary structure in line with random expectation. For human 3′ UTRs, 5′ UTRs, and exons, each region’s observed MFE is plotted against the mean MFE derived from the region’s shuffled ensemble described in Fig. 1 D.

Close modal
Figure 2.
A multi-part image shows that inverted repeat A l u elements affect intron structure, distribution, M F E correlations, and lariat accumulation levels. The image contains multiple graphs analyzing the contribution of inverted repeat A l u elements to human intron structure. Panel A shows scatter plots depicting the relationship between observed minimum free energy (Observed M F E) and the mean M F E of shuffled intron sequences (Mean M F E of shuffled ensemble) for human introns. The top plots compare all human introns and introns with no A l u, with r squared values of 0.84 and 0.94, respectively. The lower plots categorize introns by A l u content: 1 A l u (r squared equals 0.94), more than 1 A l u in the same orientation (r squared equals 0.93), and inverted repeat A l u (r squared equals 0.54). Each scatter plot includes a diagonal reference line (y equals x). The inverted repeat A l u group shows a noticeably weaker correlation compared to other groups. Panel B presents a stacked bar graph showing the A l u content across transcript regions (5 prime U T R, Exons, Introns, and 3 prime U T R). The legend indicates three categories: 1 A l u, more than 1 A l u in the same orientation, and inverted repeat A l u. Introns show the highest proportion of A l u elements, particularly inverted repeat A l u, compared to other regions. Panel C features a bar graph comparing I R A l u intron lariat levels in wild type and D B R 1 knockout samples. The y-axis is labeled I R A l u intron lariat level. The D B R 1 knockout shows a marked increase compared to wild type, with statistical significance indicated by a double asterisk. Together, the graphs show that inverted repeat A l u elements are enriched in introns, are associated with altered M F E correlation patterns, and lead to increased lariat accumulation in the D B R 1 knockout condition.

IR Alu elements contribute to human intron structure. (A) The relationship between observed MFE and the mean MFE of an ensemble of shuffled intron sequences for human introns is partitioned into distinct categories based on each intron’s Alu content (no Alu, 1 Alu, >1 Alu in the same orientation, and IR Alu). (B) The proportion of 5′ UTR, exons, introns and 3′ UTRs that contain 1 Alu, >1 Alu in the same orientation, and IR Alu. (C) The lariat levels of introns with IR Alu in WT and DBR1 KO samples. P value was from t test. **P < 0.01.

Figure 2.
A multi-part image shows that inverted repeat A l u elements affect intron structure, distribution, M F E correlations, and lariat accumulation levels. The image contains multiple graphs analyzing the contribution of inverted repeat A l u elements to human intron structure. Panel A shows scatter plots depicting the relationship between observed minimum free energy (Observed M F E) and the mean M F E of shuffled intron sequences (Mean M F E of shuffled ensemble) for human introns. The top plots compare all human introns and introns with no A l u, with r squared values of 0.84 and 0.94, respectively. The lower plots categorize introns by A l u content: 1 A l u (r squared equals 0.94), more than 1 A l u in the same orientation (r squared equals 0.93), and inverted repeat A l u (r squared equals 0.54). Each scatter plot includes a diagonal reference line (y equals x). The inverted repeat A l u group shows a noticeably weaker correlation compared to other groups. Panel B presents a stacked bar graph showing the A l u content across transcript regions (5 prime U T R, Exons, Introns, and 3 prime U T R). The legend indicates three categories: 1 A l u, more than 1 A l u in the same orientation, and inverted repeat A l u. Introns show the highest proportion of A l u elements, particularly inverted repeat A l u, compared to other regions. Panel C features a bar graph comparing I R A l u intron lariat levels in wild type and D B R 1 knockout samples. The y-axis is labeled I R A l u intron lariat level. The D B R 1 knockout shows a marked increase compared to wild type, with statistical significance indicated by a double asterisk. Together, the graphs show that inverted repeat A l u elements are enriched in introns, are associated with altered M F E correlation patterns, and lead to increased lariat accumulation in the D B R 1 knockout condition.

IR Alu elements contribute to human intron structure. (A) The relationship between observed MFE and the mean MFE of an ensemble of shuffled intron sequences for human introns is partitioned into distinct categories based on each intron’s Alu content (no Alu, 1 Alu, >1 Alu in the same orientation, and IR Alu). (B) The proportion of 5′ UTR, exons, introns and 3′ UTRs that contain 1 Alu, >1 Alu in the same orientation, and IR Alu. (C) The lariat levels of introns with IR Alu in WT and DBR1 KO samples. P value was from t test. **P < 0.01.

Close modal
Figure 3.
A composite image shows R N A foci in wildtype and D B R 1 knockout cells, R N A foci counts, cytoplasmic localization, dot blot, and immunofluorescence.Panel A shows fluorescence in situ hybridization images of M Y O 19 intron 11 in wild type and D B R 1 knockout cells. The intron signal is shown in red and nuclei are stained with D A P I in blue. D B R 1 knockout cells display visibly increased R N A foci compared to wild type. Panel B presents box plots of R N A foci counts and cytoplasmic localization of R N A foci. The left plot shows increased R N A foci counts in D B R 1 knockout cells compared to wild type. The right plot shows a higher percentage of cytoplasmic foci in D B R 1 knockout cells. Individual data points are overlaid on the box plots. Panel C shows lariat P C R analysis separating cytoplasmic and nuclear fractions from wild type and D B R 1 knockout cells. The results indicate enrichment of intron lariats containing inverted repeat A l u elements in the cytoplasm of D B R 1 knockout cells. A control intron without inverted repeat A l u is shown, and X I S T serves as a control. Panel D presents a dot blot assay using RNA dilutions probed with the J 2 antibody. The blot confirms that the antibody specifically recognizes A l u double stranded R N A and R N ase 3 treated samples show reduced signal, demonstrating specificity for double stranded R N A. Panel E shows immunofluorescence images of wild type and D B R 1 knockout cells stained with the J 2 antibody in red and D A P I in blue. D B R 1 knockout cells exhibit stronger cytoplasmic double stranded R N A staining. Additional panels show treatment with D N ase, R N ase H, and R N ase R, confirming that the signal corresponds to double stranded R N A rather than D N A or single stranded R N A. Panel F provides a box plot quantifying cytoplasmic double stranded R N A signal intensity. D B R 1 knockout cells show significantly higher cytoplasmic double stranded R N A signal compared to wild type, and R N ase R treatment reduces the signal. Panel G includes a bar graph showing the mean ratio of read coverage across inverted repeat A l u in cytoplasmic total versus J 2 immunoprecipitation R N A sequencing samples, comparing wild type and D B R 1 knockout cells. Panel H shows a bar graph of intron double stranded R N A expression relative to 3 prime untranslated regions in cytoplasmic J 2 immunoprecipitation R N A sequencing samples. Expression is stratified by A l u content categories, and D B R 1 knockout cells show increased intron double stranded R N A expression, particularly for inverted repeat A l u containing introns. Together, the panels demonstrate that loss of D B R 1 leads to cytoplasmic accumulation of intron lariats containing inverted repeat A l u elements and increased double stranded R N A signal.

Lariats accumulate in the cytoplasm and form dsRNA in the absence of DBR1. (A) Imaging of FISH targeted to MYO19 intron 11 (red) in WT and DBR1 KO cells. DAPI (blue) served as a marker for nuclei. The white dotted line outlines the cell boundary. The scale bar represents 5 µm. (B) Analysis of visualized RNA foci reveals an increase in foci in DBR1 KO samples, as well as a shift to the cytoplasm. n represents the number of single cells from at least three independent replicates. (C) Lariat PCR reveals specific cytoplasmic enrichment of IR Alu–containing intron lariats in DBR1 KO cells. Nuclear RNA (XIST) is used to demonstrate efficient nuclear/cytoplasmic fractionation. Data are representative of three independent experiments. (D) Dot blot demonstrating specificity of J2 antibody for Alu dsRNA relative to RNase III–digested Alu dsRNA and Alu ssRNA. (E) J2 IF of WT (top row) and DBR1 KO cells (bottom row). Cells were stained for dsRNA (J2, red), with DAPI (blue) serving as a nuclear marker. Representative images of untreated and DNase/RNase-treated cells from at least three biological replicates are shown. The scale bar represents 10 µm. (F) Quantification of cytoplasmic dsRNA signal intensity from the IF images in E (P value from t test, **P < 0.01, ***P < 0.001). (G) Mean ratio of read coverage across IR Alu in cytoplasmic total vs. J2-IP RNA-seq samples. (H) For gene regions stratified by the indicated Alu content categories, the relative expression of introns compared with 3′ UTRs in cytoplasmic J2-IP RNA-seq samples. Source data are available for this figure: SourceData F3.

Figure 3.
A composite image shows R N A foci in wildtype and D B R 1 knockout cells, R N A foci counts, cytoplasmic localization, dot blot, and immunofluorescence.Panel A shows fluorescence in situ hybridization images of M Y O 19 intron 11 in wild type and D B R 1 knockout cells. The intron signal is shown in red and nuclei are stained with D A P I in blue. D B R 1 knockout cells display visibly increased R N A foci compared to wild type. Panel B presents box plots of R N A foci counts and cytoplasmic localization of R N A foci. The left plot shows increased R N A foci counts in D B R 1 knockout cells compared to wild type. The right plot shows a higher percentage of cytoplasmic foci in D B R 1 knockout cells. Individual data points are overlaid on the box plots. Panel C shows lariat P C R analysis separating cytoplasmic and nuclear fractions from wild type and D B R 1 knockout cells. The results indicate enrichment of intron lariats containing inverted repeat A l u elements in the cytoplasm of D B R 1 knockout cells. A control intron without inverted repeat A l u is shown, and X I S T serves as a control. Panel D presents a dot blot assay using RNA dilutions probed with the J 2 antibody. The blot confirms that the antibody specifically recognizes A l u double stranded R N A and R N ase 3 treated samples show reduced signal, demonstrating specificity for double stranded R N A. Panel E shows immunofluorescence images of wild type and D B R 1 knockout cells stained with the J 2 antibody in red and D A P I in blue. D B R 1 knockout cells exhibit stronger cytoplasmic double stranded R N A staining. Additional panels show treatment with D N ase, R N ase H, and R N ase R, confirming that the signal corresponds to double stranded R N A rather than D N A or single stranded R N A. Panel F provides a box plot quantifying cytoplasmic double stranded R N A signal intensity. D B R 1 knockout cells show significantly higher cytoplasmic double stranded R N A signal compared to wild type, and R N ase R treatment reduces the signal. Panel G includes a bar graph showing the mean ratio of read coverage across inverted repeat A l u in cytoplasmic total versus J 2 immunoprecipitation R N A sequencing samples, comparing wild type and D B R 1 knockout cells. Panel H shows a bar graph of intron double stranded R N A expression relative to 3 prime untranslated regions in cytoplasmic J 2 immunoprecipitation R N A sequencing samples. Expression is stratified by A l u content categories, and D B R 1 knockout cells show increased intron double stranded R N A expression, particularly for inverted repeat A l u containing introns. Together, the panels demonstrate that loss of D B R 1 leads to cytoplasmic accumulation of intron lariats containing inverted repeat A l u elements and increased double stranded R N A signal.

Lariats accumulate in the cytoplasm and form dsRNA in the absence of DBR1. (A) Imaging of FISH targeted to MYO19 intron 11 (red) in WT and DBR1 KO cells. DAPI (blue) served as a marker for nuclei. The white dotted line outlines the cell boundary. The scale bar represents 5 µm. (B) Analysis of visualized RNA foci reveals an increase in foci in DBR1 KO samples, as well as a shift to the cytoplasm. n represents the number of single cells from at least three independent replicates. (C) Lariat PCR reveals specific cytoplasmic enrichment of IR Alu–containing intron lariats in DBR1 KO cells. Nuclear RNA (XIST) is used to demonstrate efficient nuclear/cytoplasmic fractionation. Data are representative of three independent experiments. (D) Dot blot demonstrating specificity of J2 antibody for Alu dsRNA relative to RNase III–digested Alu dsRNA and Alu ssRNA. (E) J2 IF of WT (top row) and DBR1 KO cells (bottom row). Cells were stained for dsRNA (J2, red), with DAPI (blue) serving as a nuclear marker. Representative images of untreated and DNase/RNase-treated cells from at least three biological replicates are shown. The scale bar represents 10 µm. (F) Quantification of cytoplasmic dsRNA signal intensity from the IF images in E (P value from t test, **P < 0.01, ***P < 0.001). (G) Mean ratio of read coverage across IR Alu in cytoplasmic total vs. J2-IP RNA-seq samples. (H) For gene regions stratified by the indicated Alu content categories, the relative expression of introns compared with 3′ UTRs in cytoplasmic J2-IP RNA-seq samples. Source data are available for this figure: SourceData F3.

Close modal
Figure 4.
A multi-part image shows the effects of D B R 1 loss and A l u d s R N A on P K R and e I F 2 alpha activation pathways.The image contains four panels (A, B, C, and D) of Western blot and R N A profiling data. Panel A shows R N A profiling results with visible 28 S and 18 S r R N A bands under W T, D B R 1 K O, and D B R 1 K O plus D B R 1 conditions, each treated with poly I:C either negative or positive. The 28 S and 18 S bands appear intact across all lanes, indicating no obvious rRNA degradation after four hours of poly I:C treatment. Panel B presents western blot analysis showing decreased phosphorylation levels of P K R and e I F 2 alpha in D B R 1 knockout cells compared to wild-type cells after poly I:C treatment. In W T cells treated with poly I:C, P-P K R is 48 percent, and P-e I F 2 alpha is 100 percent, whereas in D B R 1 K O cells treated with poly I:C, P-P K R is 14 percent and P-e I F 2 alpha is 54 percent. Total P K R, total e I F 2 alpha, and beta-Actin serve as loading controls and remain relatively constant. Panel C displays western blot results in D B R 1 K O cells with and without D B R 1 add-back following poly I:C treatment. Phosphorylation levels increase upon D B R 1 re-expression, with P-P K R values of 0 percent, 20 percent, and 42 percent, and P-e I F 2 alpha values of 10 percent, 26 percent, and 51 percent, indicating restoration of signaling activity. Panel D shows western blot results demonstrating that phosphorylation of P K R and e I F 2 alpha occurs specifically in response to A l u d s R N A. P-P K R reaches 81 percent, and P-e I F 2 alpha reaches 19 percent with A l u d s R N A, while minimal phosphorylation (0 to 1 percent) is observed with No R N A, A l u plus s s R N A, or A l u s s R N A. Total P K R, total e I F 2 alpha, and beta-Actin are shown as controls. All values are approximated.

DBR1 loss suppresses, while Alu dsRNA activates, innate dsRNA-sensing pathways. (A) Total RNA profiling using an Agilent Bioanalyzer. The absence of rRNA degradation was observed in DBR1 KO cells following 4 h of poly I:C treatment, whereas rRNA degradation was restored upon add-back of DBR1 (DBR1 KO +DBR1) in the presence of poly I:C. Data are representative of three independent experiments. (B) In DBR1 KO cells, the phosphorylation levels of PKR and eIF2α were significantly decreased compared with those in WT cells (HEK293T) following 2 h of poly I:C treatment, as determined by western blot analysis. Data are representative of three independent experiments. (C) The phosphorylation levels of PKR and eIF2α significantly increased upon add-back of DBR1 following a 1-h treatment with poly I:C, as determined by western blot analysis. Quantification of phosphorylated PKR and eIF2α was performed using ImageJ. Data are representative of three independent experiments. (D) Western blot results showed that the phosphorylation of PKR and eIF2α occur specifically in response to Alu dsRNA. Data are representative of three independent experiments. Source data are available for this figure: SourceData F4.

Figure 4.
A multi-part image shows the effects of D B R 1 loss and A l u d s R N A on P K R and e I F 2 alpha activation pathways.The image contains four panels (A, B, C, and D) of Western blot and R N A profiling data. Panel A shows R N A profiling results with visible 28 S and 18 S r R N A bands under W T, D B R 1 K O, and D B R 1 K O plus D B R 1 conditions, each treated with poly I:C either negative or positive. The 28 S and 18 S bands appear intact across all lanes, indicating no obvious rRNA degradation after four hours of poly I:C treatment. Panel B presents western blot analysis showing decreased phosphorylation levels of P K R and e I F 2 alpha in D B R 1 knockout cells compared to wild-type cells after poly I:C treatment. In W T cells treated with poly I:C, P-P K R is 48 percent, and P-e I F 2 alpha is 100 percent, whereas in D B R 1 K O cells treated with poly I:C, P-P K R is 14 percent and P-e I F 2 alpha is 54 percent. Total P K R, total e I F 2 alpha, and beta-Actin serve as loading controls and remain relatively constant. Panel C displays western blot results in D B R 1 K O cells with and without D B R 1 add-back following poly I:C treatment. Phosphorylation levels increase upon D B R 1 re-expression, with P-P K R values of 0 percent, 20 percent, and 42 percent, and P-e I F 2 alpha values of 10 percent, 26 percent, and 51 percent, indicating restoration of signaling activity. Panel D shows western blot results demonstrating that phosphorylation of P K R and e I F 2 alpha occurs specifically in response to A l u d s R N A. P-P K R reaches 81 percent, and P-e I F 2 alpha reaches 19 percent with A l u d s R N A, while minimal phosphorylation (0 to 1 percent) is observed with No R N A, A l u plus s s R N A, or A l u s s R N A. Total P K R, total e I F 2 alpha, and beta-Actin are shown as controls. All values are approximated.

DBR1 loss suppresses, while Alu dsRNA activates, innate dsRNA-sensing pathways. (A) Total RNA profiling using an Agilent Bioanalyzer. The absence of rRNA degradation was observed in DBR1 KO cells following 4 h of poly I:C treatment, whereas rRNA degradation was restored upon add-back of DBR1 (DBR1 KO +DBR1) in the presence of poly I:C. Data are representative of three independent experiments. (B) In DBR1 KO cells, the phosphorylation levels of PKR and eIF2α were significantly decreased compared with those in WT cells (HEK293T) following 2 h of poly I:C treatment, as determined by western blot analysis. Data are representative of three independent experiments. (C) The phosphorylation levels of PKR and eIF2α significantly increased upon add-back of DBR1 following a 1-h treatment with poly I:C, as determined by western blot analysis. Quantification of phosphorylated PKR and eIF2α was performed using ImageJ. Data are representative of three independent experiments. (D) Western blot results showed that the phosphorylation of PKR and eIF2α occur specifically in response to Alu dsRNA. Data are representative of three independent experiments. Source data are available for this figure: SourceData F4.

Close modal
+ Expand view− Collapse view
Figure S3
Figure S3. Refer to the image caption for details.The image presents a Western blot analysis showing the levels of various proteins over a 10 day time course following s i R N A mediated knockdown of D B R 1. The blot includes lanes for negative control s i R N A and D B R 1 s i R N A at 2 days, 4 days, and 10 days, each shown with and without poly I:C treatment. Molecular weight markers in kilodaltons are indicated at 75 and 37. The proteins analyzed are P-P K R, P K R, P-e I F 2 alpha, e I F 2 alpha, beta-Actin, D B R 1, and G A P D H. In the negative control s i R N A condition, poly I:C treatment increases phosphorylation of P K R and e I F 2 alpha. In the D B R 1 s i R N A conditions, D B R 1 protein levels progressively decrease from 2 days to 10 days, confirming knockdown efficiency. Correspondingly, poly I:C induced phosphorylation of P K R and e I F 2 alpha appears reduced compared to the negative control, particularly at later time points when DBR1 levels are lowest. Total P K R and total e I F 2 alpha remain relatively stable across conditions. Beta-Actin and G A P D H serve as loading controls and show consistent band intensity. The blot shows temporal changes in protein levels at different time points, indicating the impact of D B R 1 depletion on P K R activation and downstream e I F 2 alpha phosphorylation in response to poly I:C.

Time course depletion of DBR1 reveals that PKR activation correlates with DBR1 protein levels. Western blot analysis showing DBR1 protein levels following siRNA-mediated knockdown over a 10-day time course. Corresponding levels of total and phosphorylated PKR and eIF2α (P-PKR and P-eIF2α) were examined at the indicated time points. Data are representative of three independent experiments. Source data are available for this figure: SourceData FS3.

Figure S3.
A western blot analysis showing D B R 1 protein levels following s i R N A-mediated knockdown over a 10-day time course.The image presents a Western blot analysis showing the levels of various proteins over a 10 day time course following s i R N A mediated knockdown of D B R 1. The blot includes lanes for negative control s i R N A and D B R 1 s i R N A at 2 days, 4 days, and 10 days, each shown with and without poly I:C treatment. Molecular weight markers in kilodaltons are indicated at 75 and 37. The proteins analyzed are P-P K R, P K R, P-e I F 2 alpha, e I F 2 alpha, beta-Actin, D B R 1, and G A P D H. In the negative control s i R N A condition, poly I:C treatment increases phosphorylation of P K R and e I F 2 alpha. In the D B R 1 s i R N A conditions, D B R 1 protein levels progressively decrease from 2 days to 10 days, confirming knockdown efficiency. Correspondingly, poly I:C induced phosphorylation of P K R and e I F 2 alpha appears reduced compared to the negative control, particularly at later time points when DBR1 levels are lowest. Total P K R and total e I F 2 alpha remain relatively stable across conditions. Beta-Actin and G A P D H serve as loading controls and show consistent band intensity. The blot shows temporal changes in protein levels at different time points, indicating the impact of D B R 1 depletion on P K R activation and downstream e I F 2 alpha phosphorylation in response to poly I:C.

Time course depletion of DBR1 reveals that PKR activation correlates with DBR1 protein levels. Western blot analysis showing DBR1 protein levels following siRNA-mediated knockdown over a 10-day time course. Corresponding levels of total and phosphorylated PKR and eIF2α (P-PKR and P-eIF2α) were examined at the indicated time points. Data are representative of three independent experiments. Source data are available for this figure: SourceData FS3.

Close modal
Figure 5.
Western blots and schematics show P K R activation, dimerization, and downstream e I F 2 alpha phosphorylation with varying A l u d s R N A levels.The image contains three panels labeled A, B, and C. Panel A shows a Western blot analysis of P K R and e I F 2 alpha phosphorylation with varying levels of A l u d s R N A following poly I:C rechallenge. The blot displays bands for P-P K R, P K R, P-e I F 2 alpha, e I F 2 alpha, and beta-Actin across different concentrations of A l u d s R N A (0 microgram, 0.1 microgram, 1 microgram, and 10 microgram) with and without poly I:C rechallenge. Increasing A l u d s R N A alters the phosphorylation pattern of P K R and e I F 2 alpha in response to poly I:C. Total P K R and total e I F 2 alpha remain relatively constant, and beta-Actin serves as a loading control. Molecular weight markers (k D a) are shown at 75 and 37. Panel B presents a schematic illustration of the P K R titration model. It depicts how low versus high levels of endogenous d s R N A influence P K R dimerization. At low d s R N A levels, poly I:C promotes P K R dimer formation, leading to activation. At high endogenous d s R N A levels, P K R is sequestered into inactive complexes, reducing inducible dimerization upon poly I:C stimulation. Panel C shows cells with different levels of A l u d s R N A after poly (I:C) rechallenge, cross-linked with D S S, followed by S D S-P A G E and immunoblotting with anti-P K R and anti-P-P K R antibodies. The blots display bands for P K R and P-P K R across the same concentrations of A l u d s R N A.

High levels of Alu dsRNA attenuate PKR activation by titrating PKR dimerization. (A) Western blot analysis of PKR and eIF2α phosphorylation with varying levels of Alu dsRNA following poly I:C rechallenge. Data are representative of three independent experiments. (B) Schematic illustration of the PKR titration model. (C) Cells with different levels of Alu dsRNA after poly(I:C) rechallenge were cross-linked with DSS, followed by SDS-PAGE and immunoblotting with anti-PKR (left) and anti–P-PKR (right) antibodies. Data are representative of two independent experiments. Source data are available for this figure: SourceData F5.

Figure 5.
Western blots and schematics show P K R activation, dimerization, and downstream e I F 2 alpha phosphorylation with varying A l u d s R N A levels.The image contains three panels labeled A, B, and C. Panel A shows a Western blot analysis of P K R and e I F 2 alpha phosphorylation with varying levels of A l u d s R N A following poly I:C rechallenge. The blot displays bands for P-P K R, P K R, P-e I F 2 alpha, e I F 2 alpha, and beta-Actin across different concentrations of A l u d s R N A (0 microgram, 0.1 microgram, 1 microgram, and 10 microgram) with and without poly I:C rechallenge. Increasing A l u d s R N A alters the phosphorylation pattern of P K R and e I F 2 alpha in response to poly I:C. Total P K R and total e I F 2 alpha remain relatively constant, and beta-Actin serves as a loading control. Molecular weight markers (k D a) are shown at 75 and 37. Panel B presents a schematic illustration of the P K R titration model. It depicts how low versus high levels of endogenous d s R N A influence P K R dimerization. At low d s R N A levels, poly I:C promotes P K R dimer formation, leading to activation. At high endogenous d s R N A levels, P K R is sequestered into inactive complexes, reducing inducible dimerization upon poly I:C stimulation. Panel C shows cells with different levels of A l u d s R N A after poly (I:C) rechallenge, cross-linked with D S S, followed by S D S-P A G E and immunoblotting with anti-P K R and anti-P-P K R antibodies. The blots display bands for P K R and P-P K R across the same concentrations of A l u d s R N A.

High levels of Alu dsRNA attenuate PKR activation by titrating PKR dimerization. (A) Western blot analysis of PKR and eIF2α phosphorylation with varying levels of Alu dsRNA following poly I:C rechallenge. Data are representative of three independent experiments. (B) Schematic illustration of the PKR titration model. (C) Cells with different levels of Alu dsRNA after poly(I:C) rechallenge were cross-linked with DSS, followed by SDS-PAGE and immunoblotting with anti-PKR (left) and anti–P-PKR (right) antibodies. Data are representative of two independent experiments. Source data are available for this figure: SourceData F5.

Close modal
+ Expand view − Collapse view
Figure S4
Figure S4. Refer to the image caption for details. The image contains three panels labeled A, B, and C. Panel A shows a western blot analysis of P K R and e I F 2 phosphorylation with varying levels of A l u single-stranded R N A following poly I:C rechallenge. The blot includes bands for P-P K R, P K R, P-e I F 2 alpha, e I F 2 alpha, and beta-Actin, with different concentrations of A l u s s R N A (0 micrograms, 0.1 micrograms, 1 microgram, 10 micrograms) and with or without poly I:C treatment, as indicated by plus and minus signs. Molecular weight markers (kilodaltons) are shown at 75 and 37. Total P K R and total e I F 2 alpha remain relatively constant, while phosphorylation levels are assessed across conditions. Panel B shows a western blot analysis of wildtype (W T) and D B R 1 knockout (K O) cells transfected with Alu double-stranded R N A. The blot includes bands for P-P K R, P K R, P-e I F 2 alpha, e I F 2 alpha, and beta-Actin, with and without A l u d s R N A transfection, as indicated by plus and minus signs. Molecular weight markers (kilodaltons) are shown at 75 and 37. Phosphorylation of P K R and e I F 2 alpha is compared between W T and D B R 1 K O cells. Panel C shows predicted R N A structures of inverted repeat A l u s from different introns, with numbers indicating the length of the longest continuous duplex regions along the structured segments. The structures are from U S P 8 intron 12, S N A I 2 intron 1, and A C 009784.3 intron 1. Base-paired stem regions and loop structures are depicted schematically along each R N A model.

PKR activation in response to single-stranded and double-stranded Alu RNAs and predicted structures of IR Alus from different introns. (A) High concentrations of single-stranded Alu RNA do not impair PKR activation. Western blot analysis of PKR and eIF2α phosphorylation with varying levels of Alu ssRNA following poly I:C rechallenge. Data are representative of three independent experiments. (B) Reduced PKR and eIF2α phosphorylation in DBR1 KO cells upon Alu dsRNA transfection. WT and DBR1 KO cells were transfected with Alu dsRNA. After 6 h, cell lysates were analyzed by western blot for phosphorylated PKR and eIF2α. Data are representative of three independent experiments. (C) Predicted RNA structures of IR Alus from different introns. Numbers indicate the length of the longest continuous duplex region.

Figure S4.
Western blot analysis of P K R and e I F 2 phosphorylation in response to A l u R N A s and predicted R N A structures of I R A l u s from different introns. The image contains three panels labeled A, B, and C. Panel A shows a western blot analysis of P K R and e I F 2 phosphorylation with varying levels of A l u single-stranded R N A following poly I:C rechallenge. The blot includes bands for P-P K R, P K R, P-e I F 2 alpha, e I F 2 alpha, and beta-Actin, with different concentrations of A l u s s R N A (0 micrograms, 0.1 micrograms, 1 microgram, 10 micrograms) and with or without poly I:C treatment, as indicated by plus and minus signs. Molecular weight markers (kilodaltons) are shown at 75 and 37. Total P K R and total e I F 2 alpha remain relatively constant, while phosphorylation levels are assessed across conditions. Panel B shows a western blot analysis of wildtype (W T) and D B R 1 knockout (K O) cells transfected with Alu double-stranded R N A. The blot includes bands for P-P K R, P K R, P-e I F 2 alpha, e I F 2 alpha, and beta-Actin, with and without A l u d s R N A transfection, as indicated by plus and minus signs. Molecular weight markers (kilodaltons) are shown at 75 and 37. Phosphorylation of P K R and e I F 2 alpha is compared between W T and D B R 1 K O cells. Panel C shows predicted R N A structures of inverted repeat A l u s from different introns, with numbers indicating the length of the longest continuous duplex regions along the structured segments. The structures are from U S P 8 intron 12, S N A I 2 intron 1, and A C 009784.3 intron 1. Base-paired stem regions and loop structures are depicted schematically along each R N A model.

PKR activation in response to single-stranded and double-stranded Alu RNAs and predicted structures of IR Alus from different introns. (A) High concentrations of single-stranded Alu RNA do not impair PKR activation. Western blot analysis of PKR and eIF2α phosphorylation with varying levels of Alu ssRNA following poly I:C rechallenge. Data are representative of three independent experiments. (B) Reduced PKR and eIF2α phosphorylation in DBR1 KO cells upon Alu dsRNA transfection. WT and DBR1 KO cells were transfected with Alu dsRNA. After 6 h, cell lysates were analyzed by western blot for phosphorylated PKR and eIF2α. Data are representative of three independent experiments. (C) Predicted RNA structures of IR Alus from different introns. Numbers indicate the length of the longest continuous duplex region.

Close modal
Figure 6.
Western blot analysis, box and scatter plots showing the impact of sequence variations in I R A l u on d s R N A stretches and P K R activation.The image contains three panels labeled A, B, and C. Panel A shows a western blot analysis on the left, depicting the phosphorylation levels of P K R and e I F 2 alpha induced by inverted repeat A l u s with varying sequence composition across lanes 1 through 6. Bands are shown for P-P K R, P K R, P-e I F 2 alpha, e I F 2 alpha, and beta-Actin, with molecular weight markers indicated at 75 and 37 kilodaltons. The right side of Panel A presents a table summarizing the number of double stranded R N A segments in the predicted minimum free energy structure capable of activating 17 base pair (O A S 1), 22 base pair (R I G-I), or 33 base pair (P K R) sensors. Categories listed include 1 no R N A, 2 A l u perfect d s R N A, 3 endogenous A l u d s R N A (mean and median values provided), 4 U S P 8 intron 12 inverted repeat A l u, 5 S N A I 2 intron 1 inverted repeat A l u, and 6 A C 009784.3 intron 1 inverted repeat A l u. Panel B consists of three box plots labeled 17 base pair (O A S 1), 22 base pair (R I G-I), and 33 base pair (P K R). The plots compare double stranded R N A sensor site distribution between introns and 3 prime untranslated regions. Statistical significance is indicated above the comparisons. Panel C features three scatter plots labeled 17 base pair (O A S 1), 22 base pair (R I G-I), and 33 base pair (P K R). These plots show cytoplasmic lariat double stranded R N A sensor sites normalized by total mapped reads (lariat reads per 10 cap 7 total reads) in wild type and D B R 1 knockout cell lines. Individual data points are shown, and statistical significance is indicated for specific comparisons. The data collectively demonstrate that sequence variation within inverted repeat Alus affects the number and length of double stranded R N A segments capable of activating innate immune sensors, influencing P K R activation potential.

Sequence variations in IR Alu decrease the length of dsRNA stretches and reduce PKR activation. (A) Left: Western blot analysis of PKR and eIF2α phosphorylation induced by single (or multiple) IR Alus with different degrees of sequence variation. Data are representative of three independent experiments. Right: Count of dsRNA segments in the predicted MFE structure capable of activating OAS1, RIGI-I, or PKR. (B) For IR Alu–containing introns and 3′ UTRs at most 5000 nt long, the predicted MFE structure was used to quantify the distribution of dsRNA lengths capable of activating OAS1, RIG-I, or PKR. P values were from t test. ****P < 0.0001. (C) Lariat reads were mapped from cytoplasmic RNA-seq samples taken from WT and DBR1 KO cell lines. Structure prediction was performed with RNAfold for each lariat, and the number of lariat-associated dsRNA sites was tallied and normalized by the total mapped reads. P values were from t test. *P < 0.05; **P < 0.01. Source data are available for this figure: SourceData F6.

Figure 6.
Western blot analysis, box and scatter plots showing the impact of sequence variations in I R A l u on d s R N A stretches and P K R activation.The image contains three panels labeled A, B, and C. Panel A shows a western blot analysis on the left, depicting the phosphorylation levels of P K R and e I F 2 alpha induced by inverted repeat A l u s with varying sequence composition across lanes 1 through 6. Bands are shown for P-P K R, P K R, P-e I F 2 alpha, e I F 2 alpha, and beta-Actin, with molecular weight markers indicated at 75 and 37 kilodaltons. The right side of Panel A presents a table summarizing the number of double stranded R N A segments in the predicted minimum free energy structure capable of activating 17 base pair (O A S 1), 22 base pair (R I G-I), or 33 base pair (P K R) sensors. Categories listed include 1 no R N A, 2 A l u perfect d s R N A, 3 endogenous A l u d s R N A (mean and median values provided), 4 U S P 8 intron 12 inverted repeat A l u, 5 S N A I 2 intron 1 inverted repeat A l u, and 6 A C 009784.3 intron 1 inverted repeat A l u. Panel B consists of three box plots labeled 17 base pair (O A S 1), 22 base pair (R I G-I), and 33 base pair (P K R). The plots compare double stranded R N A sensor site distribution between introns and 3 prime untranslated regions. Statistical significance is indicated above the comparisons. Panel C features three scatter plots labeled 17 base pair (O A S 1), 22 base pair (R I G-I), and 33 base pair (P K R). These plots show cytoplasmic lariat double stranded R N A sensor sites normalized by total mapped reads (lariat reads per 10 cap 7 total reads) in wild type and D B R 1 knockout cell lines. Individual data points are shown, and statistical significance is indicated for specific comparisons. The data collectively demonstrate that sequence variation within inverted repeat Alus affects the number and length of double stranded R N A segments capable of activating innate immune sensors, influencing P K R activation potential.

Sequence variations in IR Alu decrease the length of dsRNA stretches and reduce PKR activation. (A) Left: Western blot analysis of PKR and eIF2α phosphorylation induced by single (or multiple) IR Alus with different degrees of sequence variation. Data are representative of three independent experiments. Right: Count of dsRNA segments in the predicted MFE structure capable of activating OAS1, RIGI-I, or PKR. (B) For IR Alu–containing introns and 3′ UTRs at most 5000 nt long, the predicted MFE structure was used to quantify the distribution of dsRNA lengths capable of activating OAS1, RIG-I, or PKR. P values were from t test. ****P < 0.0001. (C) Lariat reads were mapped from cytoplasmic RNA-seq samples taken from WT and DBR1 KO cell lines. Structure prediction was performed with RNAfold for each lariat, and the number of lariat-associated dsRNA sites was tallied and normalized by the total mapped reads. P values were from t test. *P < 0.05; **P < 0.01. Source data are available for this figure: SourceData F6.

Close modal
+ Expand view − Collapse view
Figure S5
Figure S5. Refer to the image caption for details. The image contains two panels, A and B, each showing immunofluorescence staining of cells. Panel A displays staining for G 3 B P 1, while Panel B displays staining for G 3 B P 2. Each panel compares wild-type (W T) cells and D B R 1 knockout (K O) cells, both with and without poly I:C treatment, as indicated by minus and plus signs. The merged images show the combined staining of G 3 B P 1 or G 3 B P 2 (red), D B R 1 (green), and D A P I (blue) for nuclear staining. Individual channels for G 3 B P 1 or G 3 B P 2, D B R 1, and D A P I are also shown separately beneath the merge. In W T cells without poly I:C, G 3 B P 1 and G 3 B P 2 show mostly diffuse cytoplasmic staining. Upon poly I:C treatment, red puncta appear, indicating stress granule formation. In D B R 1 K O cells, G 3 B P 1 and G 3 B P 2 puncta are more prominent, particularly after poly I:C treatment, suggesting enhanced stress granule formation. D B R 1 staining is present in W T cells and reduced or absent in D B R 1 K O cells. D A P I staining marks nuclei in all conditions. A scale bar is shown in the bottom right corner of each panel.

Stress granule formation in WT and DBR1 KO cells. (A and B) IF staining of G3BP1 (A) and G3BP2 (B) in WT and DBR1 KO cells. Data are representative of at least three independent experiments. The scale bar represents 10 µm.

Figure S5.
Immunofluorescence staining of G 3 B P 1 and G 3 B P 2 in W T and D B R 1 K O cells with and without poly I:C shows merged and individual channels. The image contains two panels, A and B, each showing immunofluorescence staining of cells. Panel A displays staining for G 3 B P 1, while Panel B displays staining for G 3 B P 2. Each panel compares wild-type (W T) cells and D B R 1 knockout (K O) cells, both with and without poly I:C treatment, as indicated by minus and plus signs. The merged images show the combined staining of G 3 B P 1 or G 3 B P 2 (red), D B R 1 (green), and D A P I (blue) for nuclear staining. Individual channels for G 3 B P 1 or G 3 B P 2, D B R 1, and D A P I are also shown separately beneath the merge. In W T cells without poly I:C, G 3 B P 1 and G 3 B P 2 show mostly diffuse cytoplasmic staining. Upon poly I:C treatment, red puncta appear, indicating stress granule formation. In D B R 1 K O cells, G 3 B P 1 and G 3 B P 2 puncta are more prominent, particularly after poly I:C treatment, suggesting enhanced stress granule formation. D B R 1 staining is present in W T cells and reduced or absent in D B R 1 K O cells. D A P I staining marks nuclei in all conditions. A scale bar is shown in the bottom right corner of each panel.

Stress granule formation in WT and DBR1 KO cells. (A and B) IF staining of G3BP1 (A) and G3BP2 (B) in WT and DBR1 KO cells. Data are representative of at least three independent experiments. The scale bar represents 10 µm.

Close modal
Table 1.

Primer sequences used in this study

Primer namePrimer sequence (5′–3′)
FDXACB1 lariat F1 5′-CGT​CCC​AAA​GTG​GAA​AGG​GTG-3′ 
FDXACB1 lariat R1 5′-CGC​TGG​GCG​GGG​TTT​C-3′ 
FDXACB1 lariat F2 5′-GCG​TGG​GGA​TGT​AAC​CCA​CG-3′ 
FDXACB1 lariat R2 5′-AGA​GGG​GCG​GGC​TCG-3′ 
CCNF lariat F1 5′-GAC​CTC​AAC​TAC​TTG​GGA​TG-3′ 
CCNF lariat F2 5′-TCA​AGA​GCC​TCC​AGG​T-3′ 
CCNF lariat R1 5′-AGC​CAA​AGT​TTT​GTT​CTG​AC-3′ 
CCNF2 lariat R2 5′-CAC​AAG​GCC​TGA​TGG​TAT​AAT-3′ 
XIST F 5′-GTG​TTA​GTG​ATC​CAT​TCC​CTT​TGA-3′ 
XIST R 5′-CAG​GCA​TGT​TGA​TCT​TCA​GGT​G-3′ 

References

Ahmad
,
S.
,
X.
Mu
,
F.
Yang
,
E.
Greenwald
,
J.W.
Park
,
E.
Jacob
,
C.Z.
Zhang
, and
S.
Hur
.
2018
.
Breaching self-tolerance to Alu duplex RNA underlies MDA5-mediated inflammation
.
Cell
.
172
:
797
810.e713
.
Awan
,
A.R.
,
A.
Manfredo
, and
J.A.
Pleiss
.
2013
.
Lariat sequencing in a unicellular yeast identifies regulated alternative splicing of exons that are evolutionarily conserved with humans
.
P Natl. Acad. Sci. USA
.
110
:
12762
12767
.
Balachandran
,
S.
,
P.C.
Roberts
,
L.E.
Brown
,
H.
Truong
,
A.K.
Pattnaik
,
D.R.
Archer
, and
G.N.
Barber
.
2000
.
Essential role for the dsRNA-dependent protein kinase PKR in innate immunity to viral infection
.
Immunity
.
13
:
129
141
.
Barak
,
M.
,
H.T.
Porath
,
G.
Finkelstein
,
B.A.
Knisbacher
,
I.
Buchumenski
,
S.H.
Roth
,
E.Y.
Levanon
, and
E.
Eisenberg
.
2020
.
Purifying selection of long dsRNA is the first line of defense against false activation of innate immunity
.
Genome Biol.
21
:
26
.
Bhatt
,
D.M.
,
A.
Pandya-Jones
,
A.J.
Tong
,
I.
Barozzi
,
M.M.
Lissner
,
G.
Natoli
,
D.L.
Black
, and
S.T.
Smale
.
2012
.
Transcript dynamics of proinflammatory genes revealed by sequence analysis of subcellular RNA fractions
.
Cell
.
150
:
279
290
.
Bowling
,
E.A.
,
J.H.
Wang
,
F.
Gong
,
W.
Wu
,
N.J.
Neill
,
I.S.
Kim
,
S.
Tyagi
,
M.
Orellana
,
S.J.
Kurley
,
R.
Dominguez-Vidana
, et al
.
2021
.
Spliceosome-targeted therapies trigger an antiviral immune response in triple-negative breast cancer
.
Cell
.
184
:
384
403 e321
.
Brubaker
,
S.W.
,
K.S.
Bonham
,
I.
Zanoni
, and
J.C.
Kagan
.
2015
.
Innate immune pattern recognition: A cell biological perspective
.
Annu. Rev. Immunol.
33
:
257
290
.
Buerer
,
L.
,
N.E.
Clark
,
A.
Welch
,
C.R.
Duan
,
A.J.
Taggart
,
B.A.
Townley
,
J.
Wang
,
R.
Soemedi
,
S.P.
Rong
,
C.L.
Lin
, et al
.
2024
.
The debranching enzyme Dbr1 regulates lariat turnover and intron splicing
.
Nat. Commun.
15
:
4617
.
Calderon
,
B.M.
, and
G.L.
Conn
.
2018
.
A human cellular noncoding RNA activates the antiviral protein 2'-5'-oligoadenylate synthetase 1
.
J. Biol. Chem.
293
:
16115
16124
.
Chan
,
Y.H.
,
V.
Lundberg
,
J.
Le Pen
,
J.
Yuan
,
D.
Lee
,
F.
Pinci
,
S.
Volpi
,
K.
Nakajima
,
V.
Bondet
,
S.
Akesson
, et al
.
2024
.
SARS-CoV-2 brainstem encephalitis in human inherited DBR1 deficiency
.
J. Exp. Med.
221
. e20231725.
Chapman
,
K.B.
, and
J.D.
Boeke
.
1991
.
Isolation and characterization of the gene encoding yeast debranching enzyme
.
Cell
.
65
:
483
492
.
Chen
,
S.
2023
.
Ultrafast one-pass FASTQ data preprocessing, quality control, and deduplication using fastp
.
Imeta
.
2
:e107.
Chen
,
Y.G.
, and
S.
Hur
.
2022
.
Cellular origins of dsRNA, their recognition and consequences
.
Nat. Rev. Mol. Cell Bio
.
23
:
286
301
.
Chiappinelli
,
K.B.
,
P.L.
Strissel
,
A.
Desrichard
,
H.
Li
,
C.
Henke
,
B.
Akman
,
A.
Hein
,
N.S.
Rote
,
L.M.
Cope
,
A.
Snyder
, et al
.
2015
.
Inhibiting DNA methylation causes an interferon response in cancer via dsRNA including endogenous retroviruses
.
Cell
.
162
:
974
986
.
Chung
,
H.
,
J.J.A.
Calis
,
X.
Wu
,
T.
Sun
,
Y.
Yu
,
S.L.
Sarbanes
,
V.L.
Dao Thi
,
A.R.
Shilvock
,
H.H.
Hoffmann
,
B.R.
Rosenberg
, and
C.M.
Rice
.
2018
.
Human ADAR1 prevents endogenous RNA from triggering translational shutdown
.
Cell
.
172
:
811
824.e814
.
Cooper
,
D.A.
,
B.K.
Jha
,
R.H.
Silverman
,
J.R.
Hesselberth
, and
D.J.
Barton
.
2014
.
Ribonuclease L and metal-ion-independent endoribonuclease cleavage sites in host and viral RNAs
.
Nucleic Acids Res.
42
:
5202
5216
.
Danecek
,
P.
,
J.K.
Bonfield
,
J.
Liddle
,
J.
Marshall
,
V.
Ohan
,
M.O.
Pollard
,
A.
Whitwham
,
T.
Keane
,
S.A.
McCarthy
,
R.M.
Davies
, and
H.
Li
.
2021
.
Twelve years of SAMtools and BCFtools
.
Gigascience
.
10
:
giab008
.
Everett
,
R.D.
1984
.
Trans activation of transcription by herpes virus products: Requirement for two HSV-1 immediate-early polypeptides for maximum activity
.
EMBO J.
3
:
3135
3141
.
Findlay
,
G.M.
,
E.A.
Boyle
,
R.J.
Hause
,
J.C.
Klein
, and
J.
Shendure
.
2014
.
Saturation editing of genomic regions by multiplex homology-directed repair
.
Nature
.
513
:
120
123
.
Galabru
,
J.
, and
A.
Hovanessian
.
1987
.
Autophosphorylation of the protein-kinase dependent on double-stranded-Rna
.
J. Biol. Chem.
262
:
15538
15544
..
Galvis
,
A.E.
,
H.E.
Fisher
,
T.
Nitta
,
H.
Fan
, and
D.
Camerini
.
2014
.
Impairment of HIV-1 cDNA synthesis by DBR1 knockdown
.
J. Virol.
88
:
7054
7069
.
García
,
M.A.
,
J.
Gil
,
I.
Ventoso
,
S.
Guerra
,
E.
Domingo
,
C.
Rivas
, and
M.
Esteban
.
2006
.
Impact of protein kinase PKR in cell biology: From antiviral to antiproliferative action
.
Microbiol. Mol. Biol. Rev.
70
:
1032
1060
.
Gelman
,
I.H.
, and
S.
Silverstein
.
1985
.
Identification of immediate early genes from herpes-simplex virus that transactivate the virus thymidine kinase gene
.
Proc. Natl. Acad. Sci. USA
.
82
:
5265
5269
.
Han
,
B.
,
H.
Kpark
,
T.
Ching
,
J.
Panneerselvam
,
H.
Wang
,
Y.
Shen
,
J.
Zhang
,
L.
Li
,
R.
Che
,
L.
Garmire
, and
P.
Fei
.
2017
.
Human DBR1 modulates the recycling of snRNPs to affect alternative RNA splicing and contributes to the suppression of cancer development
.
Oncogene
.
36
:
5382
5391
.
Hatcher
,
E.L.
,
S.A.
Zhdanov
,
Y.M.
Bao
,
O.
Blinkova
,
E.P.
Nawrocki
,
Y.
Ostapchuck
,
A.A.
Schäffer
, and
J.R.
Brister
.
2017
.
Virus Variation Resource - improved response to emergent viral outbreaks
.
Nucleic Acids Res.
45
:
D482
D490
.
Heinicke
,
L.A.
,
S.R.
Nallagatla
,
C.M.
Hull
, and
P.C.
Bevilacqua
.
2011
.
RNA helical imperfections regulate activation of the protein kinase PKR: Effects of bulge position, size, and geometry
.
RNA
.
17
:
957
966
.
Hur
,
S.
2019
.
Double-Stranded RNA sensors and modulators in innate immunity
.
Annu. Rev. Immunol.
37
:
349
375
.
Ibberson
,
D.
,
V.
Benes
,
M.U.
Muckenthaler
, and
M.
Castoldi
.
2009
.
RNA degradation compromises the reliability of microRNA expression profiling
.
BMC Biotechnol.
9
:
102
.
Karolchik
,
D.
,
A.S.
Hinrichs
,
T.S.
Furey
,
K.M.
Roskin
,
C.W.
Sugnet
,
D.
Haussler
, and
W.J.
Kent
.
2004
.
The UCSC Table Browser data retrieval tool
.
Nucleic Acids Res.
32
:
D493
D496
.
Katze
,
M.G.
,
M.
Wambach
,
M.L.
Wong
,
M.
Garfinkel
,
E.
Meurs
,
K.
Chong
,
B.R.G.
Williams
,
A.G.
Hovanessian
, and
G.N.
Barber
.
1991
.
Functional expression and RNA-binding analysis of the interferon-induced, double-stranded RNA-activated, 68,000-Mr protein kinase in a cell-free system
.
Mol. Cell Biol.
11
:
5497
5505
.
Khabar
,
K.S.
,
M.
Dhalla
,
Y.
Siddiqui
,
A.
Zhou
,
M.N.
Al-Ahdal
,
S.D.
Der
,
R.H.
Silverman
, and
B.R.
Williams
.
2000
.
Effect of deficiency of the double-stranded RNA-dependent protein kinase, PKR, on antiviral resistance in the presence or absence of ribonuclease L: HSV-1 replication is particularly sensitive to deficiency of the major IFN-mediated enzymes
.
J. Interferon Cytokine Res.
20
:
653
659
.
Kim
,
D.
,
J.M.
Paggi
,
C.
Park
,
C.
Bennett
, and
S.L.
Salzberg
.
2019
.
Graph-based genome alignment and genotyping with HISAT2 and HISAT-genotype
.
Nat. Biotechnol.
37
:
907
915
.
Kim
,
Y.
,
J.H.
Lee
,
J.E.
Park
,
J.
Cho
,
H.
Yi
, and
V.N.
Kim
.
2014
.
PKR is activated by cellular dsRNAs during mitosis and acts as a mitotic regulator
.
Gene Dev.
28
:
1310
1322
.
Kim
,
Y.
,
J.
Park
,
S.
Kim
,
M.
Kim
,
M.G.
Kang
,
C.
Kwak
,
M.
Kang
,
B.
Kim
,
H.W.
Rhee
, and
V.N.
Kim
.
2018
.
PKR senses nuclear and mitochondrial signals by interacting with endogenous double-stranded RNAs
.
Mol. Cell
.
71
:
1051
1063.e1056
.
Lemaire
,
P.A.
,
E.
Anderson
,
J.
Lary
, and
J.L.
Cole
.
2008
.
Mechanism of PKR activation by dsRNA
.
J. Mol. Biol.
381
:
351
360
.
Liddicoat
,
B.J.
,
R.
Piskol
,
A.M.
Chalk
,
G.
Ramaswami
,
M.
Higuchi
,
J.C.
Hartner
,
J.B.
Li
,
P.H.
Seeburg
, and
C.R.
Walkley
.
2015
.
RNA editing by ADAR1 prevents MDA5 sensing of endogenous dsRNA as nonself
.
Science
.
349
:
1115
1120
.
Lorenz
,
R.
,
S.H.
Bernhart
,
C.
Honer Zu Siederdissen
,
H.
Tafer
,
C.
Flamm
,
P.F.
Stadler
, and
I.L.
Hofacker
.
2011
.
ViennaRNA package 2.0
.
Algorithms Mol. Biol.
6
:
26
.
Mehdipour
,
P.
,
S.A.
Marhon
,
I.
Ettayebi
,
A.
Chakravarthy
,
A.
Hosseini
,
Y.
Wang
,
F.A.
de Castro
,
H.
Loo Yau
,
C.
Ishak
,
S.
Abelson
, et al
.
2020
.
Epigenetic therapy induces transcription of inverted SINEs and ADAR1 dependency
.
Nature
.
588
:
169
173
.
Mercer
,
T.R.
,
M.B.
Clark
,
S.B.
Andersen
,
M.E.
Brunck
,
W.
Haerty
,
J.
Crawford
,
R.J.
Taft
,
L.K.
Nielsen
,
M.E.
Dinger
, and
J.S.
Mattick
.
2015
.
Genome-wide discovery of human splicing branchpoints
.
Genome Res.
25
:
290
303
.
Montemayor
,
E.J.
,
A.
Katolik
,
N.E.
Clark
,
A.B.
Taylor
,
J.P.
Schuermann
,
D.J.
Combs
,
R.
Johnsson
,
S.P.
Holloway
,
S.W.
Stevens
,
M.J.
Damha
, and
P.J.
Hart
.
2014
.
Structural basis of lariat RNA recognition by the intron debranching enzyme Dbr1
.
Nucleic Acids Res.
42
:
10845
10855
.
Padgett
,
R.A.
,
M.M.
Konarska
,
P.J.
Grabowski
,
S.F.
Hardy
, and
P.A.
Sharp
.
1984
.
Lariat RNA's as intermediates and products in the splicing of messenger RNA precursors
.
Science
.
225
:
898
903
.
Pineda
,
J.M.B.
, and
R.K.
Bradley
.
2018
.
Most human introns are recognized via multiple and tissue-specific branchpoints
.
Gene Dev.
32
:
577
591
.
Quinlan
,
A.R.
, and
I.M.
Hall
.
2010
.
BEDTools: A flexible suite of utilities for comparing genomic features
.
Bioinformatics
.
26
:
841
842
.
Robinson
,
J.A.
, and
K.
Moehle
.
2014
.
Structural aspects of molecular recognition in the immune system. Part II: Pattern recognition receptors
.
Pure Appl. Chem.
86
:
1483
1538
.
Ru
,
S.
,
S.
Tang
,
H.
Xu
,
J.
Yin
,
Y.
Guo
,
L.
Song
,
Z.
Jin
,
D.
Lee
,
Y.H.
Chan
,
X.
Chen
, et al
.
2025
.
Human DBR1 deficiency impairs stress granule-dependent PKR antiviral immunity
.
J. Exp. Med.
222
. e20240010.
Ruskin
,
B.
, and
M.R.
Green
.
1985
.
An RNA processing activity that debranches RNA lariats
.
Science
.
229
:
135
140
.
Ruskin
,
B.
,
A.R.
Krainer
,
T.
Maniatis
, and
M.R.
Green
.
1984
.
Excision of an intact intron as a novel lariat structure during pre-mRNA splicing in vitro
.
Cell
.
38
:
317
331
.
Schlee
,
M.
, and
G.
Hartmann
.
2016
.
Discriminating self from non-self in nucleic acid sensing
.
Nat. Rev. Immunol.
16
:
566
580
.
Shamseldin
,
H.E.
,
M.
Sadagopan
,
J.
Martini
,
R.
Al-Ali
,
M.
Radefeldt
,
M.
Ataei
,
S.
Lemke
,
Z.
Rahbeeni
,
F.
Al Mutairi
,
F.
Ababneh
, et al
.
2023
.
A founder DBR1 variant causes a lethal form of congenital ichthyosis
.
Hum. Genet.
142
:
1491
1498
.
Taggart
,
A.J.
,
A.M.
DeSimone
,
J.S.
Shih
,
M.E.
Filloux
, and
W.G.
Fairbrother
.
2012
.
Large-scale mapping of branchpoints in human pre-mRNA transcripts in vivo
.
Nat. Struct. Mol. Biol.
19
:
719
721
.
Taggart
,
A.J.
, and
W.G.
Fairbrother
.
2018
.
ShapeShifter: A novel approach for identifying and quantifying stable lariat intronic species in RNAseq data
.
Quant Biol.
6
:
267
274
.
Vachon
,
V.K.
,
B.M.
Calderon
, and
G.L.
Conn
.
2015
.
A novel RNA molecular signature for activation of 2'-5' oligoadenylate synthetase-1
.
Nucleic Acids Res.
43
:
544
552
.
Valeri
,
E.
, and
A.
Kajaste-Rudnitski
.
2025
.
Antiviral immunity lassoed down by excess RNA
.
J. Exp. Med.
222
:e20241743.
Wahl
,
M.C.
,
C.L.
Will
, and
R.
Luhrmann
.
2009
.
The spliceosome: Design principles of a dynamic RNP machine
.
Cell
.
136
:
701
718
.
Wilkinson
,
M.E.
,
C.
Charenton
, and
K.
Nagai
.
2020
.
RNA splicing by the spliceosome
.
Annu. Rev. Biochem.
89
:
359
388
.
Williams
,
B.R.
,
C.S.
Gilbert
, and
I.M.
Kerr
.
1979
.
The respective roles of the protein kinase and pppA2' p5' A2' p5 A-activated endonuclease in the inhibition of protein synthesis by double stranded RNA in rabbit reticulocyte lysates
.
Nucleic Acids Res.
6
:
1335
1350
.
Wu
,
Y.
,
W.
Zhao
,
Y.
Liu
,
X.
Tan
,
X.
Li
,
Q.
Zou
,
Z.
Xiao
,
H.
Xu
,
Y.
Wang
, and
X.
Yang
.
2018
.
Function of HNRNPC in breast cancer cells by controlling the dsRNA-induced interferon response
.
EMBO J.
37
:e99017.
Xu
,
X.Q.
,
X.
Yang
,
X.
Liu
,
Y.H.
Bi
,
P.Z.
Kong
,
Y.Q.
Wang
,
X.L.
Cheng
, and
Y.F.
Xi
.
2022
.
The Role of DBR1 as a candidate prognosis biomarker in esophageal squamous cell carcinoma
.
Technol. Cancer Res. T.
21
:
15330338221083105
.
Ye
,
Y.
,
J.
De Leon
,
N.
Yokoyama
,
Y.
Naidu
, and
D.
Camerini
.
2005
.
DBR1 siRNA inhibition of HIV-1 replication
.
Retrovirology
.
2
:
63
.
Zeng
,
Y.
,
B.J.
Fair
,
H.
Zeng
,
A.
Krishnamohan
,
Y.
Hou
,
J.M.
Hall
,
A.J.
Ruthenburg
,
Y.I.
Li
, and
J.P.
Staley
.
2022
.
Profiling lariat intermediates reveals genetic determinants of early and late co-transcriptional splicing
.
Mol. Cell
.
82
:
4681
4699.e4688
.
Zhang
,
S.Y.
,
N.E.
Clark
,
C.A.
Freije
,
E.
Pauwels
,
A.J.
Taggart
,
S.
Okada
,
H.
Mandel
,
P.
Garcia
,
M.J.
Ciancanelli
,
A.
Biran
, et al
.
2018
.
Inborn errors of RNA lariat metabolism in humans with brainstem viral infection
.
Cell
.
172
:
952
965.e918
.
Zheng
,
R.
,
M.
Dunlap
,
G.O.M.
Bobkov
,
C.
Gonzalez-Figueroa
,
K.J.
Patel
,
J.
Lyu
,
S.E.
Harvey
,
T.W.
Chan
,
G.
Quinones-Valdez
,
M.
Choudhury
, et al
.
2024
.
hnRNPM protects against the dsRNA-mediated interferon response by repressing LINE-associated cryptic splicing
.
Mol. Cell
.
84
:
2087
2103.e2088
.
Zheng
,
S.
,
B.Q.
Vuong
,
B.
Vaidyanathan
,
J.Y.
Lin
,
F.T.
Huang
, and
J.
Chaudhuri
.
2015
.
Non-coding RNA generated following lariat debranching mediates targeting of AID to DNA
.
Cell
.
161
:
762
773
.
Zheng
,
X.
, and
P.C.
Bevilacqua
.
2004
.
Activation of the protein kinase PKR by short double-stranded RNAs with single-stranded tails
.
RNA
.
10
:
1934
1945
.
Zhou
,
A.
,
J.
Paranjape
,
T.L.
Brown
,
H.
Nie
,
S.
Naik
,
B.
Dong
,
A.
Chang
,
B.
Trapp
,
R.
Fairchild
,
C.
Colmenares
, and
R.H.
Silverman
.
1997
.
Interferon action and apoptosis are defective in mice devoid of 2',5'-oligoadenylate-dependent RNase L
.
EMBO J.
16
:
6355
6363
.

or Create an Account

Close Modal
Close Modal