


Using optical and electrical methods, we document that diffusion in the cytoplasm of BL6 murine cardiomyocytes becomes restricted >20-fold as molecular weight increases from 30 to 2,000, roughly as expected for pores with porin channel dimensions. Bodipy-FL ATP diffuses >40-fold slower than in free water at 25°C. From several fluorophores analyzed, bound fluorophore fractions range from 0.1 for a 2 kD FITC-labeled polyethylene glycol to 0.93 for sulforhodamine. Unbound fluorophores diffuse at 0.5–8 × 10⁻⁷ cm2/s (5–80 μm2/s). Analysis of Na/K pump and veratridine-modified Na channel currents suggests that Na diffusion is nearly unrestricted at 35°C (time constant for equilibration with the pipette tip, ∼20 s). Using multiple strategies, we estimate that at 35°C, ATP diffuses four to eight times slower than in free water. To address whether restrictions are caused more by protein or membrane networks, we verified first that a protein gel, 10 g% gelatin, restricts diffusion with strong dependence on molecular weight. Solute diffusion in membrane-extracted cardiac myofilaments, confined laterally by suction into large-diameter pipette tips, is less restricted than in intact myocytes. Notably, myofilaments extracted similarly from skeletal (diaphragm) myocytes are less restrictive. Solute diffusion in myocytes with sarcolemma permeabilized by β-escin (80 µM) is similar to diffusion in intact myocytes. Restrictions are strain-dependent, being twofold greater in BL6 myocytes than in CD1/J6/129svJ myocytes. Furthermore, longitudinal diffusion is 2.5-fold more restricted in CD1/J6/129svJ myocytes lacking the mitochondrial porin, VDAC1, than in WT CD1/J6/129svJ myocytes. Thus, mitochondria networks restrict long-range diffusion while presumably optimizing nucleotide transfer between myofilaments and mitochondria. We project that diffusion restrictions imposed by both myofilaments and the outer mitochondrial membrane are important determinants of total free cytoplasmic AMP and ADP (∼10 μM). However, the capacity of diffusion to deliver ATP to myofilaments remains ∼100-fold greater than ATP consumption.
Introduction
The evolution of cellular life was shaped profoundly by the physical properties of diffusion in aqueous solutions (Gallet et al., 2017). Diffusion limits the dimensions of cells and determines how cells can be organized into viable three-dimensional tissues. How in detail diffusion becomes modified by protein and membrane networks within cells has been a subject of much research, which extends to the analysis of both natural and unnatural polymer gels (Masaro and Zhu, 1999; Wheatley, 2003; Sanabria et al., 2007; Majer and Southan, 2017; Majer, 2017). Already, in 1930, it was described that organic solutes encounter diffusion barriers in fine-grained gelatin with size exclusion behavior expected for 1–2 nm pores (Friedman and Kraemer, 1930). Only recently it was discovered that the extracellular matrix of cardiac T-tubules entirely excludes molecules with molecular weights (MWs) of 5 kD or greater (Barthé et al., 2022,Preprint). One of the more influential studies of cytoplasmic diffusion appeared in 1969 (Kushmerick and Podolsky, 1969). Analyzing diffusion in intact skeletal muscle, this study laid to rest many speculative hypotheses about diffusion in cells. As expected from the fact that Ca is heavily buffered by Ca-binding proteins, Ca diffusivity is reduced 50-fold in muscle versus free water. In contrast, monovalent ions and ATP diffuse only about twofold less well than in free water. As outlined subsequently, these simple conclusions have been supported for skeletal muscle by experiments employing very different methods. Nevertheless, other studies highlighted subsequently suggest that solute diffusion is more restricted in cardiac myocytes and requires further attention.
Diffusion of sodium ions in cardiac myocytes has generated controversy for decades. Specifically, it was proposed that cytoplasmic Na diffusion is restricted in subsarcolemmal spaces to the extent that large changes in the subsarcolemmal Na concentration occur during Na transport (Carmeliet, 1992; Verdonck et al., 2004). Although this hypothesis is now questioned (Swietach et al., 2015; Garcia et al., 2016; Lu and Hilgemann, 2017), cardiac Na channels (NaVs) and Na/K pumps are still proposed to generate local Na gradients that require many seconds, even minutes, to dissipate (Skogestad et al., 2019). Therefore, we re-examined this issue and again failed to verify that subsarcolemmal Na diffusion is restricted.
The diffusion of ATP has naturally received much attention, given its central roles in energy metabolism (Saks et al., 1994; Jepihhina et al., 2011) and cell signaling (Jones, 1986; Weiss and Lamp, 1987, 1989). Von Wilhelm Hasselbach reported in 1952 that the diffusion coefficient of ATP in skeletal muscle was ∼3 × 10⁻⁸ cm2/s (i.e., 3 μm2/s; Hasselbach, 1952), 100 times smaller than when measured later in free water (∼5 × 10⁻⁶ cm2/s; Bowen and Martin, 1964). The coefficient given by Hasselbach was later questioned and corrected for glycerol-treated muscle to 2 × 10⁻⁶ cm2/s, or about one-half of the free diffusion of ATP in water (Bowen and Martin, 1963). This value was essentially the same as found later for intact skeletal muscle (Kushmerick and Podolsky, 1969). Baylor and Hollingworth used a coefficient of 1.4 × 10⁻⁶ cm2/s in their 1998 model describing how Ca buffering by ATP facilitates cytoplasmic Ca diffusion in skeletal muscle (Baylor and Hollingworth, 1998). The diffusion coefficient of a non-hydrolyzable ATP analog in a muscle extract was found to be somewhat smaller, namely 10−6 cm2/s (Sidell and Hazel, 1987). Importantly, 31P NMR studies support a rather free diffusion of ATP in skeletal muscle (Hubley et al., 1995; de Graaf et al., 2000). The latter study (de Graaf et al., 2000) employed fibers with low mitochondrial content and showed that “instantaneous” ATP diffusion occurs with no restriction at all, while diffusion over long distances becomes restricted by ∼60%, with apparent boundaries occurring with 15–22 µm separations. For human calf muscle, a coefficient of 1.5 × 10⁻⁶ cm2/s was recently reported using 31P metabolites (Huang et al., 2023). Relevant to these results, a molecular model of diffusion within myofilaments with lattice spacings of 16.5 or 18.3 nm predicted that ATP diffusibility would be decreased by 40% with respect to diffusion in free water (Kekenes-Huskey et al., 2013).
While this consistent body of work supports a nearly free diffusion of ATP in skeletal muscle, the existence of cytoplasmic free ATP gradients is supported by multiple experimental approaches using diverse cell types. Functionally, important cytoplasmic ATP gradients were defined in hepatocytes by analyzing ATP-hydrolyzing enzymes with different cellular locations (Aw and Jones, 1985). ATP gradients were defined in frog oocytes by “cryomicrodissection” studies (Miller and Horowitz, 1986). Relevant to membrane transport, both biochemical and optical studies supported the idea that membrane cytoskeleton can harbor “pools” of ATP that are used preferentially by ion pumps while being “functionally distinct” from bulk cytoplasmic ATP (Chu et al., 2012). In short, protein networks, as well as membrane networks, are proposed to restrict diffusion of nucleotides and other solutes to a physiologically important extent.
Diverse studies suggest that organic solutes may be more restricted in cardiac myocytes than in other cells, including skeletal muscle. Within skeletal muscle fibers, free (unbound) Fura-2 has a diffusion coefficient of 5.2 × 10⁻⁷ cm2/s (Pape et al., 1993), 8.6 times smaller than its diffusion in free water (Timmerman and Ashley, 1986). The absorbance dye arsenazo III has a free diffusion coefficient of 8 × 10⁻⁷ cm2/s in skeletal muscle with about 90% of the dye being bound (Maylie et al., 1987c). This is only about five times smaller than expected for free arsenazo diffusion in water, and parvalbumin (∼10 kD) is reported to diffuse only about threefold slower in frog skeletal muscle than in free water (Maughan and Godt, 1999).
Turning to cardiac myocytes, the diffusion coefficient of a fluorescent ATP analog in rat cardiac myocytes is approximately eight times less than in free solution (Illaste et al., 2012). This result was interpreted in terms of lattice-like diffusion obstructions with barriers occurring at ∼1 μm distances and barrier pores making up only 0.3% of barrier surfaces. Barriers were suggested to be mostly membranous in nature, with mitochondria, T-tubules, and sarcoplasmic reticulum potentially all taking part. Using sarcolemma-permeabilized cardiac myocytes, this group also showed that cytoplasmic ADP diffusion is restricted 6–10-fold (Simson et al., 2016). To better understand fluorescent Ca dyes in cardiac myocytes, a photobleach method was used to determine the diffusion coefficients for Fura-2 and Indo-1. The coefficients were 1.6 and 3.2 × 10⁻⁷ cm2/s, respectively, in guinea pig cardiac myocytes (Blatter and Wier, 1990). The authors concluded that fluorophores diffuse three- to sixfold slower than expected for “free diffusion in myoplasm” (i.e., as described above for skeletal muscle). Impressively, but not stated explicitly, diffusion coefficients of these dyes in cardiac myoplasm are in fact 15–30 times smaller than for their diffusion in water (4.7 × 10⁻⁶ cm2/s; Timmerman and Ashley, 1986).
Diffusion of all solutes larger than ions has been suggested to be about 10-fold restricted in cardiac myocytes as a result of “cytoplasmic tortuosity” (Richards et al., 2016). Specifically, diffusion coefficients of multiple fluorophores were found to be about 4 × 10⁻⁷ cm2/s, and it was proposed that intracellular membranes, in particular mitochondrial membranes, would account for diffusion restrictions. Notably, this same group found with similar optical methods that Na diffusion was nearly unrestricted (Swietach et al., 2015). Why monovalent ions would experience much less tortuosity than small organic solutes was not explained. Similar to fluorescent ATP analogs, fluorescent cAMP analogs are described to diffuse 50 times more slowly in the cytoplasm of cardiac myocytes than in free water (Sidell and Hazel, 1987). By contrast, cAMP itself has been shown to diffuse in an unrestricted manner in olfactory cilia (Chen et al., 1999), possibly indicting that cAMP diffusion is different in different cell types. Together, these results suggest, as verified by our experimental results, that diffusibility likely falls off steeply with increasing MW in the cardiac cytoplasm.
Regarding cAMP, it has been known for decades that cyclic nucleotide gradients exist in the cytoplasm of many cells (Hayes and Brunton, 1982; Jurevicius and Fischmeister, 1996; Xin et al., 2015; Agarwal et al., 2016; Bock et al., 2020) and their physical basis has been the subject of much debate (Xin et al., 2015; Agarwal et al., 2016). Attention recently has focused on the hydrolysis of cyclic nucleotides by phosphodiesterases (PDEs; Bender and Beavo, 2006). Using a cell-permeable, fluorogenic cAMP analog with a FRET biosensor (Bock et al., 2020), it was recently shown that single PDEs can generate nanoscale cAMP depletion zones, thereby preventing cAMP binding by neighboring cAMP receptors. With progressive activation of adenylate cyclases, PDEs evidently become overwhelmed, resulting in global rises of cAMP. Of course, the ability of PDEs to deplete cAMP would be supported by any cytoplasmic factors that may limit cAMP diffusion in the vicinity of PDEs (Xin et al., 2015).
With this background, we carried out new experiments to characterize diffusion of commonly employed fluorophores in murine cardiac myocytes, we devised protocols to indirectly characterize diffusion of native solutes in myocytes, and we devised experiments to compare diffusion of anions of different MWs in membrane-extracted and sarcolemma-permeabilized cardiac myocytes. We provide evidence that myofilaments themselves can restrict diffusion, but we also show that the outer mitochondrial membrane importantly restricts diffusion in cardiac myocytes. We show that diffusion restrictions depend on the strain of mice from which myocytes are isolated and that knockout of the mitochondrial porin channel, VDAC1, decreases apparent diffusion coefficients of ATP and fluorophores by more than twofold. We suggest that diffusion restrictions imposed by both myofilaments and mitochondria promote long-range solute diffusion to occur through intermembrane mitochondrial spaces. While not limiting ATP supply to myofilaments of cardiac myocytes, both diffusion restrictions and the permeability of porins are likely to be important determinants of cytoplasmic AMP and ADP concentrations, and thereby cardiac nucleotide signaling.
Materials and methods
Murine cardiac myocytes and patch clamp
The UT Southwestern Medical Center Animal Care and Use Committee approved all animal studies.
Cardiac myocytes were isolated from adult (2.5–4 mo old) mice of either sex and patch clamped as described previously (Lu et al., 2016). Diaphragm myocytes were isolated by gently agitating excised pieces of murine diaphragm muscle for 30 min in the same solutions employed for cardiac myocyte isolation. Axopatch 1C patch clamp amplifiers were employed using our own software for capacitance and conductance recording by either sinusoidal or square-wave voltage perturbation (Wang and Hilgemann, 2008). Unless stated otherwise, solutions had the same compositions as employed previously (Lu et al., 2016; Lu and Hilgemann, 2017). As indicated, N-methyl-D-glucamine (NMG) was used as the substitute for extracellular Na. All patch clamp experiments were performed at 0 mV. Experiments related to Na and ATP diffusion (Figs. 8, 9, and 10) were performed at 34°C. Pump currents are activated by exchanging 7 mM extracellular Na for 7 mM extracellular K. The presence of 7 mM Na in the K-free solution is required to suppress pump activation by contaminating K in routinely available chemicals (Lu et al., 2016).
Extracellular solution changes were performed by abruptly moving the microscope stage so as to place the myocyte directly in front of one of four square pipettes (1 mm) with solution steams maintained by gravity-driven flow at velocities of 2–5 cm/s. The rapidity of solution changes was quantified from the deactivation of Na/K pump currents upon removing extracellular K. The moment when myocytes crossed the interface between two solutions was detectable as a small current instability, and the subsequent time required for pump current to decay by >50% amounted to 201 ± 8 ms. Since the half-maximal K concentration is <0.3 mM, this corresponds to approximately four half-times of solution exchange. For optical experiments, we patch-clamped myocytes close to one myocyte end so that the diffusion path constituted most of the length of the myocytes.
In all experiments in which two or more protocols were compared, performing multiple experiments with a single batch of myocytes, the protocols were performed in a randomized fashion. Experiments in which myocytes were compared between two strains were performed, when possible, in a blinded fashion with unblinding only after completion of data analysis.
Materials
Unless stated otherwise, chemicals were from Sigma-Aldrich and were the highest grade available. Unbranched FITC-labeled polyethylene glycols (PEGs) were purchased from Creative PEGWorks (27516). Carboxyfluorescein and sulforhodamine were from Sigma-Aldrich. Other fluorophores were from Invitrogen. Luciferase was from Creative Biomart. Purified GFP was a generous gift from Michael Rosen (UT Southwestern, Dallas, TX, USA).
Transgenic mice
Knockout of VDAC1 has partial embryonic lethality in the BL6 mouse strain (Weeber et al., 2002). Therefore, VDAC1 knockout (KO) mice were bred in a CD1/J6/129svJ strain (Anflous et al., 2001; Kim et al., 2019). The wild-type (WT) and KO mice were generated via heterozygote breeding. The resulting WT and KO littermate mice were bred for two generations (WT × WT and KO × KO) to obtain the mice used in the present experiments. All mice were 2.5–3.5 mo old. Equal numbers of male and female mice were employed in experiments with no significant differences in results.
Fluorescence imaging
Imaging at near confocal resolution was carried out with an Aurox Clarity laser-free microscopy system (Fafchamps, 2013), employing a Nikon Eclipse TE 2000-S inverted microscope with an APO LWD 40 × 1.15 NA water immersion lens. The 50% point spread was 0.7 and 1.6 μm in the lateral and vertical directions, respectively, as determined with a TetraSpeck Fluorescent Microspheres Size Kit (Invitrogen). This compares to 0.6 and 2.9 μm for a 40 × 0.95 NA air lens employed on a standard spinning disc microscope (Nikon CSU-W1 spinning disc with Hamamatsu Orca Fusion camera, Nikon CSU-W1 SoRa: Quantitative Light Microscopy Core Facility, UT Southwestern). Equivalent images obtained from the same slide (FluoCells prepared slide #3; Invitrogen) with these two imaging systems are provided in Fig. S1. All solutions were filtered with 0.22 μm syringe filters to remove aggregates. Nevertheless, small condensates sometimes formed in the tip of patch pipettes during long-term (30–60 min) recordings. Their formation had no discernable effects on the experimental results, except to generate an artifactual fluorescence peak in the tip, as illustrated in Fig. 6. The times given in the figures are times after myocyte opening by suction. Most optical experiments were performed at 25°C. To minimize photobleaching, Z-stacks of images were taken at 30–60-s intervals with exposure times as short as possible for accurate analysis, usually 0.2 s.

Two i mages of a membrane-stained nephron (Invitrogen, FluoCells prepared slide #3). (A) Image taken on the microscope employed in all diffusion experiments described in this article: Nikon Eclipse TE2000 microscope equipped with Aurox Clarity and a LWD 40× 1.15 NA water immersion lens. (B) Image taken of the same slide with a Nikon CSU-W1 spinning disc confocal microscope equiped with a 40× 1.3 NA air lens and employing a Hamamatsu Orca Fusion camera. Confocality achieved with the Aurox Clarity system is at minimum comparable to the Nikon spinning disc system.
Two i mages of a membrane-stained nephron (Invitrogen, FluoCells prepared slide #3). (A) Image taken on the microscope employed in all diffusion experiments described in this article: Nikon Eclipse TE2000 microscope equipped with Aurox Clarity and a LWD 40× 1.15 NA water immersion lens. (B) Image taken of the same slide with a Nikon CSU-W1 spinning disc confocal microscope equiped with a 40× 1.3 NA air lens and employing a Hamamatsu Orca Fusion camera. Confocality achieved with the Aurox Clarity system is at minimum comparable to the Nikon spinning disc system.
Experimental models employed
Fig. 1 illustrates the different models employed to characterize diffusion. Standard myocyte patch clamp was employed as shown in Fig. 1 A. Murine cardiac myocytes were patch-clamped close to one end so as to force diffusion to occur through the entire length of the myocyte (∼120 µm). Diffusion in sarcolemma-permeabilized myocytes was evaluated by aspirating myocytes into highly polished, large-diameter patch pipette tips, as shown in Fig. 1 B. To do so, pipette tips were cut and melted to generate bullet-shaped tips with thick (>5 μm) terminal walls and openings of 6–12 μm (Hilgemann and Lu, 1998). Myocytes with a receding appendage were selected so that upon rapid aspiration myocytes briskly entered the tip with formation of a mechanically stable whole-cell seal of minimally 20 MΩ. Thereafter, the sarcolemma was permeabilized with the saponin, β-escin (80 μM; Konishi and Watanabe, 1995). As illustrated Fig. 1 B, we estimate that the restricted diffusion path amounts to about 20 μm. Further details are provided in Results. Diffusion restrictions conferred by myofilaments themselves were evaluated in similar experiments using myocytes that were extracted for 2–10 d in solutions consisting of 50% glycerol with 1 mM Triton X-100, 1 mM EGTA, and 2 mM MgATP at 4°C. Diffusion through gels and viscous solutions of macromolecules (Figs. S6 and S10) was monitored electrophysiologically as illustrated in Fig. 1, C and D. Gelatins or polymer mixtures were aspirated into the tips of pipettes, and gelatins were allowed to set until firm without changing solutions. Fig. 1 D illustrates the large pipette tips usually employed with gelatins. Briefly, 1 mm diameter borosilicate pipettes were melted on a glass flame to generate nearly linear vestibules over lengths of 0.25–0.5 mm with diameters of 30–60 μm (see Fig. S6). Diffusion of fluorophores over multiple hours and days was monitored in borosilicate glass capillaries with inner diameters of 1 mm and lengths of 8 cm, as illustrated in Fig. 1 E. To do so, the pipettes were filled by negative pressure to a height of 4 cm with one solution of interest. Next, that end was dipped into molten dental wax and the wax was allowed to harden. The remaining half of the pipette was then filled via a fine polyethylene tube (0.1 mm diameter), taking care to avoid any mixing. Finally, the second end of the tube was sealed with wax and the pipette was stored in the dark at 25°C unless indicated otherwise. After selected periods of time, from 1 h to 1 wk, fluorescence of the pipettes was imaged at the most appropriate wavelengths available for each fluorophore with a Biorad Chemi Doc MP Imaging System. To determine specific conductances of electrolyte solutions (not illustrated), we employed 15-cm-long lengths of Tygon tubing with an inner diameter of 0.5 mm. Solutions were aspirated into the tubes by negative pressure. Taking care to avoid formation of bubbles, the ends of the tubes were placed into physically separated chambers containing 30 mM KCl. Silver/silver chloride electrodes were then connected to each chamber, and conductance was monitored via sinusoidal voltage perturbation at 0.2 kHz using our own software. Results were then quantified as mS/cm. To determine osmolarities of electrolyte solutions (not illustrated), we employed a Precision Systems Micro-Osmette micro-osmometer.

Experimental diffusion models employed in this study. (A) Myocytes were patch-clamped close to one end, selecting myocytes 110–130 µm in length. In simulations, the concentrations of solutes within the pipette tip were constant. (B) Permeabilized or detergent/glycerol-extracted myocytes were aspirated rapidly into highly polished pipette tips with inner diameters of ∼12 µm. The restricted region, limiting conductance of the patch pipette, was estimated to be 10–25 µm long. (C and D) Gelatins and/or viscous polymer solutions were aspirated into pipette tips, and the limiting conductance was monitored during and after rapidly switching the pipette tip between solution streams of different compositions. Pipettes were employed with restrictions occurring over 20 μm (C) up to 300 μm (D). (E) 8-cm-long glass pipettes with a 1-mm inner diameter were carefully filled over 4 cm with one chosen solution, and the corresponding end was sealed with dental wax. Then, the second half of the pipette was filled with a second chosen solution, the corresponding end was also sealed with wax, and fluorescence profiles were acquired at chosen times as described in Materials and methods.
Experimental diffusion models employed in this study. (A) Myocytes were patch-clamped close to one end, selecting myocytes 110–130 µm in length. In simulations, the concentrations of solutes within the pipette tip were constant. (B) Permeabilized or detergent/glycerol-extracted myocytes were aspirated rapidly into highly polished pipette tips with inner diameters of ∼12 µm. The restricted region, limiting conductance of the patch pipette, was estimated to be 10–25 µm long. (C and D) Gelatins and/or viscous polymer solutions were aspirated into pipette tips, and the limiting conductance was monitored during and after rapidly switching the pipette tip between solution streams of different compositions. Pipettes were employed with restrictions occurring over 20 μm (C) up to 300 μm (D). (E) 8-cm-long glass pipettes with a 1-mm inner diameter were carefully filled over 4 cm with one chosen solution, and the corresponding end was sealed with dental wax. Then, the second half of the pipette was filled with a second chosen solution, the corresponding end was also sealed with wax, and fluorescence profiles were acquired at chosen times as described in Materials and methods.
Preparation of gelatins
Gelatins employed in diffusion experiments were prepared as an equal mix of Type A and Type B gelatins (Sigma-Aldrich). The gelatins were cleaned by allowing them to set first in a 10-cm-diameter beaker at a thickness of ∼0.5 cm. After setting, gelatins were soaked with a chosen solution and tilt-rocked for 2–3 d with multiple solution changes. The gelatins were then re-liquified by warming and allowed to set for 10–30 min in pipettes before completing subsequent preparations for experiments.
Western blotting
Western blots presented in Fig. S5 were performed by SDS-PAGE using extracts of isolated murine myocytes prepared with radioimmunoprecipitation assay buffer, as described previously (Deisl et al., 2019). Complete details are provided in the legend of Fig. S5.
Statistics
Statistical significance was assessed via Student’s T test after determining that results were distributed normally. Error bars in figures represent standard errors. Significant differences are indicated with one, two, or three asterisks in figures, corresponding to P < 0.05, 0.01, and 0.001, respectively.
Simulations and theoretical principles
All simulations were carried out with Matlab software, employing error checking and step-size adjustment to ensure accuracy within the line-width of plotted results.
To simulate diffusion of monovalent ions and MgATP in Fig. 10 G, the exchange of ATP across the pipette tip was simulated to occur, similar to fluorophores, fourfold faster than its subsequent diffusion through the entire cytoplasm. The diffusion of solutes through the first compartment (i.e., the narrowest zone of the tip) was constructed to duplicate results just outlined. MgATP exchanged four times slower across the tip than Na, Cl, and K, as expected for free water. Within the cytoplasm, this relationship was reversed such that MgATP diffused 20 times slower than K and Cl (0.06 versus 1 × 10⁻⁵ cm2/s).
For simulation of open pipette tips employed in other types of experiments (Figs. 10, 11, S6, and S10), the nth compartment was fixed at the initial solute concentration employed in the pipette. For simulations of diffusion in long (8 cm) pipettes (Figs. S7, S8, S9, and S11), the pipette contents were assumed to be divided into two phases with a sharp interface, and simulation was initiated with two different homogenous solute concentrations in the two halves.

Simulated average ion concentrations and conductance generated in a restricted column, 12 µm long. The column is open at both ends. Diffusion occurs similarly within the column and within 5-µm extensions of the column that extend from the column end, but do not contribute to the monitored conductance. (A) Left: Results for an ion pair with equal anion and cation diffusion coefficients. Initially, the concentration is 2 mM everywhere. As indicated, the concentration was increased to 40 mM at the front of the column for 3 s and then decreased again to 2 mM. Right: Equivalent results for the case that the anion diffusion coefficient was 10-fold less than the cation diffusion coefficient. Results in red are a model in which diffusion of the anion and cation were simulated separately, and results in blue are for a model assuming a diffusion coefficient for the ion pair as given in B. (B) Plot of the rate constants (x axis), determined from single exponential fits of the decaying conductance, against the relative anion diffusion coefficient (y axis), which was varied over 1,000-fold. The predicted coupled diffusion coefficient accurately describes the relationship over the entire three-log unit range.
Simulated average ion concentrations and conductance generated in a restricted column, 12 µm long. The column is open at both ends. Diffusion occurs similarly within the column and within 5-µm extensions of the column that extend from the column end, but do not contribute to the monitored conductance. (A) Left: Results for an ion pair with equal anion and cation diffusion coefficients. Initially, the concentration is 2 mM everywhere. As indicated, the concentration was increased to 40 mM at the front of the column for 3 s and then decreased again to 2 mM. Right: Equivalent results for the case that the anion diffusion coefficient was 10-fold less than the cation diffusion coefficient. Results in red are a model in which diffusion of the anion and cation were simulated separately, and results in blue are for a model assuming a diffusion coefficient for the ion pair as given in B. (B) Plot of the rate constants (x axis), determined from single exponential fits of the decaying conductance, against the relative anion diffusion coefficient (y axis), which was varied over 1,000-fold. The predicted coupled diffusion coefficient accurately describes the relationship over the entire three-log unit range.
As the anion diffusion coefficient is decreased, the decay rate decreases as indicated in Fig. 2 B. The coupled coefficient decreases with the square root of the diffusion coefficient, at first. Then, as the anion diffusion coefficient decreases by more than a factor of 10, the decay constant decreases linearly with the diffusion coefficient. Importantly, the solution conductance can decrease by only a factor of two as the anion diffusion coefficient decreases from that of the cation employed to negligible values.
Since free ATP carries about four negative charges at neutral pH, MgATP complexes are often assumed to carry about two negative charges at pH 7 (Stockbridge and Wolfenden, 2009). We observe, however, that titration of high-grade MgATP (Sigma-Aldrich) yields pH values higher than 7.0 with the addition of 1.2 mol of alkali per mole of MgATP, suggesting that one of the two remaining negative charges remains largely proton-bound at pH 7. This impression is supported by 31P NMR analysis of MgATP solutions with pH titration, also indicating that the valence of MgATP at pH 7.0 is about −1.2 (Song et al., 2008). 31P NMR studies indicate that ATP dimers and complexes of ATP with monovalent cations occur physiologically in cells (Glonek, 1992). All results presented in this article simulate MgATP as a monovalent anion, but results were not significantly different when routines were developed to simulate ATP valences over the range of −1.2 to −2.0.
For simulation of pipette tips with long diffusion paths, tip dimensions were reconstructed digitally as described in Fig. S6 and used to simulate diffusion through the tip in compartments constructed perpendicular to the tip axis. As already sketched, for simulations of diffusion through aspirated myocytes, we assumed that the limiting pipette tip conductance arose from a restriction 10–20 μm long. Diffusion was simulated to continue similarly through 5–10 μm myofilament zones that were not restricted and therefore did not contribute to the measured conductance.
Fig. 3 documents the feasibility of resolving multiple kinetic components when three ions are present in experiments. In this example, a 20-µm diffusion path is assumed to be open at both ends (approximating Fig. 1 D) with 100 mM KCl being present initially on both sides of the confined path. In the hypothetical experiment, 50 mM K(Mg)ATP is applied to one side in addition to 100 mM KCl for 3 s. The diffusion coefficient of the “monovalent” (Mg)ATP anion is varied by 16-fold. For results in Fig. 3 A, the diffusion coefficient of ATP is 0.8 × 10⁻⁵ cm2/s while that of both K and Cl is 2 × 10⁻⁵ cm2/s. The rising and falling conductance curves have fast and slow components, the fast component corresponding to the coupled diffusion constant of KCl and the slow component corresponding to the coupled diffusion coefficient of K(Mg)ATP. In brief, the fast component corresponds to an initial diffusion of KCl into the confined space, as K diffuses ahead of K(Mg)ATP into and out of the confined space. The slow component corresponds to exchange of excess Cl in the confined space for (Mg)ATP, followed by coupled diffusion of K(Mg)ATP. The red curves in Fig. 3 A are the best fits of double exponential functions to the simulated conductance curve. The recovered time constants are in good agreement for the rising and falling phases. Fig. 3 B plots results of simulations in which the anion (MgATP) diffusion coefficient was decreased by 12-fold from that of Cl. The slow exponential time constant, relative to the time constant with all diffusion coefficients being equal, is plotted on the y axis against the assumed diffusion coefficient of MgATP on the x axis, relative to that of Cl. The slow exponential phase of both the rising and falling conductance curves represent accurately the ratio of the diffusion coefficient of the second anion (i.e., MgATP) to that of KCl (i.e., the time constant of the fast exponential in the two-exponential fit). In Fig. 10, these same principles are exploited to analyze coupled diffusion of Na with Cl, aspartate, MgATP, and an anionic polyethylene glycol. In Fig. S4, implications are outlined for current transients induced by voltage perturbation.

Determination of relative diffusion coefficients when three ions are present in simulations, equivalent to those of Fig. 2 . (A) Initially, 100 mM KCl is assumed to be present everywhere with K and Cl having identical diffusion coefficients. As indicated, 50 mM K(Mg)ATP is assumed to be added to the solution in front of the column, whereby the diffusion coefficient of (Mg)ATP is 2.5-fold less than that of K and Cl. The results give rise to double exponential rising and falling conductances, whereby the fitted time constants occur in ratios of 2.47 and 2.32, respectively. (B) The ratios of time constants fitted to simulations in which the diffusion coefficient of ATP was varied over a 10-fold range with respect to those of K and Cl. The fitted exponentials accurately recover the relative diffusion constants of (Mg)ATP and KCl over the entire concentration range.
Determination of relative diffusion coefficients when three ions are present in simulations, equivalent to those of Fig. 2 . (A) Initially, 100 mM KCl is assumed to be present everywhere with K and Cl having identical diffusion coefficients. As indicated, 50 mM K(Mg)ATP is assumed to be added to the solution in front of the column, whereby the diffusion coefficient of (Mg)ATP is 2.5-fold less than that of K and Cl. The results give rise to double exponential rising and falling conductances, whereby the fitted time constants occur in ratios of 2.47 and 2.32, respectively. (B) The ratios of time constants fitted to simulations in which the diffusion coefficient of ATP was varied over a 10-fold range with respect to those of K and Cl. The fitted exponentials accurately recover the relative diffusion constants of (Mg)ATP and KCl over the entire concentration range.
Online supplemental material
We provide the following materials as supplementary data: (1) images of the same slide taken with the Aurox Clarity-equipped Nikon Eclipse microscope used in this study and with a conventional spinning disc confocal microscope (Fig. S1). (2) Supplementary data concerning cardiac myocytes employed in this study. This includes additional examples of fluorophore diffusion in myocytes, a description of experiments with Na dyes to attempt to monitor Na concentration changes and gradients in myocytes, and Western blots to document VDAC1 knockout and lack of compensation of VDAC1 by other VDAC isoforms (Figs. S2, S3, S4, and S5). (3) An analysis of diffusion in gelatins. Specifically, we demonstrate with both optical and electrical methods that diffusion in gelatins is restricted with strong dependence on MW, that ATP diffusion is restricted by nearly 10-fold in 10 g% gelatin, and that restrictions are effectively lost when the gel state is disrupted by warming to 36°C (Figs. S6, S7, S8, S9, S10, S11, and S12). Table S1 tabulates the ratios of solute concentration gradients in water (140 mM KCl) versus 10 g% gelatin on opposing sides of the interface between phases. Additional text can be found at the end of the PDF.
Results
Concentration–conductance relations relevant to this study

Concentration–conductance relations of ionic solutes employed in this study. Conductivity of solutions aspirated into 15-cm-long Tygon tubes with an inner diameter of 0.5 mm. (A) Linear plot of the KCl concentration–conductance relation over three log units. The relation is fit to a modified Kohlrausch equation that includes a constant giving the concentration at which the molar conductivity is reduced by one-half (K50). The measurements give a K50 of 760 mM for KCl. (B) NaCl concentration–conductance relation determined using a patch pipette as in supplemental data. The K50 is 312 mM. (C) Concentration–conductance relation and concentration–osmolarity relation for Na(Mg)ATP solutions, prepared by dilution of a 120 mM MgATP solution, titrated to pH 7.0 with NaOH. While osmolarity is directly proportional to concentration, the concentration–conductance relation is distinctly non-linear and has a K50 of 129 mM. Presumably, therefore, this non-linearity reflects electrostatic interactions that reduce conductivity with increasing concentration, as described by Kohlrausch (Walter and DeWane, 1970). (D) Concentration-conductance relation of K(Mg)ATP solutions, prepared similarly to Na(Mg)ATP solutions. The K50 is 135 mM.
Concentration–conductance relations of ionic solutes employed in this study. Conductivity of solutions aspirated into 15-cm-long Tygon tubes with an inner diameter of 0.5 mm. (A) Linear plot of the KCl concentration–conductance relation over three log units. The relation is fit to a modified Kohlrausch equation that includes a constant giving the concentration at which the molar conductivity is reduced by one-half (K50). The measurements give a K50 of 760 mM for KCl. (B) NaCl concentration–conductance relation determined using a patch pipette as in supplemental data. The K50 is 312 mM. (C) Concentration–conductance relation and concentration–osmolarity relation for Na(Mg)ATP solutions, prepared by dilution of a 120 mM MgATP solution, titrated to pH 7.0 with NaOH. While osmolarity is directly proportional to concentration, the concentration–conductance relation is distinctly non-linear and has a K50 of 129 mM. Presumably, therefore, this non-linearity reflects electrostatic interactions that reduce conductivity with increasing concentration, as described by Kohlrausch (Walter and DeWane, 1970). (D) Concentration-conductance relation of K(Mg)ATP solutions, prepared similarly to Na(Mg)ATP solutions. The K50 is 135 mM.
As indicated in Fig. 4 A, the K50 determined for KCl solutions was 760 mM, indicating that the concentration–conductance relation deviates about 10% from linearity at 100 mM. Conductance results for NaCl solutions, shown in Fig. 4 B, were obtained using a borosilicate patch pipette as employed in Figs. 11 and 12. While the K50 for NaCl, 312 mM, is lower than for KCl, the deviation from linearity up to 50 mM is insignificant for the purposes of the present study. These results are closely consistent with historical data, as well as recent studies (Artemov et al., 2015; Kamceva, 2018; Widodo, 2018; Lee, 2020). As needed to characterize coupled Na and MgATP diffusion, described subsequently, Fig. 4 C shows the concentration–conductance relationship of Na(Mg)ATP together with the corresponding concentration–osmolarity relationship. Samples employed were prepared by serial dilution of a 120 mM MgATP solution titrated to pH 7.0 with NaOH. The concentration–conductance relation clearly tends to saturate, possibly indicative of Na(Mg)ATP complexes at higher concentrations. This is likely not the case, however, since the corresponding concentration–osmolarity relation is accurately described by a straight line. Rather, Na and MgATP must interact electrostatically more than Na and Cl without forming complexes. The K50 of the Kolhrausch equation is 129 mM, less than half the value for NaCl, and Fig. 4 D presents a very similar concentration–conductance relation obtained for K(Mg)ATP (K50, 135 mM).
Diffusion of fluorescent dyes in free water revisited
For the purposes of this study, we determined the diffusion coefficients of several fluorophores in water using 8-cm-long, 1-mm-diameter pipettes. The solution contained 140 mM KCl, 0.5 mM EGTA, and 5 mM HEPES, set to pH 7.4 with KOH. As described in Materials and methods, pipettes were filled to 4 cm via negative pressure with either dye-containing solution or dye-free solution. To avoid any smearing of dye along the inner pipette wall, the exact position of the interface could not be controlled with precision. The remaining 4 cm of the pipette was filled with the complementary dye-free or dye-containing solution, pipettes were incubated in the dark at room temperature for 1–72 h and were imaged as described in Materials and methods. Fig. 5 A shows the 1- and 48-h profiles for Bodipy-ATP in gray and black, respectively. The fluorescence image of the pipette at 48 h is shown above the fluorescence profiles. Figs. 5, B–D, show the 48 h profiles in black for Fluo3, Mg-Green, and Fluo-5N, employed at concentrations of 1–10 μM. The position of the solution interface in the pipettes is denoted by a gray vertical line. In addition, each panel shows the relevant simulations for diffusion coefficients of 10−6 cm2/s and 4.5 × 10⁻⁶ cm2/s. In all four cases, including 20 similar experiments, the 48-h diffusion profile is described well by a diffusion coefficient of ∼4.5 × 10⁻⁶ cm2/s, and the profile for 10−6 cm2/s is approximately fourfold too steep, indicating that it underestimates diffusion of fluorophores in water by about fourfold.

Fluorescence profiles of four fluorophores after initiating diffusion from one-half of 8-cm-long glass pipettes ( inner diameter, 1 mm, 24°C). (A–D) The solution contained 140 mM KCl, 5 mM HEPES (pH 7.4), 0.5 mM EGTA, and 0.5 mM Mg. For Bodipy-FL-ATP (A), the Biorad Chemi Doc fluorescence image for the 48 h tube is given above the profiles, and the fluorescence profile is given at 1 h (gray) and 48 h (black). To avoid bubbles and smearing of solutions along the pipette wall, the solution was loaded without attempting to force an exact interface position at 4 cm. The interface positions for each result are indicated by a gray vertical line, and each result was simulated separately using the appropriate interface position. For Fluo3 (B), Mg-green (C), and Fluo-5N (D), the profiles are given only for 48 h (black). Simulated diffusion profiles for 48 h are given in each panel for a 10−6 cm2/s diffusion coefficient and for a 4.5 × 10⁻⁵ cm2/s diffusion coefficient. In all cases, the larger diffusion coefficient accurately describes the profiles, while the smaller coefficient does not.
Fluorescence profiles of four fluorophores after initiating diffusion from one-half of 8-cm-long glass pipettes ( inner diameter, 1 mm, 24°C). (A–D) The solution contained 140 mM KCl, 5 mM HEPES (pH 7.4), 0.5 mM EGTA, and 0.5 mM Mg. For Bodipy-FL-ATP (A), the Biorad Chemi Doc fluorescence image for the 48 h tube is given above the profiles, and the fluorescence profile is given at 1 h (gray) and 48 h (black). To avoid bubbles and smearing of solutions along the pipette wall, the solution was loaded without attempting to force an exact interface position at 4 cm. The interface positions for each result are indicated by a gray vertical line, and each result was simulated separately using the appropriate interface position. For Fluo3 (B), Mg-green (C), and Fluo-5N (D), the profiles are given only for 48 h (black). Simulated diffusion profiles for 48 h are given in each panel for a 10−6 cm2/s diffusion coefficient and for a 4.5 × 10⁻⁵ cm2/s diffusion coefficient. In all cases, the larger diffusion coefficient accurately describes the profiles, while the smaller coefficient does not.
Diffusion of Bodipy-FL-ATP in myocytes
Fig. 6 describes the time course with which the fluorescent ATP analog, Bodipy-FL-ATP, enters a mouse myocyte from a patch pipette and diffuses to equilibrium within the myocyte. Micrographs of the patch pipette tip with attached myocyte are shown just after opening the myocyte, as well as at 3- and 40-min time points (Fig. 6, A–C). Total fluorescence of the myocyte increases to a plateau with a time constant of 17 min (Fig. 6 D), while fluorescence just next to the pipette tip increases to a plateau with a time constant of 7.4 min (F0 in panel D). Even after 40 min, line scans reveal longitudinal Bodipy-FL-ATP gradients in the cytoplasm, decreasing from the pipette tip to the opposite myocyte end (Fig. 6 E). We note that the fluorescence of the myocyte cytoplasm protrudes clearly into the pipette tip (see micrograph B). Thus, the time course of fluorophore exchange through the pipette tip might be influenced by cytoplasmic constituents. Line scans across the pipette and the width of the myocyte (Fig. 6 F) reveal the development of a condensate in the tip, in spite of the pipette solution being carefully filtered. Importantly, our experience with many fluorophores was that formation of small condensates in the tip did not affect time courses of fluorophore exchange. Fluorophore accumulation in cytoplasm next to the tip (F0) remained slightly less than one-half of the bulk pipette fluorescence, even after 1 h. Accordingly, dye binding to cytoplasmic constituents cannot explain the slow time course with which dye equilibrates with the cytoplasm. To simulate qualitatively the time course of total fluorophore accumulation (Fig. 6 G) and the longitudinal gradients of fluorophore after 3, 15, and 40 min (Fig. 6 H), we found a diffusion coefficient of 6 × 10⁻⁸ cm2/s to be optimal. To simulate the time course of dye accumulation next to the pipette tip (F0), dye exchange across the pipette tip must take place 2.8-fold faster than mean dye accumulation within the myocyte. In other words, resistivity of cytoplasm drawn into the tip is approximately threefold less than the resistivity of the entire myocyte for the diffusion of this fluorophore. This contrasts with equivalent experiments for Na, Cl, and K diffusion in patch-clamped myocytes in which pipette resistance must be assumed to be threefold greater than longitudinal myocyte resistance (Lu and Hilgemann, 2017).

Bodipy-FL-ATP (10 μM) diffusion into a cardiac myocyte from a patch pipette (on-cell pipette resistance, 3 MΩ 24°C). (A–C) Fluorescence micrographs of the myocyte and patch pipette tip just before opening the myocyte (A), after 3 min (B), and after 40 min (C). Dashed lines indicate the positions of the fluorescence intensity profiles displayed in E and F. Intensities were normalized to a maximal cytoplasmic value in each experiment as arbitrary fluorescence units (AFU). (D) The time course of total cytoplasmic fluorescence (red), fitted to an exponential function (gray; time constant, 17 min), and the time course of cytoplasmic fluorescence immediately in front of the pipette tip (blue, F0). The average time constant for four experiments was 42 min. (E) Longitudinal fluorescence line scans along the myocyte at 0, 3, 15, and 40 min. Note that a longitudinal gradient is still evident after 40 min. F0 indicates the position of data points in D. (F) Line scan through the pipette tip and across the width of the myocyte, as indicated in A and C, at 0 and 40 min. As described in Materials and methods, a fluorescence peak (gray) often formed in the pipette tip over 40 min. This corresponds to a fluorophore condensate, which had in our experience no evident effect on experimental results. Fluorescence of the myocyte cytoplasm remained <50% of the pipette tip fluorescence, similar to three equivalent experiments. (G and H) Simulation of Bodipy-FL-ATP diffusion into a myocyte assumed to be 120 μm long. From the four myocytes studied, equilibration was the fastest in this myocyte. Therefore, the simulated diffusion coefficient obtained, 6 × 10⁻⁸ cm2/s, is the maximal coefficient justified by experimental results. (G) Simulated mean cytoplasmic fluorophore concentration (red) and fluorophore concentration in the first compartment at the pipette tip ([X]0). Accurate simulation was obtained with the time constant of dye diffusion through the entire cytoplasm, approximated as , being approximately threefold greater than the time constant of dye exchange between the pipette tip and the cytoplasm, 1/Kpip (Eq. 3). This reflects reasonably the ratio of time constants for F0 and the mean myocyte fluorescence in D. (H) Simulated cytoplasmic concentration profiles at the given time points after initiating diffusion from the pipette tip.
Bodipy-FL-ATP (10 μM) diffusion into a cardiac myocyte from a patch pipette (on-cell pipette resistance, 3 MΩ 24°C). (A–C) Fluorescence micrographs of the myocyte and patch pipette tip just before opening the myocyte (A), after 3 min (B), and after 40 min (C). Dashed lines indicate the positions of the fluorescence intensity profiles displayed in E and F. Intensities were normalized to a maximal cytoplasmic value in each experiment as arbitrary fluorescence units (AFU). (D) The time course of total cytoplasmic fluorescence (red), fitted to an exponential function (gray; time constant, 17 min), and the time course of cytoplasmic fluorescence immediately in front of the pipette tip (blue, F0). The average time constant for four experiments was 42 min. (E) Longitudinal fluorescence line scans along the myocyte at 0, 3, 15, and 40 min. Note that a longitudinal gradient is still evident after 40 min. F0 indicates the position of data points in D. (F) Line scan through the pipette tip and across the width of the myocyte, as indicated in A and C, at 0 and 40 min. As described in Materials and methods, a fluorescence peak (gray) often formed in the pipette tip over 40 min. This corresponds to a fluorophore condensate, which had in our experience no evident effect on experimental results. Fluorescence of the myocyte cytoplasm remained <50% of the pipette tip fluorescence, similar to three equivalent experiments. (G and H) Simulation of Bodipy-FL-ATP diffusion into a myocyte assumed to be 120 μm long. From the four myocytes studied, equilibration was the fastest in this myocyte. Therefore, the simulated diffusion coefficient obtained, 6 × 10⁻⁸ cm2/s, is the maximal coefficient justified by experimental results. (G) Simulated mean cytoplasmic fluorophore concentration (red) and fluorophore concentration in the first compartment at the pipette tip ([X]0). Accurate simulation was obtained with the time constant of dye diffusion through the entire cytoplasm, approximated as , being approximately threefold greater than the time constant of dye exchange between the pipette tip and the cytoplasm, 1/Kpip (Eq. 3). This reflects reasonably the ratio of time constants for F0 and the mean myocyte fluorescence in D. (H) Simulated cytoplasmic concentration profiles at the given time points after initiating diffusion from the pipette tip.
Diffusion of all fluorophores is restricted in myocytes
Fig. 7 presents equivalent diffusion experiments for seven fluorophores at 24°C. Panels A and B present results for sulforhodamine (MW, 559) and carboxyfluorescein (MW, 376). From all fluorophores examined in myocytes, sulforhodomine showed the highest degree of accumulation in cytoplasm with respect to the pipette. This is apparent in the micrograph from the fact that the pipette tip (marked with a diamond) is hardly visible, whereas cytoplasm that is drawn into the pipette tip in line scan #2 is bright. Sulforhodamine equilibrated with the cytoplasm with a very long time constant, on average 28 min (n = 5). As evident in line scan #1 in the right panel, the longitudinal gradient was very strong even after 50 min. As apparent in line scan #2, the dye accumulated in the cytoplasm by at least eightfold with respect to the pipette tip. Thus, dye binding to cytoplasmic constituents is clearly a strong determinant of sulforhodamine diffusion.

Diffusion of fluorophores into cardiac myocytes during patch clamp with ∼3 MΩ access resistance (24°C). Each panel shows the micrograph of a myocyte after ∼1 h of diffusion (left), the time course of total fluorescence changes during the experiment (middle), and line scans as indicated in the micrograph, using yellow dots to indicate the starting position of the line scan (right). (A) Sulforhodamine (100 μM) equilibrates with an average time constant of 29 min (middle panel, n = 5). It accumulates eightfold in the cytoplasm (see line scan 2 across the myocyte and into the pipette tip), and it shows a strong longitudinal gradient even after 1 h. Diamonds indicate the starting position of the line scan 2. (B) Carboxyfluorescein (100 μM) equilibrates with an average time constant of 10 min (middle panel, n = 6) and shows longitudinal gradients even after 1 h. Dye accumulation in cytoplasm versus pipette tip remains very small. (C) Asante Na-green (ASG2, 10 μM) also equilibrates with a very long time constant (40 min, middle panel) and shows a longitudinal gradient even after 1 h. Strong fluorescence occurs in myocytes in the absence of Na. (D–F) A 0.5-kD, a 2-kD, and a 10-kD FITC-PEG (100 μM) equilibrate over 1 h with average time constants of 11, 23, and 15 min (n = 6, 5, and 6, respectively), show no evidence of significant binding, and show clear longitudinal gradients even after 1 h. (G) Purified GFP (12 μM) accumulates weakly in the cytoplasm with respect to the pipette tip with an average time constant of 14 min (n = 6). Fluorescence does not show clear longitudinal gradients. AFU, arbitrary fluorescence units.
Diffusion of fluorophores into cardiac myocytes during patch clamp with ∼3 MΩ access resistance (24°C). Each panel shows the micrograph of a myocyte after ∼1 h of diffusion (left), the time course of total fluorescence changes during the experiment (middle), and line scans as indicated in the micrograph, using yellow dots to indicate the starting position of the line scan (right). (A) Sulforhodamine (100 μM) equilibrates with an average time constant of 29 min (middle panel, n = 5). It accumulates eightfold in the cytoplasm (see line scan 2 across the myocyte and into the pipette tip), and it shows a strong longitudinal gradient even after 1 h. Diamonds indicate the starting position of the line scan 2. (B) Carboxyfluorescein (100 μM) equilibrates with an average time constant of 10 min (middle panel, n = 6) and shows longitudinal gradients even after 1 h. Dye accumulation in cytoplasm versus pipette tip remains very small. (C) Asante Na-green (ASG2, 10 μM) also equilibrates with a very long time constant (40 min, middle panel) and shows a longitudinal gradient even after 1 h. Strong fluorescence occurs in myocytes in the absence of Na. (D–F) A 0.5-kD, a 2-kD, and a 10-kD FITC-PEG (100 μM) equilibrate over 1 h with average time constants of 11, 23, and 15 min (n = 6, 5, and 6, respectively), show no evidence of significant binding, and show clear longitudinal gradients even after 1 h. (G) Purified GFP (12 μM) accumulates weakly in the cytoplasm with respect to the pipette tip with an average time constant of 14 min (n = 6). Fluorescence does not show clear longitudinal gradients. AFU, arbitrary fluorescence units.
As shown in Fig. 7 B, carboxyfluorescein behaves very differently. Fluorescence of the cytoplasm remains substantially less than that of the pipette tip, indicating that binding to cytoplasmic constituents is weak, possibly negligible. The average time constant for equilibration of dye with the cytoplasm is 10 min (n = 6), almost three times less than for sulforhodamine. Notably, the gradient of the dye remains significant after 1 h (see right panel of Fig. 7 B). From the rough estimate that , the diffusion coefficient is about 10−7 cm2/s. Since carboxyfluorescein binds to cytoplasmic constituents less than other small fluorophores, we also analyzed its equilibration in myocytes at 34°C. At the higher temperature, the average time constant was reduced from 10 ± 3 min to 7.4 ± 1 min (n = 4), and the estimated fraction of dye bound in the cytoplasm increased from 0.31 to 0.36.
Fig. 7 C shows results for the Na-selective dye, Asante Sodium Green-2 (ASG2, MW 1100), equilibrated with a myocyte in the absence of extracellular and intracellular Na. While the dye exhibits very little fluorescence without Na in water, it fluoresces strongly as it diffuses into myocytes in the absence of Na. Clearly, it binds constituents of the cytoplasm and fluoresces as a result. The time constant of equilibration is still longer (38 min) than that of sulforhodamine and the longitudinal gradient remains strong after 1 h. The results demonstrate that ASG2 is not a Na-selective dye in the myocyte environment. Since it has negligible fluorescence in the pipette, we cannot estimate the extent to which it binds. However, even if 90% is bound in myocytes, the diffusion constant must be <10−7 cm2/s to account for the time course.
Fig. 7, D–F, presents the diffusion into myocytes of three FITC-labeled PEGs of increasing MW. As shown in Fig. 7 D, a 0.5 kD FITC-PEG equilibrates with the cytoplasm with a time constant of 11 min (n = 6), more slowly than carboxyfluorescein but more rapidly than sulforhodamine. There was no accumulation in the cytoplasm versus the pipette tip, and the longitudinal gradient remained strong after 1 h. Diffusion of a 2-kD PEG (Fig. 7 E) was slower by a factor of 2 (23-min time constant), and a 10-kD PEG (Fig. 7 F) diffused similarly to the 2-kD PEG (time constant, 15 min; n = 6).
Surprisingly, an isolated GFP protein (Fig. 7 G) diffused into myocytes with roughly the same time course as the 2-kD PEG (see panel F), and the GFP fluorescence did not show pronounced gradients during the 1 h time course examined. However, the magnitude of the cytoplasmic fluorescence remained more than sevenfold less than the GFP fluorescence in the pipette tip. We note that discrepancies in the diffusion of fluorescent molecules with respect to MW have been reported previously for cardiac myocytes (Illaste et al., 2012). We speculate in the Discussion that this might reflect at least in part facilitated transport involving protein–protein interactions. We document in Fig. S2 that 2-kD PEGs with an added positive amino group or an added negative COOH group did not diffuse differently from the neutral PEG. We also document that an AlexaFluor488-labeled albumin (66 kD) diffused similarly to GFP and that a 4,400 MW TRITC-labeled dextran equilibrated similarly to 10K PEG.

Diffusion of four additional fluorescent molecules into the cytoplasm of patch-clamped murine myocytes. Same experimental conditions as Figs. 6 and 7. Dashed lines indicate the positions of the line scans shown at right. Yellow dots indicate the end of the myocyte in proximity to the pipette tip. (A) 2 kD FITC-labeled PEG with one amino group (100 μM). (B) 2 kD FITC-labelled PEG with one carboxyl group (100 μM). (C) 4.4 kD TRITC-labeled dextran (10 μM). (D) AlexaFluor488-labeled albumin (100 μM). Time constants determined for the positively and negatively charged PEGs were not significantly different. The 4-kD dextran equilibrates significantly slower, but fluorescent albumin diffuses quite rapidly. Similar to results for GFP (Fig. 7), however, the fluorescent albumin fluorescence remains substantially lower than pipette fluorescence. AFU, arbitrary fluorescence units.
Diffusion of four additional fluorescent molecules into the cytoplasm of patch-clamped murine myocytes. Same experimental conditions as Figs. 6 and 7. Dashed lines indicate the positions of the line scans shown at right. Yellow dots indicate the end of the myocyte in proximity to the pipette tip. (A) 2 kD FITC-labeled PEG with one amino group (100 μM). (B) 2 kD FITC-labelled PEG with one carboxyl group (100 μM). (C) 4.4 kD TRITC-labeled dextran (10 μM). (D) AlexaFluor488-labeled albumin (100 μM). Time constants determined for the positively and negatively charged PEGs were not significantly different. The 4-kD dextran equilibrates significantly slower, but fluorescent albumin diffuses quite rapidly. Similar to results for GFP (Fig. 7), however, the fluorescent albumin fluorescence remains substantially lower than pipette fluorescence. AFU, arbitrary fluorescence units.
Fluorophore diffusion in BL6 murine myocytes
| Fluorophore (MW, kD) | T (°C) | HR (nm) | Fmyo/pip | Fbound | DX (cm2/s) | DX-free (cm2/s) | DX-H2O (cm2/s) | Fold reduction |
|---|---|---|---|---|---|---|---|---|
| Bodipy-FL-ATP (0.88) | 24 | 0.85 | 0.67 | 0.50 | 0.4 × 10⁻⁷ | 0.57 × 10⁻⁷ | 4.5 × 10⁻⁶a | >70 |
| Carboxyfluorescein (0.38) | 24 | 0.65 | 0.48 | 0.31 | 1.2 × 10⁻⁷ | 1.7 × 10⁻⁷ | 4.8 × 10⁻⁶b | 28 |
| Carboxyfluorescein (0.38) | 34 | 0.65 | 0.52 | 0.36 | 3.2 × 10⁻⁷ | 5.0 × 10⁻⁷ | 4.8 × 10⁻⁶b | 10 |
| Sulforhodamine (0.56) | 24 | 0.74 | 5.0 | 0.93 | 0.3 × 10⁻⁷ | 4.3 × 10⁻⁷ | 4.0–4.4 × 10⁻⁶c | 10 |
| TRITC-dextran (4.4) | 24 | 1.44 | 0.74 | 0.55 | 0.4 × 10⁻⁷ | 0.78 × 10⁻⁷ | 1.5 × 10⁻⁶d | 19 |
| 0.5 kD PEG (0.83) | 24 | 0.84 | 0.38 | 0.12 | 1.1 × 10⁻⁷ | 1.2 × 10⁻⁷ | 3 × 10⁻⁶e | 25 |
| 2 kD PEG (2.3) | 24 | 1.16 | 0.42 | 0.21 | 0.5 × 10⁻⁷ | 1.3 × 10⁻⁷ | 6 × 10⁻⁷e | 46 |
| 2 kD PEG-NH3 (2.3) | 24 | 1.16 | 0.48 | 0.31 | 0.33 × 10⁻⁷ | 0.48 × 10⁻⁷ | --- | ---- |
| 10 kD PEG (10.3) | 24 | 1.90 | 0.69 | 0.52 | 0.9 × 10⁻⁷ | 3.1 × 10⁻⁷ | 2.5 × 10⁻⁷e | 8 |
All values are a mean of four or more measurements. From left to right: Column 1: Fluorophore analyzed. Column 2: Temperature of observations. Column 3: Hydrodynamic radius. Column 4: Ratio of fluorescence of pipette solution to myoplasm in close proximity after >20 min (Fmyo/pip). Values for BSA and GFP were 0.07 and 0.15, respectively, indicating exclusion from myoplasm. Column 5: Estimated fractions of fluorophores bound by cytoplasm, assuming the free cytoplasmic space to be one-third of total myocyte volume (Lu et al., 2016). . Column 6: Estimated diffusion coefficients for total fluorophores. with λmyo = 0.012 cm. Column 7: Diffusion coefficients for unbound fluorophore, estimated as . Column 8: Estimated diffusion coefficients for given compounds in free water. Column 9: Estimated fold reduction of diffusion coefficients of unbound compounds in murine myocyte cytoplasm versus water (Dx-H2O/Dx-free).
Gendron et al., 2008 describes diffusion coefficients for multiple rhodamine derivatives.
Our estimate for Bodipy-FL-ATP, 0.45 × 10⁻⁷ cm2/s (Table 1) is smaller still than the values for other fluorescent ATP analogues determined in rat myocytes (Illaste et al., 2012). Possibly, this difference reflects species differences (e.g., a greater mitochondrial volume in murine myocytes), and our finding of differences in diffusion between mouse strains (Fig. 14) appears consistent with this possibility. Our coefficients for carboxyfluorescein are 1.2 and 3.2 × 10⁻⁷ cm2/s at 24 and 34°C, respectively. Column 8 gives the diffusion coefficients for each dye in free water, and Column 9 gives our best estimates of diffusion restriction of free fluorophores in the cardiac myocyte cytoplasm versus free water. Diffusion coefficients were reduced from 8-fold to >70-fold in myoplasm. We note that the degree of restriction did not correlate significantly with hydrodynamic radius for the fluorophores examined. From the data for carboxyfluorescein, it would appear that diffusion restrictions are about threefold greater at 24°C than at 34°C.
Unrestricted Na diffusion in murine myocytes
Fig. 8 examines Na diffusion in murine cardiac myocytes using a protocol that is closely related to protocols recently described to support the existence of local Na gradients (Skogestad et al., 2019). In brief, Na channels are used to load myocytes with known amounts of Na, and the dissipation of Na is monitored either via Na/K pump current (Fig. 8 A) or via Na channels themselves (Fig. 8 B). In panel A, the myocyte was initially patch-clamped with NMG as the sole monovalent cation in the patch pipette. The extracellular solution contained 130 mM NMG with 7 mM Na to suppress pump current generated by contaminating K in standard solutions (Lu et al., 2016). To activate Na/K pump current, 7 mM Na is substituted for 7 mM K. Initially, this protocol generates no detectable pump current, indicating that cytoplasmic Na was effectively depleted from the myocytes. Subsequently, the NaV channel opener, veratridine (3 μM; Zong et al., 1992), was applied together with 120 mM extracellular Na. An inward Na current of about 1 nA developed routinely within 10 s and decayed by about 15% over 80 s. When Na and veratridine were subsequently removed, an outward current of ∼90 pA developed and decayed with a time constant of about 5 s. This current likely represents reverse Na current through NaV channels, and the time course of decay likely reflects a rather rapid veratridine dissociation from cardiac myocyte NaV channels.

Na exchange in patch-clamped murine myocytes using veratridine to induce a large Na influx (35°C). (A) Na exchange estimated from Na/K pump currents. 120 mM NMG-Aspartate on both sides. The extracellular solution contains additionally 7 mM Na or 7 mM K. NMG-Aspartate is exchanged for Na-Aspartate with 3 μM veratridine on the outside. The ∼1 nA inward Na current decays partially, followed by generation of transient outward current upon removal of Na and veratridine. Thereafter, large Na/K pump currents are activated by exchanging 7 mM Na for 7 mM K, and peak currents decay with a time constant of 22 s. Red curves show simulations of Na exchange to a 12 pl cytoplasmic volume. Veratridine dissociates at 0.2 s−1 and pump current is proportional to a Hill equation with a slope of 1.6 (Zong et al., 1992). Peak Na pump current magnitudes determined experimentally are plotted with the simulated pump availability. (B) Na exchange estimated from veratridine-activated Na current. In the presence of veratridine (3 μM), inward Na currents decay partially and outward (reverse) Na currents decay completely with a time constant of 22 s after Na removal. The right panel plots the outward Na current magnitude (y axis) that occurred just after removing extracellular Na in dependence on the time that extracellular Na had been applied (x axis). This time constant, also 22 s, with strong probability reflects the time course over which cytoplasmic Na exchanges with the pipette tip. Simulations assume that Na turnover is determined solely by the pipette access resistance.
Na exchange in patch-clamped murine myocytes using veratridine to induce a large Na influx (35°C). (A) Na exchange estimated from Na/K pump currents. 120 mM NMG-Aspartate on both sides. The extracellular solution contains additionally 7 mM Na or 7 mM K. NMG-Aspartate is exchanged for Na-Aspartate with 3 μM veratridine on the outside. The ∼1 nA inward Na current decays partially, followed by generation of transient outward current upon removal of Na and veratridine. Thereafter, large Na/K pump currents are activated by exchanging 7 mM Na for 7 mM K, and peak currents decay with a time constant of 22 s. Red curves show simulations of Na exchange to a 12 pl cytoplasmic volume. Veratridine dissociates at 0.2 s−1 and pump current is proportional to a Hill equation with a slope of 1.6 (Zong et al., 1992). Peak Na pump current magnitudes determined experimentally are plotted with the simulated pump availability. (B) Na exchange estimated from veratridine-activated Na current. In the presence of veratridine (3 μM), inward Na currents decay partially and outward (reverse) Na currents decay completely with a time constant of 22 s after Na removal. The right panel plots the outward Na current magnitude (y axis) that occurred just after removing extracellular Na in dependence on the time that extracellular Na had been applied (x axis). This time constant, also 22 s, with strong probability reflects the time course over which cytoplasmic Na exchanges with the pipette tip. Simulations assume that Na turnover is determined solely by the pipette access resistance.
Immediately, after removal of Na and veratridine, a large 1 nA Na/K pump current can be activated by applying extracellular K in the same manner as before Na loading. K was applied and removed four additional times to determine the time course with which Na is lost from the myocyte via the patch pipette. From these records, we determined the magnitudes of peak pump currents at the nine points, as indicated, and the corresponding times after removal of Na and veratridine. The peak currents were fit to a single decaying exponential, and the time constant of current decay was determined by least-squares fitting to be 22 s. This value is very similar to results for other protocols used to estimate the time course of Na equilibration with patch pipettes (Lu and Hilgemann, 2017). We note that the more rapid decay of Na/K pump current that occurs during application of extracellular K probably reflects an autoinhibition mechanism of murine cardiac Na/K pumps (Lu and Hilgemann, 2017).
The red curves below the current trace in Fig. 8 A are a simple reconstruction of Na homeostasis in these experiments. It is assumed that Na equilibrates instantly within the entire cytoplasm and that Na exchange with the pipette tip occurs with a time constant of 22 s. This time course is accurately predicted when a pipette access resistance of 4.2 MΩ is simulated as a nonselective conductance and the myocyte mixing volume is assumed to be 12 pl (Lu and Hilgemann, 2017). Na escapes from the cell exclusively via the patch pipette tip. Although no Na pumping is included, Na/K pump availability is simulated by a Hill equation with a half-maximal Na concentration of 6 mM and a Hill coefficient of 1.6, as defined experimentally for this condition without cytoplasmic K (Lu et al., 2016). Finally, we simulated veratridine binding and dissociation from the myocyte to occur with a time constant of 5 s. With these simple assumptions, the simulation reproduces the experimental results with good accuracy.
Fig. 8 B illustrates a second protocol that should reveal subsarcolemmal Na accumulation, if it occurs. In this protocol, veratridine was applied continuously in the presence of NMG as the sole monovalent cation inside and outside the myocyte. Then, Na (120 mM) was applied instead of NMG on the outside, and inward Na currents of about 1.5 nA were generated. The inward current decays by 15%. The average time constant, determined by fitting the individual current records to single exponential functions, was 22 s. The outward current, which develops upon removal of extracellular Na, also decays with a time constant of 22 s. As shown in the right panel of Fig. 8 B for repeated Na applications, removal of Na at different times verifies that the outward Na current develops with the same time course as the inward current decays. The red curves in panel B of Fig. 8 show a simple reconstruction of Na homeostasis in this experiment, assuming that Na equilibrates instantly within the myocyte and exchanges to the patch pipette with a time constant of 22 s from a mixing volume of 12 pl. The results give no evidence for complexities beyond those represented.
In Fig. S3, we describe equivalent experiments using myocytes loaded with CoronaGreen AM Na-selective dye (5 μM for 30 min at 25°C; Iamshanova et al., 2016). CoronaGreen fluorescence changes in similar experiments (n > 20) were in general of small magnitude in relation to signal drift and bleaching. We provide an example in which fluorescence changes seemed reliable. They occurred with a time constant of ∼30 s. We mention in connection with these experiments that the average equilibration time constant, determined as in Fig. 8 B, increased by a factor of 3.0 at 24°C versus 35°C (P < 0.05; n = 5), whereas the access resistance increased by only a factor of 1.5 (n = 5). Possibly, therefore, the cardiac myoplasm becomes relatively more restrictive to Na diffusion at lower temperatures.

Optical measurement of Na concentration changes during and after Na influx activated by veratridine (3 μM). Myocytes were loaded with CoronaGreen AM Na-selective dye (5 μM AM) for 30 min at 25°C (Iamshanova et al., 2016). Myocytes were patch-clamped using Na-free NMG solutions as in Fig. 8. Na was applied and removed multiple times without veratridine and subsequently with veratridine. In the presence of extracellular Na (120 mM), cytoplasmic CoronaGreen fluorescence increases by ∼5% and decreases again upon removal of extracellular Na. Fluorescence changes increase by about a factor of two in the presence of veratridine. Each fluorescence response was fit to falling or rising exponential functions (red curves), and the average time constant amounted to 28 s. The magnitudes of fluorescence changes (5–10%) are consistent with Na changes of 2–4 mM, assuming that CoronaGreen has a dissociation constant (Kd) of 10 mM for Na.
Optical measurement of Na concentration changes during and after Na influx activated by veratridine (3 μM). Myocytes were loaded with CoronaGreen AM Na-selective dye (5 μM AM) for 30 min at 25°C (Iamshanova et al., 2016). Myocytes were patch-clamped using Na-free NMG solutions as in Fig. 8. Na was applied and removed multiple times without veratridine and subsequently with veratridine. In the presence of extracellular Na (120 mM), cytoplasmic CoronaGreen fluorescence increases by ∼5% and decreases again upon removal of extracellular Na. Fluorescence changes increase by about a factor of two in the presence of veratridine. Each fluorescence response was fit to falling or rising exponential functions (red curves), and the average time constant amounted to 28 s. The magnitudes of fluorescence changes (5–10%) are consistent with Na changes of 2–4 mM, assuming that CoronaGreen has a dissociation constant (Kd) of 10 mM for Na.
Restricted ATP diffusion in murine myocytes
We next address the diffusion of ATP in functional experiments with murine myocytes. Fig. 9 presents two initial observations consistent with ATP diffusing in a more restricted manner than Na, although less restricted than fluorophores. Given that these protocols perturb ATP metabolism, we subsequently describe two additional protocols that allow us to track ATP diffusion functionally.

Functional analysis of nucleotide turnover between murine myocyte cytoplasm and patch clamp pipette tip (35°C). (A) Pipette perfusion of AMPPNP. A rapid pipette perfusion technique (Hilgemann and Lu, 1998) was used to apply and remove nonhydrolyzable ATP, AMPPNP, from the cytoplasmic side. The pipette contained 4 mM ATP and 80 mM Na throughout. During continuous pump activation with 7 mM K, AMPPNP (2 mM) perfusion inhibits the pump current with a time constant of 25 s. Pumps reactivate with a time constant of 160 s (gray curves) during AMPPNP removal, and the protocol repeats accurately. Gray curves are single exponential functions, fit to results. The red curve in A simulates results with a diffusion coefficient of 3 × 10⁻⁷ cm2/s into and out of a 120 μM long cylinder, open at one end. The dissociation constant of AMPPNP was 5 μM and that of ATP was 50 μM. (B) Pump current changes after myocyte opening in the presence and absence of ATP in the patch pipette. Pump currents were activated repeatedly for just 2 s to ensure that pump activity did not deplete cytoplasmic Na. Pump currents with ATP decreased by 10% over 10 min, while pump currents without ATP decreased by 65%. Without ATP, currents decayed to negligible values in all experiments within 15 min. The final phase of current decay had a time constant of 177 s on average (n = 6; red curve). The time course of decay is simulated (gray curve) with the following assumptions: (1) The initial myocyte ATP concentration is 8 mm, (2) ATP activates Na/K pumps with a K50 of 50 μM, (3) the cytoplasm contains 120 μM of ATP binding sites with a Kd of 50 μM, (4) the diffusion coefficient of free ATP is 8 × 10⁻⁷ cm2/s, (5) the myocyte is 120 μm long, and (6) the pipette access resistance does not limit ATP diffusion out of the myocyte. ***P < 0.001.
Functional analysis of nucleotide turnover between murine myocyte cytoplasm and patch clamp pipette tip (35°C). (A) Pipette perfusion of AMPPNP. A rapid pipette perfusion technique (Hilgemann and Lu, 1998) was used to apply and remove nonhydrolyzable ATP, AMPPNP, from the cytoplasmic side. The pipette contained 4 mM ATP and 80 mM Na throughout. During continuous pump activation with 7 mM K, AMPPNP (2 mM) perfusion inhibits the pump current with a time constant of 25 s. Pumps reactivate with a time constant of 160 s (gray curves) during AMPPNP removal, and the protocol repeats accurately. Gray curves are single exponential functions, fit to results. The red curve in A simulates results with a diffusion coefficient of 3 × 10⁻⁷ cm2/s into and out of a 120 μM long cylinder, open at one end. The dissociation constant of AMPPNP was 5 μM and that of ATP was 50 μM. (B) Pump current changes after myocyte opening in the presence and absence of ATP in the patch pipette. Pump currents were activated repeatedly for just 2 s to ensure that pump activity did not deplete cytoplasmic Na. Pump currents with ATP decreased by 10% over 10 min, while pump currents without ATP decreased by 65%. Without ATP, currents decayed to negligible values in all experiments within 15 min. The final phase of current decay had a time constant of 177 s on average (n = 6; red curve). The time course of decay is simulated (gray curve) with the following assumptions: (1) The initial myocyte ATP concentration is 8 mm, (2) ATP activates Na/K pumps with a K50 of 50 μM, (3) the cytoplasm contains 120 μM of ATP binding sites with a Kd of 50 μM, (4) the diffusion coefficient of free ATP is 8 × 10⁻⁷ cm2/s, (5) the myocyte is 120 μm long, and (6) the pipette access resistance does not limit ATP diffusion out of the myocyte. ***P < 0.001.
Fig. 9 A shows the time course with which a nonhydrolyzable ATP analog, AMPPNP, inhibits the Na/K pump when perfused into the pipette tip. Presumably, this analog acts by competing with ATP (Beaugé and Glynn, 1980; Robinson, 1980), a caveat being that it can inhibit ATP synthesis as well as ATP hydrolyzing enzymes. Experiments were performed with 80 mM Na and 4 mM MgATP in pipette solutions to ensure stable pump currents during continuous application of extracellular K. Employing a fast pipette perfusion technique (Hilgemann and Lu, 1998), AMPPNP (2 mM) was perfused into and out of the pipette tip multiple times. The experimental record is a solid black line in Fig. 9 A, and single exponential functions fitted to pump current changes are given in gray. At the onset of the experiment, the pump current was activated and deactivated by application and removal of extracellular K (7 mM). Subsequently, the pump current was activated and left activated with 7 mM extracellular K. After 30 s, 2 mM AMPPNP was perfused into the pipette tip in the continued presence of 4 mM ATP. Pump current was turned off with a time constant of 25 s and was subsequently restored by perfusion of AMPPNP-free solution with a time constant of 160 s. As illustrated further in Fig. 9 A, results could be repeated with good reproducibility.
Accurate simulation requires that the diffusion coefficient of AMPPNP is not more than 3 × 10⁻⁷ cm2/s. As already indicated, alternative explanations are readily possible. AMPPNP might inhibit pump activity by rapidly inhibiting ATP synthesis, for example, or ATP concentrations at the plasmalemma might be much lower than the pipette concentration in these experiments. Given these insecurities, we devised multiple further protocols to address ATP diffusibility in murine myocytes.
Starting from a uniform 6 mM ATP concentration, the most accurate description of pump current decay was obtained with a diffusion coefficient of 8 × 10⁻⁷ cm2/s, whereby the final phase of current decay was well fit by an exponential with a time constant of 190 s. This estimate of the diffusion constant of ATP is about threefold lower than outlined for skeletal muscle in the Introduction.
Fig. 10 describes experiments to monitor ATP diffusion functionally in myocytes at very high concentrations, namely by assessing the coupled diffusion of ATP with Na. We assume in these experiments that myocytes incubated in Na-free medium become effectively Na free. Then, when myocytes are opened with a patch pipette containing Na with no other cation, and a given anion, X, Na will initially diffuse into the myocyte in dependence on other cations diffusing out of the myocyte. Over time, the diffusion of Na into the myocyte will depend increasingly on its coupled diffusion with the anion, X, and the final time course of equilibration should be dominated by coupled diffusion of Na with the anion, X. By monitoring Na currents, induced by veratridine, we are then able to monitor the time course of the coupled diffusion process.

Relative anion diffusion coefficients determined from time course of coupled Na and MgATP diffusion into murine myocytes (35°C). (A–D) Representative patch clamp records of myocytes opened with pipette solutions containing 130 mM NaCl (A), Na-aspartate (B), Na(Mg)ATP (C), or Na-PEG-COOH (2 kD; D). The pipette also contained 5 mM KCl and 8 mM HEPES titrated to pH 7.0 with KOH. The extracellular solution contained 130 mM NMG-Aspartate, 4 mM MgCl2, and 10 mM HEPES titrated to pH 7.0 with NMG. As indicated, 10 µM vertridine was applied and removed for a few seconds, long enough to achieve a peak outward Na current. The final veratridine application was continued for long enough to induce current decay, indicative of cytoplasmic Na depletion. The time course with which peak veratridine currents approached a maximum was fitted to a single exponential function. (E) Composite results for the rising peak veratridine currents after myocyte opening. The mean time constants for five to nine measurements are given below the respective columns for the four ion pairs examined. (F) Composite results for the decay of currents during continued veratridine application. (G) Simulation of cytoplasmic Na(Mg)ATP accumulation during patch clamp. As noted in Materials and methods, exchange of MgATP takes place threefold faster than overall diffusion through the cytoplasm, while K, Cl, and Na exchange threefold slower across the pipette tip than they diffuse through the cytoplasm. The pipette contains Na(Mg)ATP (120 mM), and its contents are assumed to be constant. DNa, DCl, DK, and DATP are 0.7, 1.2, 1.2, and 0.06 × 10⁻⁵ cm2/s, respectively. The extracellular solution contains no Na. A surface membrane Na conductance can be activated and deactivated arbitrarily and was set to generate an outward Na current of ∼2 nA. Upon opening the pipette tip, KCl is lost rapidly from the myocyte. Thereafter, Na(Mg)ATP diffuses slowly into the myocyte in a coupled fashion, limited by the diffusion coefficient of MgATP. When MgATP is the sole anion present in the cytoplasm, activation of the Na conductance results in coupled depletion of Na and MgATP with essentially identical time courses. *P < 0.05, **P < 0.01.
Relative anion diffusion coefficients determined from time course of coupled Na and MgATP diffusion into murine myocytes (35°C). (A–D) Representative patch clamp records of myocytes opened with pipette solutions containing 130 mM NaCl (A), Na-aspartate (B), Na(Mg)ATP (C), or Na-PEG-COOH (2 kD; D). The pipette also contained 5 mM KCl and 8 mM HEPES titrated to pH 7.0 with KOH. The extracellular solution contained 130 mM NMG-Aspartate, 4 mM MgCl2, and 10 mM HEPES titrated to pH 7.0 with NMG. As indicated, 10 µM vertridine was applied and removed for a few seconds, long enough to achieve a peak outward Na current. The final veratridine application was continued for long enough to induce current decay, indicative of cytoplasmic Na depletion. The time course with which peak veratridine currents approached a maximum was fitted to a single exponential function. (E) Composite results for the rising peak veratridine currents after myocyte opening. The mean time constants for five to nine measurements are given below the respective columns for the four ion pairs examined. (F) Composite results for the decay of currents during continued veratridine application. (G) Simulation of cytoplasmic Na(Mg)ATP accumulation during patch clamp. As noted in Materials and methods, exchange of MgATP takes place threefold faster than overall diffusion through the cytoplasm, while K, Cl, and Na exchange threefold slower across the pipette tip than they diffuse through the cytoplasm. The pipette contains Na(Mg)ATP (120 mM), and its contents are assumed to be constant. DNa, DCl, DK, and DATP are 0.7, 1.2, 1.2, and 0.06 × 10⁻⁵ cm2/s, respectively. The extracellular solution contains no Na. A surface membrane Na conductance can be activated and deactivated arbitrarily and was set to generate an outward Na current of ∼2 nA. Upon opening the pipette tip, KCl is lost rapidly from the myocyte. Thereafter, Na(Mg)ATP diffuses slowly into the myocyte in a coupled fashion, limited by the diffusion coefficient of MgATP. When MgATP is the sole anion present in the cytoplasm, activation of the Na conductance results in coupled depletion of Na and MgATP with essentially identical time courses. *P < 0.05, **P < 0.01.
Fig. 10, A–D, illustrate experimental results employing this approach for four anions. Myocytes were initially incubated in a solution containing 140 mM NMG-MES (with 0.5 mM EGTA and 4 mM MgCl2 at pH 7.0) for 15 min. Patch pipettes contained 130 mM Na with 130 mM of a chosen anion, 5 mM KCl, and 1 mM MgATP. Seals were formed without opening the sarcolemma. Then, the myocytes were placed in a solution stream containing 120 mM NMG-MES at 35°C, and whole-cell patch clamp was established via suction. Thereafter, myocytes were intermittently switched for ∼15 s to an extracellular solution containing 25 µM veratridine to open Na channels and activate large outward Na currents. Repeating the application of veratridine at ∼1-min intervals, Fig. 10 A illustrates that Na currents were nearly maximal within 40 s of opening myocytes when 120 mM NaCl was employed in the pipette. When activated continuously with veratridine, the outward Na current decayed by about 12% with a time constant of 24 s (see fitted exponential in red). In contrast, Fig. 10 B shows that outward Na current increased over several veratridine applications when 120 mM Na–aspartate was used in the pipette solution. As expected for a slower diffusion of aspartate, decay of current during veratridine application proceeded with a larger time constant than with Cl. Using 120 mM Na(Mg)ATP and 130 mM Na with 500 MW carboxy-PEG, the current changes were still slower, as shown in Fig. 10, C and D, respectively. Fig. 10, E and F, presents the composite results for each condition (n = 5–9). The average equilibration and current decay time constants for NaCl were 30 and 15 s, respectively, those for Na-aspartate were 53 and 24 s, respectively, those for Na(Mg)ATP were 121 and 40 s, respectively, and those for Na-PEG-COOH were 148 and 84 s, respectively.
Fig. 10 G presents a simulation of the diffusion of 120 mM Na(Mg)ATP into myocytes, followed by depletion of Na and MgATP by activation of a Na conductance that generates 2 nA of Na current. The cytoplasm is assumed to contain 50 mM of fixed negative charges. At the onset, the cytoplasmic Cl and K are 120 and 70 mM, and the pipette contains 120 mM Na(Mg)ATP with no Cl or K. To reproduce results for Na(Mg)ATP with reasonable accuracy, diffusion coefficients of 0.7 × 10⁻⁵ and 0.7 × 10⁻⁶ cm2/s were used for Na and MgATP, respectively. K and Cl were simulated with coefficients of 10−5 cm2/s (see Materials and methods and the Fig. 10 legend for additional simulation details). On cell opening, K and Cl diffuse out of the myocyte with a time constant of about 12 s. At first, Na diffuses into the myocyte rapidly in exchange for K. After K is depleted from the myocyte, however, Na and MgATP equilibrate with a time course that is dictated by their coupled diffusion constant in the cytoplasm. The time constant for equilibration is 118 s and the time constant of depletion upon activating Na current is 78 s. These values are in reasonable agreement with average values of 121 and 40 s from corresponding experiments. The ATP diffusion coefficient is just three times smaller than values for skeletal muscle outlined in the Introduction. It is seven times smaller than for ATP diffusion in free water.
Fig. S4 presents results from a complementary protocol that arises from the following prediction: if anions are completely immobile and Na is the only cation present in the cytoplasm, cytoplasmic Na can neither accumulate nor deplete during activation of Na currents because Na concentration changes would violate electroneutrality. Stated differently, as anion mobility decreases, the time constant of Na concentration changes after a step change of Na current will decrease because accumulation or depletion of Na requires movements of anions between the cell and the patch pipette. We describe in Fig. S4 that the time course of Na current decay, using veratridine with 40 mM cytoplasmic Na and 120 mM extracellular Na, is 3.4-fold slower with Na(Mg)ATP in the pipette than with NaCl. This would correspond to a sevenfold smaller MgATP diffusion coefficient than Cl diffusion constant. When equivalent experiments were performed with 90 and 40 mM extracellular Na, current decay with NaCl amounted to 13 and 15%, respectively, but no current decay could be induced using Na(Mg)ATP in the pipette. Veratridine-induced Na currents were at least as large with Na(Mg)ATP as with NaCl. These latter results are consistent with MgATP diffusing >10 times more slowly than Cl in the myocyte cytoplasm.

Na current kinetics predicted and measured in myocytes that are patch clamped with a cytoplasmic solution containing 40 mM Na and an anion with a variable diffusion coefficient. (A) Predicted results. Na was assumed to have a diffusion coefficient of 1.2 × 10⁻⁵ cm2/s, and the diffusion coefficient of the paired anion (X) was assumed to be equal to that of Na (black), 10 times smaller than Na (blue) or 100 times smaller than Na (red). Extracellular Na is initially zero, and a Na conductance is activated that generates 0.4 nA of outward Na current. After 100 s, 100 mM extracellular Na is applied, and after an additional 100 s, the extracellular Na is removed. Cytoplasmic Na depletes and accumulates, respectively, in dependence on anions diffusing into and out of the patch pipette. A 10-fold reduction of the anion diffusion coefficient results in a 5-fold increase of the ion equilibration time constant. When anion diffusion is reduced 100-fold, current decay becomes so slow that it would be difficult to monitor reliably. (B) Results for myocytes superfused continuously with 15 μM veratridine and then additionally with 120, 90, and 40 mM Na, respectively, for 100 s. All cytoplasmic solutions contained 5 mM HEPES, 0.5 mM EGTA, taurine as an osmolyte to give 280 mosmol/liter, and either 40 mM NaCl with 2 mM Na(Mg)ATP (left) or 40 mM Na(Mg)ATP (right). Results for 120 mM extracellular Na (upper panel), employing aspartate as anion, compare current transients obtained after applying veratridine for 100 s with 120 mM Na. Average current decay time constants were distinctly longer in the presence of Na(Mg)ATP in the pipette. Average values during application of Na (τ2) were 15 and 49 s for pipette solutions with Cl versus MgATP, respectively. This 3.3-fold difference in decay rates is recreated in simulations when the diffusion coefficient of MgATP is sevenfold smaller than that of than Cl. In free water, by contrast, MgATP diffuses just 2.6-fold slower than Cl. When experiments were performed with 90 and 40 mM extracellular Na, shown in the middle and lower panels, respectively, current magnitudes were not significantly different in Cl versus MgATP in the pipette. In the presence of cytoplasmic Cl, currents decayed less markedly than with 120 mM extracellular Na. Impressively, no current decay was detectable in the presence of cytoplasmic MgATP. (C) The differences in fractional current decay for Cl- and ATP-containing solutions are quantified. Based on the simulations, these differences require that under these conditions MgATP diffuses >10 times slower than Cl in the myocyte cytoplasm. **P < 0.01, ***P < 0.001.
Na current kinetics predicted and measured in myocytes that are patch clamped with a cytoplasmic solution containing 40 mM Na and an anion with a variable diffusion coefficient. (A) Predicted results. Na was assumed to have a diffusion coefficient of 1.2 × 10⁻⁵ cm2/s, and the diffusion coefficient of the paired anion (X) was assumed to be equal to that of Na (black), 10 times smaller than Na (blue) or 100 times smaller than Na (red). Extracellular Na is initially zero, and a Na conductance is activated that generates 0.4 nA of outward Na current. After 100 s, 100 mM extracellular Na is applied, and after an additional 100 s, the extracellular Na is removed. Cytoplasmic Na depletes and accumulates, respectively, in dependence on anions diffusing into and out of the patch pipette. A 10-fold reduction of the anion diffusion coefficient results in a 5-fold increase of the ion equilibration time constant. When anion diffusion is reduced 100-fold, current decay becomes so slow that it would be difficult to monitor reliably. (B) Results for myocytes superfused continuously with 15 μM veratridine and then additionally with 120, 90, and 40 mM Na, respectively, for 100 s. All cytoplasmic solutions contained 5 mM HEPES, 0.5 mM EGTA, taurine as an osmolyte to give 280 mosmol/liter, and either 40 mM NaCl with 2 mM Na(Mg)ATP (left) or 40 mM Na(Mg)ATP (right). Results for 120 mM extracellular Na (upper panel), employing aspartate as anion, compare current transients obtained after applying veratridine for 100 s with 120 mM Na. Average current decay time constants were distinctly longer in the presence of Na(Mg)ATP in the pipette. Average values during application of Na (τ2) were 15 and 49 s for pipette solutions with Cl versus MgATP, respectively. This 3.3-fold difference in decay rates is recreated in simulations when the diffusion coefficient of MgATP is sevenfold smaller than that of than Cl. In free water, by contrast, MgATP diffuses just 2.6-fold slower than Cl. When experiments were performed with 90 and 40 mM extracellular Na, shown in the middle and lower panels, respectively, current magnitudes were not significantly different in Cl versus MgATP in the pipette. In the presence of cytoplasmic Cl, currents decayed less markedly than with 120 mM extracellular Na. Impressively, no current decay was detectable in the presence of cytoplasmic MgATP. (C) The differences in fractional current decay for Cl- and ATP-containing solutions are quantified. Based on the simulations, these differences require that under these conditions MgATP diffuses >10 times slower than Cl in the myocyte cytoplasm. **P < 0.01, ***P < 0.001.
Diffusion restriction by internal membranes versus myofilaments
A key question posed by these results is whether diffusion restrictions arise primarily from networks of myofilaments or membranes in murine myocytes. To address this question, we analyzed diffusion through permeabilized and physically confined murine cardiac myocytes, as introduced in Materials and methods and described in detail in Fig. 11. Briefly, thick-walled, bullet-shaped glass pipette tips were formed, as used for the giant patch technique (Hilgemann and Lu, 1998), with opening diameters of 8–12 μm. With these dimensions, myocytes were readily aspirated into the tips, and intact myocytes formed seals with resistances ranging from several tens of megaohms to gigaohm values (see Fig. 11 A). A background solution containing 20 mM KCl was employed, and in this configuration, the application of 50 mM of the additional ion pair, NaCl or K(Mg)ATP, increased the tip conductance by a factor of 3–5 (see leftward half of the conductance trace). Subsequently, application of 90 µM of β-escin to permeabilize the sarcolemma (Konishi and Watanabe, 1995) induces an approximately eightfold increase of the tip conductance. Thereafter, application of 50 mM NaCl or K(Mg)ATP causes rapidly reversible threefold increases of conductance. While the peak conductances for NaCl and K(Mg)ATP were similar, the time courses of conductance changes upon changing solutions were distinctly slower for K(Mg)ATP in comparison to NaCl. This is quantified from the first derivative of the conductance record, shown below in Fig. 11 A. We note that the time courses of conductance changes before permeabilization are too fast to quantify accurately, although peak velocities were higher for NaCl than for K(Mg)ATP. After permeabilization, the time constants of conductance changes can be accurately fit to single exponentials. The average time constants of rising and falling NaCl conductances are 0.27 versus 1.7 s for K(Mg)ATP, and the ratio of peak velocities for the two ion pairs is 2.3:1. As illustrated below the experimental records, the ion coupling principle elaborated in Fig. 2 indicates that MgATP diffuses about 10-fold slower than Cl, in reasonable agreement with the previous results.

Coupled ion diffusion in PM-permeabilized and extracted murine cardiac myocytes (24°C). (A) Myocytes were aspirated into the tip of highly polished pipettes, as shown in the inset, employing a background solution that contained 20 mM KCl. The sarcolemma was then permeabilized by application of 80 µM β-escin, and thereafter conductances induced by applying 50 mM NaCl versus 50 mM Na(Mg)ATP are compared. From the first derivative of the conductance signal, the maximal rates and time constants of conductance changes were determined. Time constants for NaCl signals were 16% of those for Na(Mg)ATP. From Eq. 8, this indicates that the diffusion coefficient of MgATP is 9% of the Cl diffusion coefficient. (B) Equivalent experiments to panel A were performed with myocytes that had been extensively membrane-extracted, as described, with glycerol and Triton X-100. The ratios of diffusion coefficients for MgATP and Cl were nearly twice as large, indicating that MgATP diffusion is less restricted in extracted myofilaments than in permeabilized myocytes.
Coupled ion diffusion in PM-permeabilized and extracted murine cardiac myocytes (24°C). (A) Myocytes were aspirated into the tip of highly polished pipettes, as shown in the inset, employing a background solution that contained 20 mM KCl. The sarcolemma was then permeabilized by application of 80 µM β-escin, and thereafter conductances induced by applying 50 mM NaCl versus 50 mM Na(Mg)ATP are compared. From the first derivative of the conductance signal, the maximal rates and time constants of conductance changes were determined. Time constants for NaCl signals were 16% of those for Na(Mg)ATP. From Eq. 8, this indicates that the diffusion coefficient of MgATP is 9% of the Cl diffusion coefficient. (B) Equivalent experiments to panel A were performed with myocytes that had been extensively membrane-extracted, as described, with glycerol and Triton X-100. The ratios of diffusion coefficients for MgATP and Cl were nearly twice as large, indicating that MgATP diffusion is less restricted in extracted myofilaments than in permeabilized myocytes.
To determine the role of membranes in the results of Fig. 11 A, membranes were aggressively extracted by incubation for 2–7 d at 4°C in an extraction solution containing 50% glycerol, 25 mM KCl, 10 mM EGTA, 0.5 mM MgCl2, and 2 mM Triton X-100 (Palmer et al., 1996). At low magnification (20×), these myocytes were indistinguishable from myocytes that were permeabilized as in Fig. 11 A. Nevertheless, as shown in Fig. 11 B, the velocities with which conductances changed in equivalent solution switch experiments were significantly higher. Most importantly, the ratio of the apparent MgATP diffusion coefficient to Cl diffusion coefficient was only 0.16 in extracted myocytes compared to 0.09 in permeabilized myocytes. Accordingly, intracellular membranes evidently account for about one-half of the diffusion restriction encountered by solutes in murine myocytes.
A clear complication in the interpretation of these numbers is the likely influence of Donnan potentials in these experimental models (Godt and Baumgarten, 1984). When low (15 mM) concentrations of KCL were employed, aspiration of myocytes into the pipette tip caused approximately a ∼25% increase, rather than a decrease, of tip conductance, as expected for an attraction of cations and then anions into the negatively charged myofilament space. In the simulation presented in Fig. 10 G, we assumed 50 mM fixed anionic charges, and this value would roughly account for results employing low KCl concentrations. Both the attraction of ions into the myofilament space and the consequent tendency of myofilaments to swell may lead to an underestimation of diffusion restriction in these experiments.
Cardiac myofilaments restrict diffusion more than skeletal myofilaments
To better understand the role of myofilaments in diffusion restriction, we determined for eight ion pairs to what extent their immediate conductivity was decreased by the presence in the pipette tip of either extracted cardiac myofilaments or extracted diaphragm (skeletal) myofilaments. Fig. 12 A shows a typical experiment in which conductance measurements were carried out continuously with a single pipette using 50 mM NMG-MES as the background solution. Five cardiac myocytes were sequentially aspirated and ejected from the pipette tip. Then, murine diaphragm myocytes were added to the chamber and four extracted diaphragm myocytes were aspirated and ejected. The average drop of conductance upon aspirating cardiac myocytes is significantly greater (P < 0.01) than the average decrease caused by skeletal myocytes. Fig. 12 B shows results for eight ion pairs, plotting the average MW of the anion and cation on the x axis and the pipette conductance with aspirated myocyte as a fraction of the conductance without myocytes. From left to right, the results show that for 50 mM KCl, both cardiac and diaphragm myocytes decrease pipette conductance by 24%. This is consistent with hydrated myofilaments making up about 20% of the myocyte volume (Lu and Hilgemann, 2017). We mention that for 140 mM KCl solution, the decrease of conductance was 10% greater for cardiac filaments and 5% greater for diaphragm filaments (not shown), as expected if ions promote myofilament interactions. Using ion pairs with increasing MWs at a concentration of 50 mM, the decrease of conductance induced by cardiac myofilaments increased from 24 to 45%, while the restriction imposed by skeletal filaments was nearly constant at 25%. The largest ion pair was made using 50 mM β-methylcyclodextrin complexed with octanoate and octylamine, respectively. That stable monovalent complexes were formed is supported by the fact that osmolarity of the final solutions with 50 mM of both complexes was 104 mosmol/liter.

Conductance restrictions induced by cardiac and diaphragm myofilaments and their dependence on solute MW (24°C). (A) Representative experiment with membrane-extracted myocytes using a solution of 50 mM NMG-MES, 0.5 mM MgCl2, 0.5 mM EGTA, and buffered to pH 7 with 4 mM HEPES. Initially, five cardiac myocytes were aspirated and released from the pipette tip, cardiac myocytes were replaced with diaphragm myocytes in the dish, and then four diaphragm myocytes were aspirated and released. In this solution, conductances with aspirated cardiac myofilaments were substantially less than with aspirated diaphragm myofilaments. (B) Comparison of conductance changes caused by cardiac and diaphragm myofilaments for four ion pairs. For all results, n > 6. The graph plots the ratio of pipette conductance in the presence versus absence of aspirated myofilaments. Conductances of cardiac and diaphragm myofilaments were similar with 50 mM KCl. While cardiac myofilaments induced progressively larger decreases of conductance with ion pairs of increasing MW, diaphragm myofilaments caused similar conductance reductions for all four ion pairs employed, namely KCl, NMG-MES, NMG-(Mg)ATP, and β-methylcyclodextrin complexes with octanoate and octylamine.
Conductance restrictions induced by cardiac and diaphragm myofilaments and their dependence on solute MW (24°C). (A) Representative experiment with membrane-extracted myocytes using a solution of 50 mM NMG-MES, 0.5 mM MgCl2, 0.5 mM EGTA, and buffered to pH 7 with 4 mM HEPES. Initially, five cardiac myocytes were aspirated and released from the pipette tip, cardiac myocytes were replaced with diaphragm myocytes in the dish, and then four diaphragm myocytes were aspirated and released. In this solution, conductances with aspirated cardiac myofilaments were substantially less than with aspirated diaphragm myofilaments. (B) Comparison of conductance changes caused by cardiac and diaphragm myofilaments for four ion pairs. For all results, n > 6. The graph plots the ratio of pipette conductance in the presence versus absence of aspirated myofilaments. Conductances of cardiac and diaphragm myofilaments were similar with 50 mM KCl. While cardiac myofilaments induced progressively larger decreases of conductance with ion pairs of increasing MW, diaphragm myofilaments caused similar conductance reductions for all four ion pairs employed, namely KCl, NMG-MES, NMG-(Mg)ATP, and β-methylcyclodextrin complexes with octanoate and octylamine.

Comparison of diffusion restrictions in skeletal muscle, murine cardiac myofilaments, and intact murine cardiac myocytes, plotted in dependence on hydrated radius. (A–C) Results are fitted to Boltzmann equations, the slope of which is threefold steeper for intact cardiac myocytes (C) than for intact skeletal muscle (A) or isolated cardiac myocytes (B). (A) Filled circles give the ratio of free diffusion coefficients in skeletal muscle versus free water. The data are replotted from Blatter and Wier (1990), with the left six data points corresponding to sorbitol, sucrose, and ATP (Kushmerick and Podolsky, 1969), as well as soluble tetramethylmurexide derivatives (Hirota et al., 1989), followed by the additional absorbance dyes, arsenazo III, and antipyrylazo II (Maylie et al., 1987a, 1987c, 1987b). The open squares below the skeletal muscle data points correspond to Indo-1 and Fura-2 diffusion in guinea pig myocytes from the Blatter/Wier study. (B) Ratio of pipette tip conductance with and without aspirated cardiac myofilaments for eight ion pairs. Hydrated radii are the average of the anion and cation employed. (C) Ratio of best estimates of diffusion coefficients for selected solutes in murine BL6 myocytes versus free water. SR, sulforhodamine; CF, carboxyfluorescein.
Comparison of diffusion restrictions in skeletal muscle, murine cardiac myofilaments, and intact murine cardiac myocytes, plotted in dependence on hydrated radius. (A–C) Results are fitted to Boltzmann equations, the slope of which is threefold steeper for intact cardiac myocytes (C) than for intact skeletal muscle (A) or isolated cardiac myocytes (B). (A) Filled circles give the ratio of free diffusion coefficients in skeletal muscle versus free water. The data are replotted from Blatter and Wier (1990), with the left six data points corresponding to sorbitol, sucrose, and ATP (Kushmerick and Podolsky, 1969), as well as soluble tetramethylmurexide derivatives (Hirota et al., 1989), followed by the additional absorbance dyes, arsenazo III, and antipyrylazo II (Maylie et al., 1987a, 1987c, 1987b). The open squares below the skeletal muscle data points correspond to Indo-1 and Fura-2 diffusion in guinea pig myocytes from the Blatter/Wier study. (B) Ratio of pipette tip conductance with and without aspirated cardiac myofilaments for eight ion pairs. Hydrated radii are the average of the anion and cation employed. (C) Ratio of best estimates of diffusion coefficients for selected solutes in murine BL6 myocytes versus free water. SR, sulforhodamine; CF, carboxyfluorescein.
The filled circles in Fig. 13 A give the ratio of free diffusion coefficients in skeletal muscle versus free water. These data are carefully replotted from Fig. 3 of the analysis by Blatter and Wier (1990). The left six data points correspond to the diffusion of sorbitol, sucrose, and ATP (Kushmerick and Podolsky, 1969), as well as several Ca-binding absorbance dyes, tetramethylmurexide derivatives (Hirota et al., 1989), arsenazo III, and antipyrylazo II (Maylie et al., 1987a, 1987c, 1987b). The open squares in panel A, below the skeletal muscle data points, are the results for Indo-1 and Fura-2 diffusion in guinea pig myocytes from the Blatter/Wier study. The cardiac results fall clearly below the results for free diffusion in skeletal muscle. The diffusion coefficients for skeletal muscle fall off by 50% at a radius of 0.6 nm (0.3 kD) with a slope of 0.22 nm.
For conductance measurements with extracted cardiac myocytes, given in Fig. 13 B, the average hydrated radius of the ion pair is plotted for eight different ion pairs. Each data point is the average of at least 10 measurements, whereby the standard errors were within the diameter of the data points plotted. The water/myofilament conductance ratio falls off with a mid-point of 0.90 nm, corresponding to 1.04 kD, and a slope of 0.26 nm, similar to the slope for intact skeletal muscle.
Fig. 13 C summarizes our major results for intact myocytes. The maximal ratio of 0.75 is consistent with a hydrated myofilament space of 25% of the accessible cytoplasmic volume. Cl and Na are assigned values of 0.75 because we see no evidence that their diffusion is restricted at 35°C. Aspartate (see Fig. 10) diffuses with a coefficient that is about one-half that of Cl, being only modestly restricted. Figs. 9, 10, and 11 indicate that MgATP diffuses between 4- and 10-fold slower in cytoplasm than in free water, whereas fluorophores with MWs of 450–4,000 all diffuse at least 10 times slower than in free water, some as much as 50 times slower. The fitted Boltzmann function has a mid-point of 0.61 nm (∼0.6 kD) and a slope factor of 0.07 nm, reflecting a slope that is more than threefold steeper than for diffusion in skeletal muscle or extracted myofilaments. Equivalent results for 10% gelatin are provided in Figs. S5, S6, S7, S8, S9, S10, S11, and S12, including ATP diffusion measurements via luciferase luminescence, analysis of ATP and ADP diffusion via conductance measurements, and description of the breakdown of diffusion restriction that occurs when gelatins depolymerize at 37°C.
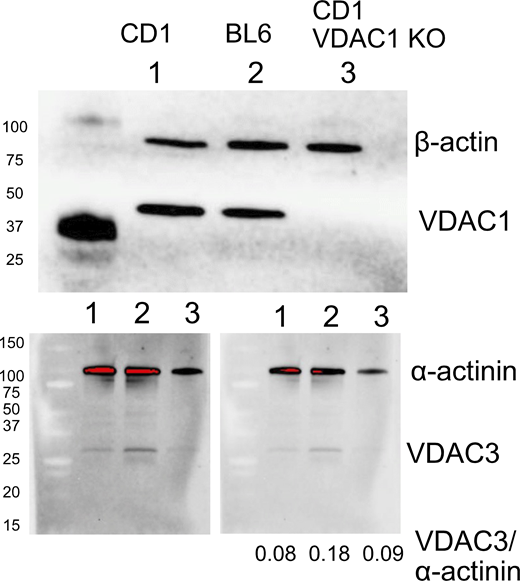
Vdac Western blots. Western blots of VDAC isoforms in (1) WT CD1/J6/129svJ myocytes, (2) WT BL6 myocytes, and (3) VDAC1-deficient CD1/J6/129svJ myocytes were performed as described previously using a radioimmunoprecipitation assay buffer optimized for cardiac myocytes (Deisl et al., 2019). A nonselective VDAC1/2 polyclonal antibody, 10866-1-AP (Proteomtec, 1:3,000 dilution), and a selective VDAC3 antibody, 55260-1-AP (Proteintech, 1:1,000), were employed. Either β-actin (mouse monoclonal, SAB1305554, 1:200 dilution; Sigma-Aldrich) or α-actinin was blotted as loading control (mouse monoclonal antibody, EA-53, 1:200 dilution; Sigma-Aldrich). All wells were loaded with 70 μg of protein, primary antibodies were incubated overnight (4°C), and secondary antibodies (Amersham ECL HRP-conjugated) were incubated at 24°C for 2 h (1:10,000 dilution). To calculate the ratios of VDAC3 to α-actinin accurately, the relative abundances of α-actinin were first determined using a low enough exposure to avoid saturation (red) with subtraction of neighboring baseline (lower right blot). A higher exposure was used to determine the relative abundances of VDAC3 with equivalent baseline subtraction (lower left blot). Then, the density of bands showing no saturation was determined in the two images with subtraction of the background, and the average ratio of densities between the images was calculated. Expression values for α-actinin from the right blot were multiplied by that ratio, and the final abundancy ratios given were calculated from the image-adjusted α-actinin and VDAC3 values obtained in the lower left blot. Source data are available for this figure: SourceData FS5.
Vdac Western blots. Western blots of VDAC isoforms in (1) WT CD1/J6/129svJ myocytes, (2) WT BL6 myocytes, and (3) VDAC1-deficient CD1/J6/129svJ myocytes were performed as described previously using a radioimmunoprecipitation assay buffer optimized for cardiac myocytes (Deisl et al., 2019). A nonselective VDAC1/2 polyclonal antibody, 10866-1-AP (Proteomtec, 1:3,000 dilution), and a selective VDAC3 antibody, 55260-1-AP (Proteintech, 1:1,000), were employed. Either β-actin (mouse monoclonal, SAB1305554, 1:200 dilution; Sigma-Aldrich) or α-actinin was blotted as loading control (mouse monoclonal antibody, EA-53, 1:200 dilution; Sigma-Aldrich). All wells were loaded with 70 μg of protein, primary antibodies were incubated overnight (4°C), and secondary antibodies (Amersham ECL HRP-conjugated) were incubated at 24°C for 2 h (1:10,000 dilution). To calculate the ratios of VDAC3 to α-actinin accurately, the relative abundances of α-actinin were first determined using a low enough exposure to avoid saturation (red) with subtraction of neighboring baseline (lower right blot). A higher exposure was used to determine the relative abundances of VDAC3 with equivalent baseline subtraction (lower left blot). Then, the density of bands showing no saturation was determined in the two images with subtraction of the background, and the average ratio of densities between the images was calculated. Expression values for α-actinin from the right blot were multiplied by that ratio, and the final abundancy ratios given were calculated from the image-adjusted α-actinin and VDAC3 values obtained in the lower left blot. Source data are available for this figure: SourceData FS5.

Conductance measurements of diffusion in gelatin. (A) Borosilicate glass pipettes with cylindrical orifices were formed on a glass flame. Tips were filled over ∼6 mm with warm 10 g% gelatin solution and backfilled with low ionic strength solution. (A) 150–250-μm-thick gelatin coat adhered to the tip. Sinusoidal voltage oscillations were applied to monitor conductance of the tip. The pipette tip was placed directly in front of square pipette tips used to change solutions flowing directly across the orifice by moving the microscope stage. (B) Typical conductance records for addition and removal of 30 mM NaCl. Diffusion coefficients were estimated via simulations (green) with approximated inner tip dimensions (white lines in A). Optimal diffusion coefficients for Na and Cl, adjusted in a ratio of 1.5:1, were 33% less than those for free water (Robinson and Stokes, 1965). Reasonable estimates of coupled diffusion coefficients can also be made from exponential fits of the decaying conductance curves, assuming a median diffusion distance of 0.35 mm (see red line in left record).
Conductance measurements of diffusion in gelatin. (A) Borosilicate glass pipettes with cylindrical orifices were formed on a glass flame. Tips were filled over ∼6 mm with warm 10 g% gelatin solution and backfilled with low ionic strength solution. (A) 150–250-μm-thick gelatin coat adhered to the tip. Sinusoidal voltage oscillations were applied to monitor conductance of the tip. The pipette tip was placed directly in front of square pipette tips used to change solutions flowing directly across the orifice by moving the microscope stage. (B) Typical conductance records for addition and removal of 30 mM NaCl. Diffusion coefficients were estimated via simulations (green) with approximated inner tip dimensions (white lines in A). Optimal diffusion coefficients for Na and Cl, adjusted in a ratio of 1.5:1, were 33% less than those for free water (Robinson and Stokes, 1965). Reasonable estimates of coupled diffusion coefficients can also be made from exponential fits of the decaying conductance curves, assuming a median diffusion distance of 0.35 mm (see red line in left record).

Fluorophore diffusion in 8-cm glass pipettes filled one-half with 10% gelatin. Simulations (red curves) were used to determine best estimates of diffusion constants as labeled. (A and B) Gelatin solution with and without Bodipy-FL-ATP (5 μM) was loaded into one-half of two pipettes each. Gelatin-free solution without and with Bodipy-FL-ATP was loaded into the other pipette halves, respectively. Fluorescence profiles (black) and their derivatives (blue) are shown after 48 h for dye diffusion out of (A) and into (B) gelatin. Without gelatin, diffusion progressed over the entire pipette distance. The ratio of the peak dF/dx slope (S) in water to that in gelatin (Sw/g) was 0.07 and 0.14, indicating that diffusion was ∼10-fold restricted in gelatin. (C and D) Equivalent experiments with Trypan Blue (30 μM), which fluoresces when bound to proteins and other cell constituents. Over 48 h Trypan Blue effectively does not diffuse out of gelatin (C), nor does it diffuse from gelatin-free solution into gelatin (D). (E and F) Diffusion of 0.5 and 2 kD PEG from gelatin-free solution into gelatin, respectively. Based on the ratio of slopes (Sw/g), the 0.5 kD PEG is 3.3-fold restricted in gelatin and the 2kD PEG is 14-fold restricted. Results were similar in three further experiments. AFU, arbitrary fluorescence units.
Fluorophore diffusion in 8-cm glass pipettes filled one-half with 10% gelatin. Simulations (red curves) were used to determine best estimates of diffusion constants as labeled. (A and B) Gelatin solution with and without Bodipy-FL-ATP (5 μM) was loaded into one-half of two pipettes each. Gelatin-free solution without and with Bodipy-FL-ATP was loaded into the other pipette halves, respectively. Fluorescence profiles (black) and their derivatives (blue) are shown after 48 h for dye diffusion out of (A) and into (B) gelatin. Without gelatin, diffusion progressed over the entire pipette distance. The ratio of the peak dF/dx slope (S) in water to that in gelatin (Sw/g) was 0.07 and 0.14, indicating that diffusion was ∼10-fold restricted in gelatin. (C and D) Equivalent experiments with Trypan Blue (30 μM), which fluoresces when bound to proteins and other cell constituents. Over 48 h Trypan Blue effectively does not diffuse out of gelatin (C), nor does it diffuse from gelatin-free solution into gelatin (D). (E and F) Diffusion of 0.5 and 2 kD PEG from gelatin-free solution into gelatin, respectively. Based on the ratio of slopes (Sw/g), the 0.5 kD PEG is 3.3-fold restricted in gelatin and the 2kD PEG is 14-fold restricted. Results were similar in three further experiments. AFU, arbitrary fluorescence units.
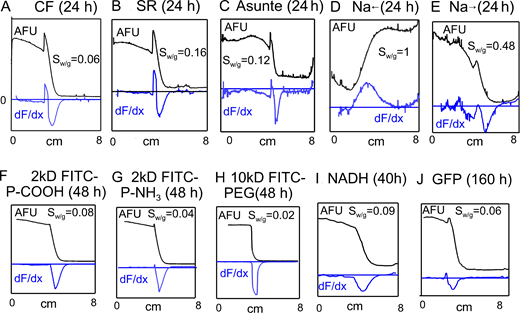
Diffusion of eight fluorophores and Na ions in 8-cm glass pipettes in gelatins. All panels are oriented so that gelatin (10 g%) is in the right half of the pipette and the left half is gelatin free. Fluorescence records are given in black, and the first derivatives of fluorescence are given as blue lines. Solutions contained 140 mM KCl, 5 mM HEPES, and 0.5 mM EGTA. (A–C) Fluorescence profiles of three fluorophores 24 h after pipette loading: carboxyfluorescein (CF, 20 μM), sulforhodamine (SR, 20 μM), and ASG2 (5 μM). Sw/g values indicate that CF diffuses 17 times slower, SR 6.3 times slower, and ASG2 8.3 times slower in gelatin than in gelatin-free solution. (D and E) Profiles for Na diffusion after 24 h in pipettes containing ASG2 in both phases. Na (20 mM) was included in the gelatin phase in D and in the gelatin-free phase in E. Gradients are 4.5-fold less steep than for dye in C, as expected for more rapid diffusion. ASG2 accumulates mildly (∼10%) in the gelatin versus gelatin-free solution. Consistent with electrical measurement, Na diffusion is restricted by at most 50% in gelatin. (F–H) Fluorescence profiles of 8 cm pipettes 48 h after initiating diffusion of 2 kD FITC-PEG-COOH (20 μM), 2 kD PEG-NH3 (20 μM), and 10 kD PEG (20 μM). Accumulation in gelatin is very small or negligible, and ratios of fluorescence slopes are 0.08, 0.04, and 0.02, respectively, indicative of strong diffusion restriction in the gelatin phase. (I) Diffusion profile of NADH (M.W. 663, 150 μM) 40 h after initiating diffusion from the gelatin-free phase into gelatin. NADH diffusion is restricted by 11-fold in the gelatin phase. (J) GFP (27 kD) diffuses slowly but significantly into gelatin over 1 wk. It is restricted in the gelatin versus gelatin-free solution by 17-fold. To estimate the diffusion coefficients of free solutes in these experiments, diffusion out of the gelatin phase was restricted by a variable fraction (F) that reconstructed as accurately as possible the rise of fluorescence at the interface to the gelatin. The Sw/g values from these experiments are tabulated in Table S1. The diffusion coefficient in gelatin, plotted in Fig. S12, was calculated as the diffusion coefficient in water times the slope ratio Sw/g and F. AFU, arbitrary fluorescence units.
Diffusion of eight fluorophores and Na ions in 8-cm glass pipettes in gelatins. All panels are oriented so that gelatin (10 g%) is in the right half of the pipette and the left half is gelatin free. Fluorescence records are given in black, and the first derivatives of fluorescence are given as blue lines. Solutions contained 140 mM KCl, 5 mM HEPES, and 0.5 mM EGTA. (A–C) Fluorescence profiles of three fluorophores 24 h after pipette loading: carboxyfluorescein (CF, 20 μM), sulforhodamine (SR, 20 μM), and ASG2 (5 μM). Sw/g values indicate that CF diffuses 17 times slower, SR 6.3 times slower, and ASG2 8.3 times slower in gelatin than in gelatin-free solution. (D and E) Profiles for Na diffusion after 24 h in pipettes containing ASG2 in both phases. Na (20 mM) was included in the gelatin phase in D and in the gelatin-free phase in E. Gradients are 4.5-fold less steep than for dye in C, as expected for more rapid diffusion. ASG2 accumulates mildly (∼10%) in the gelatin versus gelatin-free solution. Consistent with electrical measurement, Na diffusion is restricted by at most 50% in gelatin. (F–H) Fluorescence profiles of 8 cm pipettes 48 h after initiating diffusion of 2 kD FITC-PEG-COOH (20 μM), 2 kD PEG-NH3 (20 μM), and 10 kD PEG (20 μM). Accumulation in gelatin is very small or negligible, and ratios of fluorescence slopes are 0.08, 0.04, and 0.02, respectively, indicative of strong diffusion restriction in the gelatin phase. (I) Diffusion profile of NADH (M.W. 663, 150 μM) 40 h after initiating diffusion from the gelatin-free phase into gelatin. NADH diffusion is restricted by 11-fold in the gelatin phase. (J) GFP (27 kD) diffuses slowly but significantly into gelatin over 1 wk. It is restricted in the gelatin versus gelatin-free solution by 17-fold. To estimate the diffusion coefficients of free solutes in these experiments, diffusion out of the gelatin phase was restricted by a variable fraction (F) that reconstructed as accurately as possible the rise of fluorescence at the interface to the gelatin. The Sw/g values from these experiments are tabulated in Table S1. The diffusion coefficient in gelatin, plotted in Fig. S12, was calculated as the diffusion coefficient in water times the slope ratio Sw/g and F. AFU, arbitrary fluorescence units.

Optical measurement of ATP diffusion in 8-cm-long pipettes, monitored via firefly luciferase luminescence ( Rasmussen and Nielsen, 1968 ). All solutions contained luciferase (150 ng/ml) and luciferin (15 μM). (A) One group of pipettes was loaded one-half with gelatin-free solution containing 0.5 mM ATP and one-half with ATP-free gelatin. (B) A second group was loaded entirely without gelatin and with ATP in one-half of the pipette. Chemiluminescence was then evaluated after 1 and 5 h. The ATP gradient moved on average threefold further in the water phase (B) than in the gelatin phase (A), indicative of a ninefold smaller diffusion coefficient in 10 g% gelatin. **P < 0.01. (C) Simulation of results with the diffusion coefficients indicated and with an ATP dissociation coefficient of 2 μM.
Optical measurement of ATP diffusion in 8-cm-long pipettes, monitored via firefly luciferase luminescence ( Rasmussen and Nielsen, 1968 ). All solutions contained luciferase (150 ng/ml) and luciferin (15 μM). (A) One group of pipettes was loaded one-half with gelatin-free solution containing 0.5 mM ATP and one-half with ATP-free gelatin. (B) A second group was loaded entirely without gelatin and with ATP in one-half of the pipette. Chemiluminescence was then evaluated after 1 and 5 h. The ATP gradient moved on average threefold further in the water phase (B) than in the gelatin phase (A), indicative of a ninefold smaller diffusion coefficient in 10 g% gelatin. **P < 0.01. (C) Simulation of results with the diffusion coefficients indicated and with an ATP dissociation coefficient of 2 μM.

Comparison of NaCl, Na(Mg)ATP, and NaADP diffusion in gelatin using conductance measurements to monitor diffusion. (A) NaCl (40 mM) was applied and removed, followed by Na(Mg)ATP (40 mM) and then NaCl again. The gray curve is a simulation for a Na-anion pair in which the anion diffuses 10 times slower than Cl. Similar to the simulation, the conductance record for 40 mM Na(Mg)ATP rises in a biphasic fashion and declines more than three times slower than the records for NaCl. (B) NaADP diffusion into a gelatin-filled pipette tip follows a similar pattern to Na(Mg)ATP. (C) Comparison of NaCl and Na(Mg)ATP diffusion in pipette tips with 0, 6, and 12 g% gelatin. For all results, n ≥ 5. The decay constant for NaCl decreases by 25 and 41% in 6 and 12% gelatin, respectively, while the decay constant for Na(Mg)ATP is decreased by 80% in both gelatins. We mention that the results for NADH were similar. (D) Dependence of steady state conductances on the percent gelatin employed. Impressively, increasing concentrations of gelatin cause similar relative steady-state conductance changes. This is not unexpected, since MgATP contributes only about 20% of the conductance to the Na(Mg)ATP solution. A decrease of MgATP diffusibility can cause a large change of the coupled diffusion coefficient but only a small change of the steady-state conductance.
Comparison of NaCl, Na(Mg)ATP, and NaADP diffusion in gelatin using conductance measurements to monitor diffusion. (A) NaCl (40 mM) was applied and removed, followed by Na(Mg)ATP (40 mM) and then NaCl again. The gray curve is a simulation for a Na-anion pair in which the anion diffuses 10 times slower than Cl. Similar to the simulation, the conductance record for 40 mM Na(Mg)ATP rises in a biphasic fashion and declines more than three times slower than the records for NaCl. (B) NaADP diffusion into a gelatin-filled pipette tip follows a similar pattern to Na(Mg)ATP. (C) Comparison of NaCl and Na(Mg)ATP diffusion in pipette tips with 0, 6, and 12 g% gelatin. For all results, n ≥ 5. The decay constant for NaCl decreases by 25 and 41% in 6 and 12% gelatin, respectively, while the decay constant for Na(Mg)ATP is decreased by 80% in both gelatins. We mention that the results for NADH were similar. (D) Dependence of steady state conductances on the percent gelatin employed. Impressively, increasing concentrations of gelatin cause similar relative steady-state conductance changes. This is not unexpected, since MgATP contributes only about 20% of the conductance to the Na(Mg)ATP solution. A decrease of MgATP diffusibility can cause a large change of the coupled diffusion coefficient but only a small change of the steady-state conductance.

Diffusion restrictions in gelatin are lost by warming to 36°C, in close association with liquification of the gelatin. Diffusion of 2 kD FITC-PEG at 25 and 36°C for 20 h. Six 8-cm pipettes were filled one-half with 10 g% gelatin and one-half with gelatin-free solution containing 10 μM FITC-PEG. Three were incubated at 37°C and three at 25°C for 20 h. Gradients in pipettes incubated at 25°C were very similar to those in Figs. S7 and S8, diffusion being five times slower in the gelatin phase. In pipettes incubated at 37°C FITC-PEG diffused the entire length of the pipettes in 20 h, so that fluorescence at the loaded end decreased by nearly 20% and increased by a similar amount at the unloaded end. To account for the data, the diffusion coefficient in the gelatin phase must be close to 10−4 cm2/s. Possibly, therefore, solute movements are in some way facilitated in this condition. We conclude that diffusion restrictions in gelatin are dependent on gelatin cross-linkages and not on the molecular crowding per se of proteins in solution. AFU, arbitrary fluorescence units.
Diffusion restrictions in gelatin are lost by warming to 36°C, in close association with liquification of the gelatin. Diffusion of 2 kD FITC-PEG at 25 and 36°C for 20 h. Six 8-cm pipettes were filled one-half with 10 g% gelatin and one-half with gelatin-free solution containing 10 μM FITC-PEG. Three were incubated at 37°C and three at 25°C for 20 h. Gradients in pipettes incubated at 25°C were very similar to those in Figs. S7 and S8, diffusion being five times slower in the gelatin phase. In pipettes incubated at 37°C FITC-PEG diffused the entire length of the pipettes in 20 h, so that fluorescence at the loaded end decreased by nearly 20% and increased by a similar amount at the unloaded end. To account for the data, the diffusion coefficient in the gelatin phase must be close to 10−4 cm2/s. Possibly, therefore, solute movements are in some way facilitated in this condition. We conclude that diffusion restrictions in gelatin are dependent on gelatin cross-linkages and not on the molecular crowding per se of proteins in solution. AFU, arbitrary fluorescence units.

Ratio of estimated diffusion coefficients of selected compounds in 10% gelatin versus free water (140 mM KCl). For Na, ATP, and NADH the estimated diffusion coefficients are an average of values obtained in the relevant optical and electrical measurements.
Ratio of estimated diffusion coefficients of selected compounds in 10% gelatin versus free water (140 mM KCl). For Na, ATP, and NADH the estimated diffusion coefficients are an average of values obtained in the relevant optical and electrical measurements.
Evidence for a role of mitochondria in restricting diffusion in the murine myocyte cytoplasm
Finally, we designed experiments to test whether internal membranes, specifically mitochondrial membranes, play a significant role in restricting diffusion in murine cardiac myocytes. We reasoned that the outer mitochondrial porin channels would influence diffusion if mitochondrial networks in myocytes indeed form significant diffusion barriers. Specifically, we hypothesized that porins would facilitate long-range diffusion by allowing solute passage through intermembrane spaces of mitochondria. On this basis we next studied myocytes from VDAC1 KO mice. As noted in Materials and methods, breeding of VDAC1 KO animals requires a mixed genetic background, and we employed a CD1/J6/129svJ background. To evaluate cytoplasmic diffusion, we analyzed both the decline of Na/K pump currents during patch clamp with ATP-free pipette solution and the diffusion of carboxyfluorescein into patch-clamped myocytes.
Fig. 14 A shows examples of pump current run-down in the absence of pipette ATP in WT CD1/J6/129svJ cardiac myocytes and in VDA1 KO myocytes from CD1/J6/129svJ mice. Surprisingly, as shown in Fig. 14 B, the loss of pump currents in the absence of ATP occurred more than twofold faster in myocytes from CD1/J6/129svJ mice than in myocytes from WT BL6 mice, and similar results were obtained from mice of both sexes. In addition, pump current run-down was slowed by more than twofold in VDAC1 KO myocytes compared with control CD1/J6/129svJ myocytes. Accordingly, pump run-down was similar in CD1/J6/129svJ VDAC1 KO myocytes and in myocytes from WT BL6 mice. We further report that results for Na/K pump run-down were similar with either 80 or 20 mM cytoplasmic (pipette) Na (Fig. 14 B).

Diffusion restriction in murine cardiac myocytes depends on mouse strain and is enhanced by deletion of VDAC1 porin channels (35°C). “CD” indicates myocytes from CD1/J6/129svJ mice. (A) Representative records of Na/K pump current decline using patch pipettes without MgATP for CD WT and CD/VDAC1-deficient myocytes. (B) Composite results. Decline of Na/K pump current is more than twofold faster in CD WT myocytes than in BL6 WT myocytes. Pump current decline is twofold slower in CD myocytes lacking VDAC1 than in CD WT myocytes. Results were similar using either 80 or 20 mM cytoplasmic Na. (C) Micrographs of CD WT and VDAC1-deficient myocytes after 10 min of patch clamp with 10 µM carboxyfluorescein. The longitudinal fluorescence gradient is still pronounced in the myocyte lacking VDAC1 after 10 min. (D) Similar to results for Na/K pump currents, the time constant with which carboxyfluorescein equilibrates in BL6 WT myocytes is more than twofold greater than in CD WT myocytes, and the time constant is more than twofold greater in CD myocytes lacking VDAC1 than in WT CD myocytes. **P < 0.01.
Diffusion restriction in murine cardiac myocytes depends on mouse strain and is enhanced by deletion of VDAC1 porin channels (35°C). “CD” indicates myocytes from CD1/J6/129svJ mice. (A) Representative records of Na/K pump current decline using patch pipettes without MgATP for CD WT and CD/VDAC1-deficient myocytes. (B) Composite results. Decline of Na/K pump current is more than twofold faster in CD WT myocytes than in BL6 WT myocytes. Pump current decline is twofold slower in CD myocytes lacking VDAC1 than in CD WT myocytes. Results were similar using either 80 or 20 mM cytoplasmic Na. (C) Micrographs of CD WT and VDAC1-deficient myocytes after 10 min of patch clamp with 10 µM carboxyfluorescein. The longitudinal fluorescence gradient is still pronounced in the myocyte lacking VDAC1 after 10 min. (D) Similar to results for Na/K pump currents, the time constant with which carboxyfluorescein equilibrates in BL6 WT myocytes is more than twofold greater than in CD WT myocytes, and the time constant is more than twofold greater in CD myocytes lacking VDAC1 than in WT CD myocytes. **P < 0.01.
As shown in Fig. 14, C and D, results for diffusion of carboxyfluorescein into myocytes effectively mirror the results for Na/K pump run-down. Diffusion of carboxyfluorescein into myocytes from CD1/J6/129svJ mice was 2.5-fold faster than into myocytes from BL6WT mice, and diffusion of carboxyfluorescein into VDAC1 KO myocytes was more than twofold slower than into myocytes from WT CD1/J6/129svJ myocytes. One possible explanation for the slower diffusion rates in BL6 versus CD1/J6/129svJ myocytes is that the expression levels of VDAC channels might be different. Therefore, we evaluated by Western blotting expression levels of VDAC isoforms. As shown in Fig. S5, VDAC1 was entirely absent in the KO myocytes. Furthermore, expression levels of VDAC channel isoforms were not significantly different in BL6 versus WT CD1/J6/129svJ myocytes. Thus, factors other than VDAC expression must underlie the differences in diffusion in the different mouse strains.
Discussion
In this article, we have used patch clamp and fluorescence microscopy to characterize the diffusion of diverse fluorophores, a series of PEGs, Na, and ATP in cardiac myocytes. We have compared, as possible, results from intact myocytes to results employing plasma membrane–permeabilized myocytes and membrane-extracted myocytes (i.e., myofilaments). In supplemental data, we also provide comparable measurements of diffusion in gelatins, prepared at concentrations relevant to the protein content of cardiac myocytes, and we describe briefly experiments with macromolecules that do not form gels.
Diffusion coefficients fall off steeply in intact cardiac myocytes over an MW range of 300–1,000 (Fig. 13), and diffusion coefficients of many commonly employed fluorophores are more than 20-fold reduced in the BL6 cardiac myocyte cytoplasm compared with water. Evidently, both cardiac myofilaments and mitochondria networks (Piquereau et al., 2013) contribute to longitudinal diffusion restrictions. Extracted cardiac myofilaments were found by a direct method to modestly restrict solute diffusion (Fig. 11), while skeletal myofilaments were less effective (Fig. 12). A limitation of these results is that extracted myofilaments tend to swell over time. Nevertheless, it is striking that isolated cardiac myofilaments restrict diffusion similarly to historical results for intact skeletal muscle (Fig. 13). Concerning the greater diffusion restriction occurring in intact cardiac myocytes (Fig. 13), we have shown that deletion of the outer mitochondrial porin, VDAC1, significantly slows long-distance diffusion in murine myocytes (Fig 14). Thus, the decreasing permeability of porin channels to solutes of increasing MW likely contributes to the steeper decline of diffusivity with increasing MW in intact versus extracted myocytes (Fig. 13). This result confirms by a molecular approach that a substantial component of diffusion restriction in cardiac myocytes is related to the organization of mitochondria (Illaste et al., 2012; Richards et al., 2016). Presumably, this restriction of long-range diffusion reflects an optimization of local diffusion between mitochondria and the myofilament space. With this perspective, we next discuss the data sets roughly in the order of their presentation, ending with potential implications for cardiac metabolism.
Diffusion of fluorophores in cardiac myocytes
That commonly employed fluorophores diffuse 15–40 times slower in myocytes than in free water explains why cardiac electrophysiologists typically employ AM esters to load fluorophores, even when employing patch clamp. Among the different fluorophores examined, only sulforhodamine binds profusely to cytoplasmic constituents, while FITC-PEGs show essentially no evidence of binding (Table 1). For carboxyfluorescein, we have documented that diffusion is accelerated by warming to a greater extent than expected for diffusion in free water (Table 1). Notably, a 10-kD PEG diffuses as rapidly as a 2-kD PEG in our experiments, consistent with the observation that some large molecules can be less restricted in myocytes than smaller molecules (Illaste et al., 2012). We speculate that large fluorescent molecules (e.g., GFP, Fig. 7) may move by mechanisms involving cytoskeleton and/or conformational changes of myofilaments. Our estimates of MgATP diffusion coefficients are in reasonable agreement with results for free dyes of similar MW (Table 1 and Fig. 13). At 34°C, carboxyfluorescein, which has a MW that is marginally smaller than that of MgATP, diffuses just 30% slower than our average results for MgATP in the cytoplasm of murine myocytes (Fig. 13 and Table 1).
The diffusion restrictions for dyes in murine myocytes are greater than restrictions found in bacteria (McGuffee and Elcock, 2010; Gallet et al., 2017; Bohrer and Xiao, 2020) or in non-muscle mammalian cells (Verkman, 2002; Rivas and Minton, 2016). For bacteria, molecular simulations are quite advanced (Trovato and Tozzini, 2014; Bohrer and Xiao, 2020). In those models, only a two- to threefold reduction occurs as hydrated radii increase from 1 to 4 nm (i.e., as MW increases to >20 kD). This is similar to results for mammalian cells that do not contain a dense contractile protein network or extensive mitochondrial networks (Verkman, 2002). Gel-like protein meshes can modify diffusion in multiple complex manners (e.g., Lauffer, 1961; Johnson et al., 1996; Labille et al., 2007). Surprisingly, however, crosslinking was not verified to enhance diffusion restriction in hydrogels (Wu et al., 2009). Diffusion of fluorophores in agarose is only mildly restricted (Shoga et al., 2017), and the diffusion of small solutes in cartilage is restricted by only about twofold (Burstein et al., 1993). We verify in Fig. S11 that diffusion restrictions in gelatins are essentially lost upon warming just enough to disengage gel linkages. This provides one clear example in which protein crosslinking clearly contributes to diffusion restriction.
Na diffusion in cardiac myocytes
The idea that local Na gradients modify Na transport function gained much support over several decades. In one recent study, cytoplasmic Na accumulation was promoted in mouse cardiac myocytes by rapid depolarizations that activated voltage-gated Na channels (Skogestad et al., 2019). Na/K pump currents were reported to be enhanced by an amount that could not be explained if Na influx were occurring into the entire cytoplasm, and it was concluded that Na accumulates in a subsarcolemmal compartment with a turnover to bulk cytoplasm occurring over 1–2 min, the time course over which Na/K pump currents decayed.
Accordingly, we devised experiments, based on the same principles, to examine the influence of Na influx via NaV channels on subsequent Na/K pump activity (Fig. 8 A). To do so, we employed Ca-free and essentially Na-free conditions at the onset of experiements. We then activated large, well-defined Na currents by application of extracellular Na and veratridine together. These currents could be rigorously quantified to know how much Na entered the myocytes. Subsequent Na/K pump currents decayed back to negligible values with a time constant of 22 s at 35°C, as expected from our previous study, and very similar Na kinetics were observed when cytoplasmic Na changes were inferred from decay of Na channel currents after rapid Na application and removal (Fig. 8 B). Again, the estimated time constant for Na turnover to the pipette was 22 s. One potential objection is our assumption that the mixing volume for cytoplasmic Na is only 33% of the total myocyte volume. This is consistent with the known volume of mitochondria in murine myocytes (e.g., Swietach et al., 2015) together with evidence that hydration water of myocyte myofilaments amounts to ∼20% of total cellular water (Drewnowska and Baumgarten, 1991; Rorschach et al., 1991). We can only speculate why repeated depolarizations might activate Na/K pump currents for prolonged times (Skogestad et al., 2019). Control of Ca is one potential concern in these experiments since Ca elevations stimulate very markedly Na/K pump currents in murine myocytes (Lu et al., 2016). Rapid electrical stimulation of rat skeletal muscle in the presence of Ca also markedly enhances Na/K pump activity without changes in surface membrane pump density (McKenna et al., 2003). At body temperature, our estimate is that the cytoplasmic diffusion coefficient of Na in murine myocytes is not more than twofold reduced from that in free water, and therefore that Na turnover in patch-clamped myocytes is likely limited by patch pipette access resistance.
Nucleotide diffusion in cardiac myocytes and the dual nature of diffusion restrictions
We have attempted to define the diffusivity of MgATP in murine cardiac cytoplasm in multiple ways. First, we determined the time courses of Na/K pump inhibition and recovery upon perfusing AMPPNP into and out of the patch pipette tip (Fig. 9 A). Second, we determined the time course of pump current decline during patch clamp with ATP-free pipette solutions (Fig. 9 B). Third, we determined the time course with which anions, including MgATP, diffuse into myocytes from the patch pipette with Na as the coupled monovalent cation (Fig. 10). Fourth, we compared the kinetics of sustained Na currents when MgATP instead of Cl was used as the sole cytoplasmic anion (Fig. S4). Fifth, we compared diffusion of NaCl and Na(Mg)ATP into sarcolemma-permeabilized myocytes constrained within large-diameter pipette tips (Fig. 11 A). The apparent diffusion coefficients from the different protocols range from 3 × 10⁻⁷ cm2/s (Fig. 9 A) to ∼10−6 cm2/s (Fig. S4, upper panel). All of the protocols were admittedly indirect and open to different criticisms. Probably, the most reliable protocol is the tracking of MgATP diffusion into myocytes with Na (Fig. 10). The coefficient obtained is in the mid-range of our estimates, 7 × 10⁻⁷ cm2/s, roughly threefold smaller than coefficients determined for skeletal muscle (see Introduction) and about eight times smaller than for ATP diffusion in free water. In experiments employing permeabilized myocytes (Fig. 11 A), MgATP diffuses 11 times slower than Cl, which equates to about four times slower than in free water.
All of our results suggest that cardiac myofilaments and mitochondrial networks restrict diffusion more than skeletal myofilaments and mitochondria. For intact myocytes, a more dense organization of mitochondria networks is likely to be an important factor. The reasons for differences between cardiac and skeletal myofilaments (Fig. 12), as well as between mouse strains (Fig. 14), are a matter of speculation. One possibility is simply that diaphragm myofilaments swell more than cardiac myofilaments after membrane extraction, owing to different filament-interacting proteins. In any case, differences in the content and/or function of myofilament-coupled proteins are likely involved. The higher molar ratio of myosin to actin in cardiac versus skeletal muscle (Murakami and Uchida, 1985) and the greater stiffness of cardiac myofilaments, owing to the presence of different titin isoforms (LeWinter and Granzier, 2010; Loescher et al., 2022), may both be important. Interestingly, the molecular model of diffusion within myofilaments, highlighted in the Introduction (Kekenes-Huskey et al., 2013), predicted diffusivity to fall off by 50% at a hydrated radius (r50) of about 1.9 nm with a slope factor of about 2.4 nm (see Eq. 27). These predictions are quite similar to results obtained in our experiments with detergent-extracted skeletal myofilaments (Fig. 12 B). The half-maximal radius (r50) using extracted cardiac myofilaments was twofold smaller and the slope was 10-fold greater than the simulations of diffusion in myofilaments (Figs. 12 and 13). For intact myocytes, the half-maximal radius (r50) is fourfold smaller and the slope is 30-fold greater.
Although the geometric prerequisites for diffusion restriction by cytoplasmic organelles are clearly complex, mathematical models have been developed that appear to predict the basic outcomes of the present study (Ramay and Vendelin, 2009). As outlined in Figs. 11 and 13, our data suggest that diffusion restrictions arise approximately equally from cardiac myofilaments and mitochondrial networks. As a result, porin channels of the outer mitochondrial membrane may facilitate long-distance diffusion by allowing solute passage through mitochondrial intermembrane spaces. Given that mitochondria make up 35% of the murine myocyte volume (Dedkova and Blatter, 2012) and that the free mixing volume of the cytoplasmic space is likely not more than 30% of myocyte volume (Lu and Hilgemann, 2017), the undulating intermembrane space of mitochondria will likely constitute several percent of the free cellular mixing volume. Accordingly, a 5–10-fold restriction of solute diffusion in myofilament spaces can plausibly lend a preference to solute passage through intermembrane spaces. Of course, it is prerequisite that diffusion in the mitochondrial intermembrane spaces takes place without significant restriction. We mention lastly in this connection that the sarcoplasmic reticulum has also been suggested to restrict diffusion in myocytes by effectively surrounding myofilaments (Fabiato, 1985).
Diffusion restrictions likely influence nucleotide signaling
Finally, we ask to what extent cytoplasmic diffusion might influence cardiac energy metabolism, specifically the turnover of nucleotides between mitochondria and myofilaments. The answers are surprisingly clear: In rodent hearts, the organization of intermyofibrillar mitochondria ensures that diffusion distances for nucleotides are not more than one to two microns (Piquereau et al., 2013; Guzun et al., 2015). For diffusion of nucleotides (5 × 10⁻⁶ cm2/s in free water), these distances would give rise to nucleotide transfer rates across myofilaments on the order of 200–600 s−1. Oxygen consumption of mouse hearts (∼8 mmol/kg wet weight/min, e.g, Nederlof et al., 2017) reflects an ATP consumption of about 0.5 mmole/kg wet weight/s (Mookerjee et al., 2018). With cytoplasmic ATP concentrations in the range of 8 mM, a 10-fold reduction of ATP diffusion rates would still leave the diffusion capacity of ATP about 100-fold greater than ATP consumption. For ADP and AMP, which are in the low micromolar range, the situation with respect to diffusion is different. As illustrated in Fig. 15 A, we simulated as simply as possible the homeostasis of nucleotides via cytoplasmic ATPases, adenylate kinases, diffusion to the inner mitochondrial space (IMS), exchange of nucleotides to the matrix space, and ATP synthesis in the matrix. The simple outcome for nucleotide homeostasis is presented in Fig. 15 B. Return of nucleotides to the IMS as AMP and ADP can potentially be limited both by diffusion and the permeability of the outer membrane to nucleotides (i.e., porin function). We estimate that in the presence of a nucleotide flux of 0.5 mmol/s/liter, a fivefold reduction of diffusion rates from those in free water will cause a 10 μM increase of the total cytoplasmic ADP and AMP concentration. Given that the cytoplasmic ADP concentration in murine cardiac myocytes is only 4–5 μM (Dobson and Himmelreich, 2002), it seems essential that porin-mediated nucleotide permeability is very high, and it becomes likely that diffusion through myofilaments will determine importantly the cytoplasmic ADP and AMP concentrations. Notably, AMP kinase is half-maximally activated in rat heart at 1.8 μM cytoplasmic AMP (Frederich and Balschi, 2002), and ADP as well as AMP is an activator of AMP kinase (Steinberg and Hardie, 2023). That the activity of porins modulates AMP kinase activity and subsequently mTOR signaling is already well established (Head et al., 2015), and the present results and calculations (Fig. 15) highlight a need for new approaches to study the permeability of porins in intact myocytes. We conclude that physical factors affecting nucleotide diffusion within myofilaments, factors that likely influence myofilament stiffness, can be important determinants of AMP and ADP signaling in the heart.

ADP and AMP concentration differences between the IMS and the cytoplasm (myofilaments) are determined by three factors: cytoplasmic ATP hydrolysis rate, the diffusivity of ADP and AMP in cytoplasm, and the permeability of the outer mitochondrial membrane to AMP and ADP (i.e., porin activity). (A) A minimal scheme of nucleotide homeostasis, including ATPase activity, adenylate kinase activities (ADK), diffusion, porins, nucleotide exchange at the inner mitochondrial membrane, and ATP synthesis within the matrix space. (B) Predicted ADP and AMP concentration differences between the IMS and the cytoplasm that are independent of simulation model details. With an ATP hydrolysis rate of 0.5 mmol/liter/s, a fivefold slowing of diffusion across myofilaments (Kdiff) causes a 10 μM increase in the total concentration of ADP and AMP. That increase is greater than the known cytoplasmic concentration of ADP in murine myocytes (Dobson and Himmelreich, 2002). It is therefore likely that diffusion (Kdiff) is an important determinant of ADP and AMP concentrations in the myocyte cytoplasm, together with the permeability of the outer mitochondrial membrane (Kporin).
ADP and AMP concentration differences between the IMS and the cytoplasm (myofilaments) are determined by three factors: cytoplasmic ATP hydrolysis rate, the diffusivity of ADP and AMP in cytoplasm, and the permeability of the outer mitochondrial membrane to AMP and ADP (i.e., porin activity). (A) A minimal scheme of nucleotide homeostasis, including ATPase activity, adenylate kinase activities (ADK), diffusion, porins, nucleotide exchange at the inner mitochondrial membrane, and ATP synthesis within the matrix space. (B) Predicted ADP and AMP concentration differences between the IMS and the cytoplasm that are independent of simulation model details. With an ATP hydrolysis rate of 0.5 mmol/liter/s, a fivefold slowing of diffusion across myofilaments (Kdiff) causes a 10 μM increase in the total concentration of ADP and AMP. That increase is greater than the known cytoplasmic concentration of ADP in murine myocytes (Dobson and Himmelreich, 2002). It is therefore likely that diffusion (Kdiff) is an important determinant of ADP and AMP concentrations in the myocyte cytoplasm, together with the permeability of the outer mitochondrial membrane (Kporin).
In conclusion, long-distance diffusion of small solutes becomes strongly restricted over the MW range of 200–1,000 in the cytoplasm of BL6 murine cardiac myocytes. Fluorophores are restricted by 10–50-fold, while ATP diffuses four to eight times slower than in free water. This degree of diffusion restriction can support the generation of cAMP gradients by phosphodiesterases (Bock et al., 2020), albeit only for cAMP concentrations in a low micromolar range. The fact that mitochondria contribute to longitudinal diffusion restriction likely reflects physical placement of myofibrillar mitochondria around myofilaments, thereby optimizing effective nucleotide transfer locally between mitochondria and myofilaments (Guzun et al., 2015). Our work provides no support for the idea that physiological functions of myocytes are modified by limitation of either Na or ATP diffusion. Nor does our work provide any support for the idea that ATP from glycolysis can be preferentially channeled to support sarcolemmal functions (Weiss and Lamp, 1987, 1989). Not surprisingly, nucleotides that are present at low concentrations and turn over rapidly, namely cAMP, AMP, and ADP, will be most markedly influenced by cytoplasmic diffusion restrictions.
Data availability
All data related to this article, including Matlab-based simulations, will be made available by the corresponding senior author upon request.
Acknowledgments
Eduardo Rios served as editor.
We thank Fang-Min Lu for technical help. We thank Marcel Mettlen (UTSouthwestern Quantitative Light Microscopy Core Facility) for imaging advice and for providing slides and confocal spinning disc images presented in Fig. S1. We thank Orson Moe (UTSouthwestern Internal Medicine) for support and discussion.
This work is supported by National Institutes of Health HL119843 and Endowed Professors’ Collaborative Research Support from the Charles Y.C. Pak Foundation.
Author contributions: C. Deisl conceived, performed, and curated experiments, designed and prepared figures, and revised the manuscript. J.H. Chung developed transgenic animals employed, discussed and interpreted data, and critiqued the manuscript. D.W. Hilgemann conceived, performed, analyzed, and curated experiments, prepared figures, and wrote the manuscript.

