RBM10 modulates transcriptome-wide cassette exon splicing. Loss-of-function RBM10 mutations are enriched in thyroid cancers with distant metastases. Analysis of transcriptomes and genes mis-spliced by RBM10 loss showed pro-migratory and RHO/RAC signaling signatures. RBM10 loss increases cell velocity. Cytoskeletal and ECM transcripts subject to exon inclusion events included vinculin (VCL), tenascin C (TNC), and CD44. Knockdown of the VCL exon inclusion transcript in RBM10-null cells reduced cell velocity, whereas knockdown of TNC and CD44 exon inclusion isoforms reduced invasiveness. RAC1-GTP levels were increased in RBM10-null cells. Mouse HrasG12V/Rbm1OKO thyrocytes develop metastases that are reversed by RBM10 expression or by combined knockdown of VCL, CD44, and TNC inclusion isoforms. Thus, RBM10 loss generates exon inclusion in transcripts regulating ECM–cytoskeletal interactions, leading to RAC1 activation and metastatic competency. Moreover, a CRISPR-Cas9 screen for synthetic lethality with RBM10 loss identified NFκB effectors as central to viability, providing a therapeutic target for these lethal thyroid cancers.
Introduction
Most multi-exon human genes undergo alternative splicing (AS), which vastly expands the repertoire of the human proteome (Reixachs-Solé and Eyras, 2022). AS yields multiple isoforms from a single pre-mRNA molecule by exon skipping (or cassette exon exclusion), mutually exclusive exons, alternative 5′ donor sites, alternative 3′ acceptor sites, intron retention, and intron splicing (Lopez, 1998; Croft et al., 2000). Although AS is a common mechanism of gene regulation, the determinants of lineage-specific transcript diversity and how cells maintain stoichiometric control over various isoforms are incompletely understood both in normal and tumorigenic states (Bradley and Anczuków, 2023). Cancer genome studies identified recurrent loss-of-function and hotspot mutations in splicing genes, including SF3B1, U2AF1, SRSF2, FUBP1, and RBM10 (Seiler et al., 2018). These lesions exert transcriptome-wide deregulation of mRNA splicing that promotes tumorigenesis through complex mechanisms that are difficult to unravel since they impact multiple gene targets.
Germline alterations of RBM10 in humans result in TARP syndrome in males (OMIM #311900), characterized by talipes equinovarus (club foot), atrial septal defect, robin sequence (micrognathia), and persistent left superior vena cava. Other manifestations include craniofacial abnormalities, hypotonia, and developmental delay. The underlying mechanism of disease is not well-defined, but embryonic expression of RBM10 in the mouse is found in the branchial arches and limb buds (Johnston et al., 2014), sites where regulation of cell motility plays a fundamental role. The RBM10 gene, a key player in AS that is not a component of the core spliceosome, is located on the X chromosome and is mutated in 10% of non-small cell lung cancer (NSCLC), 8% of bladder cancers, and 11% of non-anaplastic thyroid cancer (ATC) patients who died of metastatic disease (Ibrahimpasic et al., 2017; Seiler et al., 2018). Moreover, Memorial Sloan Kettering (MSK)-Metastatic Events and Tropisms, an integrated pan-cancer cohort study of tumor genomic and clinical outcome data of over 25,000 patients, showed that RBM10 alterations associate with metastatic burden in papillary thyroid cancer (PTC) but not in other tumor types (Nguyen et al., 2022). The specific AS targets of RBM10 that may mediate this metastatic phenotype are unknown.
Cross-linking immunoprecipitation sequencing (CLIP-seq) and RNA sequencing (RNAseq) have been used to identify the splicing targets of RNA-binding motif (RBM) family proteins, including RBM10, primarily in HEK293 and HeLa cells (Wang et al., 2013; Bechara et al., 2013). RBM10 binds to splice sites of specific exons and promotes cassette exon exclusion from target pre-mRNAs, and to a lesser extent, other AS events (Wang et al., 2013; Inoue et al., 2014). RBM10 mutant tumors have globally reduced mRNA levels compared with their RBM10 wild-type comparators (Seiler et al., 2018). Bladder and NSCLC with RBM10 mutations are enriched for cassette exon inclusion events, which, when in frame, can alter the function of a protein. Some of these have been implicated in the pathogenesis of specific cancer types. Upon RBM10 loss, an exon inclusion event in NUMB mRNA leads to decreased NUMB protein levels through hyper-ubiquitination and destabilization and consequent derepression of NOTCH signaling in NSCLC cells (Bechara et al., 2013). In addition, an exon 5 inclusion isoform of EIF4H, which encodes a eukaryotic translation initiation factor, has been shown to be a target of RBM10 loss in lung adenocarcinoma tissues and to mediate in part the growth inhibitory effects of RBM10 overexpression in NSCLC lines (Zhang et al., 2020). A number of other genes, including CREBBP (Wang et al., 2013), BID (Bechara et al., 2013), FAS, BCL-XL (Inoue et al., 2014), and SMN2 (Sutherland et al., 2017), have been shown to be AS targets of RBM10, and some have been implicated in tumorigenesis, primarily based on in vitro silencing of RBM10 in cancer cell lines or HeLa cells (Zhao et al., 2017; Inoue et al., 2014).
In this study, we demonstrate the molecular and biological consequences of RBM10 loss in thyroid cancer employing human cell lines with naturally occurring RBM10 lesions and in cells derived from a genetically engineered mouse model (GEMM) of metastatic thyroid cancer driven by Rbm10 loss. We find that RBM10 loss leads to AS of pre-mRNAs that underpin development of metastases. We reveal a link between RBM10 loss and expression of a specific set of cytoskeletal and extracellular matrix (ECM) isoforms that converge to induce cell motility, invasiveness, and metastatic fitness, primarily through activation of the RAC1 signaling pathway. Additionally, a genome-wide CRISPR-Cas9 screen in RBM10-mutant KTC1 cells identified dropout genes in the NFκB signaling pathway, revealing a sensitivity to NFκB small molecule inhibitors.
Results
Prevalence of RBM10 mutations in thyroid cancer
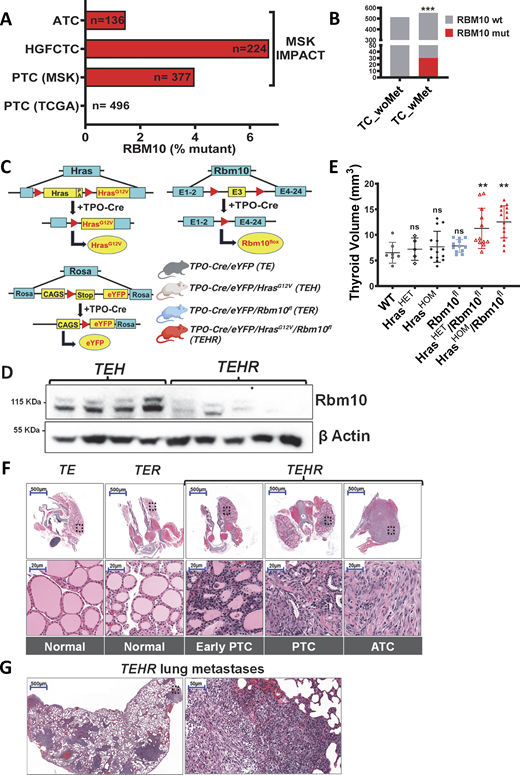
PTC are mostly indolent, well-differentiated tumors associated with good clinical outcomes. Of the 496 patient tumors genotyped in The Cancer Genome Atlas (TCGA) study of PTC, none had RBM10 mutations (Fig. 1 A). Of note, in that series, only eight patients had distant metastases at presentation. By contrast, the prevalence of RBM10 mutations in PTC from the MSK clinical genomic database (MSK-Integrated Molecular Profiling of Actionable Cancer Targets [MSK-IMPACT]), which is enriched for patients with recurrent metastatic disease, was 3.98% (15/377). In high-grade follicular cell–derived thyroid cancer (HGFCTC), the prevalence was 6.7% (15/224), and in ATCs, 1.47% (2/136) (Fig. 1 A). In the combined TCGA and MSK clinical cohorts, RBM10 alterations are significantly enriched (30/553; P < 0.0001) in non-ATC patients (PTC and HGFCTC) with distant metastatic disease as compared with those without distant metastases (0/514) (Fig. 1 B). Most RBM10 alterations in thyroid cancer are frameshift or nonsense mutations (Fig. S1 A), consistent with its role as a tumor suppressor. RBM10 loss co-occurs with MAPK pathway driver oncoproteins, most commonly with RAS (43%) and TERT promoter mutations (81%), and shows a trend toward mutual exclusivity with TP53 mutations (Fig. S1, B and C).
Rbm10 loss promotes mouse thyroid cancer development in the context of oncogenic Hras
To investigate the role of Rbm10 loss in thyroid cancer biology, we developed compound mice with thyroid-specific knockout of Rbm10 either alone or in the context of a knock-in allele of HrasG12V (Fig. 1 C). Although NRAS is the most commonly mutated member of the RAS family in thyroid cancer, HRAS mutations are second in frequency, and an Hras-driven GEMM has been extensively characterized in the thyroid context (Garcia-Rendueles et al., 2015; Untch et al., 2018; Krishnamoorthy et al., 2019). The Rbm10-floxed allele (Rbm10flox) results in a nonfunctional transcript following Cre recombinase-mediated excision of exon 3 (Wang et al., 2023). We crossed Rbm10flox mice with Tpo-Cre/Caggs-LSL-eYFP (“TE”) to generate Tpo-Cre/Caggs-LSL-eYFP/Rbm10flox (“TER”) mice. We then crossed TER with Tpo-Cre/Caggs-LSL-eYFP/FR-HrasG12V (“TEH”) mice, which harbor floxed tandem Hras alleles that upon recombination generate mice with endogenous expression of HrasG12V in thyroid follicular cells (Chen et al., 2009), to generate Tpo-Cre/Caggs-LSL-eYFP/FR-HrasG12V/Rbm10flox (“TEHR”) mice (Fig. 1 C). As TPO-Cre drives expression of Cre recombinase in thyroid follicular cells, the resulting TEHR mice have thyroid-specific loss of Rbm10 (Fig. 1 D), expression of HrasG12V, and Cre-mediated excision of a STOP cassette, enabling YFP expression in thyroid cells.
TER and TEH mice showed no increase in thyroid volume or thyroid cancer development through 12 mo of life (Fig. 1 E and Fig. S1 D). As previously reported, a subset of TEH mice developed mild thyroid hyperplasia after a prolonged latency (Montero-Conde et al., 2017). By contrast, TEHR mice developed a spectrum of thyroid cancer phenotypes by 10–12 mo (Fig. 1 F and Fig. S1 D): 9% had infiltrative tumors without well-developed features of any subtype of human differentiated thyroid cancer, which we termed “early PTC” based on their nuclear features; 12% developed frank PTC, and 76% were ATC-like cancers characterized by pleomorphic nuclei and spindle cell metaplasia. In addition, 18% of this cohort had lung metastases (Fig. 1 G and Fig. S1 D).
RBM10 loss induces cassette exon inclusion isoforms of ECM/cytoskeletal remodeling genes
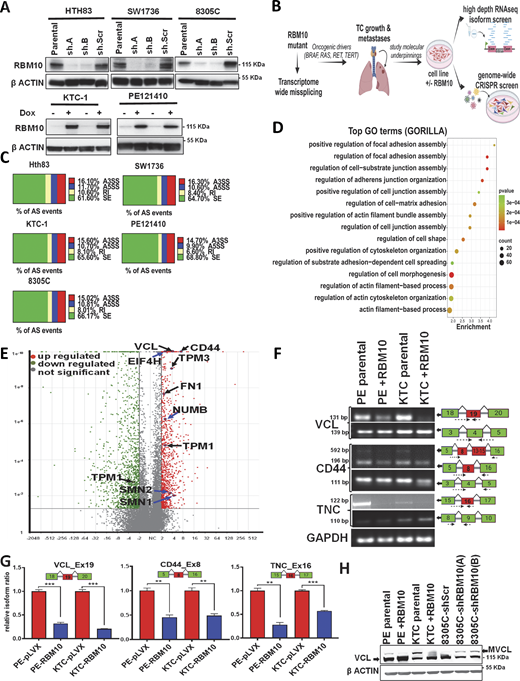
To study the molecular processes underpinning tumorigenic events driven by RBM10 mutations, we generated five isogenic human thyroid cancer cell lines. Two of these are RBM10-null with doxycycline-induced expression of RBM10: KTC1, a BRAFV600E-mutant cell line derived from a male with two somatic RBM10 mutations in the same allele (RBM10_p.A577fs and p.S580R) and PE121410, a CCDC6-RET fusion line from a female with an RBM10_p.Q344fs mutation. HTH83, SW1736, and 8505C are RBM10 WT cell lines with shRNA-mediated silencing of RBM10 (Fig. 2 A). Four of the five cell lines showed an increase in cell proliferation in RBM10-null or knockdown (KD) compared with their respective isogenic RBM10-expressing controls (Fig. S2 A), suggesting that RBM10 loss confers a growth advantage to the cells. The effects of RBM10 loss on growth and metastatic propensity may result from common AS targets driving both mechanisms of tumorigenesis or from distinct sets of AS events. We took a two-pronged approach to investigate this: (1) high-depth RNAseq to uncover AS targets of RBM10 loss potentially involved in promoting metastases; (2) a CRISPR/Cas-9 genome-wide depletion screen designed to identify genes involved in cell growth in RBM10-deficient cells (Fig. 2 B). AS analysis of the RNAseq using the MISO splicing analysis model (Katz et al., 2010) identified 112 alternatively spliced RBM10-targeted genes common to the five isogenic cell lines (Fig. S2 B). The most common AS events associated with RBM10 loss were exon inclusion events (cassette exon inclusion isoforms [SE]) (Fig. 2 C), followed by alternate usage of 3′ splice sites, alternate usage of 5′ splice sites, and retained introns. The predilection for alternative usage of 3′ splice sites is consistent with the preferential binding of RBM10 to the vicinity of 3′ intron-exon boundaries (Wang et al., 2013). As a complementary approach to MISO, we used Partek Flow alt-splicing analysis to identify alternatively spliced genes in the isogenic cell lines with endogenous RBM10 mutations. This identified 1,005 genes with 1,456 differentially spliced isoforms (Table S1) common to PE121410 and KTC1 cells, including 79/112 of those identified by the MISO approach. We consider these two cell lines as the most informative because they had naturally occurring RBM10 mutations. Gene Ontology (GO) analysis confined to genes subject to AS by RBM10 loss shows enriched GO terms linked to the ECM/cytoskeletal remodeling process, with the top GO terms being regulation of focal adhesion assembly, positive regulation of actin filament bundle assembly, and positive regulation of cytoskeleton organization (Fig. 2 D). In addition to the previously reported genes containing cassette-exon splicing targets of RBM10, such as NUMB (Hernández et al., 2016), SMN2 (Sutherland et al., 2017), and EIF4H (Zhang et al., 2020), ECM/cytoskeletal modulating genes were among the top differentially spliced transcripts, e.g., vinculin (VCL), CD44, fibronectin (FN)1, TPM1, and TPM3 (Fig. 2 E).
We identified the RBM10-regulated cassette exons based on the RNAseq data (Fig. S2, C and D) and validated the inclusion isoform transcripts by quantitative RT-PCR (qRT-PCR) using junction-specific primers, normalized to the respective gene-specific expression using primers against constitutive exons (Fig. 2, F and G). This revealed the following ECM/cytoskeletal genes with cassette exons regulated by RBM10: (1) exon 19 inclusion of VCL (hereafter called as VCL_Ex19) (Fig. 2 H); (2) exon 8 inclusion isoforms of CD44 (collectively called as CD44_Ex8), one consisting of the exon 8 inclusion alone and the other with combined inclusions of exon 8 and exons 13–15 (Fig. 2, F and G); (3) exon 16 inclusion isoform of tenascin C (TNC) (TNC_Ex16) (Fig. 2, F and G).
VCL is a modulator of focal adhesion assembly, anchorage of F-actin to the membrane, and cytoskeletal organization (Lee et al., 2019). VCL is encoded by 21 exons (Fig. S2 E). Inclusion of the cassette exon 19 in RBM10-null cells generates an isoform called metavinculin (MVCL or VCL_Ex19 in this manuscript), characterized by a 68-residue insertion in the actin-binding tail of the protein (Byrne et al., 1992). MVCL is expressed in cardiac and smooth muscle at sub-stoichiometric levels relative to VCL. MVCL expression leads to fewer but larger focal adhesions per cell and to enhancement of cell motility (Lee et al., 2019). Germline mutations leading to substitutions within the MVCL 68–amino acid insertion are associated with congenital cardiomyopathies (Olson et al., 2002). Our data point to a central role for RBM10 in regulating the AS of VCL mRNA, thus controlling the balance of VCL to MVCL expression levels (Fig. 2 H).
CD44 is a multifunctional cell surface adhesion non-kinase receptor involved in cell–cell and cell–matrix interactions, encoded by 20 exons in humans, 10 of which are constitutive (first 5 and last 5) and 10 that are variable (middle 10) (Naor et al., 1997) (Fig. S2 E). The encoded standard (CD44s) and variable (CD44v) isoforms are implicated in the biology of multiple cancer types (Chen et al., 2018). We show that two of the exon-8 inclusion isoforms (CD44v3 and CD44v3, v8–10; collectively called as CD44_EX8 in this manuscript) are AS targets of RBM10 (Fig. 2 F and Fig. S2 F).
TNC, one of the candidates from the MISO analysis, is encoded by 28 exons, 7 of which are variable (Fig. S2 E). RT-PCR quantification of each variable exon revealed that RBM10-null cells differentially expressed a transcript including exon 16 (TNC_EX16) (Fig. 2 F and Fig. S2 F), which encodes a tandemly arrayed FN-binding domain that promotes cell detachment by competing with FN for interaction with integrins (Huang et al., 2001).
To determine whether the effects of RBM10 on AS of these mRNAs was through direct binding or through indirect mechanisms, we analyzed two publicly available CLIP-seq data: a photoactivatable ribonucleoside enhanced crosslinking and immunoprecipitation (PAR-CLIP) study performed in HEK293 cells (Wang et al., 2013) and the eCLIP dataset from a study in MOLM13 cells (Wang et al., 2023). RBM10 PAR-CLIP data from HEK293 cells showed RBM10 CLIP-tags over the gene body of VCL, including in the adjacent introns of exon 19 (Fig. S2 G). Consistent with this, Wang et al. confirmed that the exon 19 inclusion isoform was differentially expressed in response to perturbations of RBM10 expression. Accordingly, the effects of RBM10 on the VCL exon 19 splicing are through direct binding and likely account for the functionally relevant ratio of MVCL-to-VCL levels. This AS regulation is likely to be lineage dependent, since we did not identify significant VCL-exon 19 RBM10 peaks in MOLM13 cells (Fig. S2 H). By contrast, the RBM10 CLIP peaks in the CD44 gene body did not include introns adjacent to exon 8 or exons 13–15 in the MOLM13 study (Fig. S2 I), whereas in the HEK293 cells there were no RBM10 peaks identified in this gene. We conclude that the effects of RBM10 on CD44 AS are likely indirect. The information on TNC is inconclusive as there were no RBM10 CLIP peaks in the TNC transcript in either study.
RBM10 loss promotes metastatic properties mediated by exon inclusion isoforms of VCL, CD44, and TNC
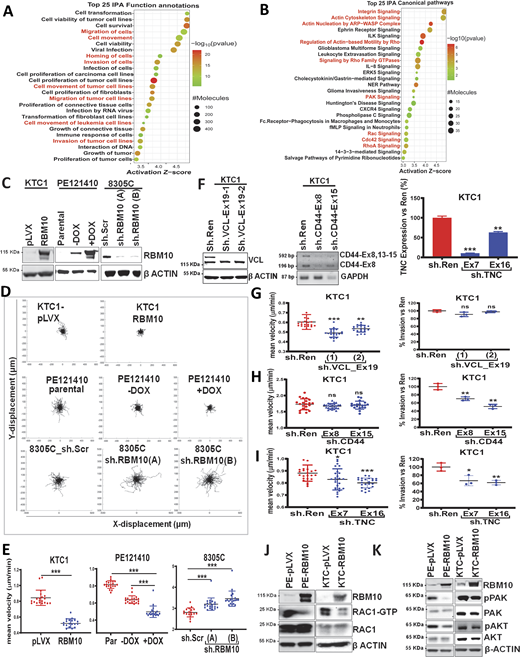
To explore potential mechanisms underpinning the effects of RBM10 loss on thyroid cancer metastases, we performed Ingenuity Pathway Analysis (IPA) on bulk RNAseq on parental and RBM10-expressing isogenic PE121410 cells. This revealed a strong signal for functional annotations involving cell migration and invasion (Fig. 3 A) and for modulation of ECM and cytoskeleton effector pathways, e.g., actin nucleation, actin-based motility, remodeling of epithelial adherens junctions, integrin, actin cytoskeletal, and Rho GTPase signaling (Fig. 3 B). Prompted by these findings, we next asked whether RBM10 loss conferred cells with a pro-migratory phenotype. For this, we monitored individual cell migration tracks employing time-lapse imaging and calculated migration velocity in the RBM10 isogenic KTC1, PE121410, and 8305C cell lines (Fig. 3 C). Cells with endogenous RBM10 loss-of-function mutations (KTC1 and PE121410) and shRNA-mediated KD of RBM10 display longer cell migratory tracks (Fig. 3 D) compared with the respective RBM10-expressing comparators and higher mean migration velocity (Fig. 3 E).
We next asked whether individual ECM and cytoskeletal exon-inclusion events driven by RBM10 loss impacted cell migration and/or invasion. For this, we created isoform-specific stable KD with short hairpins against the inclusion exons of VCL (sh.VCL_Ex19), CD44 (sh.CD44_Ex8 and sh.CD44_Ex15), and TNC (sh.TNC_Ex7 and sh.TNC_Ex16) in KTC1 cells (Fig. 3, E–G). KD of the Ex19 inclusion isoform of VCL with two distinct shRNAs silenced expression of MVCL and led to decreased cell migration velocity but elicited no effect on invasiveness as assessed by time-lapse imaging and a transwell invasion assay, respectively (Fig. 3 F, left panel and Fig.3 G). By contrast, KD of CD44_Ex8 inclusion isoforms decreased cell invasion without impacting migration velocity (Fig. 3 F, middle panel and Fig. 3 H), whereas KD of a constitutive TNC exon (TNC_Ex7) as well as the TNC_EX16 inclusion isoform decreased both migration and invasion (Fig. 3 F, right panel and Fig. 3 I). The isoform-specific KDs in KTC1 cells enabled a profound inhibition of the targeted splice variant (Fig. S3 A). Although we did see a ∼25% decline in total mRNA abundance of the respective transcripts (Fig. S3 B), this is most consistent with the deletion of the AS variants, as opposed to some decrease in total mRNA levels. Based on this, we hypothesized that RBM10 target genes may contribute to metastatic fitness by illegitimately expressing splice inclusion isoforms of protein intermediates that collectively modulate ECM/cytoskeletal interactions.
RBM10 loss leads to constitutive activation of RAC1-GTP levels
Rho GTPases relay extracellular signals to regulate actin dynamics, gene transcription, cell cycle progression, cell adhesion, motility, and invasion (Jaffe and Hall, 2005; Tang et al., 2008). Among Rho GTPases, RAC1 plays a major role in cell motility by promoting lamellipodia formation, focal adhesions, and matrix metalloprotease expression (Ridley et al., 1992). RBM10-null human PE121410 and KTC1 cells transduced with an empty vector have markedly higher RAC1-GTP levels, which are suppressed following RBM10 expression (Fig. 3 J). Increased RAC1-GTP levels in PE121410 cells result in phosphorylation of its downstream effectors, including PAK and AKT, which was attenuated by RBM10 expression (Fig. 3 K). Interestingly, we previously reported that KTC1 cells harbor an endogenous RAC1-D63V mutation (Landa et al., 2016). The D63 residue lies within the highly conserved switch II region of RAC1 that is involved in effector binding to PAK, WASP, and ACK (Mott et al., 1999). Based on the RAC1 crystal structure, D63 is also in direct contact with the binding site for RAC1-GAP (Stebbins and Galán, 2000). Thus, D63 could contribute to both effector function and regulation of GDP-GTP exchange, and mutated residues at this site would be predicted to be activating in nature (Caye et al., 2015; Murphy et al., 2021). Accordingly, expression of RBM10 in KTC1 cells partially inhibited downstream effectors of RAC1-GTP compared with isogenic PE121410 cells.
ECM and cytoskeletal splicing targets of RBM10 govern metastatic propensity
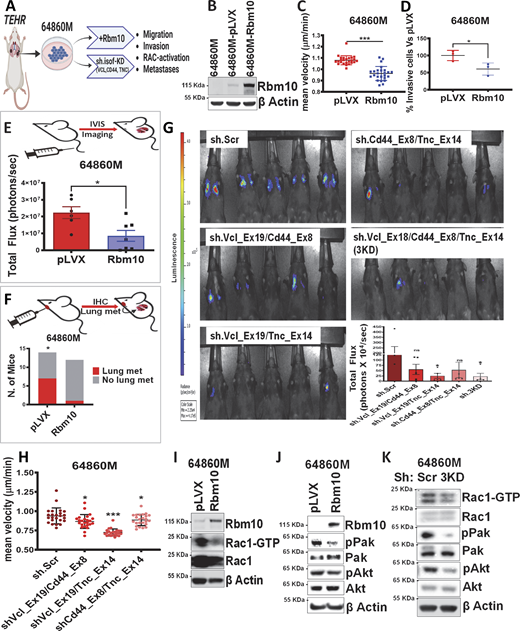
We next tested the role of Rbm10 and of mouse exon inclusion isoforms that were orthologous to their corresponding human genes (i.e., Vcl_Ex19 [MVcl], Cd44_EX8, and Tnc_EX14) on development of metastases in vivo. For this, we used a cell line derived from a lung metastasis of a TEHR mouse thyroid cancer (64860M), on which we performed rescue experiments by either Rbm10 re-expression or by knocking down the corresponding splice inclusion, alone or in combination (Fig. 4, A and B). Expression of Rbm10 decreased migration velocity (Fig. 4 C) and invasiveness (Fig. 4 D) compared with empty vector–transfected cells. Accordingly, in vivo metastatic efficiency of Luc+ 64860M isogenic cells via either tail vein (TV) or orthotopic injection into mouse thyroid showed that Rbm10 re-expression decreased metastatic efficiency (Fig. 4, E and F; and Fig. S4, A and B). We next investigated whether KD of the three exon inclusion isoforms, either individually or in combination, impacted metastatic efficiency of 64860M cells. For this we generated stable KDs in Luc+ 64860M cells of the exon inclusion isoforms individually: shVcl_Ex19, shCd44_Ex8, and shTnc_Ex14; as double KDs: shVcl_Ex19/shCd44_Ex8, shVcl_Ex19/shTnc_Ex14, and shCd44_Ex8/shTnc_Ex14; or as a triple KDs: shVcl_Ex19/shCd44_Ex8/shTnc_Ex14 (Fig. S4, C–E). The individual KDs did not show a significant difference in metastatic efficiency in vivo as tested by TV injection (Fig. S4 F). Short hairpins against the combined VCL_Ex19/Tnc-Ex14 inclusion isoforms partially suppressed metastases in vivo, whereas the other two combinations (sh.Vcl_Ex19/CdD44_Ex8 and sh.Cd44_Ex8/Tnc_Ex14) showed a nonsignificant inhibitory trend (Fig. 4 G). Consistent with this, time-lapse imaging showed that the shVcl_Ex19/shTnc_Ex14 double KD was the most effective at decreasing cell motility amongst individual and double KDs tested (Fig. 4 H). Notably, the triple KD had the most potent metastases suppressive effect in vivo (Fig. 4 G).
As all three RBM10 target genes studied here operate upstream of Rho-GTPase signaling, we tested the impact of the triple KD on RAC1 activation in 64860M cells. Empty vector–transfected 64860M cells have high Rac1-GTP levels and downstream signaling that is suppressed by dox-induced Rbm10 expression (Fig. 4, I and J). Moreover, 64860M-sh.3KD cells had attenuated RAC1-GTP levels and downstream effector signaling compared with a scramble hairpin control (Fig. 4 K), providing a plausible mechanistic relationship between ECM and cytoskeletal AS targets of RBM10 loss, RAC1 activation, downstream signaling, cell motility, invasiveness, and metastatic propensity.
RBM10 loss confers synthetic lethal interactions with nodes in the NFκB pathway
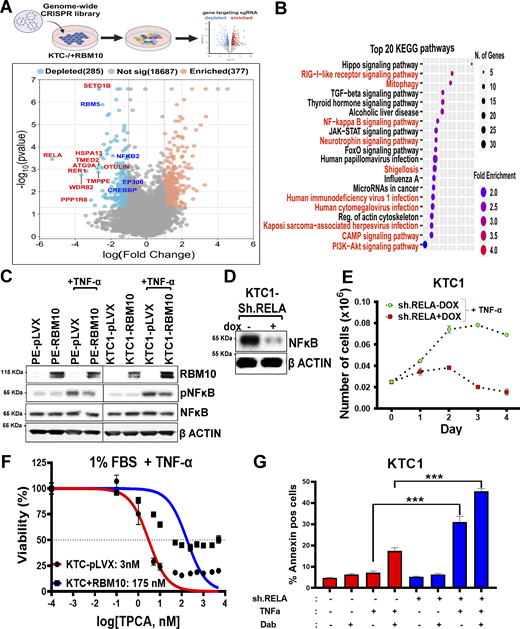
Besides the effects on cell movement and invasion, loss of function of this gene led to increased growth in vivo and in vitro (Fig. 1 E and Fig. S2 A). Transcriptomic analysis of RBM10-null compared with RBM10 re-expressing PE121410 cells showed enrichment in functional annotations for cell proliferation with concomitant inhibition of apoptotic and autophagic cancer cell death-related functions and of canonical cell cycle checkpoint-related pathways (Fig. 3 A; and Fig. S3, C and D). To identify mediators of cell growth and anti-apoptotic effects caused by RBM10 loss, we performed a genome-wide CRISPR/Cas9 dropout screen containing 77,441 single guide RNAs (sgRNAs) targeting 19,115 genes (Sanson et al., 2018). Empty vector (pLVX) and RBM10-expressing KTC1 cells were transduced with the sgRNA library at a low multiplicity of infection (MOI = 0.3), followed by hygromycin selection and maintenance in culture for 20 days to enable changes in sgRNA abundance (Fig. 5 A). We identified 987 genes significantly depleted in KTC1-pLVX versus KTC1-RBM10–expressing cells (P < 0.05) (Table S2). Of note, sgRNAs targeting RBM5, a paralog of RBM10 with which it shares overlapping RNA targets (Sun et al., 2017; Loiselle et al., 2017), was among the top depleted hits, suggesting that co-deletion of these two AS regulating genes lead to synthetic lethality. Kyoto Encyclopedia of Genes and Genomes (KEGG) pathway analysis revealed that the depleted hits in KTC1-pLVX cells were associated with pathways involving NFκB activation, including the terms NFκB signaling pathway, RIG-1–like receptor signaling, mitophagy, and viral infection–induced signaling (Fig. 5 B).
RELA (NFκB) topped the list of dropout hits within the NFκB signaling network in terms of negative fold change in KTC1-pLVX versus KTC1-RBM10 cells (logFC = −5.28; P = 0.00035) (Fig. 5 A) and scored in all NFκB-relevant KEGG pathways (Table S3). In addition to RELA, NFKB2, which binds to RELB to mediate noncanonical NFκB signaling, was also among the significantly depleted hits. We were unable to identify signaling nodes upstream of RELA subject to RBM10-dependent cassette exon AS. Interestingly, CREBBP and its homolog p300, transcriptional coactivators, and lysine acetyltransferases that play an important role in NFκB-mediated transcription, were among the dropout hits in the CRISPR screen. CREBBP exhibits AS of exon 11 in an RBM10-dependent manner (Fig. S5 A). RELA competes with CREB for binding to the amino-terminal domain of CREBBP (Parry and Mackman, 1997), but the domain encoded by exon 11 is distal to the interacting region, so the functional consequences of this exon inclusion are unknown.
The association of RBM10 loss with NFκB activation is supported by the fact that PE121410 and KTC1 cells show higher NFκB transcriptional output scores as compared to their respective isogenic RBM10-expressing controls (Fig. S5 B). TNFα-induced phospho-p65 levels were attenuated by RBM10 re-expression in PE121410 and KTC1 cells, consistent with derepression of NFκB signaling by RBM10 loss (Fig. 5 C). Dox-induced KD of RELA decreased growth of Rbm10-null KTC1 cells (Fig. 5, D and E), which also displayed higher sensitivity to the NFκB inhibitor TPCA-1 compared with KTC1-RBM10 cells (Fig. 5 F). Furthermore, treatment with TNFα, alone or in combination with the RAF kinase inhibitor dabrafenib, modestly induced cell death in KTC1 cells as assessed by flow cytometry for annexin (Fig. 5 G). By contrast, dox-induced KD of RELA showed a marked induction of apoptosis by TNFα itself, which was further accentuated by combined treatment with dabrafenib. Taken together, these data indicate that NFκB activation in RBM10-deficient cells protects cells from TNFα-induced apoptosis and that genetic and pharmacological targeting of this pathway results in a synthetic lethal interaction.
Discussion
Most cancers exhibit widespread RNA splicing changes compared with the untransformed cells from which they are derived (Kahles et al., 2018). The mechanisms accounting for mRNA mis-splicing include somatic gain- or loss-of-function mutations of genes encoding key splicing regulatory proteins, altered expression of splicing regulators, and cis-acting mutations that modify splicing of genes affected by these mutations (Bradley and Anczuków, 2023; Dvinge et al., 2016). The mutual exclusivity of splicing genetic defects within a given tumor type suggests that cancer cells rely on genome-wide dysfunctional splicing to determine their phenotype (Seiler et al., 2018). RBM10 mutations were noted to be enriched in patients dying of non-ATC (Ibrahimpasic et al., 2017). Subsequently, a pan-cancer study of genes associated with metastatic disease in 25,000 patients revealed a significant increase in RBM10 mutations in PTC patients with distant metastases genotyped at our institution, where thyroid cancer profiling is primarily performed in patients requiring systemic therapies for advanced disease (Nguyen et al., 2022). Interestingly, no association was found between RBM10 mutations and metastatic disease in any other cancer type in this study, including in patients with NSCLC, despite the higher prevalence of RBM10 mutations in lung compared with thyroid cancers (Imielinski et al., 2012). Among other AS changes, RBM10 loss in NSCLC results in the inclusion of exon 9 of NUMB, which destabilizes this NOTCH signaling repressor, leading to activation of the NOTCH pathway and stimulation of cell growth (Bechara et al., 2013). Enrichment of the exon 9 inclusion isoform of NUMB was also present in RBM10-mutant thyroid cancer cell lines, but by contrast to lung, this was not associated with increased NOTCH pathway transcriptional output. Moreover, no NOTCH pathway genes scored in the CRISPR/Cas9 dropout screen for growth dependencies conferred by RBM10 loss. Thus, though many RBM10 AS targets may be common between tumor types, their phenotypic consequences appear to be lineage dependent.
RNAseq of human RBM10 isogenic thyroid cancer cell lines revealed that 2–6% of alternatively spliced cassette exons are differentially spliced following RBM10 loss, confirming that RBM10 acts as a splicing repressor, as opposed to perturbations of other critical spliceosome factors such as SF3B1, SRSF2, and U2AF1, which disrupt global splicing and lead to widespread retention of constitutive introns or AS of normally constitutive junctions (Dvinge and Bradley, 2015). Identification of RBM10 AS targets involved in disease pathogenesis is challenging, since individual cassette inclusion isoforms that are retained after RBM10 loss may be normally expressed in sub-stoichiometric ratios, thus precluding simple phenotypic annotation. Several lines of evidence point to a key role of RBM10 in modulating splicing of genes involved in promoting metastatic disease: (1) GO analysis of global transcriptomes as well as transcripts subject to RBM10-dependent AS in isogenic human thyroid cancer cell lines showed enrichment of pathways involved in cell adhesion, integrin binding, and structural components of the cytoskeleton. (2) RBM10-deficient cells display potent activation of the G protein RAC1, which transduces signals emanating from ECM interactions with integrins to promote formation of lamellipodia and cell motility (Minden et al., 1995). (3) Deletion of RBM10-regulated exon inclusion isoforms of the ECM protein TNC, the cell surface glycoprotein CD44, and the cytoskeletal protein VCL each individually decreases either cell motility, invasiveness, or both in RBM10-deficient human thyroid cancer cells. (4) Combined deletion of all three isoforms from a lung metastatic mouse HrasG12V/Rbm10flox cell line inhibits RAC1-GTP and its downstream signaling. (5) Whereas deletion of individual exon inclusion isoforms from Rbm10 mutant cells was insufficient to abrogate the development of lung metastases following TV injection, dual or triple isoform KD markedly inhibited metastatic burden. (6) This points to cooperative effects of at least three protein variants controlled by RBM10-dependent AS in both human and mouse thyroid cancers, which collectively impact a common signaling program driving cell motility and invasiveness.
The congenital malformations of TARP syndrome in humans include micrognathia and limb defects, such as talipes equinovarus and, less frequently, syndactyly (Kumps et al., 2021; Johnston et al., 2010; Niceta et al., 2019). Interestingly, murine Rbm10 is expressed in mid-gestation embryos in the first and second branchial arches and in limb buds. Expression of Rbm10 in the first branchial arch, which gives rise to the mandible, is highest at embryonic days E9.5 and E10.5 and declines thereafter (Johnston et al., 2010). Although the mechanisms accounting for the underdeveloped jaw and cleft palate of TARP syndrome children are unknown, the loss of the temporal sequence of Rbm10 expression in these developing structures may account for this. It is also plausible that it may be mediated in part through AS of genes involved in migration and tissue remodeling, such as those we identified in thyroid cancers with RBM10 loss.
Numerous studies have highlighted the importance of TNC in metastasis (Lowy and Oskarsson, 2015; Sun et al., 2018; Oskarsson et al., 2011; Jensen et al., 2014). It has been studied in mechanistic detail in breast cancer, where TNC expression in breast cancer cells promotes their survival and outgrowth in the metastatic niche (Oskarsson et al., 2011). The TNC oligomer ranges in size between 180 and 300 kDa. Nine of its 17 FN type III repeats, encoded by exons 10–16, are subject to AS, generating a large variety of isoforms that are differentially expressed in a lineage-specific manner during development and in various pathological contexts (Guttery et al., 2010). The large size of the TNC oligomer has hampered rigorous structure-function studies, which have relied primarily on recombinant TNC fragments. Consistent with our findings, isoforms that include exon 16 are enriched in invasive breast cancers (Guttery et al., 2010).
CD44 is a cell surface glycoprotein monomer involved in cell adhesion expressed in multiple cell types, which serves as a canonical receptor for hyaluronic acid but also interacts with other proteins, including osteopontin and matrix metalloproteases (Aruffo et al., 1990; Primeaux et al., 2022). It is subject to extensive AS, which alters domains involved in critical protein and cell–cell interactions (Primeaux et al., 2022). Colorectal cancer cell lines showing phenotypic plasticity between epithelial and mesenchymal states in vitro express RNA-binding proteins downstream of the EMT master transcription factor Zeb1, including ESRP1 and several members of the RBM family, which regulate AS of CD44 in ways that favor metastatic competency (Xu et al., 2022). ESRP1 also regulates splicing of CD44 into a variant containing exon 8, which promotes metastatic colonization of breast cancers in lung (Yae et al., 2012). This aligns well with our data showing that RBM10 loss results in retention of exon 8–containing CD44 transcripts, which favor development of lung metastases. Taken together, this is consistent with a process directed by transcriptional drivers of EMT, which modulate expression of RNA-binding proteins that in turn generate AS events that alter key components of the proteome to promote metastases.
VCL is a key player in focal adhesion-mediated regulation of cell behavior (Humphries et al., 2007). Its exon inclusion isoform MVCL is preferentially expressed in smooth and cardiac muscle cells (Belkin et al., 1988a, 1988b), where it negatively impacts F-actin bundling by VCL and increases cell migration velocity (Lee et al., 2019). Germline mutations within the 68-amino acid MVCL insert are associated with hypertrophic and dilated cardiomyopathy, highlighting its functional significance (Maeda et al., 1997; Olson et al., 2002). We show that RBM10 loss alters the VCL/MVCL ratio to induce cell motility, an isoform switch that had not been previously implicated in cancer pathogenesis. Besides its effects on cell migration and invasiveness, constitutive RAC1 activation can also promote cell growth (Ma et al., 2009). Activating mutations of RAC1 are found in patients with ATC (Pozdeyev et al., 2018) and have been implicated in acquired resistance of BRAF-mutant PTC to MAPK inhibitors and in promoting anaplastic transformation (Bagheri-Yarmand et al., 2021). Despite this the whole-genome CRISPR screen for genes required for the viability of RBM10-null thyroid cancer cells did not identify effectors in the RAC1 signaling pathway among its top hits (PAK2, a downstream effector of RAC1, was a notable exception). Instead, RELA was the highest scoring hit as well as several other NFκB-related genes, and KEGG analysis of the dropout genes primarily identified pathways associated with NFκB activation. Nuclear localization of p65-RELA in PTC and ATC has been shown by several groups (Pacifico et al., 2004; Mitsiades et al., 2006). In addition, NFκB activation controls thyroid cell growth, migration, and invasiveness in subsets of human thyroid cancer cell lines (Cormier et al., 2023). Our data show that RBM10 loss renders thyroid cancer cells dependent on the NFκB pathway for viability. This provides a possible therapeutic strategy for these aggressive cancers, for instance, by targeting TNFα, which is both an activator and an effector of the NFκB pathway, most likely in the context of combination therapies (Yu et al., 2020).
In summary, RBM10 loss in thyroid cancer is associated with disease progression and promotion of metastatic fitness through exon inclusion events in transcripts encoding proteins involved in cell motility and invasiveness, which result in constitutive activation of RAC1. The tumor suppressor role of RBM10 may thus exert its effects through restricting these EMT-related properties and by impairing growth inputs transduced through cancer cell–autonomous NFκB signaling.
Materials and methods
Patient tumor samples
MSK thyroid cancer patient tumors analyzed in this study were consented for next-generation sequencing testing under MSK IRB# 12–245, and clinical data were collected retrospectively under MSK IRB# 16–1400. A total of 785 PTC, HGFCTC, and ATC samples from 724 unique patients were included in this study. The samples were collected from 1999 to 2023 and were sequenced at MSK Cancer Center (MSKCC) from 2014 to 2023. HGFCTC was defined by histological and/or immunohistochemical evidence of follicular cell differentiation and presence of tumor necrosis and/or ≥5 mitoses per 10 high-power fields (×400) (Hiltzik et al., 2006). All tumors were profiled using the MSK-IMPACT clinical sequencing assay, a hybridization capture-based, next-generation sequencing platform (Cheng et al., 2015). Patient demographics, tumor histology, metastatic status, metastatic sites, treatment, and outcomes were determined by retrospective review of patient charts. Altogether, 737/785 samples were subjected to mutation analysis after filtering out multiple samples taken from the same patients. For mutation analysis, patient samples were sorted for the following histotypes and for the presence of distant metastatic disease: PTC with metastases (PTC_wMet; n = 321); PTC without metastases (PTC_woMet; n = 56); HGFCTC (n = 224; all with metastatic disease); and ATC (n = 136; all with metastatic disease). In addition, among the 496 samples from TCGA (Cancer Genome Atlas Research Network, 2014), 466 with known clinical characteristics were sorted for PTC with metastases (n = 8) and PTC without metastases (n = 458). These were pooled with the respective MSK PTC cohorts for RBM10 mutation analysis.
Oncoprint and lollipop plots for RBM10 mutations on the sorted MSK cohort were generated using cBioPortal (Gao et al., 2013). The association of RBM10 mutation with metastatic disease was obtained by contingency analyses using GraphPad Prism and a two-sided Fisher’s exact test for statistical significance. The thyroid cancer groups with (TC_wMet) and without metastases (TC_woMet) were obtained by combining TCGA PTC and the MSK cohorts of PTC and HGFCTC.
Generation of thyroid-specific Rbm10 knockout mice
We crossed Tpo-Cre (Kusakabe et al., 2004), FR-HrasG12V (Chen et al., 2009), Rbm10flox (Wang et al., 2023), and LSL-eYFP mice (stock number 007903; Jackson Laboratory) to generate quadruple Tpo-Cre/eYFP/Hras/Rbm10 (TEHR) transgenics, and the following control lines: Tpo-Cre/eYFP (TE or WT), Tpo-Cre/eYFP/Hras (TEH), and Tpo-Cre/eYFP/Rbm10 (TER). These multi-transgenic mice result in Tpo-Cre–driven thyroid-specific loss of Rbm10, endogenous expression levels of HrasG12V (Het or Homo), and expression of YFP in thyroid follicular cells. Unless indicated, HrasG12V is homozygous in the TEH and TEHR mice; Rbm10 in the TER and TEHR mice are floxed either one or two alleles depending on the sex of the mice (female: Rbm10fl/fl and male: Rbm10fl/y), herein referred as Rbm10flox irrespective of sex. DNA extractions from the toe clips were used for genotyping. Genotypes were determined by PCR using primers listed in Table S4. Mice were in mixed genetic backgrounds. Animal care and all procedures were approved by the MSKCC Institutional Animal Care and Use Committee.
Ultrasound imaging
Mice were anesthetized by inhalation of 1.5–2.5% isoflurane with 2% O2, the neck fur removed with defoliating agent, and placed on the heated stage. An aqueous ultrasonic gel was applied over the neck and thyroid tumors were imaged with the VisualSonics Vevo 770 In Vivo High-Resolution Micro-Imaging System (VisualSonics Inc.). Using the Vevo 770 scan module, the entire thyroid bed was imaged with captures every 250 μm. Using the instrument’s software, the volume was calculated by manually tracing the margin of the tumor every 250 μm.
Histology
Thyroid cancer histological characterization was performed at 6 mo to 1-year-old mice or when recommended by the Research Animal Resource Center veterinary staff because of tumor burden. Dissected mouse thyroids and lungs were fixed in 4% paraformaldehyde, embedded in paraffin, sectioned, and stained with H&E by the MSK Molecular Cytology Core Facility. Histologic diagnosis was performed by two thyroid pathologists (B. Xu and R.A. Ghossein) blinded to mouse genotype. Slides were scanned with Pannoramic Flash 250 (3DHistech), and whole thyroid lobes or regions of interest were viewed using CaseViewer and exported as tiff images.
Cell lines
KTC1, PE121410, HTH83, SW1736, and 8305C human thyroid cancer cell lines were grown in RPMI medium, and HEK293FT cells were grown in DMEM, and all were supplemented with 10% of FBS and 1% penicillin/streptomycin/L-glutamine (PSG; #400-110; Gemini) and maintained at 37°C and 5% CO2 in a humidified atmosphere. Cell lines were previously genotyped by targeted cancer exome sequencing (MSK-IMPACT platform) (Landa et al., 2019), tested negative for mycoplasma, and were authenticated using short tandem repeat and single-nucleotide polymorphism analyses. Mouse thyroid tumor cell lines were derived as previously described (Saqcena et al., 2021). Briefly, the TEHR mouse metastatic cell line 64860M was generated from a lung metastasis that was dissected, minced in F12 medium, and resuspended in 10 ml of digestion medium (minimum essential media containing 112 U/ml type I collagenase; cat. #CLS-1; Worthington), 1.2 U/ml dispase (catalog no. 17105-041; Gibco), penicillin (50 U/ml), and streptomycin (50 mg/ml). Cells were incubated at 37°C for 60 min with vigorous shaking, after which cells were spun down and resuspended in Coon’s modified F12 medium. The cell suspension was then sorted for YFP to eliminate non-thyrocytes and YFP+ cells plated in F12 medium supplemented with 5% FBS and 1% PSG. Cells were passaged at least five times and tested for mycoplasma prior to use in experiments.
RBM10 overexpression and KD
KTC1 and PE121410 cells with RBM10 loss-of-function mutations were used to generate dox-inducible RBM10-expressing cells (KTC-RBM10 and PE-RBM10) by transducing the pLVX-Tet-On Advanced vector system (Clontech) with RBM10 cDNA (NM_005676, Origene) cloned into the pLVX-tight-Puro vector. Empty pLVX-puro vector-transduced cells were used as controls (KTC-pLVX and PE-pLVX). The HrasG12V/Rbm10flox mouse metastatic 64860M cells were used to generate Rbm10-expressing cells by transducing pLVX-puro vector cloned with mouse Rbm10 cDNA (NM_145627, Origene) (64860M-Rbm10). Control cells were transduced with empty vector (64860M-pLVX). RBM10 KD was performed in selected human thyroid cancer cells: HTH83, SW1736, and 8305C. We used MISSION shRNA lentiviral vectors (pLKO_TRC005): TRCN0000233277 (sh.RBM10-A) and TRCN0000233278 (sh.RBM10-B) and the empty pLKO vector (sh.cont), all purchased from Sigma-Aldrich. To create cells with dox-inducible RELA shRNAs, we first transduced KTC1 cells with pLVX-Tet-On Advanced vector to obtain KTC1-rtTA cells, which were then infected with pLV-miR30, TRE-driven dual shRNAs targeting human RELA, which were custom-designed and synthesized by VectorBuilder Inc. (Table S5). For lentiviral production, HEK293FT cells were transfected with lentiviral constructs using the Mission Lentiviral Packing Mix (Sigma-Aldrich). After media change at 24 h, viral supernatant was collected at 48 and 72 h after transfection; the lentiviral collections were pooled, filtered (0.45 µm), and stored at −80°C. Stable lines were generated by infecting the target cells with the corresponding viral supernatants in the presence of 8 μg/ml polybrene (Sigma-Aldrich) overnight. After 24 h, recovery in complete medium, cells were selected in 1 μg/ml puromycin with or without 500 μg/ml G418, as required. Expression of the target protein (RBM10 or RELA) was tested in multiple clones or in mass cultures. Depending on the construct, samples with >80% KD (for RBM10 or RELA shRNAs) or near endogenous levels of RBM10 expression (for dox-inducible RBM10) as determined by immunoblotting were selected for further experiments.
Exon inclusion isoform-specific KD
Isoform-specific KDs were generated via targeted KD of the indicated exon inclusion isoforms in human RBM10-mutant KTC1 cells and in Luc+64860M cells. We designed shRNAmir hairpins with SplashRNA (http://splashrna.mskcc.org/) targeting the following human/mouse exons: human/mouse exon 19 inclusion transcripts of VCL (VCL_Ex19/Vcl_Ex19), exon 16 inclusion transcript of human TNC (TNC_Ex16), the mouse equivalent exon 14 of Tnc (Tnc_Ex14), and human/mouse exon 8 inclusion transcripts of CD44. A similar approach was used to design three additional shRNAs against VCL_Ex19, CD44_Ex11, CD44_EX15, and TNC_Ex7. The 97-bp shRNAmirs were synthesized, PCR amplified, and cloned into the lentiviral miR-E–based SREP (pRRL) vector as previously described (Fellmann et al., 2013).
For combined isoform KD in Luc+64860M mouse cells, we used one of the above validated shRNAmirs for each target: Vcl_Ex19, Cd44_Ex8, and Tnc_Ex14, which were custom-designed into lentiviral miR30-based dual and triple shRNA expression vectors (pLV[miR30]-Puro-SFFV>DsRed_shRNAs) constructed by VectorBuilder. The following dual and triple isoform-specific shRNA vectors targeting the transcripts expressing the following mouse gene exons were generated: shVcl_Ex19/shCd44_Ex8, shVcl_Ex19/shTnc_Ex14, shCd44_Ex8/shTnc_Ex14, and shVcl_Ex19/shCd44_Ex8/shTnc_Ex14 (sh.3KD). Sh.Scramble was used as control vector. All shRNAs and additional vector information are described in Table S5. Human and mouse cells with stable isoform-specific KDs were created via transduction of the corresponding lentiviral particles. Cells were sorted for RFP as a reporter of shRNA expression to increase KD efficiency.
Western blotting
Cells were lysed in 1x radioimmunoprecipitation assay (RIPA) Buffer (Millipore) supplemented with protease (Roche) and phosphatase inhibitor cocktails I and II (Sigma-Aldrich). Mouse thyroid tumors were homogenized in 1x lysis buffer (containing 10 mmol Tris-HCl, 5 mmol EDTA, 4 mmol EGTA, and 1% Triton-X100) with protease/phosphatase inhibitors. Lysates were briefly sonicated to disrupt the tissue and cleared by centrifugation. Protein concentrations were estimated by bicinchoninic acid (BCA) kit (Thermo Fisher Scientific) on a microplate reader (SpectraMax M5); comparable amounts of proteins were subjected to SDS-PAGE using NuPAGE 4–12% Bis–Tris gradient gels (Invitrogen) and transferred to polyvinylidene fluoride (PVDF) membranes. Following overnight incubation with primary antibody, membranes were incubated with secondary antibodies coupled to HRP or IRDye fluorophores for 1 h at room temperature. HRP probed blots were developed using enhanced chemiluminescence reagent (Amersham Biosciences), and signal was captured using the iBright CL1000 Imaging system (Thermo Fisher Scientific). IRDye-probed blots were imaged using the LI-COR Odyssey imaging system (LI-COR Biosciences).
Antibodies and other reagents
The following primary antibodies were used for western blots at 1:1,000 dilution, except where indicated. RBM10 (HPA034972) and β-actin (A2228; 1: 10,000) from Sigma-Aldrich. VCL (#13901), PAK1,2,3 (#2604), pPAK1-(Thr423)/PAK2-Thr402 (#2601), AKT (#2920), pAKT-Ser473 (#4051), NF-κB/p65 (#8242), and pNFKB-S536 (#3033) from Cell Signaling Technology. The secondary antibodies were used at 1: 5,000 dilutions. We used the following HRP-conjugated antibodies: goat anti-rabbit (sc-2004; Santa Cruz) and goat anti-mouse (sc-2031; Santa Cruz) and the following IRDye fluorophore-conjugated antibodies: IRDye 800CW Goat anti-Rabbit IgG (926–32211; LI-COR), IRDye 800CW Goat anti-Mouse IgG (926–32210; LI-COR), IRDye 680RD Goat anti-Rabbit IgG (926–68071; LI-COR), and IRDye 680RD Goat anti-Mouse IgG (926–68070; LI-COR). We also used the following additional reagents in vitro: doxycycline (2 μg/ml) from Sigma-Aldrich, TPCA-1 (#S2824) from Selleckchem, and recombinant human TNFα (#16769) from Cell Signaling.
RAC1-GTP pulldown assay
RAC1 activation was determined using the active Rac1 pulldown and detection Kit (Thermo Fisher Scientific). Briefly cells were seeded at 40% confluence, treated with doxycycline where needed, and serum starved (1% FBS) for at least 48 h prior to collection. Cells were then washed with ice-cold PBS, lysed on ice, and at least 500 µg lysate was used for RAC1-GTP pull down following the manufacturer’s protocol. The eluted RAC1-GTP was denatured, electrophoresed in SDS-PAGE, and western blotted. Western blots of input lysate were probed for total RAC1 for normalization, total and pPAK (pPAK1-[Thr423]/PAK2-Thr402) and total and pAKT-S473 to assess RAC1 downstream signaling.
RT-PCR
Total RNA from isogenic cell lines was extracted using the RNeasy mini kit (Qiagen). Comparable amounts of RNA (500 ng-1 μg) were subjected to DNase I (Invitrogen) treatment and reverse transcribed using SuperScript III Reverse Transcriptase (Invitrogen) following the manufacturer’s protocol. cDNA was diluted at 1:15, and 2 µl was used as a template for either RT-PCR or qRT-PCR reactions. RT-PCR was performed using REDTaq ReadyMix (Sigma-Aldrich) on a thermocycler (Eppendorf), and qualitative assessment of PCR products was performed by resolving the amplicons in 3% agarose gel. For quantitative assessment, qRT-PCR was performed using the Power SYBR Green PCR Master Mix (Applied Biosystems) on QuantStudio 7 pro (Applied Biosystems). For gene expression quantifications, the Ct values of the target genes were normalized to GAPDH (human) or Hprt (mouse), and for exon inclusion isoform quantifications, the relative ratios were calculated by normalization to corresponding constitutive exons as previously described (Wang et al., 2013). The PCR primers are listed in Table S4.
Cell migration and invasion assay
Cell migration was assayed by time-lapse imaging and tracking of single cells over time as previously described (Lee et al., 2019). Briefly, 50,000 cells/well were seeded in a 6-well culture dish overnight prior to imaging. Cells were imaged with a 10×/0.45NA objective on a Zeiss Axio Observer.Z1 microscope using the imaging software ZEN Blue 2.3 Pro for 16 h with 8-min intervals at 25 random positions in each well. Cells were maintained at 37°C with 5% CO2 during the imaging period. Single-cell tracking was performed using the TrackMate plugin in FIJI, in which single cells were tracked based on displacement of each object over time. Cells that experience cell division, cell death, a collision event, or migrated out of the field of view were excluded. To compute cell velocity, raw tracking data were analyzed using MATLAB. Time-lapse imaging was performed by the MSK Molecular Cytology Core Facility.
For invasion assays, cells were trypsinized, washed in PBS, resuspended in 0.5% FBS, and 25,000 cells (0.5 ml) were plated in the top compartment of an 8.0 -µm fluorescence-blocking polyethylene terephthalate (PET) membrane of the Corning BioCoat Matrigel Invasion Chambers in technical triplicates. Cells that invaded into the bottom membrane were imaged and counted after 24 h using a fluorescence microscope.
In vivo metastasis assays
Metastases experiments were conducted in 6–8-wk-old female immunocompromised Rag1-deficient mice (strain: B6.129S7-Rag1tm1Mom/J; Jackson laboratories) in accordance with a protocol approved by the MSKCC Institutional Animal Care and Use Committee. To assess metastatic fitness, we orthotopically implanted luciferase-transduced 64860M-pLVX and 64860M-Rbm10 cells into a thyroid lobe. Mice were anesthetized by inhalation of 1.5–2.5% isoflurane with 2% O2, neck hair was removed with defoliating agent, and they were placed on the heated stage of the ultrasound. The site of injection was cleansed with 70% ethanol-soaked gauze. An aqueous ultrasonic gel was applied over the neck, and thyroid lobes were visualized by ultrasound. Using ultrasound guidance, 5 μl of tumor cell suspension in PBS containing 104 cells were injected into a thyroid lobe with a Hamilton syringe with a 30-gauge sterile needle. The primary orthotopic tumors were monitored by weekly IVIS imaging, and the lung metastases by H&E staining of the lungs following sacrifice. Tumor cell TV injections were performed to assess the relative lung metastatic efficiency of 64860M cells engineered to re-express Rbm10 and shRNAmir-mediated KDs of individual or combined exon inclusion isoforms (Vcl_Ex19, Cd44_Ex8, and Tnc_Ex14). Prior to IV injections, mice were warmed under a heat lamp for 10 min, and 500,000 cells resuspended in 200 µl PBS were injected via the lateral TV of 6–8-wk-old mice. Orthotopic and TV-implanted mouse lung metastases were assessed by serial IVIS imaging after administration of 2 mg/mouse D-Luciferin (GOLDBIO). Bioluminescence images were captured using the IVIS spectrum CT In Vivo imaging system (Caliper Life Sciences) and quantified using Living Image software, version 2.60, by monitoring the total flux (photon/sec) in the tumor region of interest.
RNAseq and splicing analysis
RNA was extracted from the following isogenic RBM10 overexpressing or KD cell lines using the Qiagen RNeasy extraction kit: KTC1, KTC1-RBM10, PE121410, PE121410-RBM10, 8305C-sh.Ctrl, 8305C-sh.RBM10, SW1736-sh.Ctrl, SW1736-sh.RBM10, HTH83-sh.Ctrl, and HTH83-sh.RBM10. After RiboGreen quantification and quality control by Agilent Fragment Analyzer, 500 ng of total RNA with RNA quality number (RQN) values of 9.1–10 underwent polyA selection and TruSeq library preparation according to instructions provided by Illumina (catalog # RS-122-2102; TruSeq Stranded mRNA LT Kit), with eight cycles of PCR. Samples were barcoded and run on a HiSeq in a PE125 run, using the HiSeq 3000/4000 SBS Kit (Illumina). An average of 100 million paired reads was generated per sample. Ribosomal reads represented 1.3–8.4% of the total reads, and the percent of mRNA bases averaged 73%.
Differential splicing analysis was performed as previously described (Dvinge et al., 2014). In brief, RNAseq reads were aligned to the hg19/GRCh37 genome assembly using an annotation that consisted of a combination of annotations from UCSC knownGene (Meyer et al., 2013), Ensembl (Flicek et al., 2013), and MISO isoforms (Katz et al., 2010). Reads were aligned with RSEM (Li and Dewey, 2011), Bowtie (Langmead et al., 2009), and TopHat (Trapnell et al., 2009). Percent spliced in (PSI) values were then computed using MISO v.2.0 (Katz et al., 2010).
Additionally, alternate splicing analysis and differential gene expression in the RNAseq of RBM10 isogenic KTC1 and PE121410 cells were performed using Partek Flow version 6.0.17.0614 (https://www.partek.com). Briefly, raw reads were aligned to human assembly hg19 using STAR aligner (STAR-2.5.3a) with default parameters. The aligned reads were quantified to Partek E/M annotation model using hg19 assembly, generating gene and transcript counts. The transcript counts were subject to “Detect alt-splicing,” an ANOVA-based Partek algorithm to detect genes with multiple isoforms and determine their expression changes. Detect alt-splicing with default parameters was applied on the following comparators by grouping RBM10-mutant versus the corresponding RBM10 re-expressing counterpart. Differentially expressed alternatively spliced transcripts (Table S1) were visualized by a volcano plot. GO analysis on RBM10 induced differentially spliced targets was performed using GOrilla (Eden et al., 2009). For differential gene expression quantification, the Deseq2 algorithm was used for the comparators KTC1 versus KTC1-RBM10 and PE121410 versus PE1214410-RBM10. The differentially expressed gene list was used to run the IPA (Qiagen). A pathway enrichment plot was constructed using the SRplot online tool (Tang et al., 2023).
Whole-exome CRISPR screen
Prior to the screen, KTC1-pLVX and KTC1-RBM10 cells were transduced with Cas9. Cas9-expressing cells were then infected with the Brunello sgRNA library that consists of four distinct sgRNAs/gene using a low MOI (∼0.3) to obtain a single sgRNA per cell. For MOI determination, we transduced target cells with various volumes of the lentiviral library supernatant to obtain 30% infectivity based on survival following antibiotic selection. On day 5 after transduction, ∼75 million cells per replicate (×3) were harvested with the goal of obtaining 1,000 cells (1,000×) expressing each sgRNA, and the cell pellet was frozen to assess the baseline sgRNA coverage. The remaining cells were serially passaged to maintain 750–1,000× cells/sgRNA until day 24 after transduction, when ∼75 million cells/replicate were harvested to determine the end point sgRNA distribution. Cell pellets were lysed, and genomic DNA was extracted (Qiagen) and quantified by Qubit (Thermo Fisher Scientific). A quantity of gDNA covering 1,000× representation of sgRNAs was PCR amplified to add Illumina adapters and multiplexing barcodes. Amplicons were quantified by Qubit and Bioanalyzer (Agilent) and sequenced on Illumina HiSeq 2500. FASTQ preprocessing and guide abundance were determined using the MAGeCK count command. The 5′ trim length was automatically detected by MAGeCK, and a normalized count file was generated with median normalization. Sample QC showed >85% mapped reads and a minimum sample correlation of 0.8 for all replicates. Enrichment was determined using the MAGeCK robust rank aggregation function to obtain gene-level enrichment scores, and P values were determined by permutation. All analyses were performed using MAGeCK v.0.5.9. The differential sgRNA enrichments were visualized by volcano plot using the SRplot online tool. KEGG pathway enrichment analysis was performed using the ShinyGO 0.77 (Ge et al., 2020). The 987 depleted sgRNAs in KTC1-pLVX versus KTC1-RBM10 with P values <0.05 (Table S2 were used as input to nominate the top 20 pathways with false discovery rate <0.2. A pathway enrichment plot sorted by fold enrichment was constructed using the SRplot online tool.
IC50 measurements
Cells plated in 96-well plates were exposed to the IKK2 inhibitor TPCA-1 at various concentrations with at least four technical replicates per concentration. On day 5 after treatment, CellTiter Glo reagent (Promega) was used to determine cell viability as per the manufacturer’s protocol. Absolute viability values were converted to percentage viability compared with DMSO treatment. IC50 curves and values were generated on GraphPad Prism V8.0 using nonlinear fit of log (inhibitor) versus response (three parameters).
Annexin V assay
Apoptosis induced by dox-inducible RELA KD in KTC1 cells was determined using Annexin V-APC (BD Bioscience) and Annexin-binding Buffer (Invitrogen) according to the manufacturer’s specifications. KTC1-shRELA cells were plated with and without doxycycline in the indicated conditions. Cells harvested after 36 h were subjected to annexin staining and captured by flow cytometry, and data were analyzed using FlowJo software.
Public CLIP-seq data analysis
Processed RBM10 PAR-CLIP data from HEK293 cells (Wang et al., 2013) were downloaded from the doRiNA database (Anders et al., 2012) and visualized by Integrative Genomics Viewer for VCL, CD44, and TNC genes. Additionally, we analyzed the data from the RBM10 eCLIP study performed in MOLM13 cells (Wang et al., 2023).
Statistical analyses
Statistical analysis for the CRISPR whole-exome screen and RNAseq experiments is described in their respective sections. Statistical analysis of in vitro and in vivo studies was performed using two-tailed nonparametric t tests with GraphPad Prism version 7.0. Significance was established as P < 0.05.
Online supplemental material
Fig. S1 shows the molecular features associated with RBM10 mutations in human patients and histological characteristics of HrasG12V/Rbm10KO mouse thyroid cancer. Fig. S2 demonstrates the effects of RBM10 loss on thyroid cancer cell growth in vitro and lists AS targets of RBM10. Fig. S3 show the effect of AS isoform KD on isoform and total mRNA abundance in KTC1 cells and RBM10 loss-induced deregulation of cell death and cell cycle pathways by RNAseq. Fig. S4 demonstrates the metastases rescue by Rbm10 re-expression and validation of isoform-specific KDs in 64860M cells. Fig. S5 shows the RBM10 effects on AS of CREBBP and NFκB transcriptional output. Table S1 lists the AS transcripts differentially expressed in RBM10-null cells (KTC1 and PE121410) compared with their re-expression counterparts using Partek alt-splicing analysis. Table S2 lists the dropout genes in KTC1-pLVX versus KTC1-RBM10 cells from the whole-genome CRISPR screen. Table S3 shows the KEGG pathways associated with CRISPR-Cas9 dropout hits, highlighting the involvement of the NFKB gene (RELA) (red) and CREBBP (blue) within the top 20 KEGG pathways enriched in the KTC1-cell CRISPR screen. Table S4 lists the primers used for genotyping, RT-PCR, and qRT-PCR. Table S5 has the plasmid vector information used in the study.
Data availability
Raw and processed data of RNAseq of RBM10 isogenic human thyroid cancer cells related to Fig. 2, C–E; Fig. 3, A and B; Fig. S2, B–D; and Fig. S3, C and D are openly available in the Gene Expression Omnibus under the accession number GSE285560. The raw data of the MSK-IMPACT sequencing on thyroid cancer patients (Fig. 1, A and B; and Fig. S1, A–C) are not made publicly available as it may contain information that could compromise research participant privacy/consent; however, it will be available to researchers upon reasonable request. All other data are available in the main text or the supplementary materials. No custom code or software was generated in this study. Source data are provided within this paper. Correspondence and requests for materials should be addressed to [email protected] (J.A. Fagin).
Acknowledgments
We are grateful for the contributions of the RNAi Core facility for the CRISPR screen, the Molecular Cytology, Small Animal Imaging, Anti-tumor Assessment, and the Integrated Genomics Operation Core Facilities, funded by the National Cancer Institute Cancer Center Support Grant (CCSG, P30 CA08748), Cycle for Survival, and the Marie-Josée and Henry R. Kravis Center for Molecular Oncology.
A.R. Glover wishes to thank the 2016 Royal Australasian College of Surgeons Foundation for Surgery Tour de Cure Cancer Research Scholarship and the National Health and Medical Research Council Neil Hamilton Fairley Early Career Fellowship (RG183080) for salary support for this project. Supported by the National Institutes of Health grants R01 CA50706-31, R01 CA255211-03, and R01 CA249663-03 (to J.A. Fagin) and CCSG P30 CA008748-58 (Selwyn Vickers).
Author contributions: G.P. Krishnamoorthy: conceptualization, data curation, formal analysis, investigation, methodology, project administration, validation, visualization, and writing—original draft, review, and editing. A.R. Glover: conceptualization, data curation, formal analysis, investigation, methodology, visualization, and writing—review and editing. B.R. Untch: conceptualization, data curation, formal analysis, investigation, methodology, and writing—review and editing. N. Sigcha-Coello: conceptualization, data curation, formal analysis, investigation, methodology, project administration, resources, and software. B. Xu: methodology and writing—review and editing. D. Vukel: formal analysis and investigation. Y. Liu: investigation. V. Tiedje: data curation and formal analysis. J.M.B. Pineda: data curation and formal analysis. K. Berman: investigation and resources. P.P. Tamarapu: investigation and resources. A. Acuña-Ruiz: data curation, formal analysis, and writing—review and editing. M. Saqcena: conceptualization, investigation, methodology, and writing—review and editing. E. de Stanchina: investigation, methodology, and resources. L. Boucai: methodology, resources, visualization, and writing—review and editing. R.A. Ghossein: investigation. J.A. Knauf: formal analysis. O. Abdel-Wahab: conceptualization, formal analysis, investigation, methodology, supervision, and writing—review and editing. R.K. Bradley: formal analysis. J.A. Fagin: conceptualization, funding acquisition, methodology, project administration, resources, supervision, visualization, and writing—original draft, review, and editing.
References
Author notes
Disclosures: A.R. Glover reported grants from RACS Foundation for Surgery Tour de Cure Cancer Research Scholarship and grants from NHMRC Neil Hamilton Fairley Early Career Fellowship (RG183080) during the conduct of the study. R.A. Ghossein reported grants from National Institute of Health during the conduct of the study. J.A. Knauf reported a patent to Treatment of HRAS-Driven Tumors licensed “Kura Oncology” and a patent to Targeting the adaptive responses of BRAF or RAS-mutant thyroid cancers to RAF/MEK inhibitors with bispecific antibodies to TSHR and/or HER pending. O. Abdel-Wahab reported grants from LOXO Oncology, Nurix Therapeutics, Codify Therapeutics, Minovia Therapeutics, and AstraZeneca during the conduct of the study. R.K. Bradley reported grants from Codify Therapeutics, personal fees from Codify Therapeutics, ″other″ from Synthesize Bio, and ″other″ from Codify Therapeutics outside the submitted work. R.K. Bradley is a founder and scientific advisor of Codify Therapeutics and Synthesize Bio and holds equity in both companies. R.K. Bradley has received research funding from Codify Therapeutics unrelated to the current work. J.A. Fagin reported a patent to Treatment of HRAS-Driven Tumors #WO/2015/164862 with royalties paid “Kura Oncology.” No other disclosures were reported.