


Hypoxia induces immunosuppressive phenotypes in tumor cells even in the presence of cytosolic DNA accumulation. The mechanisms by which tumor cells suppress hypoxia-induced cGAS-STING activation for immune evasion remain largely unclear. Here, we demonstrate that hypoxic stimulation induces JNK1/2-mediated S151 phosphorylation of phosphoenolpyruvate carboxykinase 1 (PCK1), a rate-limiting enzyme in gluconeogenesis. This phosphorylation triggers the interaction between PCK1 and cGAS. The PCK1 associated with cGAS competitively consumes GTP, a substrate shared by both PCK1 and cGAS. Consequently, PCK1 inhibits GTP-dependent cGAS activation and subsequent STING-promoted immune cell infiltration and activation in the tumor microenvironment, leading to promoted tumor growth in mice. The blockade of PCK1 function, in combination with anti–PD-1 antibody treatment, exhibits an additive therapeutic effect on tumor growth. Additionally, PCK1 S151 phosphorylation is inversely correlated with cGAS-STING activation in human breast cancer specimens and patient survival. These findings reveal a novel regulation of cGAS-STING pathway and uncover the metabolic control of immune response in tumor cells.
Introduction
The immune system plays a critical role in maintaining homeostasis. The cyclic GMP–AMP (cGAMP) synthase (cGAS) stimulator of IFN genes (STING) pathway is an instrumental innate immune system, which impacts tumorigenesis (Samson and Ablasser, 2022). cGAS is activated upon binding to nucleosome-free cytosolic double-stranded (ds) DNA. cGAS uses ATP and GTP as substrates to catalyze the formation of cGAMP (Sun et al., 2013; Wu et al., 2013). cGAMP then binds to ER-associated transmembrane protein STING, leading to its conformational changes, K63- or K27-mediated polyubiquitylation, oligomerization, and activation (Burdette et al., 2011; Ishikawa and Barber, 2008; Zhang et al., 2019). Activated STING translocates from the ER to the Golgi and perinuclear microsome, where it activates TANK-binding kinase 1 (TBK1), resulting from increased TBK1 interdimer interactions and autophosphorylation at S172 in the activation loop (Barber, 2015; Motwani et al., 2019). Upon activation, TBK1 phosphorylates STING at S366, facilitating the recruitment, phosphorylation, and activation of IFN regulatory factor 3 (IRF3) and the activation of NF-κB. This coordinated action results in the upregulation of the expression of type I IFNs (IFN-Is), proinflammatory cytokines, and chemokines, collectively eliciting robust immune responses (Hopfner and Hornung, 2020; Kwon and Bakhoum, 2020; Liu et al., 2015).
In tumor cells, chromosomal instability, replicative stress, defects in the DNA damage repair, and reactivation of endogenous retroelements induce aberrant DNA accumulation (Samson and Ablasser, 2022). In addition, hypoxia, which frequently occurs during rapid tumor growth, induces mitochondrial damage, leading to the release of mitochondrial DNA (Arnaiz and Harris, 2022). However, tumor cells exhibit a restricted or transient cGAS-STING–triggered innate immune response (Lanng et al., 2024; Samson and Ablasser, 2022). These findings suggest that tumor cells harness and restrain innate immune response (Le Naour et al., 2020; Meric-Bernstam et al., 2023; Samson and Ablasser, 2022), which was evidenced by miR-25/93–downregulated expression of the nuclear receptor coactivator 3, and subsequently transcriptional repression of cGAS expression in breast cancer cells (Wu et al., 2017). The evasion of the immune system by tumors has been associated with alterations in cellular metabolism, specifically through the regulation of metabolic enzymes (Chapman et al., 2020; DePeaux and Delgoffe, 2021; Guo et al., 2022), which profoundly impact tumor development through their canonical and noncanonical functions (Li et al., 2018a; Lu and Hunter, 2018; Wang et al., 2023; Xu et al., 2021). However, it remains largely unknown whether cGAS activation is metabolically regulated in tumor cells, thereby contributing to the suppression of immune response.
In this study, we demonstrated that hypoxia induces JNK1/2-mediated S151 phosphorylation of phosphoenolpyruvate carboxykinase 1 (PCK1) and consequent binding of PCK1 to cGAS. The cGAS-associated PCK1 competitively consumed GTP, leading to inhibition of cGAS activation and STING-dependent immune cell infiltration and activation.
Results
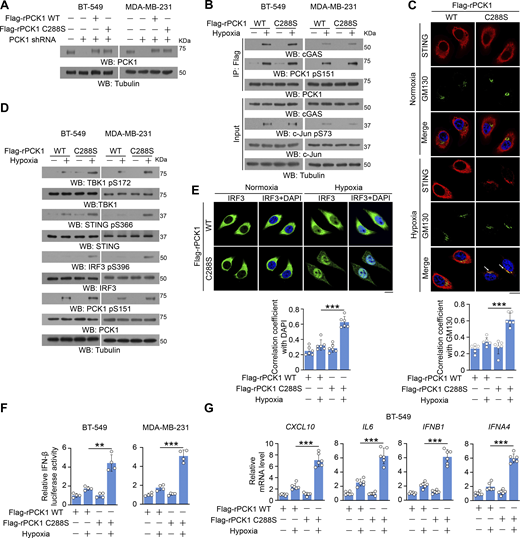
JNK1/2-mediated PCK1 S151 phosphorylation promotes its binding to cGAS upon hypoxic conditions
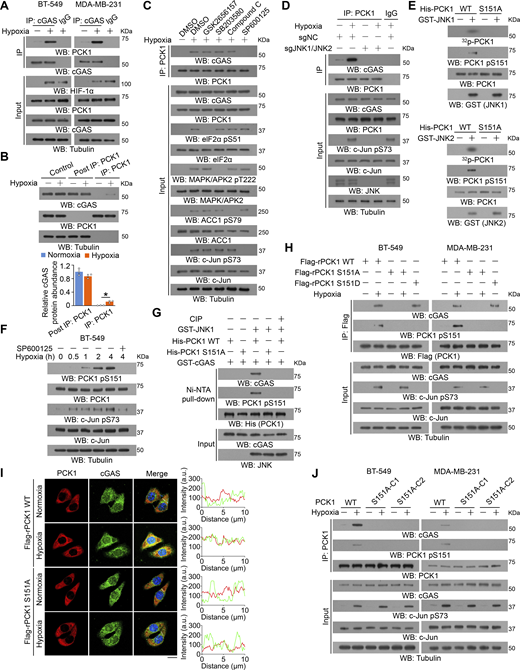
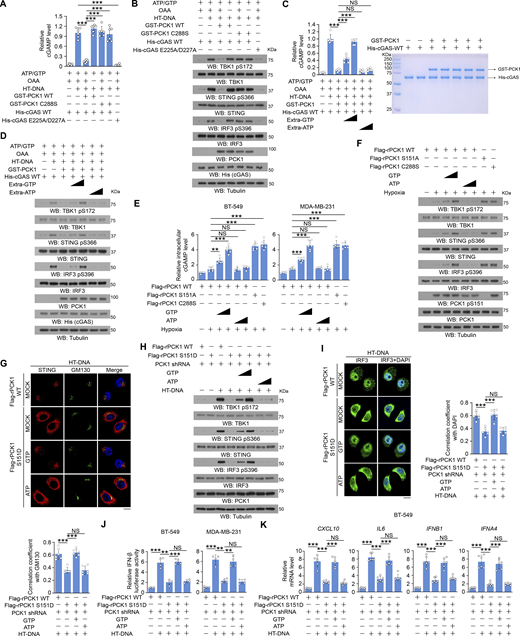
Hypoxia induces immunosuppressive phenotypes (Leone and Powell, 2020; Singleton et al., 2021). To determine whether cGAS is regulated in tumor cells under hypoxic conditions, we immunoprecipitated endogenous cGAS from BT-549 breast cancer cells, and mass spectrometric analyses of the immunoprecipitants revealed that hypoxia induces an association between cGAS and cytosolic PCK1 (also known as PEPCK1) (Fig. S1 A), a key rate-limiting enzyme in gluconeogenesis catalyzing the conversion of oxaloacetate and GTP to phosphoenolpyruvate and GDP, respectively (Burgess et al., 2007). PCK1 was shown to possess noncanonical functions unrelated to gluconeogenesis, which are critical for lipid biosynthesis and central carbon metabolism in tumor cells (Jiang et al., 2020; Montal et al., 2015; Shao et al., 2021; Xu et al., 2020). Co-immunoprecipitation (IP) analyses confirmed an unbiased interaction between cGAS and PCK1 (Fig. 1 A; and Fig. S1, B and C), but not mitochondria-localized PCK2 isoform (Fig. S1 C), upon hypoxia. According to the previous report, both cytoplasmic and nuclear localization of cGAS has been identified in several cell lines, such as PC-9, U2OS, LLC, and 4T-1 cells (Guey et al., 2020; Liu et al., 2018; Xu et al., 2024). To this end, we first conducted the cell fractionation analyses and found cGAS is indeed localized in both cytoplasm and nucleus in MDA-MB-231 cells (∼60% cGAS localizes in the cytoplasm, while the remaining ∼40% cGAS presents in the nucleus) (Fig. S1 D). In contrast, under both normoxic and hypoxic conditions, PCK1 is totally localized in the cytoplasm, but not in the nucleus (Fig. S1 D). Consistently, hypoxia-induced interaction between cGAS and PCK1 only occurs in the cytoplasm (Fig. S1 D). To determine the proportion of cGAS interacting with PCK1 in the cytoplasm, we performed the immuno-depletion experiment using an anti-PCK1 antibody, which eliminates both PCK1 and PCK1-associated cGAS in the cell lysates (Fig. 1 B). Subsequent quantification of cGAS-PCK1 association showed that hypoxia treatment induces the interaction of ∼15% of the total intracellular cGAS with PCK1 in the cytoplasm (Fig. 1 B). To determine the mechanism underlying this protein–protein interaction, BT-549 cells were pretreated with GSK2656157, SB203580, compound C, or SP600125, which inhibited hypoxia-induced activation of protein kinase R-like ER kinase, p38, AMPK, and JNK1/2, respectively (Fig. 1 C). We showed that only JNK1/2 inhibition by SP600125 blocked the hypoxia-induced binding of PCK1 to cGAS (Fig. 1 C). Consistently, depleting JNK1/2 could also block hypoxia-induced PCK1–cGAS interaction (Fig. 1 D). These results suggest that JNK1/2 is required for the interaction between PCK1 and cGAS under hypoxic conditions.
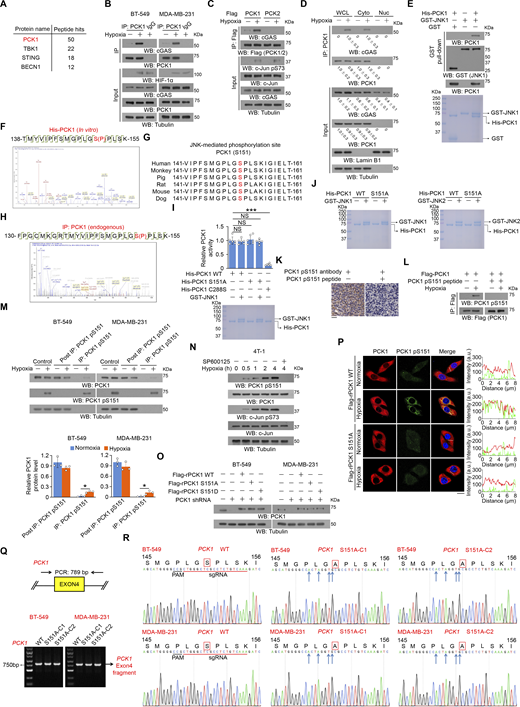
JNK1/2-mediated PCK1 S151 phosphorylation promotes its binding to cGAS upon hypoxic conditions. (A) BT-549 cells were treated with or without hypoxia for 2 h. An IP assay was performed using an anti-cGAS antibody, and immunoprecipitates of endogenous cGAS were separated using SDS-PAGE and stained with Coomassie brilliant blue. Selected peptide hits of proteins associated with cGAS identified through mass spectrometry are shown. (B) BT-549 and MDA-MB-231 cells treated with hypoxia for 2 h were harvested for IP and immunoblotting analyses as indicated. (C) BT-549 cells expressing Flag-PCK1 or Flag-PCK2 treated with or without hypoxia for 2 h were harvested for IP and immunoblotting analyses as indicated. (D) BT549 cells were treated with or without hypoxia for 2 h. Cytosolic and nuclear fractions were prepared for IP and immunoblotting analyses as indicated, and the relative PCK1 and cGAS protein level in different fractions was quantified by densitometric analysis of the blots. (E) Bacterially purified His-PCK1 incubated with bacterially purified GST or GST-JNK1 was prepared for the GST pull-down assay. Immunoblotting analyses were performed as indicated (upper), and Coomassie blue staining was performed to show the purity of proteins (lower). (F) Bacterially purified His-PCK1 proteins on Ni-NTA agarose beads were incubated with or without active GST-JNK1 in the presence of ATP for an in vitro kinase assay. Mass spectrometric analysis of a tryptic fragment at m/z 1002.98499 Da (+2.63 mmu/+2.62 ppm), which was matched with the +2 charged peptide 138-TMYVIPFSMGPLGSPLSK-155, suggested that S151 was phosphorylated. The XCorr score was 5.56. (G) Alignment of protein sequences spanning PCK1 S151 from different species. (H) BT-549 cells treated with or without hypoxia for 1 h for the IP assay using an anti-PCK1 antibody, and IP of endogenous PCK1 were separated using SDS-PAGE, stained with Coomassie brilliant blue, and subjected to LC-MS/MS analysis. Mass spectrometric analysis of a tryptic fragment at m/z 610.87012 Da (−4.69 mmu/−7.68 ppm), which was matched with the +5 charged peptide 130-FPGCMKGRTMYVIPFSMGPLGSPLSK-155, suggested that S151 was phosphorylated. The XCorr score was 3.2. (I) Bacterially purified His-PCK1 WT, S151A, or C288S on Ni-NTA agarose beads were incubated with or without purified active GST-JNK1 in the presence of ATP for an in vitro kinase assay. After washing His-PCK1 WT, S151A, or C288S-conjugated beads with PBS five times, the relative PCK1 activity was measured (upper), and Coomassie blue staining was performed to show the purity of bacterially purified proteins (lower). (J) The purity of bacterially purified proteins used in In vitro kinase assays was identified by Coomassie blue staining. (K) IHC analyses of human TNBC samples were performed with the indicated antibodies in the presence or absence of a blocking peptide for PCK1 S151. (L) BT-549 cells expressing Flag-PCK1 treated with or without hypoxia for 1 h were harvested for IP and immunoblotting analyses as indicated in the presence or absence of a blocking peptide for PCK1 S151. (M) BT-549 and MDA-MB-231 cells treated with hypoxia for 2 h were harvested for IP and immunoblotting analyses as indicated (upper), and the relative PCK1 protein level in different fractions was quantified by densitometric analysis of the blots (lower). (N) 4T-1 cells pretreated with or without SP600125 (20 μM) or for 30 min before treatment with or without hypoxia for the indicated time were harvested for immunoblotting analyses as indicated. (O) BT-549 and MDA-MB-231 cells expressing PCK1 shRNA with reconstituted expression of the indicated PCK1 proteins were harvested for immunoblotting analyses as indicated. (P) BT-549 cells expressing PCK1 shRNA with reconstituted expression of the indicated PCK1 proteins treated with or without hypoxia for 2 h were prepared for IF analyses as indicated (left). Scale bar, 20 μm. The intensity of green (PCK1 pS151) or red (PCK1) fluorescent signals along the oblique line were measured using Image J (right). At least n = 30 cells from the experiment were analyzed, and representative data are shown. (Q) Genomic DNA was extracted from two individual clones of parental BT-549 and MDA-MB-231 cells with knock-in expression of PCK1 S151A. PCR products amplified from the indicated DNA fragments were separated on an agarose gel. (R) Sequencing of parental BT-549 and MDA-MB-231 cells and the individual clones of parental cells with knock-in expression of PCK1 S151A. The red line indicates the sgRNA-targeting sequence. The black line indicates the protospacer adjacent motif (PAM). Blue arrows indicate mutated nucleotides. A mutated amino acid and its WT counterpart are indicated by the solid red box. Experiments (B–E and L–O) were repeated three times independently with similar results, and the representative data are shown. Data are representative of as mean ± SD. Statistical significance was determined by two-tailed Student’s t test (I and M); *P < 0.05 and ***P < 0.0001; NS, not significant. Source data are available for this figure: SourceData FS1.
JNK1/2-mediated PCK1 S151 phosphorylation promotes its binding to cGAS upon hypoxic conditions. (A) BT-549 cells were treated with or without hypoxia for 2 h. An IP assay was performed using an anti-cGAS antibody, and immunoprecipitates of endogenous cGAS were separated using SDS-PAGE and stained with Coomassie brilliant blue. Selected peptide hits of proteins associated with cGAS identified through mass spectrometry are shown. (B) BT-549 and MDA-MB-231 cells treated with hypoxia for 2 h were harvested for IP and immunoblotting analyses as indicated. (C) BT-549 cells expressing Flag-PCK1 or Flag-PCK2 treated with or without hypoxia for 2 h were harvested for IP and immunoblotting analyses as indicated. (D) BT549 cells were treated with or without hypoxia for 2 h. Cytosolic and nuclear fractions were prepared for IP and immunoblotting analyses as indicated, and the relative PCK1 and cGAS protein level in different fractions was quantified by densitometric analysis of the blots. (E) Bacterially purified His-PCK1 incubated with bacterially purified GST or GST-JNK1 was prepared for the GST pull-down assay. Immunoblotting analyses were performed as indicated (upper), and Coomassie blue staining was performed to show the purity of proteins (lower). (F) Bacterially purified His-PCK1 proteins on Ni-NTA agarose beads were incubated with or without active GST-JNK1 in the presence of ATP for an in vitro kinase assay. Mass spectrometric analysis of a tryptic fragment at m/z 1002.98499 Da (+2.63 mmu/+2.62 ppm), which was matched with the +2 charged peptide 138-TMYVIPFSMGPLGSPLSK-155, suggested that S151 was phosphorylated. The XCorr score was 5.56. (G) Alignment of protein sequences spanning PCK1 S151 from different species. (H) BT-549 cells treated with or without hypoxia for 1 h for the IP assay using an anti-PCK1 antibody, and IP of endogenous PCK1 were separated using SDS-PAGE, stained with Coomassie brilliant blue, and subjected to LC-MS/MS analysis. Mass spectrometric analysis of a tryptic fragment at m/z 610.87012 Da (−4.69 mmu/−7.68 ppm), which was matched with the +5 charged peptide 130-FPGCMKGRTMYVIPFSMGPLGSPLSK-155, suggested that S151 was phosphorylated. The XCorr score was 3.2. (I) Bacterially purified His-PCK1 WT, S151A, or C288S on Ni-NTA agarose beads were incubated with or without purified active GST-JNK1 in the presence of ATP for an in vitro kinase assay. After washing His-PCK1 WT, S151A, or C288S-conjugated beads with PBS five times, the relative PCK1 activity was measured (upper), and Coomassie blue staining was performed to show the purity of bacterially purified proteins (lower). (J) The purity of bacterially purified proteins used in In vitro kinase assays was identified by Coomassie blue staining. (K) IHC analyses of human TNBC samples were performed with the indicated antibodies in the presence or absence of a blocking peptide for PCK1 S151. (L) BT-549 cells expressing Flag-PCK1 treated with or without hypoxia for 1 h were harvested for IP and immunoblotting analyses as indicated in the presence or absence of a blocking peptide for PCK1 S151. (M) BT-549 and MDA-MB-231 cells treated with hypoxia for 2 h were harvested for IP and immunoblotting analyses as indicated (upper), and the relative PCK1 protein level in different fractions was quantified by densitometric analysis of the blots (lower). (N) 4T-1 cells pretreated with or without SP600125 (20 μM) or for 30 min before treatment with or without hypoxia for the indicated time were harvested for immunoblotting analyses as indicated. (O) BT-549 and MDA-MB-231 cells expressing PCK1 shRNA with reconstituted expression of the indicated PCK1 proteins were harvested for immunoblotting analyses as indicated. (P) BT-549 cells expressing PCK1 shRNA with reconstituted expression of the indicated PCK1 proteins treated with or without hypoxia for 2 h were prepared for IF analyses as indicated (left). Scale bar, 20 μm. The intensity of green (PCK1 pS151) or red (PCK1) fluorescent signals along the oblique line were measured using Image J (right). At least n = 30 cells from the experiment were analyzed, and representative data are shown. (Q) Genomic DNA was extracted from two individual clones of parental BT-549 and MDA-MB-231 cells with knock-in expression of PCK1 S151A. PCR products amplified from the indicated DNA fragments were separated on an agarose gel. (R) Sequencing of parental BT-549 and MDA-MB-231 cells and the individual clones of parental cells with knock-in expression of PCK1 S151A. The red line indicates the sgRNA-targeting sequence. The black line indicates the protospacer adjacent motif (PAM). Blue arrows indicate mutated nucleotides. A mutated amino acid and its WT counterpart are indicated by the solid red box. Experiments (B–E and L–O) were repeated three times independently with similar results, and the representative data are shown. Data are representative of as mean ± SD. Statistical significance was determined by two-tailed Student’s t test (I and M); *P < 0.05 and ***P < 0.0001; NS, not significant. Source data are available for this figure: SourceData FS1.
JNK1/2-mediated PCK1 S151 phosphorylation promotes its binding to cGAS upon hypoxic conditions. (A) BT-549 and MDA-MB-231 cells treated with or without hypoxia for 2 h were harvested for IP and immunoblotting analyses as indicated. (B) BT-549 cells treated with or without hypoxia for 2 h were harvested for IP and immunoblotting analyses as indicated (upper). The relative cGAS protein levels in different groups were quantified by densitometric analysis of the blots (lower). (C) BT-549 cells pretreated with or without GSK2656157 (10 μM), SB203580 (10 μM), compound C (5 μM), or SP600125 (20 μM) for 30 min before treatment with or without hypoxia for 2 h were harvested for IP and immunoblotting analyses as indicated. (D) Parental and JNK1/2-KO BT-549 cells treated with or without hypoxia for 2 h were harvested for IP and immunoblotting analyses as indicated. (E) Bacterially purified His-PCK1 WT or S151A mutant was incubated with the bacterially purified GST-JNK1 (upper) or GST-JNK2 (lower) in the presence of [γ-32P]-ATP. Autoradiography and immunoblotting analyses were performed. (F) BT-549 cells pretreated with or without SP600125 (20 μM) for 30 min before treatment with or without hypoxia for the indicated time were harvested for immunoblotting analyses as indicated. (G) Bacterially purified His-PCK1 WT or S151A mutant on Ni-NTA agarose beads was incubated with or without active GST-JNK1 in the presence of ATP for an in vitro kinase assay. The His-tagged proteins were then incubated with or without CIP (10 U) for 30 min at 37°C; the proteins were collected for Ni-NTA pull-down, IP, and immunoblotting analyses as indicated. (H) BT-549 cells expressing PCK1 shRNA with reconstituted expression of Flag-rPCK1 WT, S151A, or S151D mutant treated with or without hypoxia for 2 h were harvested for IP and immunoblotting analyses as indicated. (I) BT-549 cells expressing PCK1 shRNA with reconstituted expression of Flag-rPCK1 WT and S151A mutant treated with or without hypoxia for 2 h were prepared for IF analyses as indicated (left). Scale bar, 20 μm. The intensity of green (cGAS) or red (PCK1) fluorescent signals along the oblique line was measured using Image J (right). At least n = 30 cells from the experiment were analyzed, and representative data are shown. (J) Parental BT-549 and MDA-MB-231 cells and the indicated clones with knock-in expression of PCK1 S151A mutants treated with or without hypoxia for 2 h were harvested for IP and immunoblotting analyses as indicated. Experiments (A–H and J) were repeated three times independently with similar results, and the representative data are shown. Statistical significance was determined by two-tailed Student’s t test (B), Data are the mean ± SD, *P < 0.05. CIP; calf intestinal alkaline phosphatase. Source data are available for this figure: SourceData F1.
JNK1/2-mediated PCK1 S151 phosphorylation promotes its binding to cGAS upon hypoxic conditions. (A) BT-549 and MDA-MB-231 cells treated with or without hypoxia for 2 h were harvested for IP and immunoblotting analyses as indicated. (B) BT-549 cells treated with or without hypoxia for 2 h were harvested for IP and immunoblotting analyses as indicated (upper). The relative cGAS protein levels in different groups were quantified by densitometric analysis of the blots (lower). (C) BT-549 cells pretreated with or without GSK2656157 (10 μM), SB203580 (10 μM), compound C (5 μM), or SP600125 (20 μM) for 30 min before treatment with or without hypoxia for 2 h were harvested for IP and immunoblotting analyses as indicated. (D) Parental and JNK1/2-KO BT-549 cells treated with or without hypoxia for 2 h were harvested for IP and immunoblotting analyses as indicated. (E) Bacterially purified His-PCK1 WT or S151A mutant was incubated with the bacterially purified GST-JNK1 (upper) or GST-JNK2 (lower) in the presence of [γ-32P]-ATP. Autoradiography and immunoblotting analyses were performed. (F) BT-549 cells pretreated with or without SP600125 (20 μM) for 30 min before treatment with or without hypoxia for the indicated time were harvested for immunoblotting analyses as indicated. (G) Bacterially purified His-PCK1 WT or S151A mutant on Ni-NTA agarose beads was incubated with or without active GST-JNK1 in the presence of ATP for an in vitro kinase assay. The His-tagged proteins were then incubated with or without CIP (10 U) for 30 min at 37°C; the proteins were collected for Ni-NTA pull-down, IP, and immunoblotting analyses as indicated. (H) BT-549 cells expressing PCK1 shRNA with reconstituted expression of Flag-rPCK1 WT, S151A, or S151D mutant treated with or without hypoxia for 2 h were harvested for IP and immunoblotting analyses as indicated. (I) BT-549 cells expressing PCK1 shRNA with reconstituted expression of Flag-rPCK1 WT and S151A mutant treated with or without hypoxia for 2 h were prepared for IF analyses as indicated (left). Scale bar, 20 μm. The intensity of green (cGAS) or red (PCK1) fluorescent signals along the oblique line was measured using Image J (right). At least n = 30 cells from the experiment were analyzed, and representative data are shown. (J) Parental BT-549 and MDA-MB-231 cells and the indicated clones with knock-in expression of PCK1 S151A mutants treated with or without hypoxia for 2 h were harvested for IP and immunoblotting analyses as indicated. Experiments (A–H and J) were repeated three times independently with similar results, and the representative data are shown. Statistical significance was determined by two-tailed Student’s t test (B), Data are the mean ± SD, *P < 0.05. CIP; calf intestinal alkaline phosphatase. Source data are available for this figure: SourceData F1.
To determine whether JNK binds to and phosphorylates PCK1, we performed an in vitro GST pulldown assay and showed that purified GST-JNK1 directly interacted with purified His-PCK1 (Fig. S1 E). An in vitro protein phosphorylation assay showed that JNK1 phosphorylated PCK1 at the conserved residue S151, as identified by mass spectrometric analyses (Fig. S1, F and G). Consistently, the mass spectrometric analyses on endogenous PCK1 confirmed that hypoxia indeed induces the phosphorylation of S151 within PCK1 (Fig. S1 H). Interestingly, the amino acid followed by PCK1 S151 is a proline (P) (Fig. S1 G), which strictly belongs to the JNK consensus sequence called serine proline/threonine proline (SP/TP) motifs (Zeke et al., 2016). The S151A mutation, which does not affect the metabolic activity of PCK1 (Fig. S1 I), abolished both purified GST-JNK1– and GST-JNK2–mediated PCK1 phosphorylation, as evidenced by an autoradiograph assay with γ-32P-ATP or an immunoblotting analysis (Fig. 1 E and Fig. S1 J) with a specificity-validated anti-PCK1 pS151 antibody (Fig. S1, K and L). Consistently, hypoxic stimulation of BT-549 and MDA-MB-231 cells induced about 15% of total PCK1 phosphorylated at S151 (Fig. S1 M), and this phosphorylation was diminished upon SP600125 treatment (Fig. 1 F and Fig. S1 N). These results indicate that JNK binds to and phosphorylates PCK1 under hypoxic conditions.
To determine whether PCK1 S151 phosphorylation plays a role in its binding to cGAS, we performed a Ni-NTA pulldown assay and showed that purified His-PCK1 WT bound to purified GST-cGAS only in the presence of purified JNK1, and this interaction was disrupted by calf intestinal alkaline phosphatase treatment or PCK1 S151A mutation (Fig. 1 G). Consistently, PCK1 S151A mutant lost its binding to cGAS in hypoxia-treated breast cancer cells whereas PCK1 S151D phosphorylation-mimicking mutant interacted with cGAS in the absence of hypoxic stimulation (Fig. 1 H and Fig. S1 O). Furthermore, IF staining experiments confirmed that hypoxia not only enhances PCK1 S151 phosphorylation in the cytoplasm (Fig. S1 P), but also induces the co-localization between cGAS and PCK1 (Fig. 1 I). Of note, the aforementioned hypoxia-induced phenomena were totally eliminated by reconstituted expression of PCK1 S151A mutant (Fig. 1 I and Fig. S1 P). This finding was validated by knock-in expression of PCK1 S151A in breast cancer cells by CRISPR/Cas9 system (Fig. 1 J; and Fig. S1, Q and R), which eliminated the interaction between PCK1 and cGAS. These results indicate that JNK1/2-mediated PCK1 S151 phosphorylation promotes its binding to cGAS upon hypoxic conditions.
PCK1 S151 phosphorylation attenuates hypoxia-mediated activation of cGAS-STING pathway
To examine the effect of PCK1 S151 phosphorylation on cGAS-STING activation, we performed immunofluorescent analyses and showed that hypoxic stimulation moderately increased the translocation of STING to the Golgi apparatus (Fig. 2 A), a marker of STING activation. In contrast, PCK1 S151A knock-in expression in breast cancer cells substantially enhanced this translocation (Fig. 2 A). In addition, this mutant expression activated the STING-TBK1-IRF3 axis upon hypoxia, as evidenced by enhanced STING oligomerization (Fig. 2 B) and K63-polyubiquitylation (Fig. 2 C); phosphorylation of TBK1 S172, STING S366, and IRF3 S396 (Fig. 2 D); nuclear translocation of IRF3 (Fig. 2 E); transcriptional activity of IRF3 (Fig. 2 F); and mRNA expression of IRF3-mediated genes (including CXCL10, IL6, IFNB1, and IFNA4) (Fig. 2 G and Fig. S2 A). Consistently, we constructed the 4T-1 cells with knock-in expression of WT PCK1 and PCK1 S151A by CRISPR/Cas9 system (Fig. S2, B and C) and found the aforementioned phenomena also exist in the mouse tumor cells (Fig. S2, D–F). These data further supported the inhibitory effect of PCK1 S151 phosphorylation on the cGAS-STING pathway upon hypoxia.
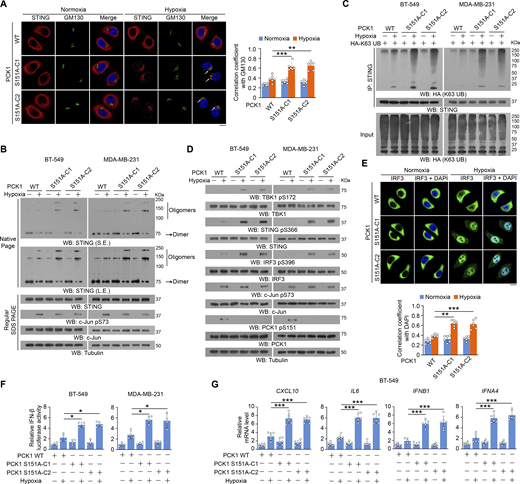
PCK1 S151 phosphorylation attenuates hypoxia-mediated activation of cGAS-STING pathway. (A) Parental BT-549 cells and the indicated clones with knock-in expression of PCK1 S151A mutants treated with or without hypoxia for 6 h were prepared for IF analyses as indicated (left). Scale bar, 20 μm. The co-localization coefficients between the indicated proteins in the presence or absence of hypoxia are shown (right). At least 10 cells from each independent experiment were analyzed, and the representative data are shown (n = 6 biological experiments). (B) Parental BT-549 and MDA-MB-231 cells and the indicated clones with knock-in expression of PCK1 S151A mutants treated with or without hypoxia for 6 h were resolved by native PAGE or SDS-PAGE, followed by immunoblotting analysis as indicated. (C) Parental BT-549 and MDA-MB-231 cells and the indicated clones with knock-in expression of PCK1 S151A mutants transfected with HA-K63-UB and treated with or without hypoxia for 6 h were harvested for IP and immunoblotting analyses as indicated. (D) Parental BT-549 and MDA-MB-231 cells and the indicated clones with knock-in expression of PCK1 S151A mutants treated with or without hypoxia for 6 h were harvested for immunoblotting analyses as indicated. (E) Parental BT-549 cells and the indicated clones with knock-in expression of PCK1 S151A mutants treated with or without hypoxia for 6 h were prepared for IF analyses as indicated (upper). Scale bar, 20 μm. The co-localization coefficients between the indicated proteins in the presence or absence of hypoxia are shown (lower). At least 10 cells from each independent experiment were analyzed, and the representative data are shown (n = 6 biological experiments). (F) Parental BT-549 (left) and MDA-MB-231 (right) cells and the indicated clones with knock-in expression of PCK1 S151A mutants were transiently transfected with vectors expressing β-galactosidase and an IFN-β luciferase reporter. 24 h later, the aforementioned cells treated with or without hypoxia for 6 h were harvested for luciferase assay, and the relative IFN-β luciferase activity after normalization to β-galactosidase activity is shown (n = 4 biological experiments). (G) Parental BT-549 cells and the indicated clones with knock-in expression of PCK1 S151A mutants treated with or without hypoxia for 12 h were harvested for quantitative PCR (qPCR) analyses to measure CXCL10, IL6, IFNB1, and IFNA4 mRNA levels (n = 6 biological experiments). Experiments (B, C, and D) were repeated three times independently with similar results, and the representative data are shown. Statistical significance was determined by two-tailed Student’s t test (A and E–G). Data are the mean ± SD; *P < 0.05, **P < 0.001, and ***P < 0.0001. Source data are available for this figure: SourceData F2.
PCK1 S151 phosphorylation attenuates hypoxia-mediated activation of cGAS-STING pathway. (A) Parental BT-549 cells and the indicated clones with knock-in expression of PCK1 S151A mutants treated with or without hypoxia for 6 h were prepared for IF analyses as indicated (left). Scale bar, 20 μm. The co-localization coefficients between the indicated proteins in the presence or absence of hypoxia are shown (right). At least 10 cells from each independent experiment were analyzed, and the representative data are shown (n = 6 biological experiments). (B) Parental BT-549 and MDA-MB-231 cells and the indicated clones with knock-in expression of PCK1 S151A mutants treated with or without hypoxia for 6 h were resolved by native PAGE or SDS-PAGE, followed by immunoblotting analysis as indicated. (C) Parental BT-549 and MDA-MB-231 cells and the indicated clones with knock-in expression of PCK1 S151A mutants transfected with HA-K63-UB and treated with or without hypoxia for 6 h were harvested for IP and immunoblotting analyses as indicated. (D) Parental BT-549 and MDA-MB-231 cells and the indicated clones with knock-in expression of PCK1 S151A mutants treated with or without hypoxia for 6 h were harvested for immunoblotting analyses as indicated. (E) Parental BT-549 cells and the indicated clones with knock-in expression of PCK1 S151A mutants treated with or without hypoxia for 6 h were prepared for IF analyses as indicated (upper). Scale bar, 20 μm. The co-localization coefficients between the indicated proteins in the presence or absence of hypoxia are shown (lower). At least 10 cells from each independent experiment were analyzed, and the representative data are shown (n = 6 biological experiments). (F) Parental BT-549 (left) and MDA-MB-231 (right) cells and the indicated clones with knock-in expression of PCK1 S151A mutants were transiently transfected with vectors expressing β-galactosidase and an IFN-β luciferase reporter. 24 h later, the aforementioned cells treated with or without hypoxia for 6 h were harvested for luciferase assay, and the relative IFN-β luciferase activity after normalization to β-galactosidase activity is shown (n = 4 biological experiments). (G) Parental BT-549 cells and the indicated clones with knock-in expression of PCK1 S151A mutants treated with or without hypoxia for 12 h were harvested for quantitative PCR (qPCR) analyses to measure CXCL10, IL6, IFNB1, and IFNA4 mRNA levels (n = 6 biological experiments). Experiments (B, C, and D) were repeated three times independently with similar results, and the representative data are shown. Statistical significance was determined by two-tailed Student’s t test (A and E–G). Data are the mean ± SD; *P < 0.05, **P < 0.001, and ***P < 0.0001. Source data are available for this figure: SourceData F2.
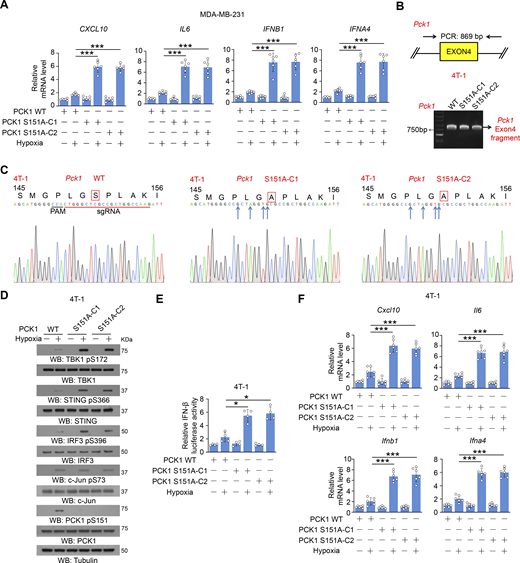
PCK1 S151 phosphorylation attenuates hypoxia-mediated activation of cGAS-STING pathway. (A) Parental MDA-MB-231 cells and the indicated clones with knock-in expression of PCK1 S151A mutants treated with or without hypoxia for 12 h were harvested for qPCR analyses to measure CXCL10, IL6, IFNB1, and IFNA4 mRNA levels (n = 6 biological experiments). (B) Genomic DNA was extracted from two individual clones of parental 4T-1 cells with knock-in expression of PCK1 S151A. PCR products amplified from the indicated DNA fragments were separated on an agarose gel. (C) Sequencing of parental 4T-1 cells and the individual clones of parental cells with knock-in expression of PCK1 S151A. The red line indicates the sgRNA-targeting sequence. The black line indicates the protospacer adjacent motif (PAM). Blue arrows indicate mutated nucleotides. A mutated amino acid and its WT counterpart are indicated by the solid red box. (D) Parental 4T-1 cells and the indicated clones with knock-in expression of PCK1 S151A mutants treated with or without hypoxia for 6 h were harvested for immunoblotting analyses as indicated. (E) Parental 4T-1 cells and the indicated clones with knock-in expression of PCK1 S151A mutants were transiently transfected with vectors expressing β-galactosidase and an IFN-β luciferase reporter. 24 h later, the aforementioned cells treated with or without hypoxia for 6 h were harvested for luciferase assay, and the relative IFN-β luciferase activity after normalization to β-galactosidase activity is shown (n = 4 biological experiments). (F) Parental 4T-1 cells and the indicated clones with knock-in expression of PCK1 S151A mutants treated with or without hypoxia for 12 h were harvested for qPCR analyses to measure Cxcl10, Il6, Ifnb1, and Ifna4 mRNA levels (n = 6 biological experiments). Experiments (D) were repeated three times independently with similar results, and the representative data are shown. Data are representative of as mean ± SD. Statistical significance was determined by two-tailed Student’s t test (A, E, and F); *P < 0.05 and ***P < 0.0001. Source data are available for this figure: SourceData FS2.
PCK1 S151 phosphorylation attenuates hypoxia-mediated activation of cGAS-STING pathway. (A) Parental MDA-MB-231 cells and the indicated clones with knock-in expression of PCK1 S151A mutants treated with or without hypoxia for 12 h were harvested for qPCR analyses to measure CXCL10, IL6, IFNB1, and IFNA4 mRNA levels (n = 6 biological experiments). (B) Genomic DNA was extracted from two individual clones of parental 4T-1 cells with knock-in expression of PCK1 S151A. PCR products amplified from the indicated DNA fragments were separated on an agarose gel. (C) Sequencing of parental 4T-1 cells and the individual clones of parental cells with knock-in expression of PCK1 S151A. The red line indicates the sgRNA-targeting sequence. The black line indicates the protospacer adjacent motif (PAM). Blue arrows indicate mutated nucleotides. A mutated amino acid and its WT counterpart are indicated by the solid red box. (D) Parental 4T-1 cells and the indicated clones with knock-in expression of PCK1 S151A mutants treated with or without hypoxia for 6 h were harvested for immunoblotting analyses as indicated. (E) Parental 4T-1 cells and the indicated clones with knock-in expression of PCK1 S151A mutants were transiently transfected with vectors expressing β-galactosidase and an IFN-β luciferase reporter. 24 h later, the aforementioned cells treated with or without hypoxia for 6 h were harvested for luciferase assay, and the relative IFN-β luciferase activity after normalization to β-galactosidase activity is shown (n = 4 biological experiments). (F) Parental 4T-1 cells and the indicated clones with knock-in expression of PCK1 S151A mutants treated with or without hypoxia for 12 h were harvested for qPCR analyses to measure Cxcl10, Il6, Ifnb1, and Ifna4 mRNA levels (n = 6 biological experiments). Experiments (D) were repeated three times independently with similar results, and the representative data are shown. Data are representative of as mean ± SD. Statistical significance was determined by two-tailed Student’s t test (A, E, and F); *P < 0.05 and ***P < 0.0001. Source data are available for this figure: SourceData FS2.
PCK1 S151 phosphorylation–mediated PCK1–cGAS interaction attenuates cGAS-STING-IFN-I signaling upon hypoxia in an enzymatic-dependent manner
To ascertain whether the metabolic enzymatic activity of PCK1 is required for PCK1 S151 phosphorylation–mediated PCK1–cGAS interaction upon hypoxia, we generated tumor cells with reconstituted expression of RNAi-resistant (r) PCK1 C288S, the catalytically inactive mutant, in endogenous PCK1-depleted breast cancer cells (Fig. 3 A), which could not affect JNK-induced PCK1 S151 phosphorylation and subsequent interaction between PCK1 and cGAS (Fig. 3 B). However, PCK1 C288S showed a similar effect on activating the STING-TBK1-IRF3 axis as the PCK1 S151A mutant (Fig. 3, C–G). These results suggest that PCK1 suppresses cGAS-STING activation upon hypoxia in an enzymatic-dependent manner.
PCK1 suppresses cGAS-STING activation upon hypoxia in an enzymatic-dependent manner. (A) BT-549 and MDA-MB-231 cells expressing PCK1 shRNA with reconstituted expression of Flag-rPCK1 WT or C288S mutant were harvested for immunoblotting analyses. (B) BT-549 cells and MDA-MB-231 cells expressing PCK1 shRNA with reconstituted expression of Flag-rPCK1 WT or C288S mutant treated with or without hypoxia for 2 h were harvested for IP and immunoblotting analyses as indicated. (C) BT-549 cells expressing PCK1 shRNA with reconstituted expression of Flag-rPCK1 WT or C288S mutant treated with or without hypoxia for 6 h were prepared for IF analyses as indicated (upper). Scale bar, 20 μm. The co-localization coefficients between the indicated proteins in the presence or absence of hypoxia are shown (lower). At least 10 cells from each independent experiment were analyzed, and the representative data are shown (n = 6 biological experiments). (D) BT-549 cells and MDA-MB-231 cells expressing PCK1 shRNA with reconstituted expression of Flag-rPCK1 WT or C288S mutant treated with or without hypoxia for 6 h were harvested for immunoblotting analyses as indicated. (E) BT-549 cells expressing PCK1 shRNA with reconstituted expression of Flag-rPCK1 WT and C288S protein treated with or without hypoxia for 6 h were prepared for IF analyses as indicated (upper). Scale bar, 20 μm. The co-localization coefficients between the indicated proteins in the presence or absence of hypoxia are shown (lower). At least 10 cells from each independent experiment were analyzed, and the representative data are shown (n = 6 biological experiments). (F) BT-549 cells and MDA-MB-231 cells expressing PCK1 shRNA with reconstituted expression of Flag-rPCK1 WT and C288S protein were transiently transfected with vectors expressing β-galactosidase and an IFN-β luciferase reporter. 24 h later, the aforementioned cells treated with or without hypoxia for 6 h were harvested for luciferase assay, and the relative IFN-β luciferase activity after normalization to β-galactosidase activity is shown (n = 4 biological experiments). (G) BT-549 cells expressing PCK1 shRNA with reconstituted expression of Flag-rPCK1 WT and C288S protein with or without hypoxia for 12 h were harvested for qPCR analyses to measure CXCL10, IL6, IFNB1, and IFNA4 mRNA levels (n = 6 biological experiments). Experiments (A, B, and D) were repeated three times independently with similar results, and the representative data are shown. Statistical significance was determined by two-tailed Student’s t test (C and E–G). Data are the mean ± SD; **P < 0.001 and ***P < 0.0001. Source data are available for this figure: SourceData F3.
PCK1 suppresses cGAS-STING activation upon hypoxia in an enzymatic-dependent manner. (A) BT-549 and MDA-MB-231 cells expressing PCK1 shRNA with reconstituted expression of Flag-rPCK1 WT or C288S mutant were harvested for immunoblotting analyses. (B) BT-549 cells and MDA-MB-231 cells expressing PCK1 shRNA with reconstituted expression of Flag-rPCK1 WT or C288S mutant treated with or without hypoxia for 2 h were harvested for IP and immunoblotting analyses as indicated. (C) BT-549 cells expressing PCK1 shRNA with reconstituted expression of Flag-rPCK1 WT or C288S mutant treated with or without hypoxia for 6 h were prepared for IF analyses as indicated (upper). Scale bar, 20 μm. The co-localization coefficients between the indicated proteins in the presence or absence of hypoxia are shown (lower). At least 10 cells from each independent experiment were analyzed, and the representative data are shown (n = 6 biological experiments). (D) BT-549 cells and MDA-MB-231 cells expressing PCK1 shRNA with reconstituted expression of Flag-rPCK1 WT or C288S mutant treated with or without hypoxia for 6 h were harvested for immunoblotting analyses as indicated. (E) BT-549 cells expressing PCK1 shRNA with reconstituted expression of Flag-rPCK1 WT and C288S protein treated with or without hypoxia for 6 h were prepared for IF analyses as indicated (upper). Scale bar, 20 μm. The co-localization coefficients between the indicated proteins in the presence or absence of hypoxia are shown (lower). At least 10 cells from each independent experiment were analyzed, and the representative data are shown (n = 6 biological experiments). (F) BT-549 cells and MDA-MB-231 cells expressing PCK1 shRNA with reconstituted expression of Flag-rPCK1 WT and C288S protein were transiently transfected with vectors expressing β-galactosidase and an IFN-β luciferase reporter. 24 h later, the aforementioned cells treated with or without hypoxia for 6 h were harvested for luciferase assay, and the relative IFN-β luciferase activity after normalization to β-galactosidase activity is shown (n = 4 biological experiments). (G) BT-549 cells expressing PCK1 shRNA with reconstituted expression of Flag-rPCK1 WT and C288S protein with or without hypoxia for 12 h were harvested for qPCR analyses to measure CXCL10, IL6, IFNB1, and IFNA4 mRNA levels (n = 6 biological experiments). Experiments (A, B, and D) were repeated three times independently with similar results, and the representative data are shown. Statistical significance was determined by two-tailed Student’s t test (C and E–G). Data are the mean ± SD; **P < 0.001 and ***P < 0.0001. Source data are available for this figure: SourceData F3.
Additionally, the enhanced activation of the STING-TBK1-IRF3 axis by expression of both PCK1 C288S and PCK1 S151A was abrogated by cGAS depletion (Fig. 4, A–C), revealing that PCK1 suppresses STING activation dependent on cGAS. Furthermore, we performed bulk RNA sequencing (RNA-seq) analysis to identify differentially expressed genes in the transcriptomes of MDA-MB-231 cells expressing WT PCK1 or PCK1 S151A with or without hypoxia treatment (Fig. 4 D and Fig. S3 A). Compared with WT tumor cells, PCK1 S151A dramatically elevates the expression of target genes associated with IFN-I signaling pathways upon hypoxia (Fig. 4, E and F), such as “Response to IFN β,” “Positive regulation of type I IFN production,” and “Response to type I IFN,” as reflected by functional enrichment (Gene Ontology [GO] and KEGG) analysis (Fig. 4 G) and the gene set enrichment analysis (Fig. 4 H), respectively. Of note, cGAS depletion could totally eliminate the aforementioned PCK1 S151A-mediated IFN-I signaling activation upon hypoxia (Fig. 4, E–H), suggesting that PCK1 S151 phosphorylation attenuates hypoxia-induced IFN-I signaling and its downstream gene expression in a cGAS-dependent manner. Consistently, the regulatory effects of aforementioned PCK1 mutants (i.e., S151A and C288S) on the cGAS-STING pathway were totally abrogated by STING depletion (Fig. S3, B–D). These data further supported the PCK1 S151 phosphorylation restrains hypoxia-induced IFN-I signaling in a cGAS-STING axis–dependent manner.
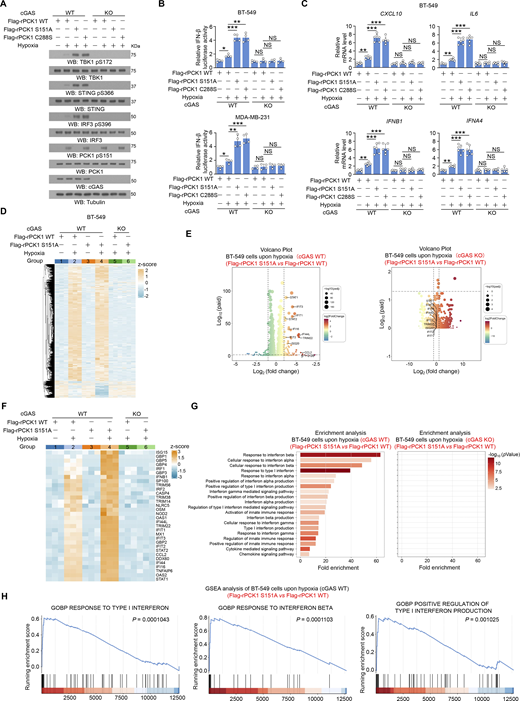
PCK1 S151 phosphorylation attenuates hypoxia-induced IFN-I signaling in a cGAS-dependent manner. (A) Parental and cGAS-KO BT-549 cells expressing PCK1 shRNA with reconstituted expression of Flag-rPCK1 WT or Flag-rPCK1 mutants treated with or without hypoxia for 6 h were harvested for immunoblotting analyses as indicated. (B) Parental and cGAS-KO BT-549 cells (upper) and MDA-MB-231 cells (lower) expressing PCK1 shRNA with reconstituted expression of Flag-rPCK1 WT or Flag-rPCK1 mutants were transiently transfected with vectors expressing β-galactosidase and an IFN-β luciferase reporter. 24 h later, the aforementioned cells treated with or without hypoxia for 6 h were harvested for luciferase assay, and the relative IFN-β luciferase activity after normalization to β-galactosidase activity is shown (n = 4 biological experiments). (C) Parental and cGAS-KO BT-549 cells expressing PCK1 shRNA with reconstituted expression of Flag-rPCK1 WT or Flag-rPCK1 mutants treated with or without hypoxia for 12 h were harvested for qPCR analyses to measure CXCL10, IL6, IFNB1, and IFNA4 mRNA levels (n = 6 biological experiments). (D) Parental and cGAS-KO BT-549 cells expressing PCK1 shRNA with reconstituted expression of Flag-rPCK1 WT or S151A mutant treated with or without hypoxia for 12 h were harvested for bulk RNA-seq analyses. Heatmap represents differentially expressed genes in the indicated groups (n = 3 biological experiments). (E and F) Parental (E) and cGAS-KO (F) BT-549 cells expressing PCK1 shRNA with reconstituted expression of the Flag-rPCK1 WT or S151A mutant treated with hypoxia for 12 h. Volcano plot showing the differentially expressed genes between the indicated groups (absolute log2 fold change >1; P < 0.05) (n = 3 biological experiments). (F) Parental and cGAS-KO BT-549 cells expressing PCK1 shRNA with reconstituted expression of Flag-rPCK1 WT or S151A mutant treated with or without hypoxia for 12 h. The differently expressing ISGs in the indicated groups were identified using transcriptomic data in D and presented as the heatmap plot (n = 3 biological experiments). (G) Parental (left) or cGAS KO (right) BT-549 cells expressing PCK1 shRNA with reconstituted expression of the Flag-rPCK1 WT or S151A mutant treated with hypoxia for 12 h. Functional enrichment (GO and KEGG) analyses of IFN-I–associated pathways enriched between the indicated groups were identified using transcriptomic data in D (n = 3 biological experiments). (H) Parental (left) or cGAS KO (right) BT-549 cells expressing PCK1 shRNA with reconstituted expression of the Flag-rPCK1 WT or S151A mutant treated with hypoxia for 12 h. Gene set enrichment analysis (GSEA) showing the representative IFN-I–associated pathways enriched between the indicated groups were identified using transcriptomic data in D (n = 3 biological experiments). The experiment (A) was repeated three times independently with similar results, and the representative data are shown. Statistical significance was determined by two-tailed Student’s t test (B and C). Data are the mean ± SD; *P < 0.05, **P < 0.001, and ***P < 0.0001; NS, not significant. Source data are available for this figure: SourceData F4.
PCK1 S151 phosphorylation attenuates hypoxia-induced IFN-I signaling in a cGAS-dependent manner. (A) Parental and cGAS-KO BT-549 cells expressing PCK1 shRNA with reconstituted expression of Flag-rPCK1 WT or Flag-rPCK1 mutants treated with or without hypoxia for 6 h were harvested for immunoblotting analyses as indicated. (B) Parental and cGAS-KO BT-549 cells (upper) and MDA-MB-231 cells (lower) expressing PCK1 shRNA with reconstituted expression of Flag-rPCK1 WT or Flag-rPCK1 mutants were transiently transfected with vectors expressing β-galactosidase and an IFN-β luciferase reporter. 24 h later, the aforementioned cells treated with or without hypoxia for 6 h were harvested for luciferase assay, and the relative IFN-β luciferase activity after normalization to β-galactosidase activity is shown (n = 4 biological experiments). (C) Parental and cGAS-KO BT-549 cells expressing PCK1 shRNA with reconstituted expression of Flag-rPCK1 WT or Flag-rPCK1 mutants treated with or without hypoxia for 12 h were harvested for qPCR analyses to measure CXCL10, IL6, IFNB1, and IFNA4 mRNA levels (n = 6 biological experiments). (D) Parental and cGAS-KO BT-549 cells expressing PCK1 shRNA with reconstituted expression of Flag-rPCK1 WT or S151A mutant treated with or without hypoxia for 12 h were harvested for bulk RNA-seq analyses. Heatmap represents differentially expressed genes in the indicated groups (n = 3 biological experiments). (E and F) Parental (E) and cGAS-KO (F) BT-549 cells expressing PCK1 shRNA with reconstituted expression of the Flag-rPCK1 WT or S151A mutant treated with hypoxia for 12 h. Volcano plot showing the differentially expressed genes between the indicated groups (absolute log2 fold change >1; P < 0.05) (n = 3 biological experiments). (F) Parental and cGAS-KO BT-549 cells expressing PCK1 shRNA with reconstituted expression of Flag-rPCK1 WT or S151A mutant treated with or without hypoxia for 12 h. The differently expressing ISGs in the indicated groups were identified using transcriptomic data in D and presented as the heatmap plot (n = 3 biological experiments). (G) Parental (left) or cGAS KO (right) BT-549 cells expressing PCK1 shRNA with reconstituted expression of the Flag-rPCK1 WT or S151A mutant treated with hypoxia for 12 h. Functional enrichment (GO and KEGG) analyses of IFN-I–associated pathways enriched between the indicated groups were identified using transcriptomic data in D (n = 3 biological experiments). (H) Parental (left) or cGAS KO (right) BT-549 cells expressing PCK1 shRNA with reconstituted expression of the Flag-rPCK1 WT or S151A mutant treated with hypoxia for 12 h. Gene set enrichment analysis (GSEA) showing the representative IFN-I–associated pathways enriched between the indicated groups were identified using transcriptomic data in D (n = 3 biological experiments). The experiment (A) was repeated three times independently with similar results, and the representative data are shown. Statistical significance was determined by two-tailed Student’s t test (B and C). Data are the mean ± SD; *P < 0.05, **P < 0.001, and ***P < 0.0001; NS, not significant. Source data are available for this figure: SourceData F4.
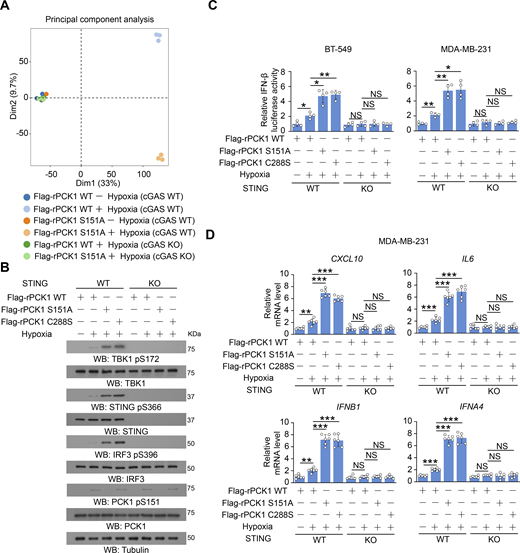
The inhibitory effect of PCK1 S151 phosphorylation on IFN-I depends on cGAS-STING pathway. (A) Parental and cGAS-KO BT-549 cells expressing PCK1 shRNA with reconstituted expression of Flag-rPCK1 WT or S151A mutant treated with or without hypoxia for 12 h were harvested for bulk RNA-seq analyses. Principal component analysis of the variance-stabilized estimated raw counts of differentially expressed genes in the cells from six groups as indicated (n = 3). (B) Parental or STING-KO BT-549 cells expressing PCK1 shRNA with reconstituted expression of Flag-rPCK1 WT or Flag-rPCK1 mutants treated with or without hypoxia for 6 h were harvested for immunoblotting analyses as indicated. (C) Parental or STING-KO BT-549 and MDA-MB-231 cells expressing PCK1 shRNA with reconstituted expression of Flag-rPCK1 WT or Flag-rPCK1 mutants, which were transiently transfected with vectors expressing β-galactosidase and an IFN-β luciferase reporter. 24 h later, the aforementioned cells treated with or without hypoxia for 6 h were harvested for luciferase assay, and the relative IFN-β luciferase activity after normalization to β-galactosidase activity is shown (n = 4 biological experiments). (D) Parental or STING-KO MDA-MB-231 cells expressing PCK1 shRNA with reconstituted expression of Flag-rPCK1 WT or Flag-rPCK1 mutants treated with or without hypoxia for 12 h were harvested for qPCR analyses to measure CXCL10, IL6, IFNB1, and IFNA4 mRNA levels (n = 6 biological experiments). The experiment (B) was repeated three times independently with similar results, and the representative data are shown. Data are representative of as mean ± SD. Statistical significance was determined by two-tailed Student’s t test (C and D); *P < 0.05, **P < 0.001, and ***P < 0.0001; NS, not significant. Source data are available for this figure: SourceData FS3.
The inhibitory effect of PCK1 S151 phosphorylation on IFN-I depends on cGAS-STING pathway. (A) Parental and cGAS-KO BT-549 cells expressing PCK1 shRNA with reconstituted expression of Flag-rPCK1 WT or S151A mutant treated with or without hypoxia for 12 h were harvested for bulk RNA-seq analyses. Principal component analysis of the variance-stabilized estimated raw counts of differentially expressed genes in the cells from six groups as indicated (n = 3). (B) Parental or STING-KO BT-549 cells expressing PCK1 shRNA with reconstituted expression of Flag-rPCK1 WT or Flag-rPCK1 mutants treated with or without hypoxia for 6 h were harvested for immunoblotting analyses as indicated. (C) Parental or STING-KO BT-549 and MDA-MB-231 cells expressing PCK1 shRNA with reconstituted expression of Flag-rPCK1 WT or Flag-rPCK1 mutants, which were transiently transfected with vectors expressing β-galactosidase and an IFN-β luciferase reporter. 24 h later, the aforementioned cells treated with or without hypoxia for 6 h were harvested for luciferase assay, and the relative IFN-β luciferase activity after normalization to β-galactosidase activity is shown (n = 4 biological experiments). (D) Parental or STING-KO MDA-MB-231 cells expressing PCK1 shRNA with reconstituted expression of Flag-rPCK1 WT or Flag-rPCK1 mutants treated with or without hypoxia for 12 h were harvested for qPCR analyses to measure CXCL10, IL6, IFNB1, and IFNA4 mRNA levels (n = 6 biological experiments). The experiment (B) was repeated three times independently with similar results, and the representative data are shown. Data are representative of as mean ± SD. Statistical significance was determined by two-tailed Student’s t test (C and D); *P < 0.05, **P < 0.001, and ***P < 0.0001; NS, not significant. Source data are available for this figure: SourceData FS3.
In contrast to the promoting effect of PCK1 S151A on activation of the STING-TBK1-IRF3 axis, reconstituted expression of PCK1 S151D inhibited herring testis (HT)-DNA transfection-induced activation of cGAS-STING, and this inhibition was alleviated by expression the PCK1 S151D/C288S mutant, which contains the mutations of both S151D and C288S (Fig. 5, A–E). However, the cGAMP-induced STING/TBK1 activation was unaffected by PCK1 S151D and S151D/C288S mutant (Fig. 5, F–J). These data suggest that PCK1 S151 phosphorylation–mediated PCK1–cGAS interaction limits cGAS-STING activation via inhibiting cGAS activity.
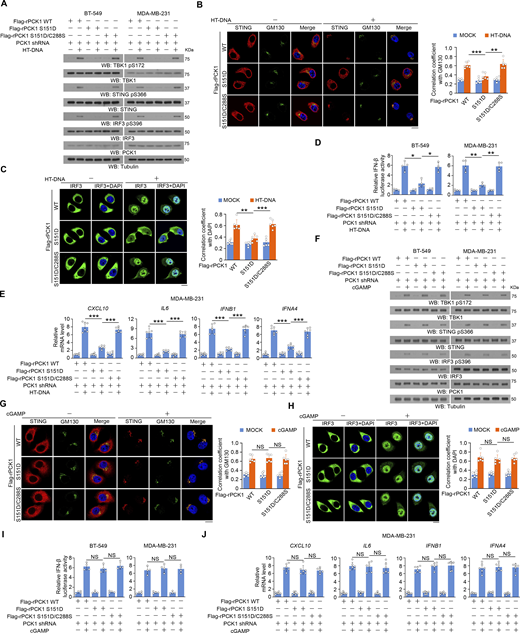
PCK1 S151 phosphorylation–mediated PCK1–cGAS interaction limits cGAS-STING activation via inhibiting cGAS activity. (A) BT-549 and MDA-MB-231 cells expressing PCK1 shRNA with reconstituted expression of Flag-rPCK1 WT or Flag-rPCK1 mutants transfected with or without 2 μg/ml HT-DNA for 6 h were harvested for immunoblotting analyses as indicated. (B and C) BT-549 cells expressing PCK1 shRNA with reconstituted expression of Flag-rPCK1 WT or Flag-rPCK1 mutants transfected with or without 2 μg/ml HT-DNA for 6 h were prepared for IF analyses as indicated (B, left; C, left). Scale bar, 20 μm.The co-localization coefficients between the indicated proteins in the presence or absence of HT-DNA stimulation are shown (B, right; C, right). At least 10 cells from each independent experiment were analyzed, and the representative data are shown (n = 6 biological experiments). (D) BT-549 (left) and MDA-MB-231 (right) cells expressing PCK1 shRNA with reconstituted expression of the indicated PCK1 proteins were transiently transfected with vectors expressing β-galactosidase and an IFN-β luciferase reporter. 24 h later, the aforementioned cells treated with or without 2 μg/ml HT-DNA for 6 h were harvested for luciferase assay, and the relative IFN-β luciferase activity after normalization to β-galactosidase activity is shown (n = 4 biological experiments). (E) MDA-MB-231 cells expressing PCK1 shRNA with reconstituted expression of Flag-rPCK1 WT or Flag-rPCK1 mutants transfected with or without 2 μg/ml HT-DNA for 12 h were harvested for qPCR analyses to measure CXCL10, IL6, IFNB1, and IFNA4 mRNA levels (n = 6 biological experiments). (F) BT-549 and MDA-MB-231 cells expressing PCK1 shRNA with reconstituted expression of Flag-rPCK1 WT or Flag-rPCK1 mutants treated with or without cGAMP for 6 h were harvested for immunoblotting analyses as indicated. (G and H) BT-549 cells expressing PCK1 shRNA with reconstituted expression of Flag-rPCK1 WT or Flag-rPCK1 mutants treated with or without cGAMP for 6 h were prepared for IF analyses as indicated (G, left; H, left). Scale bar, 20 μm.The co-localization coefficients between the indicated proteins in the presence or absence of cGAMP stimulation (G, right; H, right). At least 10 cells from each independent experiment were analyzed and representative data are shown (n = 6 biological experiments). (I) BT-549 (left) and MDA-MB-231 cells (right) expressing PCK1 shRNA with reconstituted expression of Flag-rPCK1 WT or Flag-rPCK1 mutants were transiently transfected with vectors expressing β-galactosidase and an IFN-β luciferase reporter. 24 h later, the aforementioned cells treated with or without cGAMP for 6 h were harvested for luciferase assay, and the relative IFN-β luciferase activity after normalization to β-galactosidase activity is shown (n = 4 biological experiments). (J) MDA-MB-231 cells expressing PCK1 shRNA with reconstituted expression of the indicated PCK1 proteins treated with or without cGAMP for 12 h were harvested for qPCR analyses to measure CXCL10, IL6, IFNB1, and IFNA4 mRNA levels (n = 6 biological experiments). Experiments (A and F) were repeated three times independently with similar results, and the representative data are shown. Statistical significance was determined by two-tailed Student’s t test (B–E and G–J). Data are the mean ± SD; *P < 0.05, **P < 0.001, and ***P < 0.0001; NS, not significant. Source data are available for this figure: SourceData F5.
PCK1 S151 phosphorylation–mediated PCK1–cGAS interaction limits cGAS-STING activation via inhibiting cGAS activity. (A) BT-549 and MDA-MB-231 cells expressing PCK1 shRNA with reconstituted expression of Flag-rPCK1 WT or Flag-rPCK1 mutants transfected with or without 2 μg/ml HT-DNA for 6 h were harvested for immunoblotting analyses as indicated. (B and C) BT-549 cells expressing PCK1 shRNA with reconstituted expression of Flag-rPCK1 WT or Flag-rPCK1 mutants transfected with or without 2 μg/ml HT-DNA for 6 h were prepared for IF analyses as indicated (B, left; C, left). Scale bar, 20 μm.The co-localization coefficients between the indicated proteins in the presence or absence of HT-DNA stimulation are shown (B, right; C, right). At least 10 cells from each independent experiment were analyzed, and the representative data are shown (n = 6 biological experiments). (D) BT-549 (left) and MDA-MB-231 (right) cells expressing PCK1 shRNA with reconstituted expression of the indicated PCK1 proteins were transiently transfected with vectors expressing β-galactosidase and an IFN-β luciferase reporter. 24 h later, the aforementioned cells treated with or without 2 μg/ml HT-DNA for 6 h were harvested for luciferase assay, and the relative IFN-β luciferase activity after normalization to β-galactosidase activity is shown (n = 4 biological experiments). (E) MDA-MB-231 cells expressing PCK1 shRNA with reconstituted expression of Flag-rPCK1 WT or Flag-rPCK1 mutants transfected with or without 2 μg/ml HT-DNA for 12 h were harvested for qPCR analyses to measure CXCL10, IL6, IFNB1, and IFNA4 mRNA levels (n = 6 biological experiments). (F) BT-549 and MDA-MB-231 cells expressing PCK1 shRNA with reconstituted expression of Flag-rPCK1 WT or Flag-rPCK1 mutants treated with or without cGAMP for 6 h were harvested for immunoblotting analyses as indicated. (G and H) BT-549 cells expressing PCK1 shRNA with reconstituted expression of Flag-rPCK1 WT or Flag-rPCK1 mutants treated with or without cGAMP for 6 h were prepared for IF analyses as indicated (G, left; H, left). Scale bar, 20 μm.The co-localization coefficients between the indicated proteins in the presence or absence of cGAMP stimulation (G, right; H, right). At least 10 cells from each independent experiment were analyzed and representative data are shown (n = 6 biological experiments). (I) BT-549 (left) and MDA-MB-231 cells (right) expressing PCK1 shRNA with reconstituted expression of Flag-rPCK1 WT or Flag-rPCK1 mutants were transiently transfected with vectors expressing β-galactosidase and an IFN-β luciferase reporter. 24 h later, the aforementioned cells treated with or without cGAMP for 6 h were harvested for luciferase assay, and the relative IFN-β luciferase activity after normalization to β-galactosidase activity is shown (n = 4 biological experiments). (J) MDA-MB-231 cells expressing PCK1 shRNA with reconstituted expression of the indicated PCK1 proteins treated with or without cGAMP for 12 h were harvested for qPCR analyses to measure CXCL10, IL6, IFNB1, and IFNA4 mRNA levels (n = 6 biological experiments). Experiments (A and F) were repeated three times independently with similar results, and the representative data are shown. Statistical significance was determined by two-tailed Student’s t test (B–E and G–J). Data are the mean ± SD; *P < 0.05, **P < 0.001, and ***P < 0.0001; NS, not significant. Source data are available for this figure: SourceData F5.
cGAS-associated PCK1 inhibits cGAS activation through competitive consumption of GTP, but not ATP
To determine the mechanism underlying PCK1-mediated inhibition of cGAS activity, we examined cGAS activity in vitro and showed that HT-DNA substantially enhanced purified WT His-cGAS–produced cGAMP, but not its catalytically inactive His-cGAS E225A/D227A mutant (Fig. 6, A and B). This enhancement was suppressed by purified WT GST-PCK1 in the presence, but not the absence of PCK1 substrate oxaloacetate (OAA), suggesting a requirement of PCK1-mediated metabolic reaction for cGAS inhibition (Fig. 6, A and B). Consistently, PCK1 C288S lost its ability to inhibit cGAS (Fig. 6, A and B). Given that both cGAS and PCK1 use GTP as a substrate for their metabolic reaction with relatively similar Michaelis-Menten constant (Km) (Fig. S4, A and B), we employed more excessive GTP or ATP in the reaction and showed that excessive GTP, but not ATP, abolished the inhibitory effect of WT GST-PCK1 on cGAS (Fig. 6, C and D). These results suggest that PCK1 inhibits cGAS through competitive consumption of GTP.
cGAS-associated PCK1 inhibits cGAS activation through competitive consumption of GTP, but not ATP. (A and B) Bacteria-purified cGAS proteins (2 mM) were incubated with HT-DNA (0.2 mg/ml), ATP (2 mM), and GTP (2 mM) in the presence or absence of 2 mM OAA and 2 mM bacteria-purified PCK1 proteins for the in vitro cGAMP production assay (n = 6 biological experiments) (A). After incubation, cGAS was heat inactivated, and products were subject to a cell-based cGAMP activity assay in BT-549 cells. Total cell lysates were harvested for immunoblotting analyses as indicated (B). (C and D) Bacteria-purified cGAS proteins (2 mM) were incubated with HT-DNA (0.2 mg/ml), ATP (2 mM), and different ATP/GTP titrations (2 mM, 4 mM, and 8 mM, respectively) in the presence or absence of 2 mM OAA and 2 mM bacteria-purified PCK1 proteins for the in vitro cGAMP production assay (C, left) (n = 6 biological experiments). The purity of bacteria-purified GST-PCK1 and His-PCK1 WT was identified by Coomassie blue staining (C, right). After incubation, cGAS was heat inactivated, and products were subject to a cell-based cGAMP activity assay in BT-549 cells. Total cell lysates were harvested for immunoblotting analyses as indicated (D). (E and F) BT-549 and MDA-MB-231 cells expressing PCK1 shRNA with reconstituted expression of Flag-rPCK1 WT or Flag-rPCK1 mutants treated with or without hypoxia in the presence or absence of ATP or GTP (0.1 or 0.5 mM) and digitonin (25 mg/ml) for 6 h were harvested for intracellular cGAMP measurement (E) (n = 6 biological experiments). Total cell lysates were harvested for immunoblotting analyses as indicated (F). (G) BT-549 cells expressing PCK1 shRNA with reconstituted expression of Flag-rPCK1 WT or Flag-rPCK1 mutants transfected with or without 2 μg/ml HT-DNA in the presence or absence of 0.5 mM ATP or GTP and digitonin (25 mg/ml) for 6 h were prepared for IF analyses as indicated (upper). Scale bar, 20 μm.The co-localization coefficients between the indicated proteins in the presence or absence of HT-DNA stimulation (lower). At least 10 cells from each independent experiment were analyzed and representative data are shown (n = 6 biological experiments). (H) BT-549 cells expressing PCK1 shRNA with reconstituted expression of Flag-rPCK1 WT or Flag-rPCK1 mutants transfected with or without 2 μg/ml HT-DNA in the presence or absence of 0.5 mM ATP or GTP and digitonin (25 mg/ml) for 6 h were harvested for immunoblotting analyses as indicated. (I) BT-549 cells expressing PCK1 shRNA with reconstituted expression of Flag-rPCK1 WT or Flag-rPCK1 mutants transfected with or without 2 μg/ml HT-DNA in the presence or absence of 0.5 mM ATP or GTP and digitonin (25 mg/ml) for 6 h were prepared for IF analyses as indicated (left). The co-localization coefficients between the indicated proteins in the presence or absence of hypoxia are shown (right). At least 10 cells from each independent experiment were analyzed, and the representative data are shown (n = 6 biological experiments). (J) BT-549 (left) and MDA-MB-231 (right) cells expressing PCK1 shRNA with reconstituted expression of Flag-rPCK1 WT or S151D mutant were transiently transfected with vectors expressing β-galactosidase and an IFN-β luciferase reporter. 24 h later, the aforementioned cells transfected with or without 2 μg/ml HT-DNA in the presence or absence of 0.5 mM ATP or GTP and digitonin (25 mg/ml) for 6 h were harvested for luciferase assay, and the relative IFN-β luciferase activity after normalization to β-galactosidase activity is shown (n = 4 biological experiments). (K) BT-549 cells expressing PCK1 shRNA with reconstituted expression of Flag-rPCK1 WT or S151D mutant transfected with or without 2 μg/ml HT-DNA in the presence or absence of 0.5 mM ATP or GTP and digitonin (25 mg/ml) for 12 h were harvested for qPCR analyses to measure CXCL10, IL6, IFNB1, and IFNA4 mRNA levels (n = 6 biological experiments). Experiments (B, D, F, and H) were repeated three times independently with similar results, and the representative data are shown. Statistical significance was determined by two-tailed Student’s t test (A, C, E, G, and I–K). Data are the mean ± SD; **P < 0.001 and ***P < 0.0001; NS, not significant. Source data are available for this figure: SourceData F6.
cGAS-associated PCK1 inhibits cGAS activation through competitive consumption of GTP, but not ATP. (A and B) Bacteria-purified cGAS proteins (2 mM) were incubated with HT-DNA (0.2 mg/ml), ATP (2 mM), and GTP (2 mM) in the presence or absence of 2 mM OAA and 2 mM bacteria-purified PCK1 proteins for the in vitro cGAMP production assay (n = 6 biological experiments) (A). After incubation, cGAS was heat inactivated, and products were subject to a cell-based cGAMP activity assay in BT-549 cells. Total cell lysates were harvested for immunoblotting analyses as indicated (B). (C and D) Bacteria-purified cGAS proteins (2 mM) were incubated with HT-DNA (0.2 mg/ml), ATP (2 mM), and different ATP/GTP titrations (2 mM, 4 mM, and 8 mM, respectively) in the presence or absence of 2 mM OAA and 2 mM bacteria-purified PCK1 proteins for the in vitro cGAMP production assay (C, left) (n = 6 biological experiments). The purity of bacteria-purified GST-PCK1 and His-PCK1 WT was identified by Coomassie blue staining (C, right). After incubation, cGAS was heat inactivated, and products were subject to a cell-based cGAMP activity assay in BT-549 cells. Total cell lysates were harvested for immunoblotting analyses as indicated (D). (E and F) BT-549 and MDA-MB-231 cells expressing PCK1 shRNA with reconstituted expression of Flag-rPCK1 WT or Flag-rPCK1 mutants treated with or without hypoxia in the presence or absence of ATP or GTP (0.1 or 0.5 mM) and digitonin (25 mg/ml) for 6 h were harvested for intracellular cGAMP measurement (E) (n = 6 biological experiments). Total cell lysates were harvested for immunoblotting analyses as indicated (F). (G) BT-549 cells expressing PCK1 shRNA with reconstituted expression of Flag-rPCK1 WT or Flag-rPCK1 mutants transfected with or without 2 μg/ml HT-DNA in the presence or absence of 0.5 mM ATP or GTP and digitonin (25 mg/ml) for 6 h were prepared for IF analyses as indicated (upper). Scale bar, 20 μm.The co-localization coefficients between the indicated proteins in the presence or absence of HT-DNA stimulation (lower). At least 10 cells from each independent experiment were analyzed and representative data are shown (n = 6 biological experiments). (H) BT-549 cells expressing PCK1 shRNA with reconstituted expression of Flag-rPCK1 WT or Flag-rPCK1 mutants transfected with or without 2 μg/ml HT-DNA in the presence or absence of 0.5 mM ATP or GTP and digitonin (25 mg/ml) for 6 h were harvested for immunoblotting analyses as indicated. (I) BT-549 cells expressing PCK1 shRNA with reconstituted expression of Flag-rPCK1 WT or Flag-rPCK1 mutants transfected with or without 2 μg/ml HT-DNA in the presence or absence of 0.5 mM ATP or GTP and digitonin (25 mg/ml) for 6 h were prepared for IF analyses as indicated (left). The co-localization coefficients between the indicated proteins in the presence or absence of hypoxia are shown (right). At least 10 cells from each independent experiment were analyzed, and the representative data are shown (n = 6 biological experiments). (J) BT-549 (left) and MDA-MB-231 (right) cells expressing PCK1 shRNA with reconstituted expression of Flag-rPCK1 WT or S151D mutant were transiently transfected with vectors expressing β-galactosidase and an IFN-β luciferase reporter. 24 h later, the aforementioned cells transfected with or without 2 μg/ml HT-DNA in the presence or absence of 0.5 mM ATP or GTP and digitonin (25 mg/ml) for 6 h were harvested for luciferase assay, and the relative IFN-β luciferase activity after normalization to β-galactosidase activity is shown (n = 4 biological experiments). (K) BT-549 cells expressing PCK1 shRNA with reconstituted expression of Flag-rPCK1 WT or S151D mutant transfected with or without 2 μg/ml HT-DNA in the presence or absence of 0.5 mM ATP or GTP and digitonin (25 mg/ml) for 12 h were harvested for qPCR analyses to measure CXCL10, IL6, IFNB1, and IFNA4 mRNA levels (n = 6 biological experiments). Experiments (B, D, F, and H) were repeated three times independently with similar results, and the representative data are shown. Statistical significance was determined by two-tailed Student’s t test (A, C, E, G, and I–K). Data are the mean ± SD; **P < 0.001 and ***P < 0.0001; NS, not significant. Source data are available for this figure: SourceData F6.
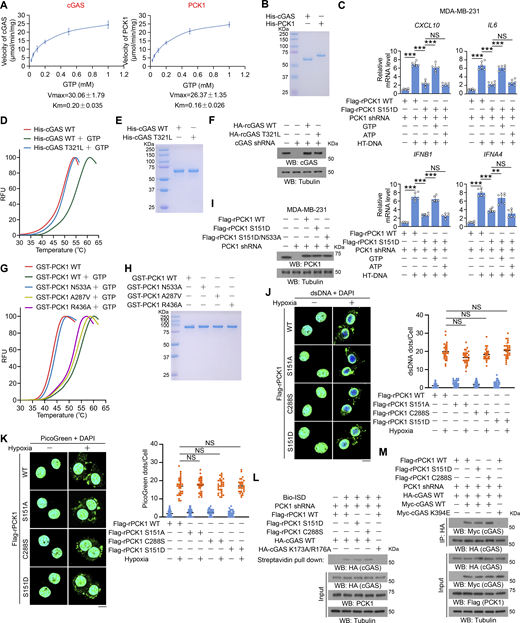
The GTP-binding affinity of PCK1 and cGAS is indispensable for PCK1 S151 phosphorylation–mediated cGAS-STING inhibition. (A and B) Enzymatic kinetic plot of His-cGAS and His-PCK1 toward GTP is presented (A) (n = 3 biological experiments), and Coomassie blue staining (B) was performed to show the purity of bacterially purified proteins in A. (C) MDA-MB-231 cells expressing PCK1 shRNA with reconstituted expression of Flag-rPCK1 WT or S151D mutant transfected with or without 2 μg/ml HT-DNA in the presence or absence of 0.5 mM ATP or GTP and digitonin (25 mg/ml) for 12 h were harvested for qPCR analyses to measure CXCL10, IL6, IFNB1, and IFNA4 mRNA levels (n = 6 biological experiments). (D) The thermal stability of His-cGAS WT or T321L mutant was detected by TSA. RFU, relative fluorescence units. (E) The purity of bacterially purified His-cGAS WT and T321L mutant was analyzed by Coomassie blue staining. (F) MDA-MB-231 cells expressing PCK1 shRNA and cGAS shRNA with reconstituted expression of the indicated PCK1 or cGAS proteins were harvested for immunoblotting analyses as indicated. (G) The thermal stability of GST-PCK1 WT or GST-PCK1 N533A, A287V, or R436A mutants was detected by TSA. RFU, relative fluorescence units. (H) The purity of bacterially purified GST-PCK1 WT or GST-PCK1 N533A, A287V, or R436A mutants was analyzed by Coomassie blue staining. (I) MDA-MB-231 cells expressing PCK1 shRNA with reconstituted expression of Flag-rPCK1 WT or Flag-rPCK1 mutants were harvested for immunoblotting analyses as indicated. (J and K) BT-549 cells expressing PCK1 shRNA with reconstituted expression of Flag-rPCK1 WT or Flag-rPCK1 mutants treated with or without hypoxia for 6 h were prepared for IF analyses with an anti-dsDNA–specific antibody (J, left) or 3 μl/ml PicoGreen staining (K, left). Scale bar, 20 μm. Graphical representation shows dsDNA and PicoGreen quantitation, respectively (J and K, right). At least n = 30 cells from each independent experiment were analyzed and representative data are shown. (L) BT-549 cells expressing PCK1 shRNA with reconstituted expression of Flag-rPCK1 WT or Flag-rPCK1 mutants transfected with HA-tagged WT or DNA-binding defective mutant (K173A/R176A) were harvested for the biotin pull-down assay to measure the DNA-binding ability of cGAS. ISD indicates IFN stimulatory DNA. (M) BT-549 cells expressing PCK1 shRNA with reconstituted expression of Flag-rPCK1 WT or Flag-rPCK1 mutants transfected with Myc-tagged WT or cGAS K394E were harvested for IP and immunoblotting analyses as indicated. Experiments (D–I, L, and M) were repeated three times independently with similar results, and the representative data are shown. Data are representative of as mean ± SD. Statistical significance was determined by two-tailed Student’s t test (C), two-way ANOVA, followed by Tukey’s test (J and K); **P < 0.001 and ***P < 0.0001; NS, not significant. Source data are available for this figure: SourceData FS4.
The GTP-binding affinity of PCK1 and cGAS is indispensable for PCK1 S151 phosphorylation–mediated cGAS-STING inhibition. (A and B) Enzymatic kinetic plot of His-cGAS and His-PCK1 toward GTP is presented (A) (n = 3 biological experiments), and Coomassie blue staining (B) was performed to show the purity of bacterially purified proteins in A. (C) MDA-MB-231 cells expressing PCK1 shRNA with reconstituted expression of Flag-rPCK1 WT or S151D mutant transfected with or without 2 μg/ml HT-DNA in the presence or absence of 0.5 mM ATP or GTP and digitonin (25 mg/ml) for 12 h were harvested for qPCR analyses to measure CXCL10, IL6, IFNB1, and IFNA4 mRNA levels (n = 6 biological experiments). (D) The thermal stability of His-cGAS WT or T321L mutant was detected by TSA. RFU, relative fluorescence units. (E) The purity of bacterially purified His-cGAS WT and T321L mutant was analyzed by Coomassie blue staining. (F) MDA-MB-231 cells expressing PCK1 shRNA and cGAS shRNA with reconstituted expression of the indicated PCK1 or cGAS proteins were harvested for immunoblotting analyses as indicated. (G) The thermal stability of GST-PCK1 WT or GST-PCK1 N533A, A287V, or R436A mutants was detected by TSA. RFU, relative fluorescence units. (H) The purity of bacterially purified GST-PCK1 WT or GST-PCK1 N533A, A287V, or R436A mutants was analyzed by Coomassie blue staining. (I) MDA-MB-231 cells expressing PCK1 shRNA with reconstituted expression of Flag-rPCK1 WT or Flag-rPCK1 mutants were harvested for immunoblotting analyses as indicated. (J and K) BT-549 cells expressing PCK1 shRNA with reconstituted expression of Flag-rPCK1 WT or Flag-rPCK1 mutants treated with or without hypoxia for 6 h were prepared for IF analyses with an anti-dsDNA–specific antibody (J, left) or 3 μl/ml PicoGreen staining (K, left). Scale bar, 20 μm. Graphical representation shows dsDNA and PicoGreen quantitation, respectively (J and K, right). At least n = 30 cells from each independent experiment were analyzed and representative data are shown. (L) BT-549 cells expressing PCK1 shRNA with reconstituted expression of Flag-rPCK1 WT or Flag-rPCK1 mutants transfected with HA-tagged WT or DNA-binding defective mutant (K173A/R176A) were harvested for the biotin pull-down assay to measure the DNA-binding ability of cGAS. ISD indicates IFN stimulatory DNA. (M) BT-549 cells expressing PCK1 shRNA with reconstituted expression of Flag-rPCK1 WT or Flag-rPCK1 mutants transfected with Myc-tagged WT or cGAS K394E were harvested for IP and immunoblotting analyses as indicated. Experiments (D–I, L, and M) were repeated three times independently with similar results, and the representative data are shown. Data are representative of as mean ± SD. Statistical significance was determined by two-tailed Student’s t test (C), two-way ANOVA, followed by Tukey’s test (J and K); **P < 0.001 and ***P < 0.0001; NS, not significant. Source data are available for this figure: SourceData FS4.
In line with these in vitro results, reconstituted expression of WT PCK1, in contrast to expression of PCK1 S151A or PCK1 C288S, reduced hypoxia-induced cGAMP production (Fig. 6 E) and phosphorylation levels of TBK1 S172, STING S366, and IRF3 S396 in MDA-MB-231 and BT-549 cells (Fig. 6 F), and this reduction was alleviated by addition of excessive GTP, but not ATP, in the culture medium.
In addition, reconstituted expression of the phosphorylation-mimicking PCK1 S151D significantly inhibited HT-DNA transfection-induced cGAS-STING cascades, as revealed by the suppressed Golgi translocation of STING (Fig. 6 G); phosphorylation of TBK1 S172, STING S366, and IRF3 S396 (Fig. 6 H); nuclear translocation of IRF3 (Fig. 6 I); transcriptional activity of IRF3 (Fig. 6 J); and mRNA expression of CXCL10, IL6, IFNB1, and IFNA4 (Fig. 6 K and Fig. S4 C). These aforementioned impaired cGAS-STING activities were diminished by the addition of excessive GTP, but not ATP, into the cultured medium (Fig. 6, G–K and Fig. S4 C). These results suggest that cGAS-associated PCK1 inhibits cGAS activation through competitive consumption of GTP, but not ATP.
The GTP-binding affinity of PCK1 and cGAS is indispensable for PCK1 S151 phosphorylation–mediated cGAS-STING inhibition
According to previous reports, Thr 321 of human cGAS (i.e., Ile309 in mouse cGAS) is a potential GTP-binding site (Wu et al., 2024). To this end, we first employed thermal shift assay (TSA) and bio-layer interferometry (BLI) to test the binding affinity of GTP to WT cGAS and cGAS T321L, a reported mutant that compromises cGAS-STING signaling activity (Wu et al., 2024). As expected, the purified WT cGAS, but not cGAS T321L, could bind to GTP (Fig. 7 A; and Fig. S4, D and E), supporting that cGAS T321L is a GTP-binding defective mutant. Notably, the regulatory effect of aforementioned PCK1 mutants (i.e., S151A and C288S) on the cGAS–STING pathway was almost eliminated in MDA-MB-231 cells expressing cGAS T321L (Fig. 7, B–D and Fig. S4 F). These data, therefore, suggested that the inhibitory effect of PCK1 on the cGAS-STING pathway upon hypoxia is largely dependent on the GTP-binding affinity of cGAS.
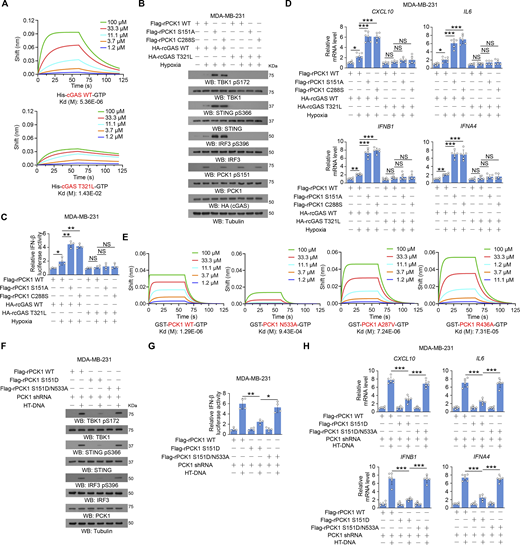
The GTP-binding affinity of PCK1 and cGAS is indispensable for PCK1 S151 phosphorylation–mediated cGAS-STING inhibition. (A) BLI was used to test the interaction of GTP to recombinant His-cGAS WT or His-cGAS T321L. Sensors were loaded with biotinylated His-cGAS WT or His-cGAS T321L proteins. (B) MDA-MB-231 cells expressing PCK1 shRNA and cGAS shRNA with reconstituted expression of the indicated PCK1 or cGAS proteins treated with or without hypoxia for 6 h were harvested for immunoblotting analyses as indicated. (C) MDA-MB-231 cells expressing PCK1 shRNA and cGAS shRNA with reconstituted expression of the indicated PCK1 or cGAS proteins were transiently transfected with vectors expressing β-galactosidase and an IFN-β luciferase reporter. 24 h later, the aforementioned cells treated with or without hypoxia for 6 h were harvested for luciferase assay, and the relative IFN-β luciferase activity after normalization to β-galactosidase activity is shown (n = 4 biological experiments). (D) MDA-MB-231 cells expressing PCK1 shRNA and cGAS shRNA with reconstituted expression of the indicated PCK1 or cGAS proteins treated with or without hypoxia for 12 h were harvested for qPCR analyses to measure CXCL10, IL6, IFNB1, and IFNA4 mRNA levels (n = 6 biological experiments). (E) BLI was used to test the interaction of GTP to recombinant GST-PCK1 WT or GST-PCK1 N533A, A287V, or R436A mutants. Sensors were loaded with biotinylated GST-PCK1 WT or GST-PCK1 N533A, A287V, or R436A proteins. (F) MDA-MB-231 cells expressing PCK1 shRNA with reconstituted expression of the indicated PCK1 proteins transfected with or without 2 μg/ml HT-DNA for 6 h were harvested for immunoblotting analyses as indicated. (G) MDA-MB-231 cells expressing PCK1 shRNA with reconstituted expression of Flag-rPCK1 WT or Flag-rPCK1 mutants were transiently transfected with vectors expressing β-galactosidase and an IFN-β luciferase reporter. 24 h later, the aforementioned cells treated with or without 2 μg/ml HT-DNA for 6 h were harvested for luciferase assay, and the relative IFN-β luciferase activity after normalization to β-galactosidase activity is shown (n = 4 biological experiments). (H) MDA-MB-231 cells expressing PCK1 shRNA with reconstituted expression of Flag-rPCK1 WT or Flag-rPCK1 mutants treated with or without 2 μg/ml HT-DNA for 12 h were harvested for qPCR analyses to measure CXCL10, IL6, IFNB1, and IFNA4 mRNA levels (n = 6 biological experiments). Experiments (A, B, E, and F) were repeated three times independently with similar results, and the representative data are shown. Statistical significance was determined by two-tailed Student’s t test (C, D, G, and H). Data are the mean ± SD; *P < 0.05, **P < 0.001, and ***P < 0.0001; NS, not significant. Source data are available for this figure: SourceData F7.
The GTP-binding affinity of PCK1 and cGAS is indispensable for PCK1 S151 phosphorylation–mediated cGAS-STING inhibition. (A) BLI was used to test the interaction of GTP to recombinant His-cGAS WT or His-cGAS T321L. Sensors were loaded with biotinylated His-cGAS WT or His-cGAS T321L proteins. (B) MDA-MB-231 cells expressing PCK1 shRNA and cGAS shRNA with reconstituted expression of the indicated PCK1 or cGAS proteins treated with or without hypoxia for 6 h were harvested for immunoblotting analyses as indicated. (C) MDA-MB-231 cells expressing PCK1 shRNA and cGAS shRNA with reconstituted expression of the indicated PCK1 or cGAS proteins were transiently transfected with vectors expressing β-galactosidase and an IFN-β luciferase reporter. 24 h later, the aforementioned cells treated with or without hypoxia for 6 h were harvested for luciferase assay, and the relative IFN-β luciferase activity after normalization to β-galactosidase activity is shown (n = 4 biological experiments). (D) MDA-MB-231 cells expressing PCK1 shRNA and cGAS shRNA with reconstituted expression of the indicated PCK1 or cGAS proteins treated with or without hypoxia for 12 h were harvested for qPCR analyses to measure CXCL10, IL6, IFNB1, and IFNA4 mRNA levels (n = 6 biological experiments). (E) BLI was used to test the interaction of GTP to recombinant GST-PCK1 WT or GST-PCK1 N533A, A287V, or R436A mutants. Sensors were loaded with biotinylated GST-PCK1 WT or GST-PCK1 N533A, A287V, or R436A proteins. (F) MDA-MB-231 cells expressing PCK1 shRNA with reconstituted expression of the indicated PCK1 proteins transfected with or without 2 μg/ml HT-DNA for 6 h were harvested for immunoblotting analyses as indicated. (G) MDA-MB-231 cells expressing PCK1 shRNA with reconstituted expression of Flag-rPCK1 WT or Flag-rPCK1 mutants were transiently transfected with vectors expressing β-galactosidase and an IFN-β luciferase reporter. 24 h later, the aforementioned cells treated with or without 2 μg/ml HT-DNA for 6 h were harvested for luciferase assay, and the relative IFN-β luciferase activity after normalization to β-galactosidase activity is shown (n = 4 biological experiments). (H) MDA-MB-231 cells expressing PCK1 shRNA with reconstituted expression of Flag-rPCK1 WT or Flag-rPCK1 mutants treated with or without 2 μg/ml HT-DNA for 12 h were harvested for qPCR analyses to measure CXCL10, IL6, IFNB1, and IFNA4 mRNA levels (n = 6 biological experiments). Experiments (A, B, E, and F) were repeated three times independently with similar results, and the representative data are shown. Statistical significance was determined by two-tailed Student’s t test (C, D, G, and H). Data are the mean ± SD; *P < 0.05, **P < 0.001, and ***P < 0.0001; NS, not significant. Source data are available for this figure: SourceData F7.
It has been reported that N533, A278, and R436 within PCK1 are the guanine- and ribose-binding sites that contribute to binding to GTP (Xiang et al., 2022). Thus, we performed TSA and BLI assays to compare the GTP-binding affinity of WT PCK1 and its N533A, A278V, and R436A mutant, respectively. Of note, only PCK1 N533A could largely abolish the binding capacity with GTP, supporting that PCK1 N533A is a GTP-binding defective mutant (Fig. 7 E; and Fig. S4, G and H). Similarly, the aforementioned inhibitory effects of PCK1 S151D on HT-DNA–activated cGAS-STING pathway were alleviated by expression of the PCK1 S151D/N533A mutant, which contains the mutations of both S151D and N533A (Fig. 7, F–H and Fig. S4 I). Of note, the reconstituted expression of PCK1 S151A, PCK1 C288S, or PCK1 S151D did not alter hypoxia-induced cytosolic DNA accumulation (Fig. S4, J and K). Consistently, neither the phosphorylation-mimicking PCK1 S151D nor C288S mutant could alter the binding affinity between cellular WT cGAS to transfected biotin-labeled immune-stimulating DNA (Fig. S4 L) or dimerization of WT cGAS (Fig. S4 M). These data, therefore, suggested that the GTP-binding affinity of PCK1 is indispensable for PCK1 S151 phosphorylation–mediated cGAS-STING inhibition.
PCK1 S151 phosphorylation–mediated cGAS inhibition promotes breast tumor growth
To determine the effect of PCK1-mediated cGAS-STING inhibition on tumorigenesis and tumor immune evasion, the mouse breast carcinoma 4T-1 cells with depletion of endogenous PCK1 and reconstituted expression of Flag-rPCK1 WT or S151A (Fig. S5 A) were injected into the mouse mammary fat pad. Compared with its WT counterpart, PCK1 S151A expression markedly reduced tumor sizes (Fig. 8 A), volumes (Fig. 8 B), and weight (Fig. 8 C) in WT but not cGAS-deficient tumors, suggesting that JNK-mediated PCK1 phosphorylation promotes triple-negative breast cancer (TNBC) growth. Consistently, PCK1 S151A reconstitution exhibited enhanced phosphorylation levels of TBK1 S172, STING S366, and IRF3 S396 (Fig. 8, D and E). And similar results were obtained using another mouse mammary carcinoma model (i.e., EMT-6) (Fig. 8, F–I and Fig. S5 B). Besides, reconstituted expression of PCK1 S151A increases cell apoptosis (Fig. S5 C) and reduces Ki67 expression (Fig. S5 D) in tumor tissues. In addition, we exposed mice in 11% low-oxygen tension. Compared with a normoxic condition, 11% oxygen exposure resulted in a reduced tumor growth (Fig. 8, J and K) with correspondingly enhanced PCK1 S151 phosphorylation in tumors (Fig. 8, L and M) with WT-PCK1–expressed 4T-1 cells injection. Notably, the low-oxygen condition induced further inhibition of tumor growth in mice with the injection of 4T-1 cells harboring PCK1 S151A reconstituted expression (Fig. 8, J and K). These results indicated that PCK1 S151 phosphorylation–mediated cGAS inhibition promotes breast tumor growth.
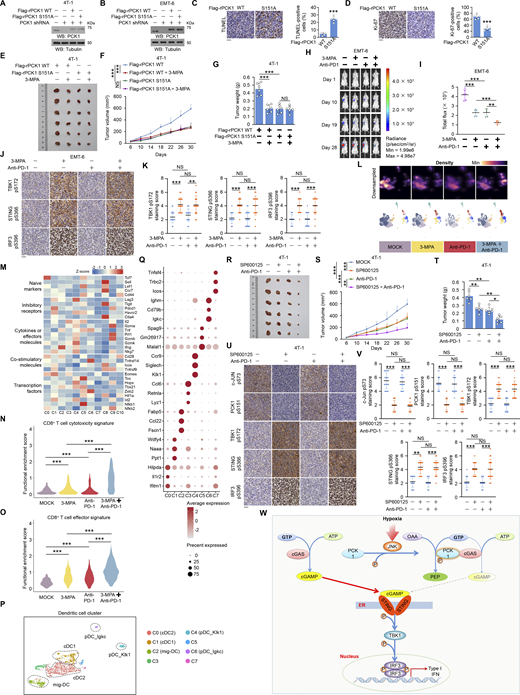
Disruption of JNK-mediated PCK1 S151 phosphorylation using 3-MPA or JNK1/2 inhibitor elevates the anti-tumor effect of anti–PD-1 antibody. (A and B) 4T-1 cells (A) or EMT-6 cells (B) expressing mouse PCK1 shRNA with reconstituted expression of the indicated mouse PCK1 proteins were harvested for immunoblotting analyses as indicated. (C) TUNEL analyses of 4T-1 tumors expressing mouse PCK1 shRNA with reconstituted expression of Flag-rmPCK1 WT or S151A mutant were performed (left). Scale bar, 50 μm. Apoptotic cells were stained brown and quantified (right) (n = 6 per group). (D) IHC analyses of 4T-1 tumors expressing mouse PCK1 shRNA with reconstituted expression of Flag-rmPCK1 WT or S151A mutant were performed with an anti-Ki67 antibody. Representative staining images are shown (left). Scale bar, 50 μm. Ki67-positive cells were quantified (right) (n = 6 per group). (E–G) 4T-1 cells expressing mouse PCK1 shRNA with reconstituted expression of Flag-rmPCK1 WT or S151A mutant (1 × 10⁶) were injected into the mammary fat pad of female BALB/c mice treated with or without 3-MPA hydrochloride. The mice were euthanized and examined for tumor growth 30 days after injection (E), tumor volumes were calculated (F), and tumors were weighed (G) (n = 6 per group). (H and I) Representative bioluminescence images from the indicated days after the orthotopical injection of EMT-6 luciferase-expressing cells (1 × 10⁶) into the mammary fat pad of female BALB/c mice treated with control, 3-MPA, anti–PD-1 antibody, or the combination (H). The quantification of the bioluminescence imaging is shown (I) (n = 6 per group). (J and K) IHC analyses of the indicated xenograft tumor samples in H were performed with the indicated antibodies. Representative staining images are shown (J), and staining scores for the indicated tumor samples were compared (K). Scale bar, 50 μm. The indicated staining scores were quantified in n = 18 microscopic fields. (L–Q) BALB/c mice bearing 4T-1 tumors were treated with or without 3-MPA hydrochloride, anti–PD-1 antibody, or the combination. Intratumoral cells were harvested for scRNA-seq analyses. Cell density plots (L) and selected marker genes expressed by indicated sub-clustering of CD8+ T cells (M) were shown. Enrichment analyses of T cell cytotoxicity (N) and effector (O) signature in CD8+ T cell cluster and UMAP analyses of infiltrating cDC1 subpopulations (P), colored by expression module score of a DC signature (Q), were performed. (R–T) BALB/c mice bearing 4T-1 tumors treated with or without SP600125, anti–PD-1 antibody, or the combination. The mice were euthanized and examined for tumor growth 30 days after injection (R), tumor volumes were calculated (S), and tumors were weighed (T) (n = 6 per group). (U and V) IHC analyses of indicated tumor samples in R were performed with the indicated antibodies. Representative staining images are shown (U), and staining scores for the indicated tumor samples were compared (V). Scale bar, 50 μm. The indicated staining scores were quantified in n = 18 microscopic fields. (W) A schematic model showing PCK1 inhibits cGAS-STING activation by metabolic consumption of GTP to promote tumor immune evasion. Data are representative of as mean ± SD. Statistical significance was determined by two-tailed Student’s t test (C, D, G, I, K, T, and V), two-way ANOVA, followed by Tukey’s test (F and S); *P < 0.05, **P < 0.001, and ***P < 0.0001; NS, not significant. Source data are available for this figure: SourceData FS5.
Disruption of JNK-mediated PCK1 S151 phosphorylation using 3-MPA or JNK1/2 inhibitor elevates the anti-tumor effect of anti–PD-1 antibody. (A and B) 4T-1 cells (A) or EMT-6 cells (B) expressing mouse PCK1 shRNA with reconstituted expression of the indicated mouse PCK1 proteins were harvested for immunoblotting analyses as indicated. (C) TUNEL analyses of 4T-1 tumors expressing mouse PCK1 shRNA with reconstituted expression of Flag-rmPCK1 WT or S151A mutant were performed (left). Scale bar, 50 μm. Apoptotic cells were stained brown and quantified (right) (n = 6 per group). (D) IHC analyses of 4T-1 tumors expressing mouse PCK1 shRNA with reconstituted expression of Flag-rmPCK1 WT or S151A mutant were performed with an anti-Ki67 antibody. Representative staining images are shown (left). Scale bar, 50 μm. Ki67-positive cells were quantified (right) (n = 6 per group). (E–G) 4T-1 cells expressing mouse PCK1 shRNA with reconstituted expression of Flag-rmPCK1 WT or S151A mutant (1 × 10⁶) were injected into the mammary fat pad of female BALB/c mice treated with or without 3-MPA hydrochloride. The mice were euthanized and examined for tumor growth 30 days after injection (E), tumor volumes were calculated (F), and tumors were weighed (G) (n = 6 per group). (H and I) Representative bioluminescence images from the indicated days after the orthotopical injection of EMT-6 luciferase-expressing cells (1 × 10⁶) into the mammary fat pad of female BALB/c mice treated with control, 3-MPA, anti–PD-1 antibody, or the combination (H). The quantification of the bioluminescence imaging is shown (I) (n = 6 per group). (J and K) IHC analyses of the indicated xenograft tumor samples in H were performed with the indicated antibodies. Representative staining images are shown (J), and staining scores for the indicated tumor samples were compared (K). Scale bar, 50 μm. The indicated staining scores were quantified in n = 18 microscopic fields. (L–Q) BALB/c mice bearing 4T-1 tumors were treated with or without 3-MPA hydrochloride, anti–PD-1 antibody, or the combination. Intratumoral cells were harvested for scRNA-seq analyses. Cell density plots (L) and selected marker genes expressed by indicated sub-clustering of CD8+ T cells (M) were shown. Enrichment analyses of T cell cytotoxicity (N) and effector (O) signature in CD8+ T cell cluster and UMAP analyses of infiltrating cDC1 subpopulations (P), colored by expression module score of a DC signature (Q), were performed. (R–T) BALB/c mice bearing 4T-1 tumors treated with or without SP600125, anti–PD-1 antibody, or the combination. The mice were euthanized and examined for tumor growth 30 days after injection (R), tumor volumes were calculated (S), and tumors were weighed (T) (n = 6 per group). (U and V) IHC analyses of indicated tumor samples in R were performed with the indicated antibodies. Representative staining images are shown (U), and staining scores for the indicated tumor samples were compared (V). Scale bar, 50 μm. The indicated staining scores were quantified in n = 18 microscopic fields. (W) A schematic model showing PCK1 inhibits cGAS-STING activation by metabolic consumption of GTP to promote tumor immune evasion. Data are representative of as mean ± SD. Statistical significance was determined by two-tailed Student’s t test (C, D, G, I, K, T, and V), two-way ANOVA, followed by Tukey’s test (F and S); *P < 0.05, **P < 0.001, and ***P < 0.0001; NS, not significant. Source data are available for this figure: SourceData FS5.

PCK1 S151 phosphorylation–mediated cGAS inhibition promotes breast tumor growth. (A–C) Parental or cGAS-KO 4T-1 cells (1 × 10⁶) expressing mouse PCK1 shRNA with reconstituted expression of Flag-rmPCK1 WT or S151A mutant were injected into the mammary fat pad of female BALB/c mice. The mice were euthanized and examined for tumor growth 22 days after injection (A), tumor volumes were calculated (B), and tumors were weighed (C) (n = 6 per group). (D and E) IHC analyses of the indicated xenograft tumor samples in A were performed with the indicated antibodies. Representative staining images are shown (D), and the staining scores for the indicated tumor samples were compared (E). Scale bar, 50 μm. The indicated staining scores were quantified in n = 18 microscopic fields. (F and G) Representative bioluminescence images from the indicated days after the orthotopical injection of EMT-6 luciferase-expressing cells (1 × 10⁶) expressing mouse PCK1 shRNA with reconstituted expression of Flag-rmPCK1 WT or S151A mutant into the mammary fat pad of female BALB/c mice (F). The quantification of the bioluminescence imaging is shown (G) (n = 6 per group). (H and I) IHC analyses of the indicated xenograft tumor samples in F were performed with the indicated antibodies. Representative staining images are shown (H), and staining scores for the indicated tumor samples were compared (I). Scale bar, 50 μm. The indicated staining scores were quantified in n = 18 microscopic fields. (J and K) 4T-1 cells (1 × 10⁶) expressing mouse PCK1 shRNA with reconstituted expression of Flag-rmPCK1 WT or S151A mutant were injected into the mammary fat pad of female BALB/c mice. Mice were put in an ambient atmosphere (21% O2) or 11% oxygen tension for 30 days after injection, tumor volumes were calculated (J), and tumors were weighed (K) (n = 6 per group). (L and M) IHC analyses of the indicated xenograft tumor samples in J were performed with the indicated antibodies. Representative staining images are shown (L), and the indicated staining scores were quantified in n = 18 microscopic fields (M). Scale bar, 50 μm. Data are representative of as mean ± SD. Statistical significance was determined by two-tailed Student’s t test (C, E, G, I, K, and M) and two-way ANOVA followed by Tukey’s test (B and J); *P < 0.05, **P < 0.001, and ***P < 0.0001; NS, not significant.
PCK1 S151 phosphorylation–mediated cGAS inhibition promotes breast tumor growth. (A–C) Parental or cGAS-KO 4T-1 cells (1 × 10⁶) expressing mouse PCK1 shRNA with reconstituted expression of Flag-rmPCK1 WT or S151A mutant were injected into the mammary fat pad of female BALB/c mice. The mice were euthanized and examined for tumor growth 22 days after injection (A), tumor volumes were calculated (B), and tumors were weighed (C) (n = 6 per group). (D and E) IHC analyses of the indicated xenograft tumor samples in A were performed with the indicated antibodies. Representative staining images are shown (D), and the staining scores for the indicated tumor samples were compared (E). Scale bar, 50 μm. The indicated staining scores were quantified in n = 18 microscopic fields. (F and G) Representative bioluminescence images from the indicated days after the orthotopical injection of EMT-6 luciferase-expressing cells (1 × 10⁶) expressing mouse PCK1 shRNA with reconstituted expression of Flag-rmPCK1 WT or S151A mutant into the mammary fat pad of female BALB/c mice (F). The quantification of the bioluminescence imaging is shown (G) (n = 6 per group). (H and I) IHC analyses of the indicated xenograft tumor samples in F were performed with the indicated antibodies. Representative staining images are shown (H), and staining scores for the indicated tumor samples were compared (I). Scale bar, 50 μm. The indicated staining scores were quantified in n = 18 microscopic fields. (J and K) 4T-1 cells (1 × 10⁶) expressing mouse PCK1 shRNA with reconstituted expression of Flag-rmPCK1 WT or S151A mutant were injected into the mammary fat pad of female BALB/c mice. Mice were put in an ambient atmosphere (21% O2) or 11% oxygen tension for 30 days after injection, tumor volumes were calculated (J), and tumors were weighed (K) (n = 6 per group). (L and M) IHC analyses of the indicated xenograft tumor samples in J were performed with the indicated antibodies. Representative staining images are shown (L), and the indicated staining scores were quantified in n = 18 microscopic fields (M). Scale bar, 50 μm. Data are representative of as mean ± SD. Statistical significance was determined by two-tailed Student’s t test (C, E, G, I, K, and M) and two-way ANOVA followed by Tukey’s test (B and J); *P < 0.05, **P < 0.001, and ***P < 0.0001; NS, not significant.
PCK1 S151 phosphorylation–mediated cGAS-IFN-I axis inhibition promotes breast cancer development by abrogating the activity of CD8+ T cells and NK cells
Several studies have shown that the anti-tumorigenic immune response of STING occurs independently of IFN-I (Kwon and Bakhoum, 2020; Lanng et al., 2024; Wu et al., 2020). To distinguish the role of cGAS-mediated IFN-I in the anti-tumor effects mediated by PCK1 S151A reconstituted expression, we performed the following in vivo experiment settings with and without an anti-IFN-alpha/beta receptor (IFNAR) antibody (Fig. 9 A). Remarkably, the tumor-inhibitory effects of PCK1 S151A reconstitution were almost eliminated in the mice treated with an anti-IFNAR antibody (Fig. 9, B and C), which neutralizes the host in vivo IFN-I signaling. These data suggested that the anti-tumor effect of PCK1 S151A reconstitution largely depends on IFN-I signaling.

PCK1 S151 phosphorylation–mediated cGAS-IFN-I axis inhibition promotes breast cancer development by abrogating the activity of CD8 + T cells and NK cells. (A) Treatment schedule for IFNAR, CD8+ T cells, and NK cells depletion in the 4T-1 model. At day 0, 4T-1 luciferase-expressing cells (1 × 10⁶) expressing mouse PCK1 shRNA with reconstituted expression of Flag-rmPCK1 WT or S151A mutant were orthotopically injected into female BALB/c mice. Tumor-bearing mice were intraperitoneally injected with anti-IFNAR, anti-CD8, anti-Asialo-GM1 (ASGM1) antibodies or IgG isotype control as indicated at day −1, 3, 7, 11, 14, and 18 (n = 6 per group). (B and C) Representative bioluminescence images of the indicated 4T-1 tumor-bearing mice treated with an anti-IFNAR antibody or IgG isotype control from the indicated days (B). The quantification of the bioluminescence imaging is shown (C) (n = 6 per group). (D and E) 4T-1 cells (1 × 10⁶) expressing mouse PCK1 shRNA with reconstituted expression of Flag-rmPCK1 WT or S151A mutant were injected into the mammary fat pad of female BALB/c mice. Representative flow cytometry plots (D) and quantification (E) for CD4+ T cells, CD8+ T cells, and NK cells within the indicated xenograft tumors (n = 6 per group). (F) Representative flow cytometry plots of the depletion of indicated cells in tumors from 4T-1 tumor-bearing mice treated with anti-CD8 antibody, anti-ASGM1 antibody, combination of anti-CD8, and anti-ASGM1 antibodies, or IgG isotype control, were shown. (G and H) Representative bioluminescence images of the indicated 4T-1 tumor cells bearing mice treated with anti-CD8 antibody, anti-ASGM1 antibody, combination of anti-CD8 and anti-ASGM1 antibodies, or IgG isotype control from the indicated days (G), The quantification of the bioluminescence imaging is shown (H) (n = 6 per group). (I) 4T-1 cells (1 × 10⁶) expressing mouse PCK1 shRNA with reconstituted expression of Flag-rmPCK1 WT or S151A mutant were injected into the mammary fat pad of female NCG mice. Tumor volumes were calculated (n = 6 per group). (J and K) Human TNBC samples were analyzed with the indicated antibodies. Representative staining images are shown (J). Scale bar, 50 μm. IHC staining of human TNBC samples with the indicated antibodies was scored, and correlation analyses were performed. A Pearson correlation test was used (two-tailed). Note that the scores for some samples overlap (K). (L and M) IHC analyses of the PCK1 low- or PCK high-expressing human TNBC samples were performed with the indicated antibodies. Representative staining images are shown (L). Scale bar, 50 μm. The IHC-positive cells were quantified in n = 6 microscopic fields (M). (N) Kaplan–Meier plots of the overall survival rates in 84 patients with TNBC grouped according to high (staining score, 4–8) and low (staining score, 0–3) expression of PCK1 pS151. Data are representative of as mean ± SD. Statistical significance was determined by two-tailed Student’s t test (C, E, H, and M), two-way ANOVA, followed by Tukey’s test (I) and log-rank test (N); **P < 0.001 and ***P < 0.0001; NS, not significant.
PCK1 S151 phosphorylation–mediated cGAS-IFN-I axis inhibition promotes breast cancer development by abrogating the activity of CD8 + T cells and NK cells. (A) Treatment schedule for IFNAR, CD8+ T cells, and NK cells depletion in the 4T-1 model. At day 0, 4T-1 luciferase-expressing cells (1 × 10⁶) expressing mouse PCK1 shRNA with reconstituted expression of Flag-rmPCK1 WT or S151A mutant were orthotopically injected into female BALB/c mice. Tumor-bearing mice were intraperitoneally injected with anti-IFNAR, anti-CD8, anti-Asialo-GM1 (ASGM1) antibodies or IgG isotype control as indicated at day −1, 3, 7, 11, 14, and 18 (n = 6 per group). (B and C) Representative bioluminescence images of the indicated 4T-1 tumor-bearing mice treated with an anti-IFNAR antibody or IgG isotype control from the indicated days (B). The quantification of the bioluminescence imaging is shown (C) (n = 6 per group). (D and E) 4T-1 cells (1 × 10⁶) expressing mouse PCK1 shRNA with reconstituted expression of Flag-rmPCK1 WT or S151A mutant were injected into the mammary fat pad of female BALB/c mice. Representative flow cytometry plots (D) and quantification (E) for CD4+ T cells, CD8+ T cells, and NK cells within the indicated xenograft tumors (n = 6 per group). (F) Representative flow cytometry plots of the depletion of indicated cells in tumors from 4T-1 tumor-bearing mice treated with anti-CD8 antibody, anti-ASGM1 antibody, combination of anti-CD8, and anti-ASGM1 antibodies, or IgG isotype control, were shown. (G and H) Representative bioluminescence images of the indicated 4T-1 tumor cells bearing mice treated with anti-CD8 antibody, anti-ASGM1 antibody, combination of anti-CD8 and anti-ASGM1 antibodies, or IgG isotype control from the indicated days (G), The quantification of the bioluminescence imaging is shown (H) (n = 6 per group). (I) 4T-1 cells (1 × 10⁶) expressing mouse PCK1 shRNA with reconstituted expression of Flag-rmPCK1 WT or S151A mutant were injected into the mammary fat pad of female NCG mice. Tumor volumes were calculated (n = 6 per group). (J and K) Human TNBC samples were analyzed with the indicated antibodies. Representative staining images are shown (J). Scale bar, 50 μm. IHC staining of human TNBC samples with the indicated antibodies was scored, and correlation analyses were performed. A Pearson correlation test was used (two-tailed). Note that the scores for some samples overlap (K). (L and M) IHC analyses of the PCK1 low- or PCK high-expressing human TNBC samples were performed with the indicated antibodies. Representative staining images are shown (L). Scale bar, 50 μm. The IHC-positive cells were quantified in n = 6 microscopic fields (M). (N) Kaplan–Meier plots of the overall survival rates in 84 patients with TNBC grouped according to high (staining score, 4–8) and low (staining score, 0–3) expression of PCK1 pS151. Data are representative of as mean ± SD. Statistical significance was determined by two-tailed Student’s t test (C, E, H, and M), two-way ANOVA, followed by Tukey’s test (I) and log-rank test (N); **P < 0.001 and ***P < 0.0001; NS, not significant.
Consistent with the previous reports revealing that CD8+ T cells and NK cells are both important for IFN-I–mediated anti-tumor effects (Chin et al., 2023; Lam et al., 2021; Liang et al., 2021; Lv et al., 2020; Nicolai et al., 2020), we found that reconstituted expression of PCK1 S151A promotes infiltration of CD4+ T cells, CD8+ T cells, and NKp46+ natural killer (NK) cells (Fig. 9, D and E), and depleting CD8+ T cells or NK cells alone could moderately dampen the tumor-inhibitory effects of PCK1 S151A reconstitution, respectively (Fig. 9, F–H). Of note, PCK1 S151A-mediated anti-tumor effects could be completely eliminated upon the combined treatment of anti-CD8 and anti-AsGM1 antibodies (i.e., depletion of both CD8+ T cells and NK cells) (Fig. 9, A and F–H). Thus, these results indicated the tumor-inhibitory effects of PCK1 S151A were largely dependent on the activation of both CD8+ T cells and NK cells. Consistently, the inhibitory effect of PCK1 S151A on tumor growth was eliminated in immune-deficient models NOD/ShiLtJGpt-Prkdcem26Cd52Il2rgem26Cd22/Gpt (NCG) mice (Fig. 9 I), supporting that PCK1 S151 phosphorylation promotes tumorigenesis in an immune cell–dependent manner.
To assess the clinical relevance of the PCK1-mediated cGAS inhibition, we performed immunohistochemistry (IHC) analyses of 84 human breast cancer tissues and showed that PCK1 S151 phosphorylation levels were positively correlated with hypoxic marker HIF-1α expression (Fig. 9, J and K) but negatively correlated with the phosphorylation levels of TBK1 S172, STING S366, and IRF3 S396 (Fig. 9, J and K) and immune cell infiltration (Fig. 9, L and M). In addition, PCK1 S151 phosphorylation levels were inversely associated with the survival of breast cancer patients (Fig. 9 N). These results strongly suggested PCK1 S151 phosphorylation–mediated cGAS-IFN-I axis inhibition promotes breast cancer development by abrogating the activity of CD8+ T cells and NK cells.
Disruption of PCK1-mediated cGAS inhibition by 3-mercaptopropionic acid (3-MPA) elevates the anti-tumor effect of anti–PD-1 antibody by activating CD8+ T cells and cDC1 cells
To explore the therapeutic potential of abrogation of the PCK1 S151 phosphorylation–mediated cGAS inhibition, we treated the mice with PCK1 inhibitor 3-MPA (Balan et al., 2015; Yamaguchi et al., 2019) (Fig. 10 A) and observed that 3-MPA could dramatically reduce tumor sizes (Fig. 10 B and Fig. S5 E), volumes (Fig. 10 C and Fig. S5 F), and weight (Fig. 10 D and Fig. S5 G) in 4T-1 tumor model. Of note, tumor-inhibitory effects of 3-MPA were totally eliminated in tumors derived from 4T-1 cells with PCK1 S151A reconstitution (Fig. S5, E–G), suggesting that 3-MPA inhibits breast tumor growth by inhibiting PCK1-cGAS axis without potential nonspecific effects. Consistently, 3-MPA not only elongated mouse survival time (Fig. 10 E) but also replicated the effect of PCK1 S151A expression on the increase of phosphorylation levels of TBK1 S172, STING S366, and IRF3 S396 (Fig. 10, F and G). Notably, these effects were further enhanced by combined 3-MPA with anti–PD-1 antibody treatment in both 4T-1 and EMT-6 tumor models (Fig. 10, B–G and Fig. S5, H–K). These results reveal that combining the disruption of PCK1-mediated cGAS inhibition by 3-MPA with immune checkpoint blockade improves cancer treatment.

Disruption of PCK1-mediated cGAS inhibition by 3-MPA elevates the anti-tumor effect of anti–PD-1 antibody by activating CD8 + T cells and cDC1 cells. (A) Treatment schedule for anti-tumor therapy with 3-MPA, anti–PD-1 antibody, the combination of 3-MPA, and anti–PD-1 antibody or the vehicle control in the BALB/c mice bearing 4T-1 tumors (n = 6 per group). (B–E) BALB/c mice bearing 4T-1 tumors were with or without 3-MPA hydrochloride, anti–PD-1 antibody, or the combination. The mice were euthanized and examined for tumor growth 30 days after injection (B), tumor volumes were calculated (C), and tumors were weighed (D). The survival of mice was monitored daily and analyzed using Kaplan–Meier curves and a log-rank (Mantel–Cox) test (E) (n = 6 per group). (F and G) IHC analyses of the indicated xenograft tumors in B were performed with the indicated antibodies. Representative staining images are shown (F), and the indicated staining scores for the indicated tumor samples were compared (G). Scale bar, 50 μm. The indicated staining scores were quantified in n = 18 microscopic fields. (H–J) BALB/c mice bearing 4T-1 tumors were treated with or without 3-MPA hydrochloride, anti–PD-1 antibody, or the combination. Intratumoral cells were harvested for scRNA-seq analyses. UMAP analyses of CD45+ immune cells that colored by major cell types (H), comparison of major CD45+ immune cell proportion (I), and Ro/e analysis (J) were performed. (K and L) BALB/c mice bearing 4T-1 tumors were treated with or without 3-MPA hydrochloride, anti–PD-1 antibody, or the combination. Intratumoral cells were harvested for flow cytometry (FACS) analyses. Representative flow cytometry plots (K) and quantification (L) for CD4+ T cells, CD8+ T cells, and NK cells were shown (n = 6 per group). (M–O) BALB/c mice bearing 4T-1 tumors were treated with or without 3-MPA hydrochloride, anti–PD-1 antibody, or the combination. Intratumoral cells were harvested for scRNA-seq analyses. Sub-clustering of CD8+ T cells, colored and labeled by subtypes, was shown (M). Pseudotime trajectories for CD8+ T cells based on Monocle 2 were performed (N and O). (P and Q) BALB/c mice bearing 4T-1 tumors were treated with or without 3-MPA hydrochloride, anti–PD-1 antibody, or the combination. Intratumoral cells were harvested for FACS analyses. Representative flow cytometry plots (P) and quantification (Q) for IFN-γ+ CD8+ T cells, TNF-α+ CD8+ T cells, and GZMB+ CD8+ T cells were shown (n = 6 per group). (R) BALB/c mice bearing 4T-1 tumors were treated with or without 3-MPA hydrochloride, anti–PD-1 antibody, or the combination. Intratumoral cells were harvested for scRNA-seq analyses. Enrichment analyses of the cDC1 cell activation signature were performed. (S and T) BALB/c mice bearing 4T-1 tumors were treated with or without 3-MPA hydrochloride, anti–PD-1 antibody, or the combination. Intratumoral cells were harvested for FACS analyses. (S–V) Representative flow cytometry plots (S) and quantification (T) for CD8+ CD11c+ (cDC1) cells, and the representative histograms (U) and quantification (V) for MHC II and CD86 surface expression in cDC1 cells were shown (n = 6 per group). Data are representative of as mean ± SD. Statistical significance was determined by two-tailed Student’s t test (D, G, L, Q, T, and V), two-way ANOVA, followed by Tukey’s test (C) and log-rank test (E); *P < 0.05, **P < 0.001, and ***P < 0.0001; NS, not significant. Ro/e; the ratio of observed over expected cell numbers.
Disruption of PCK1-mediated cGAS inhibition by 3-MPA elevates the anti-tumor effect of anti–PD-1 antibody by activating CD8 + T cells and cDC1 cells. (A) Treatment schedule for anti-tumor therapy with 3-MPA, anti–PD-1 antibody, the combination of 3-MPA, and anti–PD-1 antibody or the vehicle control in the BALB/c mice bearing 4T-1 tumors (n = 6 per group). (B–E) BALB/c mice bearing 4T-1 tumors were with or without 3-MPA hydrochloride, anti–PD-1 antibody, or the combination. The mice were euthanized and examined for tumor growth 30 days after injection (B), tumor volumes were calculated (C), and tumors were weighed (D). The survival of mice was monitored daily and analyzed using Kaplan–Meier curves and a log-rank (Mantel–Cox) test (E) (n = 6 per group). (F and G) IHC analyses of the indicated xenograft tumors in B were performed with the indicated antibodies. Representative staining images are shown (F), and the indicated staining scores for the indicated tumor samples were compared (G). Scale bar, 50 μm. The indicated staining scores were quantified in n = 18 microscopic fields. (H–J) BALB/c mice bearing 4T-1 tumors were treated with or without 3-MPA hydrochloride, anti–PD-1 antibody, or the combination. Intratumoral cells were harvested for scRNA-seq analyses. UMAP analyses of CD45+ immune cells that colored by major cell types (H), comparison of major CD45+ immune cell proportion (I), and Ro/e analysis (J) were performed. (K and L) BALB/c mice bearing 4T-1 tumors were treated with or without 3-MPA hydrochloride, anti–PD-1 antibody, or the combination. Intratumoral cells were harvested for flow cytometry (FACS) analyses. Representative flow cytometry plots (K) and quantification (L) for CD4+ T cells, CD8+ T cells, and NK cells were shown (n = 6 per group). (M–O) BALB/c mice bearing 4T-1 tumors were treated with or without 3-MPA hydrochloride, anti–PD-1 antibody, or the combination. Intratumoral cells were harvested for scRNA-seq analyses. Sub-clustering of CD8+ T cells, colored and labeled by subtypes, was shown (M). Pseudotime trajectories for CD8+ T cells based on Monocle 2 were performed (N and O). (P and Q) BALB/c mice bearing 4T-1 tumors were treated with or without 3-MPA hydrochloride, anti–PD-1 antibody, or the combination. Intratumoral cells were harvested for FACS analyses. Representative flow cytometry plots (P) and quantification (Q) for IFN-γ+ CD8+ T cells, TNF-α+ CD8+ T cells, and GZMB+ CD8+ T cells were shown (n = 6 per group). (R) BALB/c mice bearing 4T-1 tumors were treated with or without 3-MPA hydrochloride, anti–PD-1 antibody, or the combination. Intratumoral cells were harvested for scRNA-seq analyses. Enrichment analyses of the cDC1 cell activation signature were performed. (S and T) BALB/c mice bearing 4T-1 tumors were treated with or without 3-MPA hydrochloride, anti–PD-1 antibody, or the combination. Intratumoral cells were harvested for FACS analyses. (S–V) Representative flow cytometry plots (S) and quantification (T) for CD8+ CD11c+ (cDC1) cells, and the representative histograms (U) and quantification (V) for MHC II and CD86 surface expression in cDC1 cells were shown (n = 6 per group). Data are representative of as mean ± SD. Statistical significance was determined by two-tailed Student’s t test (D, G, L, Q, T, and V), two-way ANOVA, followed by Tukey’s test (C) and log-rank test (E); *P < 0.05, **P < 0.001, and ***P < 0.0001; NS, not significant. Ro/e; the ratio of observed over expected cell numbers.
Furthermore, we performed the single-cell (sc)RNA-seq analysis to compare immune cell infiltration/activation in tumor tissues from mice treated with 3-MPA and anti–PD-1 antibody, respectively. Eight major cell types, including CD4+ T cell, CD8+ T cell, dendritic cell (DC), macrophage, mast, monocyte, neutrophil, and NK cell, were defined as the major population in the CD45+ immune cells within the tumor microenvironment (Fig. 10 H), and galaxy plots depicting the cell density in Uniform Manifold Approximation and Projection (UMAP) space illustrate the differences of cell composition between the four groups (Fig. S5 L). Notably, in comparison to 3-MPA or anti–PD-1 antibody treatment alone, the combination therapy of 3-MPA and anti–PD-1 antibody could markedly elevate infiltration of the CD4+ T cells, CD8+ T cells, and NK cells in tumor tissues (Fig. 10 I). The aforementioned augmentation of immune cell infiltration was further validated by analysis of the ratio of observed over expected cell numbers (Fig. 10 J) and flow cytometry (FACS) (Fig. 10, K and L). Since CD8+ T cell plays a central role in suppressing tumor development, and the dynamic changes in CD8+ T cell subpopulations dictate the anti-tumor immune effects (Fehlings et al., 2017; Gubin et al., 2014), we computationally identified 11 CD8+ T cell subpopulations with different markers (Fig. 10 M and Fig. S5 M) and found 3-MPA treatment could increase the proportion of early effector CD8+ T cells in tumor tissues (i.e., C5 and C10 containing highly expressed genes like Lef1, Il2, Nfkb1, Cd44, Cd28, and Tnf) (Fig. 10, N and O) and promote the CD8+ T cell cytotoxicity/effector signature (Fig. S5, N and O). In addition, FACS analysis also revealed 3-MPA could activate the effector functions of CD8+ T cells (designated as TNF-α, IFN-γ, and GzmB) (Fig. 10, P and Q). Notably, the aforementioned effects of CD8+ T cell activation were further enhanced by the combined treatment of 3-MPA and PD-1 antibody (Fig. 10, I–Q; and Fig. S5, N and O).
According to previous reports, the increased anti-tumor function of CD8+ T cells mediated by cGAS-SITNG activation is mainly dependent on IFN-I–induced activation of antigen-presenting type 1 conventional DCs (cDC1) (Liang et al., 2021). Thus, we determined whether 3-MPA could alter the intratumoral cDC1 cells in the context of immune checkpoint blockade (Fig. S5, P and Q). Notably, combined treatment of 3-MPA and anti–PD-1 antibody could dramatically promote the cDC1 cell activation signature (Fig. 10 R). In line with these findings, FACS analysis also indicated that 3-MPA not only promotes the infiltration of cDC1 cells in vivo (Fig. 10, S and T) but also enhances the surface expression of MHC II and CD86 in cDC1 cells (Fig. 10, U and V). Remarkably, these effects were further boosted by combined 3-MPA with PD-1 antibody treatment (Fig. 10, R–V).
In addition, we treated the mice with JNK inhibitor SP600125, which not only inhibits tumor growth (Fig. S5, R–T) but also increases the phosphorylation levels of TBK1 S172, STING S366, and IRF3 S396 in the tumor tissues (Fig. S5, U and V). Notably, the anti-tumor effects were further enhanced by combining SP600125 with anti–PD-1 antibody treatment (Fig. S5, R–V). These results suggested that combining the disruption of PCK1 S151 phosphorylation using JNK1/2 inhibitor (i.e., SP600125) with immune checkpoint blockade improves cancer treatment.
Discussion
Hypoxia, which occurs often in rapidly growing tumors, induces cytosolic DNA accumulation in tumor cells (Arnaiz and Harris, 2022). However, the mechanisms by which tumor cells suppress hypoxia-induced cGAS-STING activation for immune evasion remain largely unclear. We demonstrated here that hypoxic stimulation induces PCK1 S151 phosphorylation by JNK1/2. This phosphorylation, which did not alter PCK1 metabolic activity, elicited the interaction between PCK1 and cGAS. The cGAS-associated PCK1, which has a comparable Km to cGAS, competitively consumed GTP, which is also a substrate of cGAS. Consequently, PCK1 inhibited activation of cGAS and subsequent activation of the STING-TBK1-IRF3 axis and promoted immune cell infiltration and activation in tumor tissues that impede tumor growth (Fig. S5 W). In addition, PCK1 S151 phosphorylation was negatively correlated with cGAS-STING activation in human breast cancer specimens, as well as the survival of breast cancer patients. These findings highlight the clinical relevance and significance of PCK1-mediated cGAS inhibition in breast cancer immune evasion and disease progression.
Metabolic enzymes exhibit noncanonical functions that play critical roles in the governing of a wide spectrum of instrumental cellular activities, including gene expression, cell cycle progression, DNA repair, cell proliferation, apoptosis, and tumor microenvironment remodeling in tumor cells (Bian et al., 2022; Li et al., 2018a; Xu et al., 2021). Under growth factor stimulation, PCK1 translocates to the ER and phosphorylates INSIG1/2, thereby activating sterol regulatory element-binding protein (SREBP)-dependent lipid biosynthesis for tumor cell proliferation (Jiang et al., 2020; Shao et al., 2021; Xu et al., 2020). Under hypoxic conditions, in which glycolysis is increased, accompanying with a decreased gluconeogenesis (Maatta et al., 2018; Nam et al., 2016), PCK1 gained a moonlighting function by JNK1/2-mediated phosphorylation, which conveyed its governance on cGAS-STING activation by forming a complex with cGAS. Metabolic enzymes, including acetate-dependent acetyl–coenzyme A synthetase 2 (Li et al., 2017), phosphoglycerate kinase 1 (Li et al., 2018b), and the succinyl–coenzyme A synthetase ADP-forming subunit β (Ma et al., 2022; Tong et al., 2021), play crucial roles in regulating glutaminolysis, DNA replication, and histone H3 acetylation. They achieve this through complex formation with glutaminase, the kinase cell division cycle 7, and histone H3, respectively. These interactions lead to local metabolic substrate consumption and product formation, consequently impacting the functions of the complex proteins. The increased binding of PCK1 to cGAS likely decreased the locally available GTP, restraining cGAS in a manner dependent on the precisely regulated protein–protein interaction and integrated regulation of metabolic enzymes and innate immune components. These findings reveal previously unknown and critical regulation of the cGAS-STING pathway and shed light on the metabolic control of immune response in tumor cells. Importantly, the additive therapeutic effect achieved by the combined blockade of PCK1 function and immune checkpoint provides an unprecedented strategy to improve breast cancer treatment.
Materials and methods
Materials
Rabbit antibodies against ACC1 (ab45174) (for western blot [WB]), ACC1 pS79 (ab68191) (for WB), HA-tag (ab18181) (for WB), CD3 (ab16669), CD4 (ab133616), CD8 (ab101500), CD16 (ab183354), Ki-67 (ab21700), Granzyme B (ab255598), and GM130 (ab195303) were purchased from Abcam. Antibodies against cGAS (#79978) (human), TBK1 pS172 (#5483), TBK1 (#3504), STING pS366 (#19781), STING (#13647) (for IP and WB), IRF3 pS396 (#37829), IRF3 (#11904), Hif 1α (#14179), eIF2a (#5324), eIF2a pS51 (#3398), MAPK/APK2 (#3042), MAPK/APK2 pT222 (#3316), c-Jun (#9165), c-Jun pS73 (#3270), HA-tag (#50297) (mouse), Myc-tag (#2276) (mouse), and HA-tag (#3724) (rabbit) were purchased from Cell Signaling Technology. Normal mouse IgG (sc-2025), normal rabbit IgG (sc-2027), JNK (sc-7345) (for IP and WB), GST (sc-138), and tubulin (sc-8035) antibodies were obtained from Santa Cruz Biotechnology. [γ-32P] ATP was obtained from PerkinElmer. GSK2656157, SB203580, compound C, SP600125, ATP, streptavidin magnetic beads, anti-Flag M2 agarose beads, EDTA-free protease inhibitor cocktail, 2′, 3′-cGAMP, 3 × Flag peptides, STING (MABF270) (for WB and immunofluorescence [IF]), IRF3 (SAB1406043) (for IF), mouse anti-Flag (F1804), rabbit anti-Flag (F7425), and anti-His (SAB1305538) antibodies were purchased from Sigma-Aldrich. PCK1 antibody (66862-1) (for WB), PCK1 antibody (16754-1-AP) (for IP and IF), and cGAS antiboby (26416-1-AP) (for IF) were obtained from Proteintech. Hygromycin (400053), puromycin (540222), and G418 (345810) were purchased from EMD Biosciences. PicoGreen (P7581), DAPI (D1306), Glutathione agarose, and antibodies against cGAS (14–5158-82) (for WB), STING pS366 (PA5–105674), NKp46 (PA5–102860), and TBK1 pS172 (PA5–105919) (for IHC) were obtained from Thermo Fisher Scientific. IRF3 pS396 (OABF01188) (for IHC) was obtained from Aviva Systems Biology. Primary antibodies were used at a dilution of 1:1,000 for WB, 1:500 for IP, and 1:200 for IHC. Secondary HRP-coupled antibodies were used at a dilution of 1:5,000. Ni-NTA agarose was obtained from Qiagen. cGAMP ELISA Kit (501700) was purchased from Cayman Chemical. Calf intestinal alkaline phosphatase was obtained from New England Biolabs. PCK1 pS151-specific antibodies were generated by ABclonal Biotechnology. Agarose beads coupled with cGAMP were purchased from BIOLOG Life Science Institute. Human anti-dsDNA antibody (OAMA03034) was obtained from Aviva Systems Biology. In vivo anti–PD-1 mouse monoclonal antibody (#BE0146) and the IgG2a isotype control (#BE0089) were purchased from Bio X Cell. 3-MPA hydrochloride (HY-128923) was obtained from Medchemexpress. PCK1 pS151-blocking peptide (SMGPLG-pS-PLSKIG) was synthesized by Selleck-Chem. Primary antibodies were used at a dilution of 1:1,000 for WB, 1:500 for IP, and 1:200 for IHC. Secondary HRP-coupled anti-mouse or rabbit antibodies from Jackson ImmunoResearch and anti-mouse or rabbit IgG for IP AlpSdAbs VHH (HRP) from AlpVHHs were used at a dilution of 1:5,000. Rabbit antibody that recognizes PCK1 pS151 was generated by ABclonal Biotechnology. Antibodies against CD3 (#100202), FITC-CD4 (#116004), APC-CD8 (#100712), PE-IFN-γ (#505808), PE TNF-α (#506306), PE GZMB (#506306), PE/Cyanine7 PD-1 (#135216), FITC-CD11c (#117306), PE-MHC II (#107608), PE/Cyanine7 CD86 (#159208), FITC-CD11b (#101206), PerCP/Cyanine5.5 CD3 (#100218), and APC-NKp46 (137608) used for FACS assay were purchased from Biolegend.
DNA construction and mutagenesis
PCR-amplified human PCK1, mouse PCK1, PCK2, JNK1, JNK2, and cGAS were cloned into pcDNA3.1/hygro(+)-(Flag, HA, or twin Flag/Streptavidin), pCDH-CMV-MCS-EF1-Puro/Neo-(Flag, HA, or SFB), PGEX4T-1 (GST), or pColdI (His) vector as previously described (Li et al., 2016b; Rastogi et al., 2020). The following mutations were generated using a QuikChange site-directed mutagenesis kit (Stratagene): PCK1 S151A, S151D, C288S, S151D/288S, N533A, A287V, R436A, cGAS E225A/D227A, K173A/R176A, K394E, and T321L; shRNA-r PCK1 (human) constructs containing S151A, S151D, C288S, and S151D/C288S; shRNA-r PCK1 (human) constructs containing A267G, G273A, and G276A; and shRNA-r PCK1 (mouse) constructs containing G459A, C462A, and G465A.The PLKO.1 shRNA target sequences were as follows: PCK1 (human)-shRNA, 5′-TGTGCGTCAAACTTCATCC-3′. PCK1 (mouse)-shRNA, 5′-CCGCTGGCCAAGATTGGTATT-3′. HA-K63-UB plasmids were generously provided by Prof. Yongchao Zhao from the Institute of Translational Medicine, Zhejiang University, Hangzhou, China.
Cell lines and cell culture conditions
MDA-MB-231, BT-549, 4T-1, and 293T cells were obtained from ATCC. The cells were maintained in DMEM supplemented with 10% dialyzed bovine calf serum (HyClone). No cell lines used in this study were found in the database of commonly misidentified cell lines that is maintained by the International Cell Line Authentication Committee and National Center for Biotechnology Information Biosample. Cells were plated at a density of 4 × 10⁵ per 60-mm dish or 1 × 10⁵ per well of a 6-well plate 18 h before transfection. The transfection procedure was performed as previously described (Du et al., 2020). Hypoxia treatment was achieved by culturing the cells in 1% O2, 5% CO2, and 94% N2 in hypoxia incubator (ESCO CCL-050T). cGAMP was delivered into cells by permeabilization with digitonin (10 μg/ml) for 15 min in buffer A (50 mM HEPES-KOH, pH 7.2, 100 mM KCl, 3 mM MgCl2, 0.1 mM DTT, 85 mM sucrose, 0.2% BSA, and 1 mM ATP). The concentration of cGAMP used in stimulating BT549 or MDA-MB-231 cells was 0.5 μM. HT-DNA was transfected into cells using Lipofectamine 2000 (Thermo Fisher Scientific) at a concentration of 2 μg/ml.
Purification of recombinant proteins
GST-JNK1, GST-JNK2, His-JNK1, His-cGAS, His-cGAS T321L, His-PCK1 WT, His-PCK1 S151A, His-PCK1 S151D, GST-PCK1 WT, GST-PCK1 N533A, GST-PCK1 A287V, and GST-PCK1 R436A were expressed in bacteria and purified as described previously (Xu et al., 2019). Flag/strep-tagged rPCK1-WT, -S151D, and -C288S expressed in 293T cells were enriched by anti-Flag agarose beads and eluted by 3 × Flag peptides. After ultrafiltration and removal of the 3 × Flag peptides from the eluted protein, the secondary streptavidin pull down was performed.
CRISPR-Cas9–mediated genome editing
Genomic mutations were introduced into cells using the CRISPR–Cas9 system, as described previously (Li et al., 2016a, 2017). Single-guide RNAs (sgRNAs) were designed to target the genomic area adjacent to mutation sites in PCK1 S151A using the CRISPR design tool (http://chopchop.cbu.uib.no/). The annealed guide RNA oligonucleotides were inserted into a PX458 vector (Addgene) digested with the BbsI restriction enzyme. Cells were seeded at 60% confluence, followed by cotransfection of sgRNAs (0.5 μg) and single-stranded donor oligonucleotides (ssODNs) (10 pmol) as a template to introduce mutations. 24 h after transfection, cells were trypsinized, diluted for scs, and seeded into 96-well plates. Genomic DNA was extracted from GFP-positive cells, followed by sequencing of the PCR products spanning the mutation sites. sgRNA-targeting sequence for human PCK1: 5′-CTGGGCTCGCCTCTGTCAAA-3′; ssODN sequence for human PCK1: 5′-GGTCATTTCTCACCAGTGCCCACCCATCGCACCCTGTAGGTCGCACCATGTACGTCATCCCATTCAGCATGGGGCCaCTaGGtgCGCCTCTGTCAAAGATCGGCATCGAGCTGACGGATTCACCCTACGTGGTGGCCAGCATGCGGATCATGACGCGGATGGGCA-3′; the lowercase letters in the ssODN sequences indicate the mutated nucleotides that will replace the endogenous nucleotides in the genomic DNA of parental cells using the CRISPR-Cas9 system. The sgRNA target sequence used for human cGAS and mouse cGAS were 5′-GAACTTTCCCGCCTTAGGCA-3′ and 5′-TCTCGTACCCAAGAATGCAA-3′, respectively. Genotyping was performed by sequencing PCR products amplified from the following primers: human PCK1 forward: 5′-AATAATGGAAGCTCCCACCACC-3′; PCK1 reverse: 5′-TACCCACTGCCAAAGGAGAT-3′. sgRNA-targeting sequence for mouse PCK1: 5′-CTGGGCTCGCCGCTGGCCA-3′; ssODN sequence for mouse PCK1: 5′-CGTGACTTCTTACCTATTTCTGCCCACCCGCCTCTGCAGGCCGCACCATGTATGTCATCCCATTCAGCATGGGGCCgCTaGGtgCGCCGCTGGCCAAGATTGGTATTGAACTGACAGACTCGCCCTATGTGGTGGCCAGCATGCGGATCATGACTCGGATGGGCAT-3′; the lowercase letters in the ssODN sequences indicate the mutated nucleotides that will replace the endogenous nucleotides in the genomic DNA of parental cells using the CRISPR–Cas9 system. Genotyping was performed by sequencing PCR products amplified from the following primers: mouse PCK1 forward: 5′-CCAAGTTTCTGCCAGCCTGA-3′; mouse PCK1 reverse: 5′- GCCCAGTTGTTGACCAAAGGCT-3′.
Real-time PCR
Total RNA was extracted from cells and tissue specimens using Trizol according to the manufacturer’s instructions (Invitrogen). A total of 1 μg/sample RNA was used for cDNA synthesis by using a TaqMan Reverse Transcription Reagents kit (Applied Biosystems). Quantitative real-time PCR was carried out in the 7500 real-time PCR system (Applied Biosystems) using SYBR Premix Ex Taq kit for Real-Time PCR (Takara). GAPDH served as the normalization gene in these studies. The following primers were used for qRT-PCR: CXCL10 (human), 5′-GGAACCTCCAGTCTCAGCACC-3′ and 5′-GGCAGTGGAAGTCCATGAAGTAA-3′; IL-6 (human), 5′-ACTCACCTCTTCAGAACGAATTG-3′ and 5′-CCATCTTTGGAAGGTTCAGGTTG-3′; IFNB1 (human), 5′-CTAACTGCAACCTTTCGAAGC-3′ and 5′-CTAGTGTCCTTTCATATGCAG-3′; IFNA4 (human), 5′-GTTCCAGAAGGCTCAAGCCATC-3′ and 5′-TAGGAGGCTCTGTTCCCAAGCA-3′; GAPDH (human), 5′-AGCCACATCGCTCAGACAC-3′ and 5′-GCCCAATACGACCAATCC-3′; Cxcl10 (mouse), 5′-CCAAGTGCTGCCGTCATTTTC-3′ and 5′-GGCTCGCAGGGATGATTTCAA-3′; Il6 (mouse), 5′-CTCTGGGAAATCGTGGAAAT-3′ and 5′-CCAGTTTGGTAGCATCCATC-3′; Ifnb1 (mouse), 5′-AGCTCCAAGAAAGGACGAACA-3′ and 5′-GCCCTGTAGGTGAGGTTGAT-3′; Ifna4 (mouse), 5′-ACCCACAGCCCAGAGAGTGACC-3′ and 5′-AGGCCCTCTTGTTCCCGAGGT-3′; and β-actin (mouse), 5′-CTTTGATGTCACGCACGATTT-3′ and 5′-AGATCTGGCACCACACCTTCT-3′.
Bulk RNA-seq analysis
The RNA-seq libraries were constructed by E-GENE Co. Ltd. as follows. Briefly, the total RNA of each sample was extracted using Invitrogen TRIzol Reagent and then treated with RNase-free DNase I for 30 min according to the manufacturer’s protocols. The poly (A)-containing mRNA was purified using Oligo(dT) Beads from about 1 µg total RNA. The captured mRNA was first fragmented into 100–200 nt using divalent cations at elevated temperatures. The fragmented mRNA was reverse transcripted with SuperScript II and then converted to ds cDNA using RNaseH and DNA Pol I by random priming. After purification, the ds cDNA was subjected to blunt-ending, deoxyadenosine (dA) addition to 3′-end, and adapter ligation. Finally, PCR was carried out to enrich the adapter-ligated cDNA. Library construction is performed by E-GENE Biotech Inc., and it was quantitatively and qualitatively detected using the Qubit dsDNA HS Assay Kit and Agilent 2100 bioanalyzer. Finally, paired-end sequencing is conducted on the Illumina HiSeq PE150 platform (Illumina). Quality control of raw reads was performed using FastQC (version 0.11.5), and clean reads were obtained following the removal of low-quality reads with Trimmomatic (version 0.38) software (Bolger et al., 2014). Sequencing reads were mapped to the human reference genome (UCSC hg38) using Hisat2 (v2.2.1) software (Kim et al., 2019). Gene expression profiling was based on the number of reads. Transcripts per kilobase of exon model per million mapped reads values were calculated by StringTie (v2.1.7) (Pertea et al., 2016) and were used to estimate the expressed values. Differentially expressed genes were obtained using DEseq2 (v1.34.0) (Love et al., 2014). KEGG and GO enrichment analysis was performed on the clusterProfiler R package (v4.4.2) (Wu et al., 2021).
Luciferase reporter assay
IFN-β luciferase activity in cell lysates was measured with a luciferase assay system. In brief, parental BT-549 and MDA-MB-231 cells and the indicated clones with knock-in expression of different PCK1 mutants in 24-well plates were transfected with 0.1 μg of IFN-β luciferase reporter and 0.075 μg of β-galactosidase. 24 h after transfection, the cells were treated with or without hypoxia for 8 h. Cell lysates were measured for the activity of luciferase and β-galactosidase according to the manufacturer’s instructions (Promega). The expression plasmid for the IFN-β luciferase reporter was kindly provided by Dr. Qiujing Yu from the School of Basic Medical Sciences, Tianjin Medical University, Tianjin, China.
TSA
TSA was conducted as previously reported. Briefly, 0.1 mg/ml of His-cGAS WT/T321L or GST-PCK1 WT/N533A/A287V/R436A in PBS was prepared, and a 1,000 dilution of SYPRO Orange dye (Invitrogen) was added. Fluorescence signals were recorded as a function of temperature using a Real-Time PCR machine (CFX96; Bio-Rad) in the förster resonance energy transfer (FRET) mode with fluorescence intensity measured at excitation/emission (Ex/Em): 450–490/560–580 nm. The temperature gradient ranged from 30 to 95°C with a ramp rate of 0.5°C over 15 s. Data analysis was conducted using the differential scanning fluorimetry analysis tool.
BLI assay
The real-time binding assay was performed by BLI using ForteBio Octet red 96 as previously reported (Dai et al., 2019). Briefly, cGAS or PCK1 proteins were biotinylated (G-MM-IGT; Genemore) and immobilized on sulfosalicylic acid (SSA)-coated biosensors in kinetics buffer (1x phosphate buffered saline with tween [PBST] and 0.02% Tween 20, pH 7.4) for 600 s. After reaching base line, sensors were subjected to the association step containing 1.2, 3.7, 11.1, 33.3, or 100 μM GTP for 60 s and then dissociated for 60 s. All reagents were diluted in kinetics buffer. The kinetic data sets were fitted using a 1:1 binding model (Octet RED96 analysis software 12.0) to yield the equilibrium dissociation constant (Kd).
DNA-binding assay
The indicated cell lysis of stable expressed cGAS was incubated with streptavidin UltraLink beads in the presence of biotin-labeled immune-stimulating DNA in lysis buffer (20 mM HEPES, pH 7.8, 400 mM KCl, 5% glycerol, 5 mM EDTA, and 0.4% NP40) with phosphatase and protease inhibitors at 37°C for 4 h. After three washes in the same buffer, bound proteins were eluted by boiling in SDS sample buffer and detected by immunoblotting analysis.
In vitro kinase assay
In vitro kinase assays were performed as previously reported (Rastogi et al., 2020). In brief, bacterially purified active GST-JNK1 or GST-JNK2 (500 ng) was incubated with bacterially purified His-PCK1 WT or His-PCK1 S151A (200 ng) in 25 µl kinase buffer (50 mM Tris-HCl, pH 7.5; 100 mM KCl; 50 mM MgCl2; 1 mM Na3VO4; 1 mM DTT; 5% glycerol; 0.5 mM ATP; and 10 μCi [γ-32P] ATP) at 25°C for 1 h. The reaction was terminated by adding SDS-PAGE loading buffer and heating to 100°C for 5 min. The reaction mixture was then subjected to SDS-PAGE or autoradiography analysis.
Mass spectrometry analysis
For identification of interacting proteins, a protein band visualized via Coomassie blue staining was excised from an SDS-PAGE gel and digested in gel in 50 mM ammonium bicarbonate buffer containing RapiGest (Waters Corporation) overnight at 37°C with 200 ng of modified sequencing-grade trypsin (Promega). The digested protein samples were analyzed using high-sensitivity liquid chromatography-tandem mass spectrometry (LC-MS/MS) with an Orbitrap Elite mass spectrometer (Thermo Fisher Scientific). Proteins were identified by searching the fragment spectra against the UniProt protein database (EMBL-EBI) using the Mascot search engine (v.2.3; Matrix Science) with the Proteome Discoverer software program (v.1.4; Thermo Fisher Scientific). For detection of phosphorylation sites, in vitro phosphorylation of PCK1 by JNK was performed according to the in vitro kinase assay protocol described above. Then the protein samples were digested using trypsin and analyzed using LC-MS/MS with the Orbitrap Elite mass spectrometer as described previously (Qian et al., 2019a; Rastogi et al., 2020).
GST pulldown assay
Equal amounts of His-tagged purified protein (200 ng/sample) were incubated with 100 ng of GST fusion proteins together with glutathione agarose beads in a modified binding buffer (50 mM Tris-HCl, pH 7.5, 1% Triton X-100, 150 mM NaCl, 1 mM DTT, 0.5 mM EDTA, 100 μM PMSF, 100 μM leupeptin, 1 μM aprotinin, 100 μM sodium orthovanadate, 100 μM sodium pyrophosphate, and 1 mM sodium fluoride). The glutathione agarose beads were then washed four times with binding buffer and then subjected to immunoblotting analysis as previously described (Qian et al., 2019b).
IP and immunoblotting analysis
The extraction of proteins using a modified buffer from cultured cells was followed by IP and immunoblotting using corresponding antibodies as described previously (Qian et al., 2019a; Rastogi et al., 2020). Briefly, the cells were collected and washed with cold PBS for three times. Cell pellets were resuspended and lysed in the lysis buffer (25 mM Tris-HCl [pH 7.4], 150 mM NaCl, 1% NP-40, 5 mM EDTA, 10% glycerol, 1 mM NaVO3, 50 mM NaF, and protease inhibitor cocktail) for 30 min at 4°C. The lysates were centrifuged at 15,000 g and supernatant were transferred to a prechilled microcentrifuge tube. Protein concentration was examined using the BCA Protein Assay Kit (Pierce) according to the instruction of manufacturer. About 10% of the supernatant was harvested for western analysis as inputs. 1,500 μg of protein were incubated with indicated antibodies overnight and then mixed with protein A or protein G agarose beads for 2 h. The IP beads were washed with lysis buffer for five times, followed by immunoblotting analysis. The blots were blocked with 3% BSA, followed by the incubation of primary antibodies and HRP-conjugated secondary antibodies.
Analyses of STING oligomerization by native gels
Analyses of STING oligomerization by native gels were performed as previously reported (Zhang et al., 2019). In brief, parental BT-549 and MDA-MB-231 cells and the indicated clones with knock-in expression of different PCK1 mutants were treated with or without hypoxia for 6 h. Cells were then resuspended in a buffer containing 20 mM Tris, pH 7.4, 5 mM MgCl2, and protease inhibitor cocktails (Roche) and sonicated. Lysates were centrifuged at 1,000 g for 5 min to generate the S1 supernatant. The supernatant in a buffer containing 25 mM Tris, pH 7.5, 5 mM MgCl2, 1 mM DTT, 1% NP40, 5% glycerol, 80 mM NaCl, 2.5 mM Na3VO4, and protease inhibitor (Roche) was subjected to native PAGE. Immunoblotting was performed with antibodies against STING.
cGAMP detection
For in vitro cGAMP production assay, 2 mM bacteria-purified cGAS proteins were incubated with 0.2 mg/ml IFN stimulatory dsDNA in a reaction mixture of 20 mM Tris-HCl, pH 7.4, 5 mM MgCl2, 0.2 mg/ml BSA, 5 mM DTT, 150 mM NaCl, 2 mM ATP (A2383; Sigma-Aldrich), and 2 mM GTP (G8877; Sigma-Aldrich) for 4 h incubation at 37°C in the presence or absence of 2 mM OAA and 2 mM bacteria-purified PCK1 proteins. Intracellular cGAMP level was determined using 2′,3′-Cyclic GAMP ELISA Kit (# K067-H1; Arbor Assays) according to the manufacturer’s instructions as previously described (Fang et al., 2023). Optical density at 450 nm was measured using a Synergy NEO Microplate Reader (BioTek) and adjusted for nonspecific binding. Using a Four Parameter Logistic Regression model fitted with cGAMP standards (0.08220 nM with 2.5-fold increase), cGAMP concentrations of the samples were determined after adjusting for dilutions. Samples were diluted 1:250 in assay buffer. Incorporation data were normalized according to cell number.
Determining the Km of PCK1 and cGAS
The Km of cGAS was determined as previously reported (Zhou et al., 2018), which were measured as a function of different ATP/GTP concentration, and 2′3′ cGAMP production was quantified with phosphorimaging and fit according to Michaelis–Menten kinetics. Briefly, different ATP/GTP titrations were performed in the presence of fixed cGAS (1 µM) and 45-bp dsDNA concentration (1.5 µM) in 10 µl of reaction buffer containing 50 mM Tris-HCl, pH 7.5, 35 mM KCl, 5 mM Mg(OAc)2, 1 mM DTT, and [α-32P] ATP (∼1 µCi) at 37°C for 5 min. Reactions were terminated and analyzed using thin layer chromatography as indicated above. The GTP-dependent cGAS enzyme kinetics were plotted and fitted according to Michaelis–Menten substrate inhibition analysis in GraphPad Prism (version 7.0c). The Km of PCK1 was determined using coupled assays as previously reported (Latorre-Muro et al., 2018). Each assay in the OAA to phosphoenolpyruvate (PEP) reaction consisted of 100 mM HEPES, pH 7.5, 0.4 mM OAA, 1 mM ADP, 0.4 mM NADH, 4 mM MgCl2, 0.2 mM MnCl2, 10 mM DTT, 0.5 U of pyruvate kinase (PK)/LDH, and 14 nM PCK1 with different concentrations of GTP accordingly. Reaction was started by the addition of OAA. PCK1 activity was measured in 96-well plates in a total volume of 100 ml at 30°C using a Synergy H4 plate reader (Biotek) recording NADH oxidation in continuous mode. Km and maximum velocity (Vmax) were calculated from a plot of 1/V versus 1/[substrate] according to the Lineweaver–Burke plot model.
Cell permeabilization
Cell permeabilization was performed as described previously (Salabei et al., 2014). Briefly, cells were incubated with digitonin (25 mg/ml) for 5 min and then washed with PBS.
Tdt-mediated dUTP-biotin nick end labeling (TUNEL) assay
Mouse tumor tissues were sectioned at 5-μm thickness. Apoptotic cells were counted using the DeadEnd Colorimetric TUNEL System (Promega) according to the manufacturer’s instructions.
IF analysis
IF analysis was performed as previously reported (Qian et al., 2019a). Cultured cells were fixed by 4% paraformaldehyde, treated with 0.1% Triton X-100 for 5 min, and blocked in 3% BSA for 1 h. The cells were then incubated with primary antibodies at a dilution of 1:100. After incubation with fluorescent dye–conjugated secondary antibodies and DAPI, immunofluorescent microscopic images of the cells were obtained and viewed using an IX81 confocal microscope (Olympus America). Co-localization of proteins was quantified by calculating Pearson’s correlation coefficient using the Coloc 2 plugin in Image J (National Institutes of Health).
IHC analyses and histological evaluation of human TNBC specimens
IHC analyses and histological evaluation of human TNBC specimens Human TNBC and adjacent matched non-tumor tissue samples were obtained from The Fudan University Shanghai Cancer Center, Shanghai, China. The use of human TNBC samples and the relevant database was approved by the Ethics Committee of Fudan University Shanghai Cancer Center and complied with all relevant ethical regulations. All tissue samples were collected in compliance with the informed consent policy. Sections of paraffin-embedded human TNBC samples were stained with antibodies against PCK1 pS151, TBK1 pS172, STING pS366, IRF3 pS396, CD3, CD4, CD8, CD16, or nonspecific IgG as a negative control. The staining of the tissue sections was quantitatively scored according to the percentage of positive cells and the staining intensity as described previously (Wang et al., 2022). The following proportion scores were assigned to the sections: 0 if 0% of the tumor cells exhibited positive staining, 1 for 0–1%, 2 for 2–10%, 3 for 11–30%, 4 for 31–70%, and 5 for 71–100%. In addition, the staining intensity was rated on a scale of 0–3: 0, negative; 1, weak; 2, moderate; and 3, strong. The proportion and intensity scores were then combined to obtain a total score (range, 0–8) as described previously (Wang et al., 2022). Scores were compared with overall survival duration, defined as the time from date of diagnosis to that of death or last known follow-up examination.
Animal studies
Animal studies were performed as previously reported (Guo et al., 2022; Shi et al., 2022a). Animal studies were approved by the Research Ethics Committee and complied with the ethical regulations of Experimental Animal Ethics Committee of The First Affiliated Hospital, Zhejiang University School of Medicine. Immunocompetent BALB/c mice (6-wk-old females) were purchased from GemPharmatech. Mouse 4T-1 (1 × 10⁶ cells) in 100 µl of medium mixed with 100 µl of matrigel basement membrane matrix (BD Biosciences) were injected into the mammary fat pad. We divided the mice into two groups. One group consisted of six mice per subgroup that were used to monitor tumor growth and perform IHC and immunostaining analyses as indicated. PD-1 antibody (100 μg/100 µl in PBS) or control IgG2a (100 μg/100 µl in PBS) was injected intraperitoneally on day 7, 10, 13, 16, and 19 after inoculation, and 3-MPA hydrochloride (100 mg/kg) or SP600125 (30 mg/kg) was injected intraperitoneally on day 7, 9, 11, 13, 15, 17, and 19. 28 days after 4T-1 cell injection, the tumors were harvested, fixed in 4% formaldehyde, and embedded in paraffin. Tumor volume was calculated using length a and width b: V = ab2/2. Another group, which consisted of nine mice per subgroup, was monitored for survival. Humane endpoints included weight loss of 20–25%, weakness that prevented them from obtaining food or water, loss of appetite (anorexia for 24 h), a moribund state, and an inability to participate in normal activities because of tumor growth. All mice were euthanized under anesthesia after two or more of these humane endpoints had been observed. Prior to the in vivo imaging, the mice bearing tumor cells with luciferase were anesthetized with 3% pentobarbital sodium. D-luciferin solution was then injected intraperitoneally (150 mg/kg). The mice were imaged using a Biospace Optima. Bioluminescent signals were quantified using Living Image 3.0 (Caliper Life Sciences).
Intratumoral cells dissociation
Tumors were dissected from mice, weighed, and cut into pieces, which were then enzymatically digested in RPMI (HyClone) containing 200 U/ml Collagenase IV (Sigma-Aldrich) and 100 μg/ml DNase I (Sigma-Aldrich) for 25 min at 37°C. Following the digestion, tumor pieces were further mechanically disrupted with the 70-μm filter (Corning) and the 1-ml syringe plunger to generate a single-cell suspension, of which the red blood cells were lysed in ACK buffer (Gibco). The suspension was finally washed with FACS buffer (PBS with 1% FBS and 2 mM EDTA) before being subjected to the indicated experiments.
Flow cytometry analysis
Flow cytometry and cell sorting were performed as previously reported. Briefly, the washed single-cell suspensions from either intratumoral cells or in vitro co-cultured cells were resuspended with FACS buffer containing antibodies to stain cell surface proteins, Fixable Dye eFluor 506 (eBioscience) to identify live and dead cells, and purified rat anti-mouse CD16/CD32 (BioLegend) to block the nonspecific antibody binding. Cells were subsequently stained for 30 min on ice avoiding light. Next, the surface-stained cells were washed twice and subjected to FACS analysis. For intracellular cytokines staining, the surface-stained cells were fixed with IC fixation buffer for 30 min at room temperature avoiding light, followed with the permeabilization and intracellular staining with indicated antibodies. The samples were acquired with CytoFLEX LX, and the data were analyzed with FlowJo software.
scRNA-seq
The collected tissues were washed three times with 1× PBS to remove the blood and were then cut into small pieces in the RPMI-1640 medium (Invitrogen). The small pieces of tissues were digested using the MACS Multi Tissue Dissociation Kit according to the manufacturer’s recommendations. Dissociated cells were passed through a 40-μm cell strainer centrifuged at 400 g for 15 min. The supernatant was discarded, and the cell pellets were with 1× PBS twice and resuspended in PBS. According to the manufacturer’s instructions, scRNA-seq libraries were constructed using the MGI DNBelab C series reagent Kit. The prepared library was deep sequenced on the DIPSEQ sequencing platform. Raw FASTQ files were processed using PISA to obtain gene expression matrices (Shi et al., 2022b). Seurat (v4.3.0) was applied for downstream analysis. We reserved cells with gene numbers between 200 and 6,000 and mitochondrial gene percentages <20%. Potential doublets were identified and removed using the DoubletFinder (v2.0.3) package (McGinnis et al., 2019). We normalize each library and then use the “FindIntegrationAnchors” and “IntegrateData” functions to integrate the sc data. Subsequently, we used the default parameters to scale, principal component analysis, and cluster for the integrated data and used the classical cell type marker gene for cell type annotation. The cluster-specific marker genes were identified by pairwise comparisons of each cluster against all other clusters using the “FindAllMarkers” function in the Seurat package (thresh.use = 0.25, min.pct = 0.25, only.pos = TRUE). The R package clusterProfiler (version 4.6.2) was applied for the GO enrichment analysis of cluster-specific genes.
CD8+ T cell trajectory analysis
We used the Monocle2 (version 2.30.0) (Trapnell et al., 2014) to explore the underlying changes in CD8+ T cell function and identify potential lineage differentiation. We provide the original unique molecular identifier (UMI) count gene cell matrix as input to Monocle and then use the “newCellDataSet” function to create a Monocle object with lowerDetectionLimit = 0.1 and expressionFamily = negbinomial.size(). Then, we applied “reduceDimension” to reduce the data dimension with method = “DDRTree” and max_components = 2.
Statistics and reproducibility
All statistical data are presented as the mean ± SD. All experiments were repeated at least twice independently with similar results. The mean values obtained in the control and experimental groups were analyzed for significant differences. Pairwise comparisons were performed using a Student’s t test (two-tailed) or Mann–Whitney U test. P values of <0.05 were considered significant. No statistical method was used to predetermine sample size. No data were excluded from the analyses. Data distribution was assumed to be normal, but this was not formally tested. Unless stated otherwise, the experiments were not randomized. Data collection and analysis were not performed blind to the conditions of the experiments.
Online supplemental material
Fig. S1 shows that the JNK1/2-mediated PCK1 S151 phosphorylation promotes its binding to cGAS upon hypoxic conditions, relating to Fig. 1. Fig. S2 shows that the PCK1 S151 phosphorylation attenuates hypoxia-mediated activation of cGAS-STING pathway, relating to Fig. 2. Fig. S3 shows that the inhibitory effect of PCK1 S151 phosphorylation on IFN-I depends on cGAS-STING pathway, relating to Fig. 4. Fig. S4 shows that the GTP-binding affinity of PCK1 and cGAS is indispensable for PCK1 S151 phosphorylation–mediated cGAS-STING inhibition, relating to Fig. 7. Fig. S5 shows that the disruption of JNK-mediated PCK1 S151 phosphorylation using 3-MPA or JNK1/2 inhibitor elevates the anti-tumor effect of anti–PD-1 antibody.
Data availability
The bulk RNA-seq data generated in this study have been deposited in the GSA-Human repository (Chen et al., 2021), with the following accession number: HRA009254. The scRNA-seq data generated in this study have been deposited in the GSA repository, with the following accession numbers: CRA020363. Researchers interested in accessing these datasets may submit an application on the GSA-Human or GSA website, noting that the review process by the database administrator and data access committee typically takes several weeks. Mass spectrometry data have been deposited in ProteomeXchange with the accession code PXD057891. The data that support the findings in this study are available from the corresponding author upon request.
Acknowledgments
We greatly appreciate Dr. Qiujing Yu from the School of Basic Medical Sciences, Tianjin Medical University, Tianjin, China, for kindly providing the IFN-β luciferase reporter plasmid.
This study was supported by grants from the Ministry of Science and Technology of the People’s Republic of China (2021YFA0805600, D. Xu; 2020YFA0803300, Z. Lu), the National Natural Science Foundation of China (82188102, 82030074, Z. Lu; 32470815, 92157113, 82072630, D. Xu; 82372814, 82173114, Z. Wang; 81502260, W. Qin), the Zhejiang Natural Science Foundation Key Project (LD22H160002, D. Xu; LD21H160003, Z. Lu), and the Zhejiang Natural Science Foundation Discovery Project (LQ22H160023, Z. Wang). Z. Lu is the Kuancheng Wang Distinguished Chair. The author gratefully acknowledges the support of K.C. Wong Education Foundation.
Author contributions: W. Qin: investigation. Y. Duan: data curation, formal analysis, investigation, and writing—original draft. Z. Hu: data curation, formal analysis, funding acquisition, investigation, methodology, validation, and visualization. Y. Hou: investigation and visualization. T. Wen: investigation. Y. Ouyang: data curation and investigation. Z. Wang: funding acquisition and investigation. X. Sun: investigation. X. Chen: writing—review and editing. K.L. Wang: investigation. S. Luo: investigation. G. Ji: investigation. Y. Shen: investigation and resources. B. Dong: investigation. Y. Lin: investigation. Q. Tian: investigation. Z. Guo: investigation. S. Wu: investigation. L. Xiao: investigation. M. Li: writing—review and editing. L. Xiao: resources and visualization. Q. Wu: data curation and software. Y. Meng: resources and writing—review and editing. G. Liu: investigation. W. Zhang: conceptualization. S. Duan: conceptualization, formal analysis, methodology, resources, and supervision. X. Bai: writing—review and editing. T. Liu: conceptualization, resources, supervision, validation, and writing—review and editing. J. He: writing—review and editing. Z. Lu: conceptualization and funding acquisition. D. Xu: conceptualization, data curation, funding acquisition, project administration, supervision, and writing—original draft, review, and editing.

