


Membrane contact sites (MCS) between the plasma membrane (PM) and endoplasmic reticulum (ER) regulate Ca2+ influx. However, the mechanisms by which cells modulate ER–PM MCS density are not understood, and the role of Ca2+, if any, in regulating these is unknown. We report that in Drosophila photoreceptors, MCS density is regulated by the Ca2+ channels, TRP and TRPL. Regulation of MCS density by Ca2+ is mediated by Drosophila extended synaptotagmin (dEsyt), a protein localized to ER–PM MCS and previously shown to regulate MCS density. We find that the Ca2+-binding activity of dEsyt is required for its function in vivo. dEsytCaBM, a Ca2+ non-binding mutant of dEsyt is unable to modulate MCS structure. Further, reconstitution of dEsyt null photoreceptors with dEsytCaBM is unable to rescue ER–PM MCS density and other key phenotypes. Thus, our data supports a role for Ca2+ binding to dEsyt in regulating ER–PM MCS density in photoreceptors thus tuning signal transduction during light-activated Ca2+ influx.

Introduction
In many eukaryotic cells, the response to stimuli is transduced to cellular responses by changes in intracellular calcium (Ca2+) levels (Berridge, 1997). For example, ligand binding to numerous cell surface receptors triggers the activation of phospholipase C (PLC) leading to both Ca2+ release from intracellular stores as well as influx from the extracellular compartment into the cytoplasm, thus regulating cell physiology (Berridge, 2009). Likewise, in the nervous system, action potentials that mediate neuronal excitation lead to Ca2+ influx into the presynaptic terminal through voltage-gated Ca2+ channels, leading to vesicle fusion and neurotransmitter release (Catterall et al., 2013; Dunlap et al., 1995; Mochida et al., 1998; Sabatini and Regehr, 1996; Südhof, 1995). During such events, intracellular Ca2+ levels ([Ca2+]i) near the plasma membrane (PM) rise and impact the function of proteins at this location. For example, in the context of neurotransmission, the activity of proteins such as synaptotagmin and Munc13 that participate in vesicle fusion and neurotransmitter release is modulated by [Ca2+]i (Silva et al., 2021).
In recent years, membrane contact sites (MCS) between the PM and ER have been described as sites for localized biochemical exchange between these organelle membranes (Saheki and De Camilli, 2017). Ca2+ signaling and MCS function have been functionally linked. In cells, depletion of intracellular Ca2+ reserves increases the areas of apposition between the PM and the ER (Chang et al., 2013; Giordano et al., 2013; Petersen et al., 2017), which supports crucial cellular processes like excitation–contraction coupling in muscles (Endo, 2009). Further, Ca2+ influx into cells has been linked to MCS function; the interaction of the ER protein, stromal interaction molecule 1 (STIM1), with the PM Ca2+ channel Orai1 leads to its gating, thus triggering store-operated calcium entry (SOCE) (Prakriya and Lewis, 2015). Several classes of proteins that are localized to ER–PM MCS have been identified. Such proteins, localized within nanoscale distances of the PM, are well positioned to detect changes in [Ca2+]i at this location and may therefore serve as sensors of cell physiology mediated by Ca2+ influx across the PM. One such protein is extended synaptotagmins (Esyt) (Reinisch and De Camilli, 2016). Esyts are ER-resident proteins that connect the ER to the PM via their C2 domains. Some of the C2 domains of Esyt have been reported to be regulated by Ca2+, for example, in Esyt1, it is reported that extracellular Ca2+ influx enhances ER–PM MCS by binding to the C2 domains (Idevall-Hagren et al., 2015) followed by a Ca2+-dependent release of an interdomain autoinhibitory mechanism (Bian et al., 2018). In mammalian cells, it has also been proposed that Ca2+ binding to the C2 domains may regulate the lipid transfer function of the synaptotagmin-like mitochondrial lipid binding protein (SMP) domain (Bian et al., 2018; Idevall-Hagren et al., 2015), suggesting the Ca2+ regulation of Esyt function during signaling. While these findings indicate that the C2 domains of Esyt can bind and respond to Ca2+, the relevance of this Ca2+ binding to the physiological functions of Esyt in vivo remains unknown.
In Drosophila photoreceptors, transduction of photon absorption is mediated by G-protein coupled PLC signaling leading to a large rise in [Ca2+]i levels (Hardie and Raghu, 2001). This rise in [Ca2+]i is mediated by the opening of the light-sensitive, Ca2+ permeable PM channels: transient receptor potential (TRP) and trp-like (TRPL) (Reuss et al., 1997). The apical PM in Drosophila photoreceptors is expanded to form finger-like microvilli and PLC activation and Ca2+ influx through TRP and TRPL channels occurs at the microvillar PM. At the base of the microvilli, the ER known to be the sub-microvillar cisternae (SMC) is closely arranged next to the microvillar PM to form an ER–PM MCS (Fig. 1 A). During PLC signaling, in the context of phototransduction, lipid transfer occurs at this MCS through the phosphatidylinositol and phosphatidic acid transfer activity of the RDGB protein (Yadav et al., 2015) (reviewed in Raghu et al. [2021]) and the Drosophila photoreceptor has been an influential model system for the understanding of ER–PM MCS biology in vivo (Yadav et al., 2016). The Drosophila genome contains a single gene encoding Esyt (dEsyt) (Kikuma et al., 2017; Nath et al., 2020) and the loss of function mutants of dEsyt leads to loss of ER–PM integrity, mislocalization of RDGB and consequent retinal degeneration (Nath et al., 2020). In Drosophila photoreceptors, dEsyt is localized to the base of the microvillus at the ER–PM MCS and could potentially be well positioned to sense and respond to changes in [Ca2+]i arising due to the activation of TRP and TRPL during phototransduction. However, the regulation of ER–PM MCS and dEsyt by [Ca2+]i is not known. Here, we report that TRP and TRPL channel function is required to maintain normal MCS density in Drosophila photoreceptors. Using a Ca2+ non-binding mutant of dEsyt (dEsytCaBM), we find that loss of Ca2+ binding activity leads to mislocalization of the protein and the mutant protein phenocopies loss of dEsyt function. Thus, dEsyt binds Ca2+ and mediates the transduction of photoreceptor illumination into MCS density in vivo. This in turn tunes the photoreceptor function to ongoing ambient illumination.

MCS density is regulated by TRP channels in Drosophila photoreceptors. (A) Schematic showing the spatial orientation and dimensions of the location of TRP, TRPL, dEsyt and RDGB across the microvillar plasma membrane (rhabdomere) and the submicrovillar cisternae (SMC) (Left side) in a Drosophila photoreceptor cell (right side) (Image generated using Biorender, https://app.biorender.com/). (B) TEM images of a single ommatidium from wild type photoreceptors of flies reared in dark (i) day 1 and (iii) day 14, scale bar: 1 µm. (* - R7 photoreceptor). Magnified image showing a single photoreceptor from the same ommatidium on the left (ii) day1 and (iv) day 14. Scale bar: 200 nm. Arrow indicates the SMC forming an MCS with the microvillar PM. (C) TEM images of a single ommatidium from trpl302;trp343 photoreceptors of flies reared in dark (i) day 1 and (iii) day 14, scale bar: 1 µm. (* - R7 photoreceptor). Magnified image showing a single photoreceptor from the same ommatidium on the left (ii) day1 (iv) day 14. Scale bar: 500 nm. The arrow indicates the SMC forming an MCS with the microvillar PM. (D) Quantification of the number of MCS per photoreceptor of wild type day 1 v/s trpl302;trp343 day 1 old flies reared in dark; X-axis indicates the genotype and Y-axis indicates the number of MCS/photoreceptor. n = 30 photoreceptors from three separate flies (R1–R6) (N = 3; n = 30). (E) Quantification of the number of MCS per wild type photoreceptor of day 1 (D1) and day 14 (D14) old flies reared in the dark (from Fig. 1 B), X axis indicates the genotype and age of the fly. Y axis indicates the number of MCS/photoreceptor. n = 30 photoreceptors from three separate flies (R1–R6) (N = 3; n = 30). (F) Quantification of the number of MCS per trpl302;trp343 photoreceptor of day 1 (D1) and day 14 (D14) old flies reared in the dark (from Fig. 1 C), Y axis indicates the number of MCS/photoreceptor. n = 30 photoreceptors from three separate flies (R1–R6) (N = 3; n = 30). Violin plots with mean ± SD are shown. Statistical tests: (D–F) Student’s unpaired t test. ns - Not significant; ****P value <0.0001.
MCS density is regulated by TRP channels in Drosophila photoreceptors. (A) Schematic showing the spatial orientation and dimensions of the location of TRP, TRPL, dEsyt and RDGB across the microvillar plasma membrane (rhabdomere) and the submicrovillar cisternae (SMC) (Left side) in a Drosophila photoreceptor cell (right side) (Image generated using Biorender, https://app.biorender.com/). (B) TEM images of a single ommatidium from wild type photoreceptors of flies reared in dark (i) day 1 and (iii) day 14, scale bar: 1 µm. (* - R7 photoreceptor). Magnified image showing a single photoreceptor from the same ommatidium on the left (ii) day1 and (iv) day 14. Scale bar: 200 nm. Arrow indicates the SMC forming an MCS with the microvillar PM. (C) TEM images of a single ommatidium from trpl302;trp343 photoreceptors of flies reared in dark (i) day 1 and (iii) day 14, scale bar: 1 µm. (* - R7 photoreceptor). Magnified image showing a single photoreceptor from the same ommatidium on the left (ii) day1 (iv) day 14. Scale bar: 500 nm. The arrow indicates the SMC forming an MCS with the microvillar PM. (D) Quantification of the number of MCS per photoreceptor of wild type day 1 v/s trpl302;trp343 day 1 old flies reared in dark; X-axis indicates the genotype and Y-axis indicates the number of MCS/photoreceptor. n = 30 photoreceptors from three separate flies (R1–R6) (N = 3; n = 30). (E) Quantification of the number of MCS per wild type photoreceptor of day 1 (D1) and day 14 (D14) old flies reared in the dark (from Fig. 1 B), X axis indicates the genotype and age of the fly. Y axis indicates the number of MCS/photoreceptor. n = 30 photoreceptors from three separate flies (R1–R6) (N = 3; n = 30). (F) Quantification of the number of MCS per trpl302;trp343 photoreceptor of day 1 (D1) and day 14 (D14) old flies reared in the dark (from Fig. 1 C), Y axis indicates the number of MCS/photoreceptor. n = 30 photoreceptors from three separate flies (R1–R6) (N = 3; n = 30). Violin plots with mean ± SD are shown. Statistical tests: (D–F) Student’s unpaired t test. ns - Not significant; ****P value <0.0001.
Results
TRP channels regulate MCS density in Drosophila photoreceptors
Age-related decrease in ER–PM MCS density in wild type photoreceptors are reliant on continued PLC activity (Nath et al., 2020). A key outcome of light-induced PLC activity in photoreceptors is the activation of the light-sensitive calcium- and cation-selective PM channels encoded by trp and trpl (Fig. 1 A) (Hardie and Minke, 1992; Reuss et al., 1997). To test the effect of calcium influx, if any on MCS density, we measured the density of ER-PM MCS in trpl302; trp343 (protein null mutants of TRPL and TRP channels, respectively) compared with controls (Fig. 1, B and C). At eclosion, MCS density in trpl302; trp343 was ∼30% compared to 45% in controls (Fig. 1 D). As previously reported (Nath et al., 2020), wild type flies show an age-dependent drop in MCS density (Fig. 1 E). However, unlike wild type flies, trpl302; trp343 photoreceptors did not exhibit any age-related drop in MCS density; hence, 14-day-old trpl302; trp343 photoreceptors displayed the same MCS density as 1-day-old flies (Fig. 1 F). Therefore, MCS density in aging photoreceptors is dependent on TRP and TRPL channel activity.
Calcium-binding residues of dEsyt C2A domain are structurally similar to hEsyt2 C2A domain
The tethering and lipid transfer activity of mammalian Esyts are critically regulated by Ca2+ (Giordano et al., 2013; Saheki et al., 2016; Yu et al., 2016). However, the sensitivity of dEsyt to Ca2+ binding is not known. C2 domains from several Esyt proteins were aligned using clustalO (Sievers et al., 2011) to confirm the conservation of calcium binding residues (Fig. 2 A). dEsyt contains nine conserved calcium-binding residues spread across the three C2 domains- C2A (D364, D374, D421, D423, E429); C2B (D517, D564) and C2C (D746, D752) (Kikuma et al., 2017). The C2A and C2B domains from human synaptotagmin, C2A–C2E domains from human Esyt1 (hEsyt1), C2A–C2C domains from human Esyt2 (hEsyt2) and C2A–C2C domains of dEsyt were aligned. The Ca2+ binding residues of the dEsyt C2A domain were conserved and were similar to the residues in hEsyt2 (Fig. 2 A). The X-ray crystallographic structure of hEsyt2 C2A and C2B domain (PDB ID: 4npk) bound to Ca2+ shows that the C2A domain can bind calcium while the C2B domain does not bind calcium (Xu et al., 2014). The binding of the first calcium ion to the C2A domain occurs with high affinity (Kd < 10 µM) while the binding of the other two calcium ions has a lower affinity (Kd = 100–200 µM) (Xu et al., 2014). The sequence identity between hEsyt2 and dEsyt protein sequences is 49.52% (Fig. 2 B). We generated the structure of dEsyt C2A domain by in silico homology modeling using MODELLER (Webb and Sali, 2014) with the hEsyt2 structure as a template (PDB ID: 4npk). The overall RMSD between the two structures is 0.159 Å (Fig. 2 C) while the RMSD of the five residues that interact with Ca2+ is <0.1 Å (Fig. 2 E). This finding suggests that the interaction of Ca2+ binding residues of dEsyt is similar to hEsyt2. In a parallel approach, we also checked the superposition of the dEsyt C2A structure predicted by AlphaFold (Jumper et al., 2021) against that predicted by homology modeling. The close similarity between the two predicted structures was indicated by an RMSD value of 0.62 Å (Fig. S1 A). All the calcium-binding residues are conserved and the calcium coordination is equivalent in both forms (Fig. S1 B).

Calcium-binding residues of dEsyt C2A domain are structurally similar to the hEsyt2 C2A domain. (A) Alignment of C2 domains from dEsyt (C2A-C), hEsyt2 (C2A-C), h-Synaptotagmin (C2A-B) and hEsyt1 (C2A-E). The residues important for binding calcium ions have been marked in red rectangles. (B) Alignment between hEsyt2 (Isoform B) and dEsyt C2A domain used for homology modeling using MODELLER. (C) Structural superposition of template hEsyt2 PDB ID 4npk and dEsyt model generated by MODELLER (RMSD = 0.159 Å). (D) MIB scores for residues of the wild type dEsyt protein. (E) Structural superposition of residues involved in calcium metal coordination. (F) MIB scores for residues of the mutant dEsyt protein.
Calcium-binding residues of dEsyt C2A domain are structurally similar to the hEsyt2 C2A domain. (A) Alignment of C2 domains from dEsyt (C2A-C), hEsyt2 (C2A-C), h-Synaptotagmin (C2A-B) and hEsyt1 (C2A-E). The residues important for binding calcium ions have been marked in red rectangles. (B) Alignment between hEsyt2 (Isoform B) and dEsyt C2A domain used for homology modeling using MODELLER. (C) Structural superposition of template hEsyt2 PDB ID 4npk and dEsyt model generated by MODELLER (RMSD = 0.159 Å). (D) MIB scores for residues of the wild type dEsyt protein. (E) Structural superposition of residues involved in calcium metal coordination. (F) MIB scores for residues of the mutant dEsyt protein.

Structural similarity between dEsyt C2A structure predicted by homology modeling and AlphaFold. (A) Structural superposition of the dEsyt C2A structure predicted by homology modeling and AlphaFold (RMSD = 0.62 Å). The structure derived from homology modeling is shown in magenta and that predicted by AlphaFold is shown in blue. Calcium ions are shown as dark blue spheres. The Ca2+ binding residues of the respective structures are shown in orange (homology model) and green (AlphaFold). (B) Structural superposition of the calcium-binding residues of the C2A domain from dEsyt. The Ca2+ binding residues of the respective structures are shown in orange (homology model) and green (AlphaFold). Calcium ions are shown as dark blue spheres.
Structural similarity between dEsyt C2A structure predicted by homology modeling and AlphaFold. (A) Structural superposition of the dEsyt C2A structure predicted by homology modeling and AlphaFold (RMSD = 0.62 Å). The structure derived from homology modeling is shown in magenta and that predicted by AlphaFold is shown in blue. Calcium ions are shown as dark blue spheres. The Ca2+ binding residues of the respective structures are shown in orange (homology model) and green (AlphaFold). (B) Structural superposition of the calcium-binding residues of the C2A domain from dEsyt. The Ca2+ binding residues of the respective structures are shown in orange (homology model) and green (AlphaFold). Calcium ions are shown as dark blue spheres.
To check which residues are capable of forming Ca2+ co-ordination in the dEsyt structure, we used the MIB, a metal-ion–binding site prediction tool (Lin et al., 2016). The residues D364, D374, D421, D423 and E429 of dEsyt protein were predicted with scores >3 and marked as residues important for Ca2+ binding (Fig. 2 D). These residues correspond to the five aspartate residues of hEsyt2 as shown in the PDB structure of 4npk. The four aspartate residues were then mutated to asparagine and the glutamate residue was mutated to glutamine using the “build model” module of FOLDX (Schymkowitz et al., 2005). The MIB tool was used to check residues interacting with calcium ions in the mutant dEsyt structure. All five residues in the wild type protein structure that were predicted to bind calcium now showed lower MIB scores and reduced ion binding capacity (Fig. 2 F). These findings strongly suggest that the aspartate and glutamate residues in the C2A domain play an important role in interaction with Ca2+.
Calcium binding to dEsyt is required for localization to ER–PM contact sites
To test the sensitivity of dEsyt to Ca2+ binding and its impact on cell physiology in vivo, we generated a mutant version of dEsyt that cannot bind Ca2+. We generated a dEsyt transgene where the four conserved aspartates (D) were mutated to asparagine (N) and the glutamic acid (E) to glutamine (Q) in the C2A of dEsyt. Further, each of the two conserved aspartates (D) in C2B and C2C were mutated to asparagine (N). This transgene carrying a total of nine mutations should render the protein unable to bind calcium (dEsytCaBM) (Fig. 3 A). Aspartate-to-asparagine mutations (D→N) result in the inhibition of Ca2+ binding by removing the negative charge from the calcium-binding pocket and result in minimal disruption of the protein structure as the mutations partially mimic Ca2+ binding (Fernández-Chacón et al., 2002; Robinson et al., 2002). Expression of the construct in Drosophila S2R+ cells yielded a protein band with the expected molecular weight (Fig. S2 A). We tested the requirement of intact Ca2+ binding residues in dEsyt for its localization. On expression in Drosophila S2R+ cells, dEsytCaBM::GFP was found to primarily localize to the PM with a fraction of the protein still residing in certain membrane compartments within the cytosol (Fig. S2 B). This is in contrast to wild type dEsyt::GFP, which is primarily localized in the membrane compartments within the cytosol. We also studied the localization of dEsytCaBM::GFP in Drosophila photoreceptors. The exogenous expression levels of dEsyt and dEsytCaBM in vivo were comparable (Fig. S2 C). In photoreceptors, Rh1>dEsyt::GFP appears localized toward the base of the rhabdomere; by contrast, Rh1>dEsytCaBM::GFP was found to be localized to the rhabdomeres (apical PM) with a small fraction of the protein still residing at the ER–PM interface, co-localized with RDGB (Fig. 3 B).

Localization of dEsyt to the ER–PM contact sites requires calcium binding to dEsyt. (A) Schematic showing the site-directed mutations introduced into the nine conserved calcium-binding residues spread across the three C2 domains of dEsyt (Image generated using IBS, Illustrator for Biological sciences Version 1.0 software http://ibs.biocuckoo.org/) (Liu et al., 2015). (B) Confocal images showing the localization of exogenously expressed dEsyt::GFP and dEsytCaBM::GFP driven using eye-specific Rh1-Gal4 in 1-day-old dark-reared flies. Rh1-Gal4 is shown as a control. Transverse sections of an individual ommatidium are shown. Phalloidin marks F-actin staining and highlights rhabdomeres R1–R7 (Magenta), red indicates the localization of exogenously expressed dEsyt and dEsytCaBM protein tagged to GFP, and cyan represents RDGB localization at the base of the rhabdomere (marker for SMC). Scale bar: 2 µm. White arrows indicate the colocalization of GFP-tagged dEsyt and endogenous RDGB at the base of the rhabdomere. (C) Confocal images showing the localization of endogenous dEsyt (Cyan) in 1-day-old dark-reared flies of wild type and norpAP24. dEsytKO is shown as a control. A single ommatidium is shown. Scale bar: 2 µm. Phalloidin marks F-actin staining (Magenta) and highlights rhabdomeres R1–R7.
Localization of dEsyt to the ER–PM contact sites requires calcium binding to dEsyt. (A) Schematic showing the site-directed mutations introduced into the nine conserved calcium-binding residues spread across the three C2 domains of dEsyt (Image generated using IBS, Illustrator for Biological sciences Version 1.0 software http://ibs.biocuckoo.org/) (Liu et al., 2015). (B) Confocal images showing the localization of exogenously expressed dEsyt::GFP and dEsytCaBM::GFP driven using eye-specific Rh1-Gal4 in 1-day-old dark-reared flies. Rh1-Gal4 is shown as a control. Transverse sections of an individual ommatidium are shown. Phalloidin marks F-actin staining and highlights rhabdomeres R1–R7 (Magenta), red indicates the localization of exogenously expressed dEsyt and dEsytCaBM protein tagged to GFP, and cyan represents RDGB localization at the base of the rhabdomere (marker for SMC). Scale bar: 2 µm. White arrows indicate the colocalization of GFP-tagged dEsyt and endogenous RDGB at the base of the rhabdomere. (C) Confocal images showing the localization of endogenous dEsyt (Cyan) in 1-day-old dark-reared flies of wild type and norpAP24. dEsytKO is shown as a control. A single ommatidium is shown. Scale bar: 2 µm. Phalloidin marks F-actin staining (Magenta) and highlights rhabdomeres R1–R7.
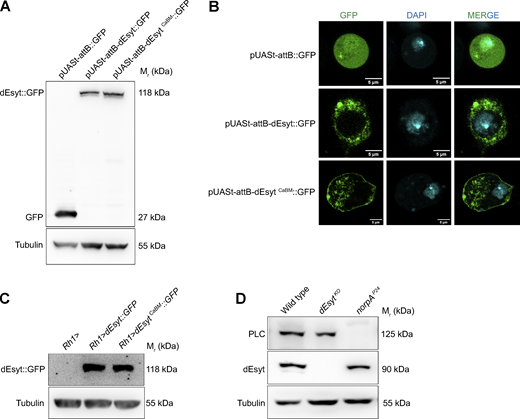
Localization of dEsyt to the ER-PM contact sites necessitates calcium binding to dEsyt. (A) Western blot using transfected S2 cell lysate showing expression levels of dEsyt-CaBM::GFP in comparison to dEsyt::GFP. The blot is probed with antibody against GFP. Tubulin is used as loading control. (Mr: Molecular weight). (B) Confocal images of S2R+ cells transfected with pUASt-attB::GFP, pUASt-attB-dEsyt::GFP and pUASt-attB-dEsytCaBM::GFP. Green represents signal from GFP. DAPI (cyan) stains the nucleus. Scale bar: 5 µm. (C) Western blot from head extracts of the genotypes as indicated on the top of the blot. The blot was probed with antibody against GFP. Tubulin was used as the loading control. (Mr: Molecular weight). (D) Western blot from head extracts of the genotypes as indicated on the top of the blot. The blot was probed with antibody against dEsyt and norpA (PLC). Tubulin was used as the loading control. (Mr: Molecular weight). Source data are available for this figure: SourceData FS2.
Localization of dEsyt to the ER-PM contact sites necessitates calcium binding to dEsyt. (A) Western blot using transfected S2 cell lysate showing expression levels of dEsyt-CaBM::GFP in comparison to dEsyt::GFP. The blot is probed with antibody against GFP. Tubulin is used as loading control. (Mr: Molecular weight). (B) Confocal images of S2R+ cells transfected with pUASt-attB::GFP, pUASt-attB-dEsyt::GFP and pUASt-attB-dEsytCaBM::GFP. Green represents signal from GFP. DAPI (cyan) stains the nucleus. Scale bar: 5 µm. (C) Western blot from head extracts of the genotypes as indicated on the top of the blot. The blot was probed with antibody against GFP. Tubulin was used as the loading control. (Mr: Molecular weight). (D) Western blot from head extracts of the genotypes as indicated on the top of the blot. The blot was probed with antibody against dEsyt and norpA (PLC). Tubulin was used as the loading control. (Mr: Molecular weight). Source data are available for this figure: SourceData FS2.
To independently test the requirement of Ca2+ influx in localizing dEsyt, we studied the localization of the endogenous dEsyt protein in norpAP24 mutants that lack the PLCβ protein (Pearn et al., 1996) required for TRP and TRPL activation. Although the levels of dEsyt protein were similar between wild type and norpAP24 (Fig. S2 D), the endogenous dEsyt protein was mislocalized from the SMC into the rhabdomere and photoreceptor cell body in norpAP24 (Fig. 3 C). Thus, the Ca2+ binding activity of dEsyt is important to retain the protein at the ER–PM contact sites and in the absence of Ca2+ binding, the protein appears mislocalized.
dEsytCaBM exerts a dominant negative effect on the wild type dEsyt allele
To test the function of dEsytCaBM in cells, we overexpressed this protein in Drosophila photoreceptors. When dEsyt::GFP is expressed in wild type photoreceptors (Rh1> dEsyt::GFP), it does not affect photoreceptor structure even when flies are grown in 5,000 Lux constant illumination (Fig. 4, A and B). However, when dEsytCaBM::GFP is expressed under equivalent conditions (Rh1> dEsytCaBM::GFP), it resulted in a light-dependent retinal degeneration (Fig. 4, A and B). The kinetics of this degeneration closely paralleled with that previously reported for dEsytKO (Nath et al., 2020), suggesting that dEsytCaBM::GFP might exert a dominant negative effect on the endogenous protein.

Functional activity of dEsyt CaBM . (A) Representative optical neutralization (ON) images showing rhabdomere structure of the indicated genotypes. Rearing conditions and the age of the flies are indicated on top. (*CL–Constant Light). Scale bar: 20 pixels (corresponds to ∼5 µm). (B) Quantification of the time course taken for retinal degeneration. 50 ommatidia were scored from five flies of each genotype and plotted. (N = 5; n = 50). (C) Confocal images showing the localization of RDGB in Rh1>, Rh1>dEsyt::GFP and Rh1>dEsytCaBM::GFP photoreceptors of flies which are (i) 1-day-old dark reared (ii) 6-day-old exposed to constant illumination (5,000 Lux). For (i) and (ii), RDGB visualized is detected using an antibody against the endogenous protein (Cyan). Rhabdomeres are outlined using phalloidin which marks F-actin (Red). A single ommatidium is shown. Scale bar: 2 µm. (D) TEM images of a single ommatidium from photoreceptors of flies reared in dark, 1-day-old (i) Rh1>, (iv) Rh1>dEsyt::GFP, (vii) Rh1>dEsytCaBM::GFP and (x) dEsytKO. Scale bar: 1 µm. (* - R7 photoreceptor). (ii, v, viii, and xi) Magnified image showing a single photoreceptor from the ommatidium image shown on the left. Scale bar: 200 nm. (iii, vi, ix, and xii) Magnified image showing the MCS distance (yellow arrows highlight the distance between ER and PM) of the photoreceptor image shown on the left. Scale bar: 100 nm. (E) Quantification of the contact site distance between the apical PM and the associated SMC, X-axis indicates the genotypes and Y-axis indicates the contact site distance in nm, 75 data points from 25 photoreceptors of three separate flies (R1–R6). (N = 3; n = 25). (F) Quantification of the MCS density per photoreceptor, X-axis indicates the genotype and Y-axis indicates the MCS density/photoreceptor, n = 25 photoreceptors from three separate flies (R1–R6). (N = 3; n = 25) (B) XY plots with mean ± SD are shown. (E and F) Violin plots with mean ± SD are shown. Statistical tests: (E and F) One-way ANOVA with post hoc Tukey’s multiple pairwise comparison. ns - Not significant; **P value <0.01; ****P value <0.0001.
Functional activity of dEsyt CaBM . (A) Representative optical neutralization (ON) images showing rhabdomere structure of the indicated genotypes. Rearing conditions and the age of the flies are indicated on top. (*CL–Constant Light). Scale bar: 20 pixels (corresponds to ∼5 µm). (B) Quantification of the time course taken for retinal degeneration. 50 ommatidia were scored from five flies of each genotype and plotted. (N = 5; n = 50). (C) Confocal images showing the localization of RDGB in Rh1>, Rh1>dEsyt::GFP and Rh1>dEsytCaBM::GFP photoreceptors of flies which are (i) 1-day-old dark reared (ii) 6-day-old exposed to constant illumination (5,000 Lux). For (i) and (ii), RDGB visualized is detected using an antibody against the endogenous protein (Cyan). Rhabdomeres are outlined using phalloidin which marks F-actin (Red). A single ommatidium is shown. Scale bar: 2 µm. (D) TEM images of a single ommatidium from photoreceptors of flies reared in dark, 1-day-old (i) Rh1>, (iv) Rh1>dEsyt::GFP, (vii) Rh1>dEsytCaBM::GFP and (x) dEsytKO. Scale bar: 1 µm. (* - R7 photoreceptor). (ii, v, viii, and xi) Magnified image showing a single photoreceptor from the ommatidium image shown on the left. Scale bar: 200 nm. (iii, vi, ix, and xii) Magnified image showing the MCS distance (yellow arrows highlight the distance between ER and PM) of the photoreceptor image shown on the left. Scale bar: 100 nm. (E) Quantification of the contact site distance between the apical PM and the associated SMC, X-axis indicates the genotypes and Y-axis indicates the contact site distance in nm, 75 data points from 25 photoreceptors of three separate flies (R1–R6). (N = 3; n = 25). (F) Quantification of the MCS density per photoreceptor, X-axis indicates the genotype and Y-axis indicates the MCS density/photoreceptor, n = 25 photoreceptors from three separate flies (R1–R6). (N = 3; n = 25) (B) XY plots with mean ± SD are shown. (E and F) Violin plots with mean ± SD are shown. Statistical tests: (E and F) One-way ANOVA with post hoc Tukey’s multiple pairwise comparison. ns - Not significant; **P value <0.01; ****P value <0.0001.
To understand if altered localization of dEsytCaBM in a different compartment (apical PM) within these highly polarized cells can manifest an effect on the ER–PM integrity and thereby contribute to photoreceptor degeneration, we assessed the localization of a known contact site protein, RDGB, in Rh1>dEsytCaBM::GFP lines. At day-1 post eclosion, just like in the control photoreceptors, RDGB was solely localized to the MCS in both Rh1>dEsyt::GFP and Rh1>dEsytCaBM::GFP (Fig. 4 C i). However, after 6 days of continuous illumination, despite the presence of wild type gene, Rh1>dEsytCaBM::GFP exhibited diffused localization of RDGB throughout the photoreceptor cell body (Fig. 4 C ii), and this phenocopies that seen in dEsytKO photoreceptors (Nath et al., 2020). In contrast, in wild type and Rh1>dEsyt::GFP photoreceptors, RDGB localization to the MCS was preserved under identical conditions (Fig. 4 C ii).
Contact site disruption has previously been shown to be the cause of RDGB mislocalization in dEsytKO photoreceptors (Nath et al., 2020). To determine if the mislocalization of RDGB in dEsytCaBM is a result of a change in contact site density or the distance between the ER and PM, we analyzed the photoreceptor ultrastructure. The distance between the ER and PM in wild type photoreceptors is ∼12–13 nm (Krishnan et al., 2023) (Fig. 4, D i–iii and E). This contact site gap was substantially less on day 1 after eclosion in Rh1>dEsyt::GFP, showing the protein’s tethering role in bringing the two membranes together (Fig. 4, D iv–vi and E). By contrast, the Ca2+ binding mutant was unable to reduce contact site distance similar to wild type and dEsytKO at day 1 (Fig. 4, D vii–xii and E). When the same experimental set was examined for MCS density, we discovered that the density enhanced by 10% in Rh1>dEsyt::GFP while being comparable between wild type, dEsytKO and Rh1> dEsytCaBM::GFP flies (Fig. 4, D i–xii and F).
We assessed the MCS density in dEsytCaBM photoreceptors as a function of age and illumination to examine the contribution of MCS density in supporting RDGB localization in these mutants. As expected, prior to the onset of degeneration, after 6 days of constant light exposure, the MCS density in Rh1>dEsytCaBM::GFP was around 20% with visible alterations in the rhabdomere ultrastructure as compared with wild type and Rh1>dEsyt::GFP, both harboring ∼55% intact MCS (Fig. S3, A i and B). This clearly indicates that the RDGB mislocalization and onset of retinal degeneration in Rh1>dEsytCaBM::GFP is a consequence of the disruption of contact sites. However, as a function of age (Day 6CD), the contact sites in wild type and Rh1>dEsyt::GFP remained comparable with that of its constant light-reared counterparts whereas Rh1>dEsytCaBM::GFP exhibited a slight decline in contact sites to ∼40% while still maintaining intact MCS (Fig. S3, A ii and C), as demonstrated by the precise localization of RDGB at the base of the rhabdomere (Fig. S3 D).

Mislocalization of RDGB and onset of retinal degeneration in dEsyt CaBM result from the loss of contact sites. (A) TEM images of a single photoreceptor from flies (i) Exposed to constant illumination for 6 days (ii) Aged for 6 days in dark Genotypes: Rh1>, Rh1>dEsyt::GFP and Rh1>dEsytCaBM::GFP as indicated on the left. (Ai-ii) Scale bar: 200 µm. (Aiii-vi) Scale bar: 500 µm. (B) Quantification of the number of MCS per photoreceptor of flies of the indicated genotypes reared in constant illumination for 6 days. X-axis indicates the genotype and Y-axis indicates the number of MCS/photoreceptor. n = 25 photoreceptors from three separate flies (R1–R6) (N = 3; n = 25]. (C) Quantification of the number of MCS per photoreceptor of flies of the indicated genotypes reared in constant dark for 6 days. X-axis indicates the genotype and Y-axis indicates the number of MCS/photoreceptors. n = 25 photoreceptors from three separate flies (R1–R6) (N = 3; n = 25). (D) Confocal images showing the localization of RDGB in Rh1>, Rh1>dEsyt::GFP and Rh1>dEsytCaBM::GFP photoreceptors of 6-day-old constant dark-reared flies. RDGB visualized is detected using an antibody against the endogenous protein (Cyan). Rhabdomeres are outlined using phalloidin which marks F-actin (Red). A single ommatidium is shown. Scale bar: 2 µm. (B and C) Violin plots with mean ± SD are shown. Statistical tests: One-way ANOVA with post hoc Tukey’s multiple pairwise comparison. ns - Not significant; ****P value <0.0001.
Mislocalization of RDGB and onset of retinal degeneration in dEsyt CaBM result from the loss of contact sites. (A) TEM images of a single photoreceptor from flies (i) Exposed to constant illumination for 6 days (ii) Aged for 6 days in dark Genotypes: Rh1>, Rh1>dEsyt::GFP and Rh1>dEsytCaBM::GFP as indicated on the left. (Ai-ii) Scale bar: 200 µm. (Aiii-vi) Scale bar: 500 µm. (B) Quantification of the number of MCS per photoreceptor of flies of the indicated genotypes reared in constant illumination for 6 days. X-axis indicates the genotype and Y-axis indicates the number of MCS/photoreceptor. n = 25 photoreceptors from three separate flies (R1–R6) (N = 3; n = 25]. (C) Quantification of the number of MCS per photoreceptor of flies of the indicated genotypes reared in constant dark for 6 days. X-axis indicates the genotype and Y-axis indicates the number of MCS/photoreceptors. n = 25 photoreceptors from three separate flies (R1–R6) (N = 3; n = 25). (D) Confocal images showing the localization of RDGB in Rh1>, Rh1>dEsyt::GFP and Rh1>dEsytCaBM::GFP photoreceptors of 6-day-old constant dark-reared flies. RDGB visualized is detected using an antibody against the endogenous protein (Cyan). Rhabdomeres are outlined using phalloidin which marks F-actin (Red). A single ommatidium is shown. Scale bar: 2 µm. (B and C) Violin plots with mean ± SD are shown. Statistical tests: One-way ANOVA with post hoc Tukey’s multiple pairwise comparison. ns - Not significant; ****P value <0.0001.
dEsytCaBM can partially rescue the phenotypes of dEsytKO
We reconstituted dEsytCaBM::GFP in photoreceptors of dEsytKO, a protein null allele (Nath et al., 2020). As a test of function, we monitored the retinal degeneration phenotype of dEsytKO. When grown in illumination, dEsytKO photoreceptors underwent light-dependent retinal degeneration starting at day-8 after eclosion; reconstitution with dEsyt::GFP (Rh1> dEsyt::GFP; dEsytKO) was able to fully rescue this phenotype (Fig. 5, A and B). By contrast, reconstitution with dEsytCaBM::GFP (Rh1> dEsytCaBM::GFP; dEsytKO) was not able to rescue the retinal degeneration phenotype of dEsytKO although it modestly delayed the onset of degeneration from 8 days after eclosion in dEsytKO to 12 days in Rh1> dEsytCaBM::GFP; dEsytKO (Fig. 5, A and B). On day 1 after eclosion, RDGB was exclusively localized to the MCS in both Rh1> dEsyt::GFP; dEsytKO and Rh1> dEsytCaBM::GFP; dEsytKO, similar to the dEsytKO photoreceptors (Fig. 5 C i). Consistent with the observation of a delay in the onset of retinal degeneration, when exposed to constant illumination for just 6 days after eclosion, the localization of RDGB was rescued in Rh1>dEsyt::GFP; dEsytKO and Rh1>dEsytCaBM::GFP; dEsytKO (Fig. 5 C ii) by which point RDGB was mislocalized in dEsytKO and dEsytCaBM photoreceptors. In contrast, deletion of the SMP domain (dEsytΔSMP) (Fig. S4, A and B), the lipid binding module of the protein, did not affect the localization of the protein to the ER–PM MCS (Fig. S4 C), and dEsytΔSMP was able to rescue the retinal degeneration phenotype of dEsytKO (Fig. S4, D and E).

Partial rescue of dEsyt KO phenotypes by dEsyt CaBM . (A) Representative optical neutralization (ON) images showing the rhabdomere structure of the indicated genotypes. Rearing conditions and the age of the flies are indicated on top. (*CL–Constant Light). Scale bar: 20 pixels (corresponds to ∼5 µm). (B) Quantification of the time course taken for retinal degeneration. 50 ommatidia were scored from five flies of each genotype and plotted. (N = 5; n = 50). (C) Confocal images showing the localization of RDGB in Rh1>; dEsytKO, Rh1>dEsyt::GFP; dEsytKO and Rh1>dEsytCaBM::GFP; dEsytKO photoreceptors of flies which are(i) 1-day-old dark reared (ii) 6-day-old- exposed to constant illumination (5,000 Lux). For (i) and (ii), RDGB visualized is detected using an antibody against the endogenous protein (Cyan). Rhabdomeres are outlined using phalloidin which marks F-actin (Red). A single ommatidium is shown. Scale bar: 2 µm.
Partial rescue of dEsyt KO phenotypes by dEsyt CaBM . (A) Representative optical neutralization (ON) images showing the rhabdomere structure of the indicated genotypes. Rearing conditions and the age of the flies are indicated on top. (*CL–Constant Light). Scale bar: 20 pixels (corresponds to ∼5 µm). (B) Quantification of the time course taken for retinal degeneration. 50 ommatidia were scored from five flies of each genotype and plotted. (N = 5; n = 50). (C) Confocal images showing the localization of RDGB in Rh1>; dEsytKO, Rh1>dEsyt::GFP; dEsytKO and Rh1>dEsytCaBM::GFP; dEsytKO photoreceptors of flies which are(i) 1-day-old dark reared (ii) 6-day-old- exposed to constant illumination (5,000 Lux). For (i) and (ii), RDGB visualized is detected using an antibody against the endogenous protein (Cyan). Rhabdomeres are outlined using phalloidin which marks F-actin (Red). A single ommatidium is shown. Scale bar: 2 µm.
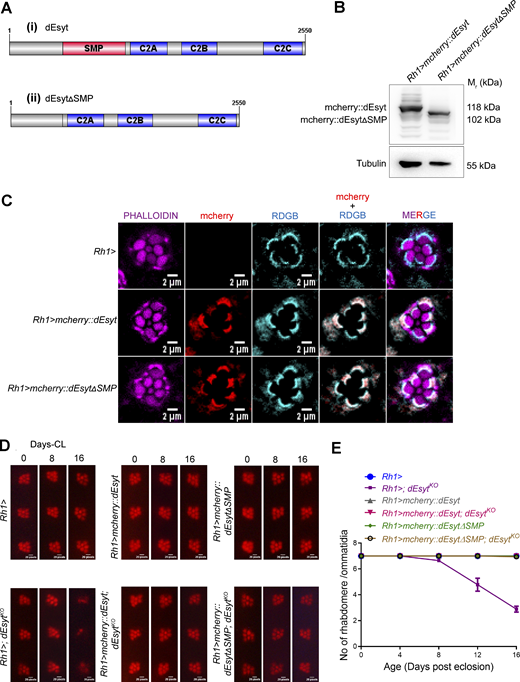
SMP domain is dispensable for supporting dEsyt function at the ER-PM interface. (A) Schematic of (i) dEsyt- wild type (ii) dEsyt∆SMP mutant protein structure showing the distribution of conserved domains spread through the length of the protein (Image generated using IBS, Illustrator for Biological sciences Version 1.0 software http://ibs.biocuckoo.org/) (Liu et al., 2015). (B) Western blot from head extracts of the genotypes as indicated on the top of the blot. The blot was probed with antibody against mcherry. Tubulin was used as the loading control. (Mr: Molecular weight). (C) Confocal images showing the localization of exogenously expressed mcherry::dEsyt and mcherry::dEsytΔSMP driven using eye-specific Rh1-Gal4 in 1-day-old dark reared flies. Rh1-Gal4 is shown as a control. Transverse sections of an individual ommatidium are shown. Phalloidin marks F-actin staining and highlights rhabdomeres R1–R7 (Magenta), red indicates the localization of exogenously expressed dEsyt and dEsytΔSMP protein tagged to mcherry, cyan represents RDGB localization at the base of the rhabdomere (marker for SMC). Scale bar: 2 µm. (D) Representative optical neutralization (ON) images showing rhabdomere integrity of the indicated genotypes. Rearing conditions and the age of the flies are indicated on top. (*CL–constant light). Scale bar: 20 pixels (corresponds to ∼5 µm). (E) Quantification of the time course of retinal degeneration. 10 ommatidia from 5 separate flies of each genotype were scored and plotted. Y-axis is the number of intact rhabdomeres/ommatidium. The maximum value possible is 7. X-axis is the age of the flies after eclosion. (N = 5; n = 50). Source data are available for this figure: SourceData FS4.
SMP domain is dispensable for supporting dEsyt function at the ER-PM interface. (A) Schematic of (i) dEsyt- wild type (ii) dEsyt∆SMP mutant protein structure showing the distribution of conserved domains spread through the length of the protein (Image generated using IBS, Illustrator for Biological sciences Version 1.0 software http://ibs.biocuckoo.org/) (Liu et al., 2015). (B) Western blot from head extracts of the genotypes as indicated on the top of the blot. The blot was probed with antibody against mcherry. Tubulin was used as the loading control. (Mr: Molecular weight). (C) Confocal images showing the localization of exogenously expressed mcherry::dEsyt and mcherry::dEsytΔSMP driven using eye-specific Rh1-Gal4 in 1-day-old dark reared flies. Rh1-Gal4 is shown as a control. Transverse sections of an individual ommatidium are shown. Phalloidin marks F-actin staining and highlights rhabdomeres R1–R7 (Magenta), red indicates the localization of exogenously expressed dEsyt and dEsytΔSMP protein tagged to mcherry, cyan represents RDGB localization at the base of the rhabdomere (marker for SMC). Scale bar: 2 µm. (D) Representative optical neutralization (ON) images showing rhabdomere integrity of the indicated genotypes. Rearing conditions and the age of the flies are indicated on top. (*CL–constant light). Scale bar: 20 pixels (corresponds to ∼5 µm). (E) Quantification of the time course of retinal degeneration. 10 ommatidia from 5 separate flies of each genotype were scored and plotted. Y-axis is the number of intact rhabdomeres/ommatidium. The maximum value possible is 7. X-axis is the age of the flies after eclosion. (N = 5; n = 50). Source data are available for this figure: SourceData FS4.
We examined the MCS density in dEsytKO photoreceptors reconstituted with dEsyt::GFP and dEsytCaBM::GFP. Compared with dEsytKO (Fig. 6, A i–ii and D), for R1–R6 photoreceptors, MCS density was marginally higher in Rh1>dEsyt::GFP; dEsytKO (Fig. 6, B i–ii and D) and Rh1>dEsytCaBM::GFP; dEsytKO (Fig. 6, C i–ii and D) at eclosion, indicating that altering the calcium-binding residues in dEsyt does not affect the formation of ER–PM contact sites during the Drosophila photoreceptor development. We then measured MCS density in Rh1>dEsytCaBM::GFP; dEsytKO as a function of age. While ER–PM MCS was nearly non-existent on day 14 in dEsytKO (Nath et al., 2020) (Fig. 6, A iii, iv and E), Rh1>dEsyt::GFP; dEsytKO showed complete phenotypic rescue, and the number of MCS was comparable to day 1 (Fig. 6, B i–iv, D, and E). As a function of age, from day 1 to 14, the MCS density was reduced by 20% in Rh1>dEsytCaBM::GFP; dEsytKO (Fig. 6, C iii, iv, D, and E). Thus, the calcium-binding mutant of the protein was able to partially rescue the contact site integrity of dEsytKO on day 14 (Fig. 6 E).

Partial rescue of dEsyt KO phenotypes by dEsyt CaBM . TEM images of a single ommatidium from photoreceptors of flies reared in dark (* - R7 photoreceptor). (A) (i) dEsytKO- day 1 (iii) dEsytKO - day 14. (B) (i) Rh1>dEsyt::GFP; dEsytKO - day 1 (iii) Rh1>dEsyt::GFP; dEsytKO - day 14. (C) (i) Rh1>dEsytCaBM::GFP; dEsytKO - day 1. (iii) Rh1>dEsytCaBM::GFP; dEsytKO - day 14. (Ai, iii, Biii, and Ci, iii) Scale bar: 1 µm; (Bi) Scale bar: 2 µm. (A-ii, iv, B-ii, iv, and C-ii, iv) Magnified image showing a single photoreceptor from the ommatidium image shown on the left. (Bii) Scale bar: 200 nm; (Aii, iv, Biv, and Cii, iv) Scale bar: 500 nm. (D) Quantification of the number of MCS per photoreceptor of day-1-old dark-reared flies, X-axis indicates the genotype and Y-axis indicates the number of MCS/photoreceptor, n = 25 photoreceptors from three separate flies (R1–R6). [N = 3; n = 25]. (E) Quantification of the number of MCS per photoreceptor of flies reared in 14 Day CD (Constant Dark), X-axis indicates the genotype and age of the flies and Y-axis indicates the number of MCS/photoreceptor, n = 25 photoreceptors from three separate flies (R1–R6). [N = 3; n = 25]. (D and E) Violin plots with mean ± SD are shown. Statistical tests: One-way ANOVA with post hoc Tukey’s multiple pairwise comparison. **P value <0.01; ***P value <0.001; ****P value <0.0001.
Partial rescue of dEsyt KO phenotypes by dEsyt CaBM . TEM images of a single ommatidium from photoreceptors of flies reared in dark (* - R7 photoreceptor). (A) (i) dEsytKO- day 1 (iii) dEsytKO - day 14. (B) (i) Rh1>dEsyt::GFP; dEsytKO - day 1 (iii) Rh1>dEsyt::GFP; dEsytKO - day 14. (C) (i) Rh1>dEsytCaBM::GFP; dEsytKO - day 1. (iii) Rh1>dEsytCaBM::GFP; dEsytKO - day 14. (Ai, iii, Biii, and Ci, iii) Scale bar: 1 µm; (Bi) Scale bar: 2 µm. (A-ii, iv, B-ii, iv, and C-ii, iv) Magnified image showing a single photoreceptor from the ommatidium image shown on the left. (Bii) Scale bar: 200 nm; (Aii, iv, Biv, and Cii, iv) Scale bar: 500 nm. (D) Quantification of the number of MCS per photoreceptor of day-1-old dark-reared flies, X-axis indicates the genotype and Y-axis indicates the number of MCS/photoreceptor, n = 25 photoreceptors from three separate flies (R1–R6). [N = 3; n = 25]. (E) Quantification of the number of MCS per photoreceptor of flies reared in 14 Day CD (Constant Dark), X-axis indicates the genotype and age of the flies and Y-axis indicates the number of MCS/photoreceptor, n = 25 photoreceptors from three separate flies (R1–R6). [N = 3; n = 25]. (D and E) Violin plots with mean ± SD are shown. Statistical tests: One-way ANOVA with post hoc Tukey’s multiple pairwise comparison. **P value <0.01; ***P value <0.001; ****P value <0.0001.
Discussion
Since ER–PM junctions are located within nanoscale distances of the PM, proteins localized to this site are ideally positioned to detect Ca2+ influx across the PM, and this information can then be used to mediate subcellular responses and tune cellular physiology. For example, during sensory transduction such as that which occurs in photoreceptors, detection of Ca2+ influx, the final outcome of phototransduction at ER-PM MCS can be used to tune ongoing signaling. In Drosophila photoreceptors, sensory transduction depends on MCS function. In this scenario, proteins localized to ER–PM MCS that can bind Ca2+ may be essential to couple sensory transduction with MCS density. Previous studies have shown that in mammalian cells, Esyts that are localized to ER-PM MCS can bind to Ca2+ and that the function of the molecule can be regulated by Ca2+ binding (Bian et al., 2018; Giordano et al., 2013; Idevall-Hagren et al., 2015; Xu et al., 2014; Yu et al., 2016). However, the relevance of such Ca2+ binding to the regulation of physiology in vivo was unknown. In this study, we found that the reported modulation of ER-PM MCS by light and age (Nath et al., 2020) in Drosophila photoreceptors depends on Ca2+ influx through TRP channels. PLC activity is required for TRP channel activation in photoreceptors (Raghu et al., 2012). It has previously been reported that intact PLC function is required for the modulation of MCS density in Drosophila photoreceptors (Nath et al., 2020). Taken together, the observation that both PLC activity and TRP channel function are required for MCS density modulation underscores the role of phototransduction-mediated PM Ca2+ influx in regulating MCS density in vivo. These findings may be an example of the modulation of MCS density by ongoing changes in the environment (in this case light). Thus, our study presents evidence, in an in vivo signal transduction system, for the modulation of MCS density by ongoing changes in extracellular signals.
How might Ca2+ influx, the output of sensory transduction, be transduced into modulation of MCS density? In principle, this requires a protein that is localized to the MCS to be able to bind Ca2+ and for its activity to be transduced into modulation of MCS density. In photoreceptors, dEsyt is one such protein localized to ER–PM MCS (Nath et al., 2020), and overexpression of dEsyt in wild type photoreceptors is able to increase MCS density and reduce ER–PM distance at the MCS (this study Fig. 4). How might dEsyt transduce ongoing transduction into altered MCS density? Our in silico analysis of evolutionarily conserved residues in the C2A domain of dEsyt implicated in Ca2+ binding shows that when these residues are mutated, the non-Ca2+ binding version of dEsyt so generated (dEsytCaBM) shows reduced function with respect to MCS modulation. Overexpression of dEsytCaBM led to no changes in ER–PM MCS density and ER-PM distance compared with equivalent overexpression of wild type dEsyt (Fig. 4, E and F). These findings imply that Ca2+ binding to dEsyt is required for the ability of the overexpressed protein to modulate MCS function. It has previously been demonstrated that endogenous dEsyt is required to maintain MCS density in photoreceptors (Nath et al., 2020). Is the Ca2+ binding activity of endogenous dEsyt required for this function? We found that reconstitution of dEsytKO with wild type dEsyt was able to restore the reduced MCS density and suppress retinal degeneration but dEsytCaBM was less effective in doing so. This finding underscores the importance of Ca2+ binding to dEsyt for mediating its ability to modulate MCS density in vivo. By contrast, we found that deletion of the SMP domain, implicated in lipid transfer, was dispensable for dEsyt function in vivo.
The ability of Esyt to sense Ca2+ influx across the PM and modulate MCS density should require the protein to be positioned accurately at ER-PM MCS. Previous studies have described motifs required to correctly position Esyt at the ER–PM contact site, such as an N-terminal ER membrane-associated region and the calcium-induced C2 domain-dependent interaction with phosphatidylinositol 4,5-bisphosphate (PIP2) to bind the PM (Chang et al., 2013; Giordano et al., 2013). In this study, we found that mutating the calcium-binding residues (dEsytCaBM) repositioned dEsyt away from its normal location at ER-PM MCS to the rhabdomeral PM, and this was associated with its inability to function normally. Likewise blocking Ca2+ influx into photoreceptors using the norpAP24 mutants also resulted in the mislocalization of dEsyt indicating the importance of Ca2+ binding in localization. Interestingly, expression of dEsytCaBM in wild type photoreceptors exerts a dominant negative effect on wild type dEsyt. One possible mechanism for the phenotypes exhibited by dEsytCaBM expression in wild type cells is suggested by the findings of a structural and mass spectrometry investigation of hEsyt2, which reveals that the SMP domain dimerizes to create a 90-Å long cylinder to facilitate the transfer of lipids (Schauder et al., 2014). Other mechanisms may also operate but this remains to be understood. Consistent with our observations, in a previous study, in the dEsytD-N flies, which lack the negatively charged amino acids in each C2 domain necessary for Ca2+ binding, protein expression was restricted to the cell body rather than the presynaptic terminals and resulted in larval lethality (Kikuma et al., 2017).
It is still unclear whether the three C2 domains have different binding affinities for calcium as previously reported for a mammalian Esyt (Bian et al., 2018) and what their response would be to the high Ca2+ concentrations experienced by the region of the ER–PM MCS in Drosophila photoreceptors. Interestingly, a multiple C2 domain protein, Otoferlin, is expressed in the sensory hair cells of the mammalian inner ear. Mutations in otoferlin lead to sensorineural deafness DFNB9 in humans (Yasunaga et al., 1999), and it has been proposed that at the inner hair cell synapse, otoferlin couples Ca2+ influx through L-type Cav1.3 channels to synaptic vesicle protein function thus regulating exocytosis (Hams et al., 2017). A similar function has also been proposed for the C2 domains of synaptotagmin. Thus, our findings in relation to Ca2+ binding by dEsyt at the ER–PM MCS may be an example of how the detection of local changes in Ca2+ concentration by C2 domains may allow the protein to modulate MCS function locally. Further studies will be required to understand how Ca2+ bound dEsyt signals to modulate MCS density in photoreceptors. Nonetheless, this study demonstrates the role of Ca2+ binding to dEsyt in its ability to modulate MCS number and distance in the context of an in vivo signaling system.
Materials and methods
Fly stocks
In a constant temperature laboratory incubator, flies (Drosophila melanogaster) were reared on rich medium (corn flour, black jaggery, agar, dry yeast, propionic acid, methyl parahydroxy benzoate, and orthophosphoric acid) at 25°C and 50% relative humidity. The following lines were obtained from Bloomington stock center: Red Oregon R (ROR)- Wild type (BDSC-2376), UAS-mcherry::dEsyt (BDSC-77130), trpl302 and trp343 were a kind gift from C.S Zuker (Niemeyer et al., 1996; Scott et al., 1997). Additionally, the following transgenic lines were used: UAS-dEsyt::GFP, UAS-dEsytCaBM::GFP and UAS-mcherry::dEsyt∆SMP. Transgenic lines were generated using phiC31 integrase-mediated transgenesis in either attP40 (BDSC-25709) or attP2 (BDSC-25710) flies (Trivedi et al., 2020). The chromosome for transgenesis was chosen based on the chromosomal location of the gene. We tried not to use the same chromosome for the transgene where the gene is located. dEsytKO mutant was generated using CRISPR–Cas9–mediated deletion as described in Nath et al. (2020). All the experimental aspects of the project including animal care and use hold Institutional Biosafety Committee (IBSC) approval.
Except for the few pulses of light that the flies were exposed to when the incubator doors were opened, the environment inside the incubator was completely dark. The experiments were conducted under two different lighting conditions: constant illumination and constant darkness. Incubators were kept at 25°C with a white light source (light intensity: 5,000 lux) throughout the duration of the experiments involving continuous illumination. The experiments were structured to incorporate Drosophila of both sexes, ensuring the study considered potential sex-based variation and eliminated sex bias. The Gal4–UAS system was used for the selective activation of the transgene spatially and temporally for targeted gene expression.
Sequence alignment
The C2 domains of dEsyt (CG6643), human synaptotagmin (EAW97344.1), human extended-synaptotagmin 1 (NP_001171725.1) and human extended-synaptotagmin 2 (NP_065779.1) were aligned using Clustal Omega (RRID:SCR_001591). The conservation scores on the alignment were mapped using Jalview (RRID:SCR_006459).
Model of C2A domain of dEsyt protein
A three-dimensional structural model of the C2A domain of dEsyt protein was obtained using the homology modeling method with an X-ray crystal structure of the human Esyt2 C2A domain (PDB ID: 4npk) as a template. 20 models were obtained using MODELLER (RRID:SCR_008395). The model with the least energy was selected for further analysis. The residues in the dEsyt C2A domain that interact with calcium were analyzed using PyMOL (RRID:SCR_000305). MIB, the metal ion binding site prediction tool was used to check the affinity and metal ion coordination for calcium ions with the dEsyt C2A domain.
The homology model of the C2A domain obtained was compared with the structure of the C2A domain of dEsyt (AF-Q7KS16-F1-v4) available in the AlphaFold Protein Structure Database (RRID:SCR_023662). The RMSD between the two C2A domain structures and the residues involved in Ca2+ coordination was calculated using the PyMOL structural superposition module. The superposition has been represented using a graphical representation in PyMOL.
Molecular biology
Generation of dEsytCaBM construct
The coding sequence (CDS) of the dEsyt-RB transcript was amplified from Drosophila head-specific cDNA using gene-specific primers. This coding region was subcloned into pUAST-attB::GFP (RRID:Addgene_85621) by using restriction enzymes NotI (NEB- R3189S) and EcoRI (NEB- R3101S) to generate UAS-dEsyt::GFP. For generating dEsytCaBM::GFP transgene, mutations were introduced in the dEsyt cDNA corresponding to amino acid numbers identified to bind calcium: 364, 374, 421, 423, 429, 517, 564, 746 and 752 using site-directed mutagenesis (SDM). The aspartate residues were mutated to asparagine and glutamate residue to glutamic acid to abolish the calcium-binding activity of the protein. By incorporating the necessary mutations in the chosen primers, polymerase chain reaction (PCR)-based SDM was carried out to get point mutants in the full-length protein constructs. For the first 10 cycles of the PCR, only the forward or reverse primers incorporating the mutations were used. Following this, for the final 15 cycles, the two reactions were mixed to complete the 25-cycle reaction. The PCR product was DpnI-digested to remove the parent vector. 10 μl of this DpnI digested product was directly transformed. The following day, colonies from the transformed plate were inoculated into LB media and maintained overnight at 37°C in a shaking incubator. Plasmid isolation was done using the Qiagen Miniprep Kit and given for Sanger sequencing to confirm the presence of the mutation. The primers used for SDM include the following:
D364N - 5′-ATCTGATGAAGAAGAACATCAGTGTGCTG-3′
D374N - 5′-CAAAGGCAAGTCGAATCCCTATGC-3′
D421N-D423N - 5′-GATTCAATTGAAGAACTCGAACGATTCCAAG-3′
D517N - 5′-GCTCCAAACCCAATCCCTATCTGG-3′
D564N - 5′-CATCAAGATCTACAACCAGAAGACAGG-3′
D746N - 5′-GATACCACTTCGCAATCCCAGCAATATC-3′
D752N - 5′-CAGCAATATCCCCAATCCGTATGTTAAG-3′
E429Q - 5′-CCAAGAAAGACCAGAACCTGGGCAG-3′.
Generation of dEsyt∆SMP construct
The SMP domain, a 540-base pair fragment in the dEsyt cDNA that extends from 460 to 999 base pairs, encodes a polypeptide of 18 kDa and is located halfway through the length of the protein. The gene regions flanking the dEsyt SMP domain were amplified as two fragments (F1-530 bp; F2-1,594 bp) from dEsyt cDNA extracted from Drosophila heads using gene-specific primers. Subsequently, the fragments were cloned into the Drosophila expression vector pUASt-attB (RRID:DGRC_1419) and tagged to mcherry using two-way Gibson assembly and sequence-verified. The Gibson primers used for dEsyt fragment amplification include the following:
F1 Gibson forward primer: 5′-CCTAGATCTGCGGCCGCGGCTCGAGGGCGGCTCCGGCGGCGGCTCCGGAGGCGGAAGCGGCATGAGCGATAACAGTCCATC-3′
F1 Gibson reverse primer: 5′-AAACCTCTTCGGGAAAGTAGACCCACGC-3′
F2 Gibson forward primer: 5′-CTACTTTCCCGAAGAGGTTTCGGCGGTG-3′
F2 Gibson reverse primer: 5′-GGTTCCTTCACAAAGATCCTCTAGATGAAGGCTCGTGCCGTATTTCAGG-3′.
Western blot
Protein extracts were prepared from Drosophila heads. Age-matched flies were decapitated and the samples were homogenized in 2X Laemmle sample buffer followed by boiling at 95°C for 5 min. Protein extracts were separated using SDS-PAGE and transferred onto a nitrocellulose filter membrane (Hybond-C Extra; [GE Healthcare]) using a wet transfer apparatus (BioRad). The membrane was blocked using 5% Blotto (sc-2325, Santa Cruz Biotechnology) in phosphate buffer saline (PBS) with 0.1% Tween 20 (Sigma-Aldrich) (PBST) for 2 h at room temperature (RT). Primary antibody incubation was done overnight at 4°C using appropriate antibody dilutions: anti-dEsyt (kind gift from Dr. Dion Dickman’s lab), 1:2,000; anti-GFP (Cat# sc-9996; Santa Cruz Biotechnology, RRID:AB_627695), 1:2,000; anti-mcherry (Cat# PA5-34974; Thermo Fisher Scientific, RRID:AB_2552323), 1:1,000; anti-norpA (kind gift from Dr. Armin Huber’s lab), 1:1,000, and anti-α-tubulin-E7c (Cat# E7; DSHB, RRID:AB_528499), 1:4,000. Following this, the membrane was washed in PBST and incubated with 1:10,000 dilutions of appropriate secondary antibody (Jackson ImmunoResearch Laboratories) coupled to horseradish peroxidase at RT for 2 h. Three PBST washes were given and the blots were developed with ECL (GE Healthcare) and imaged using LAS 4000 ImageQuant (RRID:SCR_014246) (GE Healthcare).
Optical neutralization
Age-matched flies reared under specified experimental conditions were immobilized by cooling on ice, carefully decapitated, and fixed on the microscope slide using a drop of colorless nail varnish. A drop of immersion oil was used to neutralize the cornea’s refractive index, which was then viewed with a 40×, 1.3 NA oil immersion objective of Olympus BX53 Upright Microscope (RRID:SCR_022568). Olympus cellSens Software (RRID:SCR_014551) was used for digital image acquisition and documentation.
Scoring retinal degeneration
A total of 50 ommatidia from 5 distinct flies of each genotype were analyzed for each time point to produce a quantitative indicator of degeneration. The single, central UV-sensitive photoreceptor that didn’t show any light-dependent retinal degeneration was used as the reference and the rest of the photoreceptors were scored. Each rhabdomere that appeared to be wild type received a score of 1. As a result, the control photoreceptors will receive a score of 7, whereas the mutant photoreceptors that are degenerating will receive a score ranging from 1 to 7. All collected samples were included in the analysis as no exclusion criteria was applied. GraphPad Prism (RRID:SCR_002798) was used to analyze the data and plot the graph.
Immunohistochemistry
Retinae were dissected in PBS and fixed for 30 min at room temperature with 4% paraformaldehyde in PBS with 1 mg/ml saponin. After fixation, the samples were rinsed thrice in PBS with 0.3% Triton X-100 (0.3% PBTX) and then incubated for 2 h at room temperature with blocking solution (5% Fetal Bovine solution in PBTX). The samples were incubated overnight with the appropriate primary antibody (rat anti-RDGB [lab generated]; 1:300, mouse anti-GFP [Cat# sc-9996; Santa Cruz Biotechnology, RRID:AB_627695]; 1:300, rabbit anti-dEsyt [kind gift from Dr. Dion Dickman’s lab]; and 1:200; rabbit anti-mCherry [Cat# PA5-34974; Thermo Fisher Scientific, RRID:AB_2552323]; 1:300) at 4°C. The samples were washed three times with 0.3% PBTX and incubated for 4 h at room temperature with appropriate secondary antibodies (Donkey anti-Rabbit IgG [H+L] Highly Cross-Adsorbed Secondary Antibody, Alexa Fluor 568 [Cat# A10042; Thermo Fisher Scientific, RRID:AB_2534017]; 1:300, Goat anti-Rat IgG [H+L] Cross-Adsorbed Secondary Antibody, Alexa Fluor 633 [Cat# A-21094; Thermo Fisher Scientific, RRID:AB_2535749]; and 1:300, Goat anti-Mouse IgG [H+L] Cross-Adsorbed Secondary Antibody, Alexa Fluor 488 [Cat# A-11001; Thermo Fisher Scientific, RRID:AB_2534069]). Along with the secondary antibody incubation, Alexa Fluor 488–Phalloidin (A12379; Invitrogen; 1:200) and Alexa Fluor 568–Phalloidin (A12380; Invitrogen; 1:200) were used to mark F-actin. Samples were washed thrice with 0.3% PBTX, followed by one final wash in PBS and then mounted with 70% glycerol in 1X PBS. The whole-mounted preparations were imaged under 60× 1.4 NA objective, Olympus Confocal Laser Scanning Microscope Fluoview FV3000 (RRID:SCR_017015).
Transmission electron microscopy
10–15 fly heads of age-matched flies of the mentioned genotypes were cut and immersed in 2% osmium tetroxide and kept at 4°C for 1 h followed by incubation at 40°C for 4 days. Specimens were washed with distilled water and stained enbloc with uranyl acetate (0.5% in distilled water) for 3 h. After washing with distilled water, specimens were subjected to the dehydration and infiltration steps and embedded in epon. Block faces for the experiment were randomly selected for further processing from the 10–15 prepared block faces to eliminate any potential personal bias in the selection process. Ultrathin sections of 60 nm were cut and grids were subjected to post-staining with 2% uranyl acetate (in 70% ethanol) and Reynold’s lead solution. Sections were imaged at 120 KV on a FEI Tecnai T12 electron microscope (RRID:SCR_022981) and at 200 KV on a FEI Talos F200S G2 TEM and STEM (RRID:SCR_019906).
Scoring MCS density and contact site distance
For scoring MCS density/photoreceptor cells, a total of 25–30 cells were taken to conduct an analysis for R1–R6. Using the free hand line tool of ImageJ (RRID:SCR_003070), the length of MCS (µm)/the total length of the base of the rhabdomere (µm) was calculated. Fractions of MCS coverage were multiplied by 100 to show the percentage. For contact site distance, using the straight line tool of ImageJ, the distance between the base of rhadbomere to ER was manually analyzed and quantified. All collected samples were included in the analysis as no exclusion criteria was applied. Graphs were plotted using GraphPad Prism (RRID:SCR_002798) software.
Cell culture, transfection and immunofluorescence
Schneider’s insect medium (HiMedia) was used to culture S2R+ cells (RRID:CVCL_Z831), which was supplemented with 10% fetal bovine serum and antibiotics penicillin and streptomycin. Effectene (Qiagen) was used to transfect cells according to the manufacturer’s instructions. After 24 h of transfection, cells were fixed with 4% paraformaldehyde (Electron Microscopy Sciences) and imaged to observe for GFP fluorescence using a 60× 1.4 NA objective in Olympus Confocal Laser Scanning Microscope Fluoview FV3000 (RRID:SCR_017015).
Statistical analysis
Each experiment was performed unblinded on different biological groups with multiple biological replicates. No statistical analysis was done a priori to determine the sample sizes. A parametric unpaired t-test was chosen for the analysis because the data consisted of independent groups with continuous measurements and met the assumption of normality. Normality was assessed using the Shapiro–Wilk test (P > 0.05), and homogeneity of variances was verified using Levene’s test (P > 0.05). These conditions fulfilled the assumptions required for a parametric test, making the unpaired t test an appropriate choice for the analysis. One-way ANOVA with post hoc Tukey’s pairwise comparison was used whenever the experiment consisted of more than two biological groups. All statistical calculations were made using GraphPad Prism (RRID:SCR_002798).
Online supplemental material
Fig. S1 depicts the structural resemblance between the dEsyt C2A structure predicted using homology modeling and that generated by AlphaFold. Fig. S2 provides additional data indicating that the localization of dEsyt to the ER–PM contact sites requires calcium binding to dEsyt. Fig. S3 illustrates that the mislocalization of RDGB and the onset of retinal degeneration in dEsytCaBM result from the loss of contact sites. Fig. S4 illustrates data demonstrating that the SMP domain is dispensable for supporting dEsyt function at the ER–PM interface in Drosophila photoreceptors.
Data availability
No data were deposited in any public database. The data supporting the conclusions are available in the manuscript itself and its supplementary materials.
Acknowledgments
We acknowledge the Bloomington Drosophila Stock Center (BDSC) for fly stocks. We thank the NCBS Imaging Facility, Electron microscopy, and Drosophila facilities for their support. We thank Dr. C.S Zuker (University of California, San Diego, CA, USA), Dr. Dion Dickman (University of Southern California, Los Angeles, CA, USA) and Dr. Armin Huber (University of Hohenheim, Stuttgart, Germany) for sharing valuable reagents.
This work was supported by the Department of Atomic Energy, Government of India under Project Identification No. RTI 4006, a Wellcome-DBT India Alliance Senior Fellowship to P. Raghu (IA/S/14/2/501540) and a Wellcome-DBT India Alliance Early Career Fellowship to S. Mishra (IA/E/17/1/503653). V.R. Nath was supported by a fellowship from the Indian Council for Medical Research (2021-9971/CMB-BMS).
Author contributions: V.R. Nath: Data curation, Formal analysis, Funding acquisition, Investigation, Methodology, Validation, Visualization, Writing - original draft, Writing - review & editing, H. Krishnan: Data curation, Formal analysis, Investigation, Visualization, Writing - original draft, Writing - review & editing, S. Mishra: Formal analysis, Funding acquisition, Investigation, Writing - review & editing, P. Raghu: Conceptualization, Funding acquisition, Project administration, Supervision, Writing - original draft, Writing - review & editing.

