


Tip-growing cells of, amongst others, plants and fungi secrete wall materials in a highly polarized fashion for fast and efficient colonization of the environment. A polarized microtubule cytoskeleton, in which most microtubule ends are directed toward the growing apex, has been implicated in directing growth. Its organizing principles, in particular regarding maintenance of network unipolarity, have remained elusive. We show that a kinesin-4 protein, hitherto best known for a role in cytokinesis, suppresses encounters between antiparallel microtubules. Without this activity, microtubules hyper-aligned along the growth axis and increasingly grew away from the apex. Cells themselves displayed an overly straight growth path and a delayed gravitropic response. This result revealed conflicting systemic needs for a stable growth direction and an ability to change course in response to extracellular cues. Thus, the use of selective inhibition of microtubule growth at antiparallel overlaps constitutes a new organizing principle within a unipolar microtubule array.
Introduction
Polarized cell expansion is a broadly occurring phenomenon among eukaryotic cell systems ranging from neurites and hyphae to pollen tubes. On the cellular level, expansion is realized by targeting the secretory pathway to a defined growth zone. The major machinery that establishes and maintains the growth zone generally includes a dynamic actin network (reviewed in Ketelaar, 2013) and Rho-related GTPase-integrated signaling (reviewed in Cole and Fowler, 2006; Takeda et al., 2008; Kost, 2008; Lee and Yang, 2008). A common feature is that this growth machinery needs to remain focused at the cellular apex to maintain a persistent growth direction. Across a wide variety of cell systems, previous works report a polarized microtubule array that lies parallel to the growth axis (Bamburg et al., 1986; Drummond and Cross, 2000; Timmers et al., 2007; Doonan et al., 1988; Ambrose and Wasteneys, 2014; Hiwatashi et al., 2014). Intriguingly, such microtubule arrays have been broadly implicated in providing internal shape feedback to maintain directionally persistent growth (Baas and Lin, 2011; Chang and Martin, 2009; Sieberer et al., 2005). The key architectural features of microtubule networks to provide this function appear to be alignment with the cell axis and polarization of microtubule plus ends toward the growth site (Minc et al., 2009; Hiwatashi et al., 2014). For example, in fission yeast as well as filamentous fungi, localized interactions of microtubule plus ends with the plasma membrane were shown to generate cues for cell expansion (Ishitsuka et al., 2015; Terenna et al., 2008; Tay et al., 2018). Polarized microtubule arrays in plants are implicated in directing tip growth, a mode of polarized cell expansion (Doonan et al., 1988; Bibikova et al., 1999; Sieberer et al., 2005). A well-suited cell type to study plant tip growth is moss protonema. In moss protonema, microtubule plus ends coalesce into an apical focus that provides a signal to the cell expansion machinery (Hiwatashi et al., 2014; Wu and Bezanilla, 2018; Yamada and Goshima, 2018). Since the microtubules in these cells have a purely acentrosomal origin, it is unclear how their polymerization direction is determined to generate the required unipolar network guiding the cell growth machinery.
The acentrosomal character of microtubule networks in plants implies that polarity arises from a set of microtubule interactions. Microtubule–microtubule interactions are facilitated by diverse microtubule-associated proteins (MAPs), including bundling proteins and motor proteins that act between pairs of neighboring microtubules. Interestingly, the action of several MAPs has been shown to be context dependent, e.g., different for parallel and antiparallel encounters of microtubules (Duellberg et al., 2013; de Keijzer et al., 2014). Such context-dependent MAPs have the potential to recruit microtubule regulatory machinery differentially to microtubule contact sites. A well-studied and evolutionary conserved protein module that functions at specific microtubule–microtubule contact sites consists of a PRC1/Ase1/MAP65 family antiparallel crosslinker and a kinesin-4 type motor protein. During late mitosis, this motor is recruited by the crosslinker to sites of antiparallel overlap in the center of bipolar, mitotic microtubule networks (Kurasawa et al., 2004; Zhu and Jiang, 2005; de Keijzer et al., 2017). Here, kinesin-4 reduces microtubule growth rates and suppresses catastrophes leading to confinement of overlap length (Bringmann et al., 2004; Bieling et al., 2010; de Keijzer et al., 2017). In this study, we used tip-growing cells of the moss Physcomtrium patens to investigate if the polarity-sensitive nature of the antiparallel microtubule bundler MAP65 and its ability to define a location for recruitment of kinesin-4 type growth regulators are used to enforce the topology of a highly polarized array. First, we identify one kinesin-4 type molecular motor that is selectively recruited to MAP65-decorated antiparallel microtubule overlaps in interphase. We then demonstrate that this molecule selectively inhibits microtubule growth within these overlaps to aid in the maintenance of overall network polarity. The lack of this activity resulted in a rigid, less adaptable growth axis. Thus, overlap-based growth inhibition constitutes a new organizing principle for reinforcing a high degree of polarization in the microtubule array vital for the correct guidance of growth processes.
Results
In tip-growing moss caulonemal apical cells, the microtubule plus end growth direction is highly polarized toward the apex (Hiwatashi et al., 2014). While such polarity could theoretically be solely maintained through a bias in nucleation direction of new microtubules, the divergent angles of branched microtubule nucleation reported for protonemal cells (Nakaoka et al., 2015) suggest that also intermicrotubule interactions assist in polarity establishment after nucleation. To investigate if antiparallel microtubule encounters could be one of these interactions, we imaged the antiparallel microtubule overlap marker MAP65a-citrine (Kosetsu et al., 2013) together with the microtubule network in tip-growing caulonemal apical cells. This revealed the presence of distinct, bar-shaped areas of MAP65a signal throughout the microtubule network (Fig. 1 A). These areas of overlap occurred both among the microtubules residing in the cortical cytoplasm and among these in the organelle-rich endoplasm (Fig. S1 A). This finding implies that, despite the uniform polarity of the majority (Hiwatashi et al., 2014), the microtubule network contains areas where microtubules of opposing polarity are aligned.

In caulonemal apical cells, Kin4-Ia localizes to antiparallel microtubule overlaps during interphase, and loss of Kin4-Ia reduces the ability of caulonemal cells to alter their growth direction. (A) Microtubule network in a P. patens caulonemal tip cell and occurrence of antiparallel microtubule overlaps therein visualized in a cell expressing mCherry-α-tubulin and MAP65a-citrine. Fluorescence picture is a maximum z-projection of 20 planes spaced 0.4 µm apart. Scale bar, 5 µm. (B) Interphase caulonemal tip cell expressing both MAP65a-mCherry as a marker for antiparallel overlaps and Kin4-Ia labeled with citrine. An enlarged view of the bracketed area is shown on the right. Here, the arrow indicates an overlap without discernible Kin4-Ia-citrine association. The spherical objects also visible in the Kin4-Ia-citrine channel are autofluorescent chloroplasts. Images are a maximum z-projection of 20 planes spaced 0.4 µm apart. The Kin4-Ia-citrine signal was acquired before that of MAP65a-mCherry at each confocal plane. Scale bar in overview image, 5 µm; scale bar in the enlarged view, 1 µm. (C) Bar graph representing the fraction of MAP65a-mCherry–labeled overlaps with an associated Kin4-Ia-citrine signal. The uncertain category was assigned in case close proximity of an autofluorescent chloroplast hampered the assessment of colocalization. (D) Time sequences of growing caulonemal tip cells of wild type and two Δkin4-Ia mutant lines observed with bright field microscopy. The path traveled by the cell tip (blue dot) is highlighted in red. An idealized linear path based on linear regression analysis of the red path is indicated in green. Scale bar, 10 µm. (E) Boxplots of average tip growth speeds derived from 4-h growth periods for wild type and two Δkin4-Ia lines. The whiskers indicate minimum/maximum observed values or 1.5 times the interquartile range when outliers (circles) were present. A one-way ANOVA analysis did not reveal significant differences among distributions (P > 0.05). (F) Definition of a straightness parameter wherein colors correspond to paths plotted in D. Boxplots of the straightness parameter for paths traveled by cell tips of wild type and two Δkin4-Ia lines. The same 4-h growth periods were analyzed as indicated in E. The outcome of a Kruskal–Wallis pairwise comparison test on the means as well as the outcome of pairwise Levene’s tests for equal variance of the ranked dataset is represented in the table below. Significant differences (P < 0.05) are highlighted in bold. The whiskers indicate minimum/maximum observed values or 1.5 times the interquartile range when outliers (circles) were present. (G) Colony outgrowth photographed 5 wk after transferring plates, pregrown horizontally in light, to an upright position in the dark for two wild type backgrounds (with and without the MAP65a-citrine marker present) and two Δkin4-Ia mutant lines. Detailed pictures show that caulonema radiate out of the colony in a less polarized manner upon loss of Kin4-Ia. Here, the dashed lines indicate the 2-mm circumferential area at the top of the colony used to determine filament angles with OrientationJ. The circular histograms (“rose plots”) below depict the average abundance of determined filament angles divided into 12° bins. Error bars represent SD. Scale bar in the overview images, 5 mm; scale bar in the detail images, 1 mm.
In caulonemal apical cells, Kin4-Ia localizes to antiparallel microtubule overlaps during interphase, and loss of Kin4-Ia reduces the ability of caulonemal cells to alter their growth direction. (A) Microtubule network in a P. patens caulonemal tip cell and occurrence of antiparallel microtubule overlaps therein visualized in a cell expressing mCherry-α-tubulin and MAP65a-citrine. Fluorescence picture is a maximum z-projection of 20 planes spaced 0.4 µm apart. Scale bar, 5 µm. (B) Interphase caulonemal tip cell expressing both MAP65a-mCherry as a marker for antiparallel overlaps and Kin4-Ia labeled with citrine. An enlarged view of the bracketed area is shown on the right. Here, the arrow indicates an overlap without discernible Kin4-Ia-citrine association. The spherical objects also visible in the Kin4-Ia-citrine channel are autofluorescent chloroplasts. Images are a maximum z-projection of 20 planes spaced 0.4 µm apart. The Kin4-Ia-citrine signal was acquired before that of MAP65a-mCherry at each confocal plane. Scale bar in overview image, 5 µm; scale bar in the enlarged view, 1 µm. (C) Bar graph representing the fraction of MAP65a-mCherry–labeled overlaps with an associated Kin4-Ia-citrine signal. The uncertain category was assigned in case close proximity of an autofluorescent chloroplast hampered the assessment of colocalization. (D) Time sequences of growing caulonemal tip cells of wild type and two Δkin4-Ia mutant lines observed with bright field microscopy. The path traveled by the cell tip (blue dot) is highlighted in red. An idealized linear path based on linear regression analysis of the red path is indicated in green. Scale bar, 10 µm. (E) Boxplots of average tip growth speeds derived from 4-h growth periods for wild type and two Δkin4-Ia lines. The whiskers indicate minimum/maximum observed values or 1.5 times the interquartile range when outliers (circles) were present. A one-way ANOVA analysis did not reveal significant differences among distributions (P > 0.05). (F) Definition of a straightness parameter wherein colors correspond to paths plotted in D. Boxplots of the straightness parameter for paths traveled by cell tips of wild type and two Δkin4-Ia lines. The same 4-h growth periods were analyzed as indicated in E. The outcome of a Kruskal–Wallis pairwise comparison test on the means as well as the outcome of pairwise Levene’s tests for equal variance of the ranked dataset is represented in the table below. Significant differences (P < 0.05) are highlighted in bold. The whiskers indicate minimum/maximum observed values or 1.5 times the interquartile range when outliers (circles) were present. (G) Colony outgrowth photographed 5 wk after transferring plates, pregrown horizontally in light, to an upright position in the dark for two wild type backgrounds (with and without the MAP65a-citrine marker present) and two Δkin4-Ia mutant lines. Detailed pictures show that caulonema radiate out of the colony in a less polarized manner upon loss of Kin4-Ia. Here, the dashed lines indicate the 2-mm circumferential area at the top of the colony used to determine filament angles with OrientationJ. The circular histograms (“rose plots”) below depict the average abundance of determined filament angles divided into 12° bins. Error bars represent SD. Scale bar in the overview images, 5 mm; scale bar in the detail images, 1 mm.

3D architecture of microtubule network in caulonemal tip cells and localization survey of P. patens kinesin-4s. (A) Microtubule network architecture of a caulonemal tip cell divided into four serial optical planes as indicated on the left, visualized using a cell expressing mCherry-α-tubulin and MAP65a-citrine. Microtubules and concomitant antiparallel overlaps occur throughout the cell. While absent near the cortex, larger organelles like vacuoles and chloroplasts become increasingly abundant toward the median plane of the cell. Shown images are maximum z-projections of five confocal planes spaced 0.4 μm apart. Scale bar, 5 µm. (B) Localization survey of all eight kinesin-4s in P. patens caulonemal tip cells. All kinesin-4-citrine signals were acquired with identical illumination and detection settings and are shown using an equal intensity display range. Expanded views of the tip areas are given in inverted contrast. The microtubule network was covisualized through expression of mCherry-α-tubulin. While most kinesin-4 proteins could be detected in the cytosol (as indicated with an asterisk), only Kin4-Ia labeling produced striped, overlap-like staining throughout the cell (arrowheads). Three other kinesin-4s gave punctate labeling in the tip of the cell (arrows), with Kin4-IIa additionally showing decoration of the plasma membrane at the subapex (indicated with “s”). The phylogenetic relationship between the kinesin-4s is depicted by a tree inferred using the maximum likelihood method following the nomenclature of Shen et al. (2012). Bootstrap values (derived from 500 replicates) indicate the percentage of trees in which the associated taxa clustered together. Horizontal branch lengths represent the number of amino acid substitutions per site. Scale bars, 5 µm.
3D architecture of microtubule network in caulonemal tip cells and localization survey of P. patens kinesin-4s. (A) Microtubule network architecture of a caulonemal tip cell divided into four serial optical planes as indicated on the left, visualized using a cell expressing mCherry-α-tubulin and MAP65a-citrine. Microtubules and concomitant antiparallel overlaps occur throughout the cell. While absent near the cortex, larger organelles like vacuoles and chloroplasts become increasingly abundant toward the median plane of the cell. Shown images are maximum z-projections of five confocal planes spaced 0.4 μm apart. Scale bar, 5 µm. (B) Localization survey of all eight kinesin-4s in P. patens caulonemal tip cells. All kinesin-4-citrine signals were acquired with identical illumination and detection settings and are shown using an equal intensity display range. Expanded views of the tip areas are given in inverted contrast. The microtubule network was covisualized through expression of mCherry-α-tubulin. While most kinesin-4 proteins could be detected in the cytosol (as indicated with an asterisk), only Kin4-Ia labeling produced striped, overlap-like staining throughout the cell (arrowheads). Three other kinesin-4s gave punctate labeling in the tip of the cell (arrows), with Kin4-IIa additionally showing decoration of the plasma membrane at the subapex (indicated with “s”). The phylogenetic relationship between the kinesin-4s is depicted by a tree inferred using the maximum likelihood method following the nomenclature of Shen et al. (2012). Bootstrap values (derived from 500 replicates) indicate the percentage of trees in which the associated taxa clustered together. Horizontal branch lengths represent the number of amino acid substitutions per site. Scale bars, 5 µm.
Since MAP65-family proteins are able to recruit specific modulators of microtubule dynamics (Bratman and Chang, 2007; Bieling et al., 2010; Duellberg et al., 2013; de Keijzer et al., 2014), the observed overlaps could serve as a nexus for the selective alteration of microtubule behavior. Since in a previous study we found that kinesin-4 motors can fulfill such a role on microtubule overlaps present in the cytokinetic microtubule array of P. patens (de Keijzer et al., 2017), we focused on this subfamily of molecular motors. Using a collection of strains expressing citrine-tagged versions of all eight kinesin-4 motors encoded in the P. patens genome (Shen et al., 2012; Miki et al., 2014), we found that only labeling of Kinesin4-Ia (Kin4-Ia) produced striped, MAP65-like patterns in caulonemal apical cells (Fig. S1 B). To confirm that the observed patterns corresponded to regions of antiparallel microtubule overlap, a moss line expressing both Kin4-Ia-citrine and MAP65a-mCherry was constructed (Fig. S2 A). This revealed that indeed Kin4-Ia staining patterns colocalized with MAP65a-labeled regions of overlap (Fig. 1 B); 89% of MAP65a-mCherry labeled overlaps showed concomitant Kin4-Ia localization (Fig. 1 C). Thus, besides having an established role at the phragmoplast midplane during late cytokinesis (de Keijzer et al., 2017), Kin4-Ia could have a role in organizing interphase microtubules for tip growth.

Generation and validation of MAP65a + MAP65c and MAP65a + Kin4-Ia co-localization strains, overlap length dependency on distance to the tip, overlap lengths in other Kin4 mutants, and modes and speeds of overlap disappearance upon Kin4-Ia removal. (A) Schematic representation of the genomic locus containing the MAP65a encoding gene with its intron-exon structure (gray boxes) and the construct used for C-terminal mCherry tagging via homologous recombination (dashed lines). In MAP65a-labeled lines, the original stop codon is replaced with a fragment containing the mCherry encoding sequence (pink box), the nopaline synthase terminator (red box), and a cassette conferring blasticidin resistance (blue box). Red arrows denote primer binding sites used for confirmation of the obtained lines by PCR. The product obtained after PCR reaction and its predicted size are given on the right. The numbers of three independently obtained transformants are given above the gel images. (B) Scatterplot showing the correlation between overlap length and distance to the cell tip (as visualized with MAP65a-citrine expression). Individual measurements of the length of an overlap are plotted against the distance of its center to the cell tip for n = 1,238 overlaps (wild type) and n = 1,781 overlaps (Δkin4-Ia line #7). Both in wild type and the Δkin4-Ia mutant simple linear regression analysis revealed an extremely weak correlation. (C) Visualization of the colocalization of two MAP65 paralogs, MAP65a and MAP65c, in interphase tip cells. The separate channels of the different fusion proteins are shown with a colored overlay depicted below. Images are a maximum projection of 20 z-planes spaced 0.4 µm apart. Scale bar, 10 µm. (D) Boxplots of the overlap lengths in tip cells of wild type, Δkin4-Ia, Δkin4-Ic, and Δkin4-Ic/Δkin4-Ia lines (n = 269 overlaps from 7 cells, 338 overlaps from 7 cells, 345 overlaps from 8 cells, and 693 overlaps from 19 cells for these genotypes, respectively). Individual datapoints are represented by a dot and whiskers indicate minimum/maximum observed values or 1.5 times the interquartile range when outliers were present. The letters indicate which distributions were significantly different in a Kruskall–Wallis test followed by Dunn’s post-hoc testing (two sided; P < 0.001). (E) Histogram showing the length distribution of the indicated amount of MAP65a-mCherry–labeled overlaps from the Kin4-Ia-citrine/MAP65a-mCherry co-localization line. An example of the MAP65a-mCherry signal in a caulonemal tip cell is depicted in the inset (z-projection of 20 planes spaced 0.4 µm apart). Scale bar, 10 µm. Mean overlap length was both significantly smaller than in the Δkin4-Ia lines and significantly higher than in de MAP65a-citrine control line using a Kruskal–Wallis test with Dunn’s multiple comparisons test (P < 0.001; compare with Fig. 2, A and B). (F) Visualization of overlap disappearance by MAP65a-citrine in wild type and Δkin4-Ia cells. Two modes of disappearance are illustrated: one where length loss occurs exclusively at overlap ends (left, open arrowheads) and one where additionally internal breaking up of the overlap is observed (right, closed arrowheads). Kymograph representations of depicted events are given below. Here, dashed lines illustrate the approximate rate of length loss from overlap ends and solid lines illustrate the rate of overlap length loss after an internal cut. Images are maximum z-projections of three planes spaced 0.5 µm apart taken in the cortical area. Horizontal scale bars, 1 µm; vertical scale bar, 30 s. (G) Stacked bar diagram depicting the relative occurrences of the two modes of overlap disappearance for wild type and two Δkin4-Ia mutant lines. The number of events used for analysis is given above. (H) Scatter plot of the frequency of internal cutting events (as exemplified in A) and the maximum length attained by overlaps. Solid bars indicate average lengths and whiskers show SD. Datapoints are slightly offset and color-coded to indicate from which genotype they were derived. (I) Boxplots of the rates of overlap length loss from overlaps ends and within overlaps for wild type and two Δkin4-Ia mutant lines. See kymographs in A for illustration of the measured rates. Individual data points are represented by a dot and whiskers indicate minimum/maximum observed values or 1.5 times the interquartile range when outliers were present. The letters indicate which distributions were significantly different in a Kruskall–Wallis test followed by Dunn’s post-hoc testing (two sided; P < 0.01). Source data are available for this figure: SourceData FS2.
Generation and validation of MAP65a + MAP65c and MAP65a + Kin4-Ia co-localization strains, overlap length dependency on distance to the tip, overlap lengths in other Kin4 mutants, and modes and speeds of overlap disappearance upon Kin4-Ia removal. (A) Schematic representation of the genomic locus containing the MAP65a encoding gene with its intron-exon structure (gray boxes) and the construct used for C-terminal mCherry tagging via homologous recombination (dashed lines). In MAP65a-labeled lines, the original stop codon is replaced with a fragment containing the mCherry encoding sequence (pink box), the nopaline synthase terminator (red box), and a cassette conferring blasticidin resistance (blue box). Red arrows denote primer binding sites used for confirmation of the obtained lines by PCR. The product obtained after PCR reaction and its predicted size are given on the right. The numbers of three independently obtained transformants are given above the gel images. (B) Scatterplot showing the correlation between overlap length and distance to the cell tip (as visualized with MAP65a-citrine expression). Individual measurements of the length of an overlap are plotted against the distance of its center to the cell tip for n = 1,238 overlaps (wild type) and n = 1,781 overlaps (Δkin4-Ia line #7). Both in wild type and the Δkin4-Ia mutant simple linear regression analysis revealed an extremely weak correlation. (C) Visualization of the colocalization of two MAP65 paralogs, MAP65a and MAP65c, in interphase tip cells. The separate channels of the different fusion proteins are shown with a colored overlay depicted below. Images are a maximum projection of 20 z-planes spaced 0.4 µm apart. Scale bar, 10 µm. (D) Boxplots of the overlap lengths in tip cells of wild type, Δkin4-Ia, Δkin4-Ic, and Δkin4-Ic/Δkin4-Ia lines (n = 269 overlaps from 7 cells, 338 overlaps from 7 cells, 345 overlaps from 8 cells, and 693 overlaps from 19 cells for these genotypes, respectively). Individual datapoints are represented by a dot and whiskers indicate minimum/maximum observed values or 1.5 times the interquartile range when outliers were present. The letters indicate which distributions were significantly different in a Kruskall–Wallis test followed by Dunn’s post-hoc testing (two sided; P < 0.001). (E) Histogram showing the length distribution of the indicated amount of MAP65a-mCherry–labeled overlaps from the Kin4-Ia-citrine/MAP65a-mCherry co-localization line. An example of the MAP65a-mCherry signal in a caulonemal tip cell is depicted in the inset (z-projection of 20 planes spaced 0.4 µm apart). Scale bar, 10 µm. Mean overlap length was both significantly smaller than in the Δkin4-Ia lines and significantly higher than in de MAP65a-citrine control line using a Kruskal–Wallis test with Dunn’s multiple comparisons test (P < 0.001; compare with Fig. 2, A and B). (F) Visualization of overlap disappearance by MAP65a-citrine in wild type and Δkin4-Ia cells. Two modes of disappearance are illustrated: one where length loss occurs exclusively at overlap ends (left, open arrowheads) and one where additionally internal breaking up of the overlap is observed (right, closed arrowheads). Kymograph representations of depicted events are given below. Here, dashed lines illustrate the approximate rate of length loss from overlap ends and solid lines illustrate the rate of overlap length loss after an internal cut. Images are maximum z-projections of three planes spaced 0.5 µm apart taken in the cortical area. Horizontal scale bars, 1 µm; vertical scale bar, 30 s. (G) Stacked bar diagram depicting the relative occurrences of the two modes of overlap disappearance for wild type and two Δkin4-Ia mutant lines. The number of events used for analysis is given above. (H) Scatter plot of the frequency of internal cutting events (as exemplified in A) and the maximum length attained by overlaps. Solid bars indicate average lengths and whiskers show SD. Datapoints are slightly offset and color-coded to indicate from which genotype they were derived. (I) Boxplots of the rates of overlap length loss from overlaps ends and within overlaps for wild type and two Δkin4-Ia mutant lines. See kymographs in A for illustration of the measured rates. Individual data points are represented by a dot and whiskers indicate minimum/maximum observed values or 1.5 times the interquartile range when outliers were present. The letters indicate which distributions were significantly different in a Kruskall–Wallis test followed by Dunn’s post-hoc testing (two sided; P < 0.01). Source data are available for this figure: SourceData FS2.
To establish if the presence of Kin4-Ia modulates tip-growth behavior through its association with microtubule overlap regions, we traced the growing tip of caulonemal cells over 4-h periods in wild type and two independently obtained Kin4-Ia knock-out lines (de Keijzer et al., 2017; Fig. 1 D). The resulting trajectories were used to measure the speed of tip growth and the straightness of the path traversed by the tip relative to an idealized linear trajectory. The speed of tip growth was not significantly different among wild type and the two Δkin4-Ia mutant strains (Fig. 1 E). This is in line with the absence of a phenotype at the level of colony size and appearance upon Kin4-Ia disruption (de Keijzer et al., 2017). However, calculation of a growth path straightness indicator showed that, although the mean straightness over a 4-h period was similar to the wild type for one mutant and slightly higher for the other, the variance decreased at least fourfold in both mutants (Fig. 1 F). This highlights that upon losing Kin4-Ia function, the growth axis of individual cells is more rigidly confined to a certain direction. The observation that growth direction is less variable under standard growth conditions raises the question of whether this would compromise the ability of a cell to steer its growth axis in response to environmental signals. To address this, we compared wild type and Δkin4-Ia mutants in a gravitropic response assay. When transferred to the dark, caulonemal cells normally exhibit a strong, negative gravitropic growth response (Cove et al., 1978; Jenkins et al., 1986). Although in Δkin4-Ia mutant lines the growth axis of caulonemal filaments ultimately aligned opposite to the direction of the gravity vector, compared with control lines, alignment was delayed, indicating a hampered adaptation of tip-growth direction (Fig. 1 G). Taken together, these results show that Kin4-Ia disruption, without notably affecting the rate of the growth process itself, has a major effect on the ability of a caulonemal cell to steer its growth axis.
What is the function of Kin4-Ia on microtubule overlaps in tip-growing moss cells? In late mitotic microtubule arrays of both plant and animal cells, it is shown that kinesin-4 type motors are recruited to overlaps that are formed between termini of microtubules of opposite polarity. Consequently, microtubule growth that would normally cause extension of overlaps is locally downregulated to constrain the length of these overlaps (Kurasawa et al., 2004; Bieling et al., 2010; Nguyen et al., 2018; de Keijzer et al., 2017). In the interphase microtubule network of tip-growing moss cells, similar geometries may arise when the growing end of one microtubule impinges along the length of a neighboring microtubule or when two growing ends meet head-to-head. To observe if kinesin-4 in interphase acts by a similar mechanism as in mitosis, we first investigated the length of MAP65a-citrine–labeled overlaps in the interphase network of caulonemal cells in absence and presence of Kin4-Ia (Fig. 2 A). In the wild type situation, a narrow overlap length distribution with an average length of 0.91 µm was observed (Fig. 2 B). By comparison, the length distribution in knock-out lines tapered off more slowly resulting in more than doubled average overlap lengths (Fig. 2 B). In both genetic backgrounds, overlap lengths appeared uncorrelated with their relative position along the cell's main axis, highlighting that Kin4-Ia uniformly influences microtubule overlap length within the sampled area (Fig. S2 B). The reporting of overlaps by labeled MAP65a was deemed faithful, as coexpression of another tagged MAP65 paralog (MAP65c) labeled precisely the same structures (Fig. S2 C). Interestingly, while Kin4-Ia has overlapping functions with Kin4-Ic during mitosis, deletion of Kin4-Ic did not affect interphase overlap lengths (Fig. S2 D). This distinct role of Kin4-Ia also allowed us to verify that the citrine-tagged version of Kin4-Ia exhibited normal biological function since a wild type–like overlap length distribution was observed in cells expressing the fusion protein (Fig. S2 E).

Kin4-Ia limits overlap length by restricting the rate of overlap extension. (A) Visualization of overlaps by MAP65a-citrine in wild type and Δkin4-Ia cells. Two independent mutant strains are shown. Overlap regions appear longer in absence of Kin4-Ia. Horizontal scale bar, 10 µm. (B) Histograms showing the length distribution derived from the indicated amount of MAP65a-citrine labeled overlaps for wild type and two Δkin4-Ia mutant lines. All distributions were significantly different from each other in a Kruskal–Wallis test with Dunn’s multiple comparisons post-hoc test (P < 0.001). (C) Kymographs and corresponding snapshots of microtubule overlap formation events (as defined in the Materials and methods section) visualized using MAP65a-citrine for wild type and two Δkin4-Ia mutant lines. The snapshots depicted above show the overlaps at their maximum observed length. The scheme on the right shows how measurements and calculations were performed to obtain the overlap extension rates depicted in D. Images are maximum z-projections of three planes spaced 0.5 µm apart taken in the cortical area. Horizontal scale bar, 1 µm; vertical scale bar, 30 s. (D) Boxplots of the maximum attained overlap length and overlap extension rate measured in wild type (n = 22 overlap formation events) and two Δkin4-Ia mutant strains (n = 24 and 35 events resp.) expressing MAP65a-citrine. The whiskers indicate minimum/maximum observed values or 1.5 times the interquartile range when outliers (circles) were present. Differences are supported with *P < 0.05 and **P < 0.001 from a one-way ANOVA with Tukey's honestly significant difference post-hoc test (maximum lengths) or Kruskal–Wallis test with Dunn’s multiple comparisons test (extension rates). Note that extension rates can represent the combined dynamic behavior of both overlapping microtubules.
Kin4-Ia limits overlap length by restricting the rate of overlap extension. (A) Visualization of overlaps by MAP65a-citrine in wild type and Δkin4-Ia cells. Two independent mutant strains are shown. Overlap regions appear longer in absence of Kin4-Ia. Horizontal scale bar, 10 µm. (B) Histograms showing the length distribution derived from the indicated amount of MAP65a-citrine labeled overlaps for wild type and two Δkin4-Ia mutant lines. All distributions were significantly different from each other in a Kruskal–Wallis test with Dunn’s multiple comparisons post-hoc test (P < 0.001). (C) Kymographs and corresponding snapshots of microtubule overlap formation events (as defined in the Materials and methods section) visualized using MAP65a-citrine for wild type and two Δkin4-Ia mutant lines. The snapshots depicted above show the overlaps at their maximum observed length. The scheme on the right shows how measurements and calculations were performed to obtain the overlap extension rates depicted in D. Images are maximum z-projections of three planes spaced 0.5 µm apart taken in the cortical area. Horizontal scale bar, 1 µm; vertical scale bar, 30 s. (D) Boxplots of the maximum attained overlap length and overlap extension rate measured in wild type (n = 22 overlap formation events) and two Δkin4-Ia mutant strains (n = 24 and 35 events resp.) expressing MAP65a-citrine. The whiskers indicate minimum/maximum observed values or 1.5 times the interquartile range when outliers (circles) were present. Differences are supported with *P < 0.05 and **P < 0.001 from a one-way ANOVA with Tukey's honestly significant difference post-hoc test (maximum lengths) or Kruskal–Wallis test with Dunn’s multiple comparisons test (extension rates). Note that extension rates can represent the combined dynamic behavior of both overlapping microtubules.
To find further support for a mechanism in which Kin4-Ia limits overlap length, we characterized the formation of overlaps over time in wild type and Δkin4-Ia cells. In wild type cells, overlaps expanded at an average rate of 7.5 ± 2.7 µm/min until reaching typical lengths between 1.5 and 3.5 µm, after which they shortened again (Fig. 2, C and D). By comparison, in the mutant cells, overlaps expanded at elevated average extension rates (12.6 ± 4.7 and 11.3 ± 4.4 µm/min for the two studied mutant lines, respectively) and reached ultimate lengths that were on average twice as high (Fig. 2 D). Thus, downregulation of microtubule dynamics by Kin4-Ia of a microtubule engaged in antiparallel overlap formation could underpin the observed confinement of overlap length. Interestingly, while disassembly of overlaps in wild type occurred almost exclusively by shortening of overlap ends, in Δkin4-Ia cells, MAP65-labeled regions were occasionally observed to split up in multiple parts that individually started to shrink, reminiscent of microtubule severing activity (McNally and Vale, 1993; Roll-Mecak and McNally, 2010; Fig. 2 C; and Fig. S2, F and G). The frequency of these internal cutting events correlated with the ultimate length attained by overlaps (Pearson’s product-moment correlation coefficient = 0.6; Fig. S2 H), suggesting this phenomenon is a secondary effect of Kin4-Ia removal, rather than a direct effect. We further observed that the rates of length loss from overlaps were significantly higher in Δkin4-Ia mutant cells (Fig. S2 I). This indicates that Kin4-Ia exerts a stabilizing effect on microtubules within overlaps during overlap disassembly as well as overlap formation. Such behavior would be in agreement with the combined growth-inhibiting and catastrophe-suppressing activity found for various kinesin-4 family members in in vitro experiments (Bringmann et al., 2004; Bieling et al., 2010; van der Vaart et al., 2013; Yue et al., 2018; de Keijzer et al., 2017). Taken together, we conclude that Kin4-Ia restricts the length of overlaps in the interphase microtubule network, likely through downregulation of the dynamics of the microtubules engaged in the overlap.
To assess Kin4-Ia’s role on microtubule growth within overlaps more directly, we introduced a marker for polymerizing plus ends by tagging endogenous moss EB1-homolog EB1b with mCherry in cells expressing citrine-labeled MAP65 (Fig. S3 A; Hiwatashi et al., 2014). EB1 homologs label microtubule ends selectively in their growth state, thus allowing direct visualization of polymerization kinetics during overlap formation. EB1b-comets were observed on the ends of expanding microtubule overlaps. Typically, only one of the overlap ends was decorated with EB1b, reinforcing that overlaps in the interphase network are mostly formed through a growing microtubule impinging on the lattice of an existing microtubule (Fig. 3 A; for a precise breakdown of EB1b association patterns, see Fig. S3, B–D). Measuring the dynamics of EB1b-comets in overlaps, we found that comet lifetimes in wild type overlaps were narrowly confined to a ∼10–20-s window. In contrast, the range of observed lifetimes increased drastically in absence of Kin4-Ia and the average lifetime was almost twofold higher (Fig. 3 B). This shows that Kin4-Ia shortens the duration of the growth stage of microtubules in overlaps. Interestingly, the average speed of comets in overlaps only mildly increased in the Δkin4-Ia mutant situation (Fig. 3 C), showing that the underlying mechanism results in a relatively sudden shutdown of growth as opposed to a gradual or persistent downregulation of microtubule growth within overlaps.
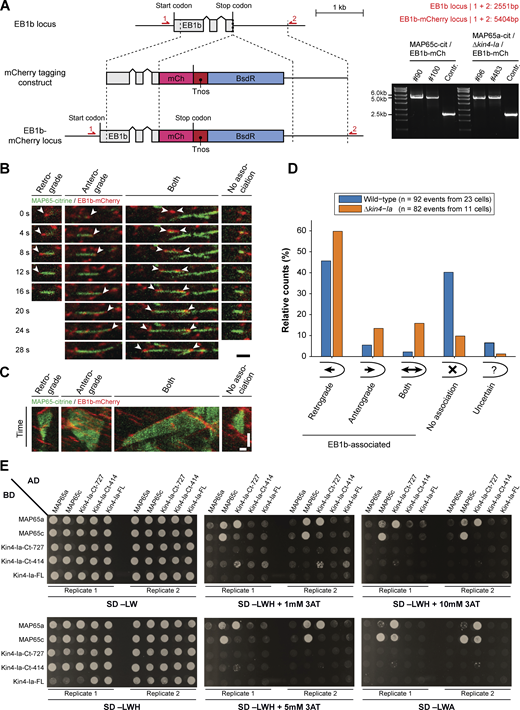
Generation of EB1b-mCherry marker strains, breakdown of number and orientation of plus end growth events during overlap formation, and full yeast-two-hybrid results. (A) Schematic representation of the genomic locus containing the EB1b encoding gene with its intron–exon structure (gray boxes) and the construct used for C-terminal mCherry tagging via homologous recombination (dashed lines). In EB1b-labeled lines, the original stop codon is replaced with a fragment containing the mCherry encoding sequence (pink box), the nopaline synthase terminator (red box), and a cassette conferring blasticidin resistance (blue box). Red arrows denote primer binding sites used for confirmation of the obtained lines by PCR. The product obtained after PCR reaction and its predicted size are given on the right. The numbers of two independent transformants are given above the gel images. (B) Time sequences of microtubule overlap formation events visualized with MAP65-citrine and microtubule plus end marker EB1b-mCherry (indicated with arrowheads). The events with EB1b-mCherry association were further categorized according to the growth direction of the microtubule plus end with respect to the cell apex: retrograde (away from cell apex), anterograde (toward cell apex), or both (one plus end in each direction). The shown retrograde event was acquired in a wild type background and the other events in a Δkin4-Ia background. Images are maximum z-projections of two planes spaced 0.5 µm apart acquired in the cortical area. Scale bar, 2 µm. (C) Kymographs of the microtubule overlap formation events depicted in B. Note that in contrast to B, overlap disappearance is also included. Horizontal scale bar, 1 µm; vertical scale bar, 30 s. (D) Bar diagram showing relative occurrence of the different EB1b-association categories (as illustrated in B) obtained from the indicated number of overlap formation events in wild type and Δkin4-Ia cells. In case EB1b association could not be unequivocally determined (e.g., due to high EB1b-comet abundance), the “uncertain” category was assigned. (E) Full overview of the yeast-two-hybrid interaction assay between two MAP65 paralogs and different portions of Kin4-Ia. Proteins/protein fragments fused with the Gal4 activation domain (AD) and binding domain (BD) and their different combinations were co-expressed in yeast strains (SD −LW) that were tested for growth on reporter media lacking histidine (SD −LDH) in combination with increasing concentrations of the competitive inhibitor 3-AT (1, 5 and 10 mM) or lacking adenine (SD −LDA). For each observation, two biological replicates (independent mating events) are shown. Note that detection of protein–protein interaction appears dependent on fusion partner and/or selection marker. Source data are available for this figure: SourceData FS3.
Generation of EB1b-mCherry marker strains, breakdown of number and orientation of plus end growth events during overlap formation, and full yeast-two-hybrid results. (A) Schematic representation of the genomic locus containing the EB1b encoding gene with its intron–exon structure (gray boxes) and the construct used for C-terminal mCherry tagging via homologous recombination (dashed lines). In EB1b-labeled lines, the original stop codon is replaced with a fragment containing the mCherry encoding sequence (pink box), the nopaline synthase terminator (red box), and a cassette conferring blasticidin resistance (blue box). Red arrows denote primer binding sites used for confirmation of the obtained lines by PCR. The product obtained after PCR reaction and its predicted size are given on the right. The numbers of two independent transformants are given above the gel images. (B) Time sequences of microtubule overlap formation events visualized with MAP65-citrine and microtubule plus end marker EB1b-mCherry (indicated with arrowheads). The events with EB1b-mCherry association were further categorized according to the growth direction of the microtubule plus end with respect to the cell apex: retrograde (away from cell apex), anterograde (toward cell apex), or both (one plus end in each direction). The shown retrograde event was acquired in a wild type background and the other events in a Δkin4-Ia background. Images are maximum z-projections of two planes spaced 0.5 µm apart acquired in the cortical area. Scale bar, 2 µm. (C) Kymographs of the microtubule overlap formation events depicted in B. Note that in contrast to B, overlap disappearance is also included. Horizontal scale bar, 1 µm; vertical scale bar, 30 s. (D) Bar diagram showing relative occurrence of the different EB1b-association categories (as illustrated in B) obtained from the indicated number of overlap formation events in wild type and Δkin4-Ia cells. In case EB1b association could not be unequivocally determined (e.g., due to high EB1b-comet abundance), the “uncertain” category was assigned. (E) Full overview of the yeast-two-hybrid interaction assay between two MAP65 paralogs and different portions of Kin4-Ia. Proteins/protein fragments fused with the Gal4 activation domain (AD) and binding domain (BD) and their different combinations were co-expressed in yeast strains (SD −LW) that were tested for growth on reporter media lacking histidine (SD −LDH) in combination with increasing concentrations of the competitive inhibitor 3-AT (1, 5 and 10 mM) or lacking adenine (SD −LDA). For each observation, two biological replicates (independent mating events) are shown. Note that detection of protein–protein interaction appears dependent on fusion partner and/or selection marker. Source data are available for this figure: SourceData FS3.

Kin4-Ia limits overlap extension through inhibition of microtubule polymerization, is recruited to antiparallel overlaps, and exhibits long-range motility. (A) Microtubule polymerization during overlap formation visualized by time-lapse imaging of wild type and Δkin4-Ia cells expressing MAP65-citrine and microtubule plus end marker EB1b-mCherry (indicated with arrowheads). Kymographs of the overlap formation events are depicted below. Here, arrowheads indicate the start (closed) and end (open) of EB1b-comet association with the forming overlap. Images are maximum z-projections of two planes spaced 0.5 µm apart acquired in the cortical area. Visualization of both probes was performed simultaneously. Scale bar in snapshots, 5 µm; horizontal scale bar in kymographs, 1 µm; vertical scale bar, 5 s. (B) Boxplots of EB1b-comet lifetimes in overlaps of wild type and Δkin4-Ia cells. Comet lifetime was defined as the time during which an EB1b-comet associated with one side of an expanding microtubule overlap as exemplified in the kymographs in A. The indicated number of EB1b-comets was measured. The whiskers indicate minimum/maximum observed values or 1.5 times the interquartile range when outliers (circles) were present. **difference supported with P < 0.001 in a Mann–Whitney U test. (C) Boxplots of EB1b-comet speeds in overlaps of wild type and Δkin4-Ia cells for the indicated number of EB1b-comets. The whiskers indicate minimum/maximum observed values or 1.5 times the interquartile range when outliers (circles) were present. *difference supported with P < 0.05 in Student’s t test. (D) Yeast-two-hybrid interaction assay between two MAP65 paralogs and different portions of Kin4-Ia (illustrated on the left in green). Proteins/protein fragments were fused with the Gal4 activation domain (AD) and binding domain (BD) and their different combinations were co-expressed in yeast strains that were tested for growth on reporter media lacking histidine in combination with 10 mM of the competitive inhibitor 3-AT or lacking adenine. Interaction between MAP65 and a C-terminal region of Kin4-Ia is apparent alongside homo/heterodimerization of MAP65. Note that detection of protein–protein interaction appears dependent on fusion partner and/or selection marker. For full overview of the assay, see Fig. S3 E. (E) Recruitment of Kin4-Ia to overlaps visualized by time-lapse imaging of a cell expressing Kin4-Ia-citrine and MAP65a-mCherry. Initially, the expanding overlap is devoid of Kin4-Ia-citrine (indicated with an asterisk), which after its later arrival remains associated with the overlap until overlap disappearance. Images were obtained in a single optical plane from the cortical area. The Kin4-Ia-citrine signal was acquired before that of MAP65a-mCherry at each time point. Scale bar, 1 µm. (F) Snapshots showing asymmetric recruitment dynamics of Kin4-Ia onto microtubules adjacent to a nascent overlap. The arrowheads indicate a spur of Kin4-Ia-citrine fluorescence traveling in opposite direction of overlap elongation. Scale bar, 1 µm. (G) Time sequence of an overlap taken at high time resolution. Arrowheads point to examples of Kin4-Ia particles moving away from the overlap region (indicated with a bracket; a schematic of the assumed topology of the constituent microtubules is given). The open arrowheads indicate previous particle positions at t = 0. A kymograph representation depicted on the right shows that individual particles exhibit sustained motility away from the overlap until reaching a stationary zone of Kin4-Ia-citrine signal (marked with an asterisk). Horizontal scale bars, 1 µm; vertical scale bar, 5 s. (H) Histogram showing the distribution of velocities for particles moving away from an overlap region. (I) Histogram showing the observed run lengths of particles.
Kin4-Ia limits overlap extension through inhibition of microtubule polymerization, is recruited to antiparallel overlaps, and exhibits long-range motility. (A) Microtubule polymerization during overlap formation visualized by time-lapse imaging of wild type and Δkin4-Ia cells expressing MAP65-citrine and microtubule plus end marker EB1b-mCherry (indicated with arrowheads). Kymographs of the overlap formation events are depicted below. Here, arrowheads indicate the start (closed) and end (open) of EB1b-comet association with the forming overlap. Images are maximum z-projections of two planes spaced 0.5 µm apart acquired in the cortical area. Visualization of both probes was performed simultaneously. Scale bar in snapshots, 5 µm; horizontal scale bar in kymographs, 1 µm; vertical scale bar, 5 s. (B) Boxplots of EB1b-comet lifetimes in overlaps of wild type and Δkin4-Ia cells. Comet lifetime was defined as the time during which an EB1b-comet associated with one side of an expanding microtubule overlap as exemplified in the kymographs in A. The indicated number of EB1b-comets was measured. The whiskers indicate minimum/maximum observed values or 1.5 times the interquartile range when outliers (circles) were present. **difference supported with P < 0.001 in a Mann–Whitney U test. (C) Boxplots of EB1b-comet speeds in overlaps of wild type and Δkin4-Ia cells for the indicated number of EB1b-comets. The whiskers indicate minimum/maximum observed values or 1.5 times the interquartile range when outliers (circles) were present. *difference supported with P < 0.05 in Student’s t test. (D) Yeast-two-hybrid interaction assay between two MAP65 paralogs and different portions of Kin4-Ia (illustrated on the left in green). Proteins/protein fragments were fused with the Gal4 activation domain (AD) and binding domain (BD) and their different combinations were co-expressed in yeast strains that were tested for growth on reporter media lacking histidine in combination with 10 mM of the competitive inhibitor 3-AT or lacking adenine. Interaction between MAP65 and a C-terminal region of Kin4-Ia is apparent alongside homo/heterodimerization of MAP65. Note that detection of protein–protein interaction appears dependent on fusion partner and/or selection marker. For full overview of the assay, see Fig. S3 E. (E) Recruitment of Kin4-Ia to overlaps visualized by time-lapse imaging of a cell expressing Kin4-Ia-citrine and MAP65a-mCherry. Initially, the expanding overlap is devoid of Kin4-Ia-citrine (indicated with an asterisk), which after its later arrival remains associated with the overlap until overlap disappearance. Images were obtained in a single optical plane from the cortical area. The Kin4-Ia-citrine signal was acquired before that of MAP65a-mCherry at each time point. Scale bar, 1 µm. (F) Snapshots showing asymmetric recruitment dynamics of Kin4-Ia onto microtubules adjacent to a nascent overlap. The arrowheads indicate a spur of Kin4-Ia-citrine fluorescence traveling in opposite direction of overlap elongation. Scale bar, 1 µm. (G) Time sequence of an overlap taken at high time resolution. Arrowheads point to examples of Kin4-Ia particles moving away from the overlap region (indicated with a bracket; a schematic of the assumed topology of the constituent microtubules is given). The open arrowheads indicate previous particle positions at t = 0. A kymograph representation depicted on the right shows that individual particles exhibit sustained motility away from the overlap until reaching a stationary zone of Kin4-Ia-citrine signal (marked with an asterisk). Horizontal scale bars, 1 µm; vertical scale bar, 5 s. (H) Histogram showing the distribution of velocities for particles moving away from an overlap region. (I) Histogram showing the observed run lengths of particles.
To gain more insight into the observed rather sudden growth termination dynamics, we looked in more detail at the behavior of the Kin4-Ia motor at overlaps. For recruitment of kinesin-4 to overlaps in animal cells, a direct physical interaction between the stalk and tail region of the motor and the microtubule crosslinking protein is required (Kurasawa et al., 2004; Zhu and Jiang, 2005; Bieling et al., 2010). Therefore, first, we established if moss Kin4-Ia could interact with MAP65 using a yeast-two-hybrid approach. This revealed that a carboxy-terminal region of Kin4-Ia could strongly interact with MAP65 proteins (Fig. 3 D and Fig. S3 E). As a next step, we focused on the recruitment dynamics of Kin4-Ia to growing overlaps. Observation of 70 overlap formation events (n = 15 cells) revealed that Kin4-Ia-citrine appeared on overlaps slightly later than its decoration by MAP65a-mCherry (always at least one ∼3-s interval later) and that after this initial delay, both signals remained associated until overlap disappearance (Fig. 3 E). In addition to this, in ∼61% of the observed cases, the Kin4-Ia-citrine signal also created a dim, extending spur from one side of the overlap that did not have detectable associated MAP65 and accumulated briefly distal to the overlap (Fig. 3 F). Since the EB1b imaging revealed that lateral encounters between a growing plus end and the lattice of an existing microtubule account for most overlap formation events, these spurs could correspond to the motor exploring a microtubule segment extending beyond the zone of overlap through plus-end-directed motility, as described for Xenopus kinesin-4 Xklp1 (Bieling et al., 2010). Indeed, imaging at high temporal resolution showed that these spurs consisted of particles moving away from the overlap in a highly linear fashion (Fig. 3, G–I). Whether this motility also enables Kin4-Ia to affect growth of microtubule ends located outside the overlap is currently unknown. However, it highlights that the moss kinesin-4 protein studied here in vivo shows a striking correspondence to the in vitro functional mechanism described for the well-studied animal kinesin-4 Xklp1 on microtubule overlaps in terms of recruitment dynamics and processive motility (Bieling et al., 2010). Moreover, these recruitment dynamics form a plausible explanation for the observed abrupt termination of microtubule growth in overlaps by Kin4-Ia (Fig. 3, B and C) as well as for the small fraction of overlaps without apparent Kin4-Ia association we observed earlier (Fig. 1 C).
We have shown that Kin4-Ia is recruited to MAP65-decorated microtubule overlaps, where it limits overlap growth. What could be the function of Kin4-Ia mediated overlap length limitation for the overall microtubule array architecture? To assess this, we characterized the direction of all imaged EB1b-comets, not only those associated with overlaps, using a particle tracking workflow (Fig. 4 A and Fig. S4; Jaqaman et al., 2008). This revealed a unimodal distribution of plus end growth trajectories centered around the basal-to-apical axis of the cell (set to 0°) in the wild type situation. In contrast, a small second peak centered around the opposite direction was present in the distribution of the Δkin4-Ia mutant (Fig. 4 B, arrowheads). This suggests that prolonged polymerization within overlaps in absence of Kin4-Ia allows for more growth in the retrograde direction, ultimately causing a mild bipolarization of the microtubule array. Thus, Kin4-Ia aids in overall array polarization but is not required to establish or maintain the dominating direction.

Loss of Kin4-Ia leads to bipolarization and hyper-alignment of the interphase microtubule array in caulonemal tip cells. (A) Caulonemal tip cells expressing EB1b-mCherry together with the computationally identified tracks of microtubule plus ends labeled by this probe in a wild type and Δkin4-Ia mutant background. One frame from a time sequence is shown. The active tracks corresponding to this frame (i.e., tracks of which an identified comet in this frame is part) are plotted in varying colors. The image is a maximum z-projection of two planes spaced 0.5 µm apart acquired near the cell cortex. Scale bar, 5 µm. (B) Histogram showing the angle distribution for the indicated number of track segments for wild type and Δkin4-Ia cells. Compared with wild type, loss of Kin4-Ia leads to a larger fraction of EB1b-comets moving toward the base of the cell (arrowheads) and causes the comets moving toward the tip to be more aligned to the cell axis (arrow). (C) Contour plots with color map showing the track-segment angle distribution as a function of distance to the cell tip for wild type and Δkin4-Ia cells (the same tracks were used as in B). The slightly higher abundance of track segments with an angle close to that of the cell axis upon Kin4-Ia removal is noticeable from 50 until ∼10 µm from the tip. (D) Microtubule array configuration in caulonemal tip cells visualized through expression of mCherry-α-tubulin in a wild type and Δkin4-Ia background. An overlay with the corresponding MAP65a-citrine signal is given below. Images shown are maximum z-projections of nine planes spaced 0.27 µm apart acquired near the cell cortex. Scale bar, 5 µm. (E) Snapshots showing the microtubule configuration in the apex of growing caulonemal tip cells visualized through mCherry-α-tubulin expression in a wild type and Δkin4-Ia genetic background. In both strains, microtubules form a coalescing focus close to the dome of the apex. Snapshots are maximum z-projections of 10 planes spaced 0.5 µm apart acquired around the median plane. Brackets delineate the areas that were used for generating the heat maps of the time and cell averaged apical microtubule intensity shown below. In brief, these were obtained by first computationally immobilizing growing cell tips, then making an average projection of image data acquired over 15 min and subsequently averaging over the indicated number of cells. The average apical microtubule distribution appeared both more concentrated and more tapered upon loss of Kin4-Ia compared with wild type. Scale bar in the top images, 5 µm; scale bar in the bottom images, 1 µm.
Loss of Kin4-Ia leads to bipolarization and hyper-alignment of the interphase microtubule array in caulonemal tip cells. (A) Caulonemal tip cells expressing EB1b-mCherry together with the computationally identified tracks of microtubule plus ends labeled by this probe in a wild type and Δkin4-Ia mutant background. One frame from a time sequence is shown. The active tracks corresponding to this frame (i.e., tracks of which an identified comet in this frame is part) are plotted in varying colors. The image is a maximum z-projection of two planes spaced 0.5 µm apart acquired near the cell cortex. Scale bar, 5 µm. (B) Histogram showing the angle distribution for the indicated number of track segments for wild type and Δkin4-Ia cells. Compared with wild type, loss of Kin4-Ia leads to a larger fraction of EB1b-comets moving toward the base of the cell (arrowheads) and causes the comets moving toward the tip to be more aligned to the cell axis (arrow). (C) Contour plots with color map showing the track-segment angle distribution as a function of distance to the cell tip for wild type and Δkin4-Ia cells (the same tracks were used as in B). The slightly higher abundance of track segments with an angle close to that of the cell axis upon Kin4-Ia removal is noticeable from 50 until ∼10 µm from the tip. (D) Microtubule array configuration in caulonemal tip cells visualized through expression of mCherry-α-tubulin in a wild type and Δkin4-Ia background. An overlay with the corresponding MAP65a-citrine signal is given below. Images shown are maximum z-projections of nine planes spaced 0.27 µm apart acquired near the cell cortex. Scale bar, 5 µm. (E) Snapshots showing the microtubule configuration in the apex of growing caulonemal tip cells visualized through mCherry-α-tubulin expression in a wild type and Δkin4-Ia genetic background. In both strains, microtubules form a coalescing focus close to the dome of the apex. Snapshots are maximum z-projections of 10 planes spaced 0.5 µm apart acquired around the median plane. Brackets delineate the areas that were used for generating the heat maps of the time and cell averaged apical microtubule intensity shown below. In brief, these were obtained by first computationally immobilizing growing cell tips, then making an average projection of image data acquired over 15 min and subsequently averaging over the indicated number of cells. The average apical microtubule distribution appeared both more concentrated and more tapered upon loss of Kin4-Ia compared with wild type. Scale bar in the top images, 5 µm; scale bar in the bottom images, 1 µm.

Workflow used for computational tracking of EB1b-labeled comets. Schematic depiction of the workflow for EB1b-comet tracking including images illustrating the steps used. For a full description of the workflow refer to the Materials and methods section. In brief, an input image sequence acquired at two z-planes was used to generate a maximum z-projection. After reducing image noise, an intensity threshold was determined using the maximum entropy method, and the image data was filtered with a DoG kernel. Thresholded areas were further segmented by detecting the local maxima within them using the DoG-filtered data. Only regions bigger than a defined minimum size were retained. An intensity-weighted centroid was then determined for each accepted particle (red circles). Subsequently, the particles were linked frame-to-frame using a published method (Jaqaman et al., 2008) generating short, incomplete tracks. These tracks were then combined into the final tracks using a second global optimization step (lines of varying color; Jaqaman et al., 2008). Within each final track, velocity and angle of particle displacement were determined between frame n and frame n + 5 (referred to as track segments; black arrows). The bracketed area is shown in detail for all image processing steps for clarity. Scale bars, 5 μm.
Workflow used for computational tracking of EB1b-labeled comets. Schematic depiction of the workflow for EB1b-comet tracking including images illustrating the steps used. For a full description of the workflow refer to the Materials and methods section. In brief, an input image sequence acquired at two z-planes was used to generate a maximum z-projection. After reducing image noise, an intensity threshold was determined using the maximum entropy method, and the image data was filtered with a DoG kernel. Thresholded areas were further segmented by detecting the local maxima within them using the DoG-filtered data. Only regions bigger than a defined minimum size were retained. An intensity-weighted centroid was then determined for each accepted particle (red circles). Subsequently, the particles were linked frame-to-frame using a published method (Jaqaman et al., 2008) generating short, incomplete tracks. These tracks were then combined into the final tracks using a second global optimization step (lines of varying color; Jaqaman et al., 2008). Within each final track, velocity and angle of particle displacement were determined between frame n and frame n + 5 (referred to as track segments; black arrows). The bracketed area is shown in detail for all image processing steps for clarity. Scale bars, 5 μm.
Alongside the mild bipolarization in the Δkin4-Ia mutant, we observed an increased alignment of anterograde microtubule growth events to the basal–apical axis of the cell, exemplified by the narrowing of the central peak of EB1b-comet directions (Fig. 4 B; arrow). A stronger longitudinal alignment of microtubules upon loss of Kin4-Ia function (hereafter referred to as hyper-alignment) was also apparent when we visualized the entire microtubule population by expression of a mCherry-α-tubulin probe (Fig. 4 D and Fig. S5 C). Moreover, hyper-alignment of overlap regions to the long axis of the cell in Δkin4-Ia mutant cells was similarly observed (Fig. S5 A). In the mutant cells, the density of overlaps in the cytoplasm increased (Fig. S5 B), highlighting that increased bundling could underpin the decreased orientational freedom of microtubules. In the median plane of the cell, we further noticed that vacuoles were more fragmented parallel to the longitudinal cell axis in the mutant situation (Fig. S5, D and E). Since the distribution of the vacuole in P. patens depends on microtubules (Oda et al., 2009), this is most likely the result of the hyper-alignment of the microtubule network. Interestingly, spatial mapping of growth events in the Δkin4-Ia mutant showed a rather homogenous longitudinal alignment of microtubule growth up to 10 µm away from the cell tip from which growth angles strongly diverged. In the wild type situation, the apical area in which polymerization angles started to diverge relative to the more basal areas of the cell appeared to be in the range of 20 µm (Fig. 4 C). In an attempt to link these changes in microtubule organization to the growth phenotype, we investigated whether the alignment of microtubules in the apex is reflected in the apical microtubule focus. This structure is shown to consist of a bundle of coalescing microtubules that directs apical cell expansion (Hiwatashi et al., 2014; Wu and Bezanilla, 2018; Yamada and Goshima, 2018; Fig. 4 E). Due to the dynamic, cyclical appearance and disappearance of the apical microtubule focus (Hiwatashi et al., 2014), we imaged microtubules in multiple growing cells for 15 min and then averaged the mCherry-α-tubulin signal to extract the dominant shape and residence characteristics of the focus (Fig. 4 E, bottom). This revealed that upon Kin4-Ia removal, a more tapered and more sharply defined area containing a high average microtubule density was present, indicating that stronger microtubule alignment impacts the apical microtubule focus. Although, at this point, we lack a mechanistic understanding of how the apical microtubule focus is linked to the spatial regulation of tip growth, the sharper focusing of this structure is a likely cause for the more stringent growth axis observed in Δkin4-Ia mutants (Fig. 1, D–G).

Colony appearance of mCherry-α-tubulin expressing strains and indicators of microtubule network hyper-parallelization. (A) Contour plots with color map showing the angle distribution of MAP65a-citrine labeled overlaps as a function of distance to the cell tip for wild type and two Δkin4-Ia mutant lines. Upon Kin4-Ia removal, overlaps show closer alignment with the cell axis relative to the wild type situation. (B) Boxplots showing the density of MAP65-decorated overlaps in the cytosol of wild type and Δkin4-Ia cells, expressed as absolute number of overlaps per volume and length of overlap per volume (both averaged per cell). Asterisks denote statistically significant differences (*P < 0.05 and **P < 0.001 in an unpaired Student’s t test). The whiskers indicate minimum/maximum observed values or 1.5 times the interquartile range when outliers (displayed as a dot) were present. (C) Colony appearance of moss lines with an introduced mCherry-α-tubulin expression constructs in a wild type and Δkin4-Ia genetic background. For each moss line, three independent transformants are shown. Introduction of the expression construct did not lead to altered colony size or morphology which would indicate growth defects. Plants were photographed after 5 wk of growth on BCD agar plates. Scale bar, 1 mm. (D) Topology of the microtubule network in the median plane of a wild type and Δkin4-Ia caulonemal tip cell visualized through expression of mCherry-α-tubulin. A brightfield image of the imaged cell is shown above and an overlay with the corresponding MAP65a-citrine signal is given below. Here, the arrowheads illustrate the section transverse to the length axis, 25 µm from the tip used for counting the degree of vacuolar partitioning as presented in E. Vacuole compartments separated by transvacuolar strands are indicated with an asterisk. Images of the fluorescent probes are maximum z-projections of nine planes spaced 0.27 µm apart. Scale bar, 5 µm. (E) Histogram showing quantification of the amount of vacuole compartments measured 25 µm from the cell tip that were visible in the median plane for the indicated amount of wild type and Δkin4-Ia caulonemal tip cells. The vacuolar compartments in Δkin4-Ia showed a higher degree of fragmentation parallel to the length axis of the cell than recorded for wild type (P = 0.033 in a Mann–Whitney U test). The boxplots presented on the right show that the average cell width recorded at the location where vacuole measurements were taken was similar for wild type and Δkin4-Ia cells (P > 0.05 in an unpaired Student’s t test). The whiskers indicate minimum/maximum observed values.
Colony appearance of mCherry-α-tubulin expressing strains and indicators of microtubule network hyper-parallelization. (A) Contour plots with color map showing the angle distribution of MAP65a-citrine labeled overlaps as a function of distance to the cell tip for wild type and two Δkin4-Ia mutant lines. Upon Kin4-Ia removal, overlaps show closer alignment with the cell axis relative to the wild type situation. (B) Boxplots showing the density of MAP65-decorated overlaps in the cytosol of wild type and Δkin4-Ia cells, expressed as absolute number of overlaps per volume and length of overlap per volume (both averaged per cell). Asterisks denote statistically significant differences (*P < 0.05 and **P < 0.001 in an unpaired Student’s t test). The whiskers indicate minimum/maximum observed values or 1.5 times the interquartile range when outliers (displayed as a dot) were present. (C) Colony appearance of moss lines with an introduced mCherry-α-tubulin expression constructs in a wild type and Δkin4-Ia genetic background. For each moss line, three independent transformants are shown. Introduction of the expression construct did not lead to altered colony size or morphology which would indicate growth defects. Plants were photographed after 5 wk of growth on BCD agar plates. Scale bar, 1 mm. (D) Topology of the microtubule network in the median plane of a wild type and Δkin4-Ia caulonemal tip cell visualized through expression of mCherry-α-tubulin. A brightfield image of the imaged cell is shown above and an overlay with the corresponding MAP65a-citrine signal is given below. Here, the arrowheads illustrate the section transverse to the length axis, 25 µm from the tip used for counting the degree of vacuolar partitioning as presented in E. Vacuole compartments separated by transvacuolar strands are indicated with an asterisk. Images of the fluorescent probes are maximum z-projections of nine planes spaced 0.27 µm apart. Scale bar, 5 µm. (E) Histogram showing quantification of the amount of vacuole compartments measured 25 µm from the cell tip that were visible in the median plane for the indicated amount of wild type and Δkin4-Ia caulonemal tip cells. The vacuolar compartments in Δkin4-Ia showed a higher degree of fragmentation parallel to the length axis of the cell than recorded for wild type (P = 0.033 in a Mann–Whitney U test). The boxplots presented on the right show that the average cell width recorded at the location where vacuole measurements were taken was similar for wild type and Δkin4-Ia cells (P > 0.05 in an unpaired Student’s t test). The whiskers indicate minimum/maximum observed values.
Discussion
We have shown that Kin4-Ia is recruited to MAP65-decorated antiparallel microtubule overlaps where it suppresses polymerization of microtubule plus ends. In moss protonemal tip cells, a microtubule plus end that grows toward the base of the cell, (i.e., in the direction opposite of the dominant polarity) is expected to promptly find an antiparallel bundling partner. In contrast, a microtubule end that grows along the dominant direction toward the tip is far less likely to do so. This unequal likelihood of engaging in an antiparallel encounter in combination with the action of the MAP65/kinesin-4 module would thus translate into growing microtubules having differential lifetimes depending on their growth direction. As such, this mechanism preferentially suppresses microtubule polymerization opposite to the dominant, tip-focused microtubule orientation in tip-growing moss cells. This results in a microtubule array in which a high degree of unipolarity is maintained. The MAP65/kinesin-4 dependent mechanism that we identified is a novel addition to the cellular toolbox for polarity control in disperse microtubule networks, which consists chiefly of mechanisms based on directed nucleation and sorting by molecular motors (Janson et al., 2005; Thawani et al., 2019; Doodhi et al., 2014; Nédélec et al., 2003). Unlike these well-established mechanisms, however, the MAP65/kinesin-4 module is not expected to have an intrinsic asymmetry in the way it affects the two microtubule partners participating in an encounter. Thus, in situations where network polarity is being established de novo, such as at the end of cell division, other mechanisms are required for initial symmetry breaking. In other words, we propose that the action of antiparallel bundling and growth termination is insufficient to establish a certain microtubule network polarity, but rather is an effective tool in exaggerating/reaffirming an existing bias in the network to arrive at and maintain uniform network polarity. This implies that there are boundary conditions for where this mechanism works, such as a threshold level of pre-existing polarity and a minimum number of anti-parallel encounters in the network. Comprehending these will give us a more detailed understanding of how this mechanism may be integrated with other polarity-controlling mechanisms.
In previous work, we have demonstrated that kinesin-4 functions in limiting microtubule overlap length in the cytokinetic phragmoplast of moss cells (de Keijzer et al., 2017). This finding showed striking functional and molecular resemblance with the already described mechanisms of overlap length control in the animal spindle midzone (Bieling et al., 2010; Kurasawa et al., 2004). Given the large evolutionary distance between the animal and plant kingdoms, this indicates that an antiparallel crosslinker/kinesin-4 module is a deeply conserved mechanism to build microtubule arrays for cell division. We now show that the same module is used to control microtubule polarity and orientation in interphase cells. Considering the evolutionary conservation of MAP65/kinesin-4 module functioning, it will be interesting to see whether it also plays similar roles beyond shaping the division apparatus in other cell systems. Recent findings in large asters formed in the Xenopus zygote indicate that the crosslinker/kinesin-4 module Prc1E/Kif4A active here contributes to the radial ordering of microtubules within the aster (Nguyen et al., 2018). The proposed responsible mechanism also relies on antiparallel encounters and subsequent Kif4a-mediated growth termination, indicating that this may be a recurring instrument to reinforce microtubule network polarity.
The moderate decrease of unipolarity and hyper-alignment of the microtubule network that we observed upon deletion of Kin4-Ia was accompanied by a more persistent growth direction and delayed gravitropic response, but not impairment of the ability for tip growth. How can the stabilization of the growth path be linked to the observed defects in the microtubule array? We propose a scenario in which the tip-growth process integrates multiple signals and makes decisions based on their relative strengths. One signal stems from the microtubule cytoskeleton that lines up within the elongated geometry of the cell, and in doing so, communicates the shape of the cell to the tip. This driver for persistent growth competes with signals that aim to steer the expanding cell in other directions. In such a scenario, an increase in the signal for persistent growth through hyper-parallelization of the microtubule array will affect the ability to steer in response to environmental cues, as observed in the Δkin4-Ia mutant. Note that this may hold independently from whether environmental cues act through microtubules or execute their effect on the growth process via other pathways. There is thus a trade-off between persistence of growth direction and responsiveness to environmental cues, and cells need to balance the strength of regulating signals. The developmental strategy of an organism may determine the optimal relative strength of the intrinsic cue. For instance, seed plant root hairs extend from the root surface to take up water and nutrients from the environment. They do so most efficiently by growing straight, at a right angle with respect to the root long axis (Bibikova et al., 1997; Bibikova et al., 1999; Ketelaar et al., 2003). As such, after encountering an obstacle, root hair growth recovers in the original direction, a process mediated by the microtubule cytoskeleton (Bibikova et al., 1999; Sieberer et al., 2005). Similarly, during elongation of fission yeast, the microtubule network strongly imposes the growth direction (Mata and Nurse, 1997; Huisman and Brunner, 2011; Chang and Martin, 2009). In other cell types, where growth requires more pronounced steering from environmental stimuli, such as neurites (Kahn and Baas, 2016; Baas and Lin, 2011) and moss caulonemal cells (our results), the intrinsic cue is likely to be less dominant as in root hairs, which is reflected by their less rigid growth paths. Given that microtubules recurrently provide internal positional cues to the growing apex in a wide range of eukaryotic cells, an interesting focus for future studies will be to determine whether conserved factors are operational to control the strength of the intrinsic microtubule-based signal.
By what mechanisms can the Kin4-Ia and MAP65 module that acts on microtubule overlaps throughout the cell body affect growth locally at cell tips? Our findings link the hyper-alignment of microtubules to the architecture of the microtubule focus near the tip. This focus is cyclically generated by convergence of growing microtubules basally in the cell into a single bundle just under the cellular apex (Hiwatashi et al., 2014). This process is part of a feedback loop with a localized actin accumulation at the same site that fosters growth processes at the tip (Bibeau et al., 2021; Wu and Bezanilla, 2018). In addition to an intact actin network, the generation of the microtubule focus relies on several motor proteins, including kinesins KCH and KINID and class 8 myosins (Hiwatashi et al., 2014; Yamada and Goshima, 2018; Wu and Bezanilla, 2018). Our results now suggest that the initial topology of the microtubule network away from the tip contributes to the shape of the focus. As a driving mechanism, we propose that by reducing the number of interactions between microtubules, Kin4-Ia increases the orientational freedom of cytoplasmic microtubules that converge into a focus, which allows for fluctuations in its morphology and position, ultimately allowing for more fluctuations and steerability of tip growth. Such a notion is congruent with findings in kinesin-8 and kinesin-13 mutants (Leong et al., 2020). In these mutants, the position of the focus shows more fluctuations. This positional drift precedes changes in growth direction and ultimately leads to a more wavy pattern of tip growth (Leong et al., 2020). Since the focus provides information about the stability of the microtubule network to growth direction, in the case of the kinesin-4 mutant, our question then narrows down to how removal of kinesin-4 decreases orientational disorder in the microtubule network? First, kinesin-4 is an inhibitor of microtubule growth, and its removal is anticipated to cause an overall lengthening of microtubules (Freed, 2002). Longer microtubules are expected to have an increased tendency to align along the cell's long axis through physical confinement by the cell wall (Ambrose and Wasteneys, 2012; Alvarado et al., 2014). Moreover, because removal of kinesin-4 leads to mild array bipolarization, one can expect a higher frequency of interactions between retrograde- and anterograde-oriented microtubules in the network. Through entrainment (possibly aided by bundling proteins like MAP65), interacting microtubules adjust their orientation with each other, lowering dispersion (Wasteneys and Ambrose, 2009). This orientational averaging indeed appears to rely in part on antiparallel encounters because the highly increased alignment of overlap areas to the longitudinal cell axis in the kinesin-4 mutant is accompanied by an increase in overlap density (Fig. S5, A and B). We thus hypothesize that an overall increase in microtubule length and bundling upon kinesin-4 knockout caused microtubule hyper-parallelization, which is ultimately reflected in a more persistent growth process through a more defined microtubule focus.
Materials and methods
Plasmids and cloning procedures
Plasmids used were typically generated using standard restriction–ligation cloning procedures and were verified by sequencing. The use of plasmids is summarized in Table 1 and all primers are listed in Table 2. Accession numbers for proteins in this manuscript (using P. patens genome V3.3 release format) are MAP65a (Pp3c11_12850V3.1), MAP65c (Pp3c2_23900V3.1), Kin4-Ia (Pp3c3_9850V3.1), and EB1b (Pp3c20_6890V3.1).
List of plasmids used in this study
| Plasmid | Usage | Source |
|---|---|---|
| MAP65a-mCherry | C-terminal mCherry tagging of MAP65a | de Keijzer et al., 2017 |
| EF1-mCherry-tua-BsdR (pTM426) | EF1α-promoter driven expression of mCherry-α-tubulin | Kosetsu et al., 2017 |
| EB1b-mCherry | C-terminal mCherry tagging of expressed EB1-homolog EB1b | This study |
| pTM374 | C-terminal citrine tagging of Kin4-Ia | Miki et al., 2014 |
| pTM365 | C-terminal citrine tagging of Kin4-Ic | Miki et al., 2014 |
| pDEST22/32-MAP65a | Activation domain and binding domain (AD/BD) fusion to MAP65a for use in Y2H | This study |
| pDEST22/32-MAP65c | AD/BD fusion to MAP65c for use in Y2H | This study |
| pDEST22/32-Kin4-Ia-FL | AD/BD fusion to FL Kin4-Ia for use in Y2H | This study |
| pDEST22/32-Kin4-Ia-414 | AD/BD fusion to Kin4-Ia C-terminal fragment after 414th amino acid for use in Y2H | This study |
| pDEST22/32-Kin4-Ia-727 | AD/BD fusion to Kin4-Ia C-terminal fragment after 727th amino acid for use in Y2H | This study |
List of primers used in this study
| Primer | Use | Sequence (5′ > 3′) | Restriction site |
|---|---|---|---|
| JK206 | Kin4-Ia deletion genotyping | 5′-TTTGAGGTGTATCACCCAGTTTCG-3′ | - |
| JK207 | Kin4-Ia citrine tagging genotyping | 5′-GGAGGAAAGTGATGGCGAAAGAGC-3′ | - |
| JK208 | Kin4-Ia deletion/citrine tagging genotyping | 5′-GCAGGAAGCACGAGCTAAGACC-3′ | - |
| JK161 | Genotyping of MAP65a locus | 5′-GGATGAGAACCGATTTGCGAGC-3′ | - |
| JK162 | Genotyping of MAP65a locus | 5′-GCGGTAAGAAAGTGGAGAGAAGC-3′ | - |
| JK87 | Cloning of EB1b left targeting arm | 5′-GGGGTACCCAGCTGATGGACGTAGTGCACC-3′ | KpnI |
| JK88 | Cloning of EB1b left targeting arm | 5′-CCCAAGCTTCTCTAAAAGATCCTTACTGTCGTCG-3′ | HindIII |
| JK124 | Cloning of EB1b right targeting arm | 5′-TGTTGACGGCACTATTACTCGC-3′ | - |
| JK90 | Cloning of EB1b right targeting arm | 5′-TCCCCGCGGTATGGACACTCACCAGGCAACC-3′ | SacII |
| JK114 | Sequence downstream of resistance cassette | 5′-ACTCAAGAGGATAAAACCTCACC-3′ | - |
| JK111 | Construct sequencing general | 5′-GATTAAGTTGGGTAACGCCAGG-3′ | - |
| JK116 | Construct sequencing general | 5′-ACACAGGAAACAGCTATGACC-3′ | - |
| JK129 | Sequencing region upstream of mCherry | 5′-CCCTTGGTCACCTTCAGCTTGG-3′ | - |
| JK156 | Genotyping of EB1b locus | 5′-CATTTGTGGGTATGTGGGTTGG-3′ | - |
| JK157 | Genotyping of EB1b locus | 5′-TGACAAAGGGAGAATAAAAGAGGTGG-3′ | - |
| JK210 | Kin4-Ic citrine tagging genotyping | 5′-ACTGACCTGCCACATTCCGAGC-3′ | - |
| JK211 | Kin4-Ic citrine tagging genotyping | 5′-TTGACTTGTGTGGAATCTTGGATGC-3′ | - |
| JK406 | Cloning of Kin4-Ia-FL CDS (coding sequence) for Y2H | 5′-CACCTGCGAAACAATGGAGAGAACCAAC-3′ | - |
| JK407 | Cloning of Kin4-Ia-414 CDS for Y2H | 5′-CACCCAGCGCATGAGGCATCAGCTG-3′ | - |
| JK408 | Cloning of Kin4-Ia-727 CDS for Y2H | 5′-CACCGTCTGGAAAGCACAAAGAGAGAAG-3′ | - |
| JK409 | Universal R primer for Kin4-Ia CDS cloning for Y2H | 5′-TCACCGCCGTAAAGTGGAACGAATG-3′ | - |
| HT124 | Cloning of MAP65a CDS for Y2H | 5′-CACCATGGGCCAGCAACCTGGA-3′ | - |
| HT125 | Cloning of MAP65a CDS for Y2H | 5′-TTACGCGTCGATACAGGGAAC-3′ | - |
| HT126 | Cloning of MAP65c CDS for Y2H | 5′-CACCATGGGTCAGCAACCTGTTGTC-3′ | - |
| HT127 | Cloning of MAP65c CDS for Y2H | 5′-TCAGCTGTTCATGCTTTTCCA-3′ | - |
EB1b-mCherry-BsdR
An ∼1.2 kb region downstream of the EB1b gene stop codon was amplified using primers JK124 and JK90, digested with SacII, and ligated into SmaI/SacII digested pmCherry-LoxP-BsdR (de Keijzer et al., 2017). An ∼1.1 kb region upstream of the stop codon was subsequently amplified using primers JK87 and JK88 and introduced via KpnI and HindIII sites. The resulting tagging construct was digested with SmaI and SacII before transformation.
Plasmids for yeast-two-hybrid
The coding sequences for proteins/protein fragments were PCR-amplified from a cDNA library generated from 6-d-old protonemal tissue with a forward primer containing the sequence CACC to enable subsequent cloning into the pENTR/D-TOPO gateway entry vector. Next, the coding sequences were inserted into both the pDEST22 and pDEST32 destination vectors via a Gateway LR reaction.
P. patens growth conditions and transformation
P. patens tissues were routinely grown on BCDAT (1 mM MgSO4, 1.837 mM KH2PO4 [pH 6.5], 10 mM KNO3, 45 µM FeSO4, 0.22 µM CuSO4, 9.93 µM H3BO3, 0.23 µM CoCl2, 0.10 µM Na2MoO4, 0.19 µM ZnSO4, 2 µM MnCl2, 0.17 µM KI, 1mM CaCl2, 5 mM ammonium tartrate, and 0.8 % [w/v] Phytoagar) plates under continuous light unless stated otherwise. Plasmids were linearized and introduced into the P. patens genome by homologous recombination using polyethylene glycol–mediated protoplast transformation (Nishiyama et al., 2000). Correct insertion events were characterized by PCR. Characteristics of generated moss lines and their use throughout the study are summarized in Table 3. For imaging, protonemal tissue was grown on BCD medium (as BCDAT above, but omitting ammonium tartrate) in glass-bottom dishes.
List of moss strains used in this study
| Name | Experimental use | Main clone used | Background strain | Plasmid transformed | Figure | Reference |
|---|---|---|---|---|---|---|
| Kin4-Ia-citrine | Generating Kinesin4-Ia + antiparallel overlap colocalization strain | #43 | WT | pTM374 | - | Miki et al., 2014; de Keijzer et al., 2017 |
| Kin4-Ia-citrine/MAP65a-mCherry | Kinesin4-Ia + antiparallel overlap colocalization | #121 | Kin4-Ia-citrine | MAP65a-mCherry | 1, B and C; 3, E–I; S2, A and E | This study |
| MAP65a-citrine | Overlap visualization/Kin4-Ia knock-out construction | #2 | WT | See reference | 1, D–G, 2; S2, B and F–I; S5, A and B | Kosetsu et al., 2013 |
| MAP65a-citrine/∆kin4-Ia | Measuring effect of Kin4-Ia removal on overlap dimension and cell tip growth | #7 and #122 | MAP65a-citrine | See reference | 1, D–G; 2; S2, B and F–I; S5, A and B | de Keijzer et al., 2017 |
| MAP65a-citrine/∆kin4-Ic | Measuring effect of Kin4-Ic removal on overlap dimension | #172 | MAP65a-citrine | See reference | S2 D | de Keijzer et al., 2017 |
| MAP65a-citrine/∆kin4-Ic/∆kin4-Ia | Measuring effect of combined Kin4-Ia and Kin4-Ic removal on overlap dimension | #66 | MAP65a-citrine/∆kin4-Ic | See reference | S2 D | de Keijzer et al., 2017 |
| MAP65c-citrine | Generating overlap + EB1b co-localization strain | #5 | WT | See reference | - | Kosetsu et al., 2013 |
| MAP65c-citrine/MAP65a-mCherry | Co-localization of different MAP65 paralogs at overlaps | #90 | MAP65c-citrine | MAP65a-mCherry | S2, A and C | This study |
| MAP65c-citrine/EB1b-mCherry | Polymerization visualization in overlaps/plus end tracking | #100 | MAP65c-citrine | EB1b-mCherry | 3, A–C; 4, A–C; S3, A–D; S4 | This study |
| MAP65a-citrine/∆kin4-Ia/EB1b-mCherry | Measuring effect of Kin4-Ia removal on polymerization dynamics in overlaps and orientation of polymerization in general | #96 | MAP65a-citrine/∆kin4-Ia #7 | EB1b-mCherry | 3, A–C; 4, A–C; S3, A–D; S4 | This study |
| MAP65a-citrine/mCherry-α-tubulin | Microtubule cytoskeleton + antiparallel overlap visualization | #426 | MAP65a-citrine | EF1-mCherry-tua-BsdR | 1 A; 4, D and E; S1 A; S5, C–E | This study |
| MAP65a-citrine/∆kin4-Ia/mCherry-α-tubulin | Measuring effect of Kin4-Ia removal on microtubule-network architecture and apical focussing | #14 | MAP65a-citrine/∆kin4-Ia #7 | EF1-mCherry-tua-BsdR | 4, D and E; S5, C–E | This study |
| EF1-mCherry-α-tubulin | Generating Kin4-Ia/Kin4-Ic + microtubule array colocalization strains | #52 | WT | EF1-mCherry-tua-BsdR | - | Kosetsu et al., 2017 |
| EF1-mCherry-α-tubulin/Kin4-Ia-citrine | Localization screen of all P. patens kinesin-4s in caulonemal tip cells | #22 | EF1-mCherry-α-tubulin | pTM374 | S1B | This study; Miki et al., 2014 |
| Act-mCherry-α-tubulin/Kin4-Ib-citrine | Localization screen of all P. patens kinesin-4s in caulonemal tip cells | #12 | Act-mCherry-α-tubulin | See reference | S1B | Miki et al., 2014 |
| EF1-mCherry-α-tubulin/Kin4-Ic-citrine | Localization screen of all P. patens kinesin-4s in caulonemal tip cells | #19 | EF1-mCherry-α-tubulin | pTM365 | S1B | This study; Miki et al., 2014 |
| Act-mCherry-α-tubulin/Kin4-Id-citrine | Localization screen of all P. patens kinesin-4s in caulonemal tip cells | #8 | Act-mCherry-α-tubulin | See reference | S1B | Miki et al., 2014 |
| Act-mCherry-α-tubulin/Kin4-Ie-citrine | Localization screen of all P. patens kinesin-4s in caulonemal tip cells | #14 | Act-mCherry-α-tubulin | See reference | S1B | Miki et al., 2014 |
| Act-mCherry-α-tubulin/Kin4-IIa-citrine | Localization screen of all P. patens kinesin-4s in caulonemal tip cells | #2 | Act-mCherry-α-tubulin | See reference | S1B | Miki et al., 2014 |
| Act-mCherry-α-tubulin/Kin4-IIb-citrine | Localization screen of all P. patens kinesin-4s in caulonemal tip cells | #5 | Act-mCherry-α-tubulin | See reference | S1B | Miki et al., 2014 |
| Act-mCherry-α-tubulin/Kin4-IIc-citrine | Localization screen of all P. patens kinesin-4s in caulonemal tip cells | #9 | Act-mCherry-α-tubulin | See reference | S1B | Miki et al., 2014 |
Gravistimulation of moss colonies
P. patens colonies were initiated from small protonemal fragments on BCDAT plates supplemented with 0.5% (wt/vol) glucose and allowed to grow for 2 wk under continuous light. Plates were then put in an upright position in the dark for 5 wk. Outgrowth from the colonies was then photographed with a Bio-Rad ChemiDoc XRS + imaging system using transillumination.
Fluorescence microscopy
In all fluorescence microscopy experiments, interphase caulonemal tip cells were used. Imaging was performed on a spinning-disk confocal microscope consisting of a Nikon Ti-eclipse body equipped with a Yokogawa CSU-X1 spinning-disk head and 100× Plan Apo VC objective (NA 1.40). Image digitization was either done with a Photometrics Evolve 512 EMCCD or Prime 95B sCMOS camera with a 1.2× post-magnification fitted in front of the camera or an Andor iXon 3 model 888 with a 2× post-magnification fitted in front of the camera. Typical exposures used were 500–1,000 ms while employing a camera electron multiplication gain of 300. For imaging of citrine, an excitation wavelength of 491 nm in combination with a 527/60 bandpass emission filter was used, and for imaging of mCherry, 561 nm excitation light in combination with a 595/50 or 607/36 bandpass emission filter was used. All components were operated by MetaMorph software.
For synchronized imaging of MAP65 labeled with citrine and mCherry-tagged EB1b, the excitation light for both probes was delivered simultaneously and their emission light was first filtered (495–550 nm and >575 nm) and then split using a Photometrics DV2 Multichannel Imaging System. Beam-splitting was achieved with a T565lpxr dichroic mirror (Chroma) with additional bandpass filtering at 495–540 nm for citrine and 570–620 nm for mCherry.
Long-term imaging of tip growth
Long-term observation of tip growth was done with bright field microscopy using continuous sample illumination with white light from a Nikon D-LH/LC halogen lamp filtered through an NCB11 filter and a 10× Plan Fluor objective (NA 0.30). Images were captured with either a Photometrics Evolve 512 EMCCD camera with a 1.2× post-magnification fitted in front of the camera or directly with a Photometrics CoolSNAP HQ2 CCD camera.
Image analysis
All image analyses were performed using the FIJI distribution of ImageJ 1.51 and custom-written MATLAB scripts. Measurements were only taken throughout the first 50 µm from the cell apex since this always excluded the nucleus in the observed cells. When dynamics of overlaps are presented only entire overlap formation events were used. An overlap formation event was defined as the de novo generation of a MAP65-labeled overlap region within the imaged observation plane(s) visible as an extending, bar-shaped signal. For display purposes, all images in the manuscript were rotated (bicubic interpolation) such that the cell tip pointed to the right-hand side.
MAP65a/Kin4-Ia colocalization assessment
Z-stacks of MAP65a-mCherry and Kin4-Ia-citrine signals acquired along 20 planes spaced 0.4 µm apart were first z-projected (maximum intensity). Then, MAP65a-mCherry–labeled overlaps were identified and the presence of Kin4-Ia-citrine fluorescence at the same location was manually scored. When chloroplast autofluorescence obstructed colocalization assessment, the original z-stack was consulted and when also here unequivocal assessment was impossible, an “uncertain” category was assigned.
Observation of MAP65a/Kin4-Ia dynamics
Overlap formation events were isolated and scored manually for the occurrence of a “spur” of Kin4-Ia-citrine fluorescence away from the MAP65a-labeled overlap region. For measurements on Kin4-Ia linear motility within spurs, overlap formation was first identified by monitoring of the MAP65a-mCherry signal, after which the Kin4-Ia-citrine signal was acquired at a high frame rate. Kymographs of the Kin4-Ia-citrine signal were generated using MetaMorph (linewidth 5 pixels, using average value across width). The steepness and horizontal extension of lines in the resultant kymographs were used to determine particle velocity and run length respectively.
Overlap angle, length, and tip distance measurements
Z-stacks of overlaps labeled either with MAP65a-citrine or MAP65a-mCherry acquired along 20 planes spaced 0.4 µm apart were first z-projected (maximum intensity). Along the length axis of continuous, bar-shaped signals, a straight line segment was drawn in ImageJ of which length, angle, and centroid were determined. Measured angles were subtracted from the angle of the longitudinal axis of the cell. The distance to the tip was defined as the horizontal distance between a line segment’s centroid and the cell tip after aligning the longitudinal axis of the cell with the x-axis of the image frame. Contour plots with color map of the angle distribution of overlaps as a function of distance to the cell tip were made by first sorting data according to tip distance in 2-µm bins. Then, for each distance bin, a normalized, overlap length-weighted distribution of overlap angles divided into 12° bins was generated.
Measurement of overlap extension rates
Kymograph representations of overlap formation events visualized with MAP65a-citrine were produced using the ImageJ KymographBuilder plugin. The generated kymographs were then used to measure the maximum acquired overlap length, as well as the time needed to reach this length. The maximum acquired length was defined as the length of the overlap at the moment before it would either stop extending, start shrinking, or would be severed and break apart (also see scheme in Fig. 2 C). For overlap extension rate calculation, the maximum length was divided by the time taken to reach that length.
Categorization of EB1b-comet direction and measurement of comet dynamics in overlaps
EB1b-mCherry image data was first denoised using MetaMorph plugin Safir 1.0.3 in 2D+t mode (see also Fig. S3 B). The denoised EB1b image sequences were then overlaid with the covisualized MAP65-labeled overlaps, and overlap formation events were isolated. Kymographs of events were made for both signals using the KymographBuilder plugin in ImageJ. Scoring of the association of EB1b-comets with overlap formation including their direction relative to the cell tip was done by analysis of both overlaid time-lapse sequences and kymographs. The kymographs of overlap formation events with EB1b association were subsequently used to determine EB1b-comet velocities and lifetimes. The steepness of the lines generated by EB1b-comets was used to obtain velocities, and the time during which comets remained associated with the MAP65 signal was measured to obtain comet lifetimes.
Tracking of EB1b-comets
The workflow and input parameters used for generating EB1b-comet trajectories and their subsequent analysis are schematically outlined in Fig. S4.
An image sequence of EB1b-mCherry signal acquired at two confocal z-planes in the cell cortex was projected along the z-axis (maximum intensity). Noise in the resultant image sequence was then suppressed using MetaMorph plugin Safir 1.0.3 in 2D+t mode (Boulanger et al., 2010). Owing to the relatively weak signal and use of electron multiplication gain in the imaging setup, we assumed photon shot noise to be the dominant noise component in the final image, therefore using “Poisson” as the noise type.
Subsequently, to identify EB1b-comets against the cytoplasmic background signal, a first segmentation step was performed by applying a global threshold obtained using the maximum entropy method employing 500 bins in the intensity histogram (Kapur et al., 1985). As the resulting areas were often composed of multiple features, further intensity-based segmentation was performed. For this, first, the local intensity maxima generated by individual comets were enhanced by convolving the image with a Difference of Gaussians (DoG) kernel. This form of bandpass filtering uses a subtraction of two Gaussian kernels with different standard deviation (σ). The first σ was chosen based on a Gaussian approximation of the point spread function describing the lateral resolution limit of the microscope setup and fluorophore used (0.68 px; Zhang et al., 2007). The second σ was selected such that the filter would give a maximum response at the length scale of a comet, thus preserving information in the range of comet spatial frequencies (Matov et al., 2010). As the measured average comet length was 4.4 pixels (n = ±4,300 comets), a σ of 3.1 pixels was used.
Then, using the DoG convolved image data, intensity-based segmentation was performed by stepwise application of an increasingly lower segmentation threshold within the areas identified with the global threshold earlier. In this way, intensity peaks are first detected which are then allowed to grow in each successive segmentation step until reaching the minimum intensity level or merging with a neighboring peak. When two growing peaks would fuse together, the two original areas obtained at a higher segmentation threshold are retained, thereby allowing the detection of individual particles which were before classified as a single object peak using the global intensity threshold. The step size for intensity-based segmentation was the three-frame average of intensity standard deviation obtained from one frame before till one after the current frame. A minimum of two steps was enforced for segmentation. After completing the intensity-based segmentation, only areas bigger than two pixels were retained.
Next, an intensity-weighted centroid for the finally accepted areas was determined using the intensities of the noise-suppressed image data. The coordinates of these centroids were then passed to the “robust single-particle tracking” framework published by Jaqaman et al. (2008). This code first links particles in a frame-to-frame manner based on a linear assignment problem. For this, a cost matrix containing the costs for potential links between particles in consecutive frames and the cost for birth and death of tracks is solved. The linking cost for particles is based on a prediction of a track’s propagation in time calculated through a Kalman filtering procedure (Jaqaman et al., 2008). Since the tracks obtained from this step are usually incomplete due to limitations in imaging (e.g., comets temporarily moving out of the imaged focal planes), a second global optimization step, achieved through solving another linear assignment problem, is performed yielding the final tracks (Jaqaman et al., 2008).
Finally, the displacement characteristics of tracked particles were analyzed. For this, time-averaged track segments were used to determine growth rates and the angle of displacement. Track segments spanned a particle’s position spaced five frames apart. Displacement was determined with a time-average instead of on a frame-to-frame basis as this suppressed the adverse effects of the placement error of the intensity-weighted centroid. This error is introduced by the modulation transfer function of the used microscope setup and is enhanced by the confined area retained after segmentation. The recorded particle angles were corrected with the angle of the cell such that tip-ward particle motion was equal to 0°. Contour plots with color map of the angle distribution of track segments as a function of distance to the cell tip were made by first sorting data according to tip distance in 2.5-µm bins. Then, for each distance bin, a normalized distribution of track segment angles divided into 8° bins was generated.
Analysis of apical microtubule structure in growing cells
First, cell displacement caused by tip growth was countered by recording the position of the tip at the start and end of imaging. The inferred linear path between these points was used to translate the consecutive frames of the z-projected movie (maximum intensity) using an affine transform (bicubic interpolation) creating alignment with the first frame. Then, the apical area containing the microtubule focus was cropped to a 4 × 4 µm square, the corners of which touched the edge of the apical dome (See Fig. 4 E). The time-lapse image data in this area was subsequently projected (average intensity) for each imaged cell. The intensities of these average projections were normalized and then averaged per genotype.
Tracking of tip growth
From the long-term time-lapse imaging series of caulonemal outgrowth, individual areas containing the growing cell tips were obtained and subdivided into 4-h time periods. Then, for each growth period, the apex of the cell (defined as the place with the highest local curvature) was manually determined at 4-min intervals using the point tool in Fiji. The centroid locations were then smoothed using locally weighted linear regression analysis (employing quadratic polynomial regression and a span width of 15%). The obtained smoothened paths were then used for determination of the distance traversed by the tip and, by dividing this distance with the observation time, used to calculate the average growth speed. A simple linear regression analysis of the smoothened tip tracks was performed to obtain an idealized linear path for each growing tip, which was used to calculate the relative straightness of a tip’s trajectory (see also Fig. 1 F).
Angle determination of gravistimulated colony outgrowth
Filament angles were determined with the OrientationJ Distribution plugin (Püspöki et al., 2016) employing a Gaussian window standard deviation of 0.85 pixels, a minimum coherency of 10%, and a minimum energy of 1%. All obtained angles in the region spanning 2 mm at the circumference of the top of the colony were rounded and weighted with their background-corrected pixel intensities. The intensity-weighed angle distributions obtained for 12 colonies were then averaged and displayed in an angular histogram composed of 12° bins.
Cell volume determination
The volume of cytosol required for overlap density calculations (Fig. S5 B) was determined by first convolving the z-stack data of MAP65a-citrine fluorescence with a 3D Gaussian kernel (σx,y = 7 pixels; σz = 2 pixels). Next, using the “3D Objects Counter” function of ImageJ, a threshold was manually set such that the regions of interest touched the cell outline, but did not include vacuoles. Finally, voxel counts were determined and translated to actual cell volumes.
Yeast-two-hybrid
Yeast-two-hybrid assays were performed with a split Gal4 transcription factor system using the HIS3 and ADE2 genes as reporters. For this, pDEST22/32-based constructs (Table 1) were transformed into yeast strain PJ69-4a or PJ69-4α. Autoactivation on His-deficient media was performed for 10 obtained pDEST32 harboring yeast colonies. Next, using transformants with minimal background reporter activity, two separate mating events were performed and used as biological replicates for subsequent testing of growth on different drop-out media (–Leu –Trp –His with different concentrations of 3-amino-1,2,4-triazole [3-AT] or –Leu –Trp –Ade).
Statistical analysis
For statistical validation, data were first tested for normality using the Shapiro–Wilk test (α = 0.05) verified by visual inspection of Q-Q plots. When normality was assumed, data were evaluated using either an unpaired t test (two samples) or a one-way ANOVA analysis (>2 samples). For data where a normal distribution was not assumed, either a Mann–Whitney U test (two samples) or Kruskal–Wallis test with Dunn’s multiple comparisons post-hoc test (>2 samples) was employed. For all statistical analyses, IBM SPSS Statistics version 22 or 23 or R version 3.5.1 was used.
Online supplemental material
Fig. S1 shows the occurrence of MAP65-decorated, antiparallel overlaps within the microtubule network of caulonemal tip cells with a localization survey of all P. patens Kinesin-4 proteins showing that only Kin4-Ia localizes to distinct foci indicative of these overlaps. Fig. S2 shows the generation and validation of P. patens strains with mCherry-tagged MAP65, overlap length dependency on the distance to the tip, overlap lengths in other Kin4 mutants, and modes and speeds of overlap disappearance upon Kin4-Ia removal. Fig. S3 shows the generation and validation of EB1b marker strains, frequency of plus end growth events during overlap formation broken down according to their orientation, and full yeast-two-hybrid results. Fig. S4 shows the workflow used for computational tracking of EB1b-labeled comets. Fig. S5 shows the colony appearance of mCherry-α-tubulin expressing strains and indicators of microtubule network hyper-parallelization.
Acknowledgments
We thank Gohta Goshima and Tomohiro Miki (Nagoya University, Nagoya, Japan) for sharing several citrine-labeled Kinesin-4 lines and for sharing plasmids for α-tubulin labeling. We are grateful to Bela Mulder for advice and support throughout this study. We thank Wilma van Esse, Richard Immink, and Froukje van der Wal (Wageningen University & Research, Wageningen, Netherlands) for their generous support in conducting the yeast-two-hybrid experiments.
Author contributions: Conceptualization—J. de Keijzer, R. Spoordonk, M.E. Janson, and T. Ketelaar; Data curation—J. de Keijzer and R. Spoordonk; Formal analysis—J. de Keijzer, R. Spoordonk, and J.E. Verweij; Funding acquisition—M.E. Janson; Investigation—J. de Keijzer, R. Spoordonk, and J.E. Verweij; Methodology—J. de Keijzer, R. Spoordonk, J. E. Verweij, M.E. Janson, and T. Ketelaar; Project administration—J. de Keijzer and T. Ketelaar; Resources—J. de Keijzer, R. Spoordonk, and J.E. Verweij; Software—J. de Keijzer and J.E. Verweij; Supervision—J. de Keijzer, M.E. Janson, and T. Ketelaar; Validation—J.E. Verweij; Visualization—J. de Keijzer and R. Spoordonk; Writing—original draft—J. de Keijzer, M.E. Janson, and T. Ketelaar; Writing—review & editing—all authors.

