


How cells regulate α- and β-tubulin to meet the demand for αβ-heterodimers and avoid consequences of monomer imbalance is not understood. We investigate the role of gene copy number and how shifting expression of α- or β-tubulin genes impacts tubulin proteostasis and microtubule function in Saccharomyces cerevisiae. We find that α-tubulin gene copy number is important for maintaining excess α-tubulin protein compared to β-tubulin protein. Excess α-tubulin prevents accumulation of super-stoichiometric β-tubulin, which leads to loss of microtubules, formation of non-microtubule assemblies of tubulin, and disrupts cell proliferation. In contrast, sub-stoichiometric β-tubulin or overexpression of α-tubulin has minor effects. We provide evidence that yeast cells equilibrate α-tubulin protein concentration when α-tubulin isotype expression is increased. We propose an asymmetric relationship between α- and β-tubulins, in which α-tubulins are maintained in excess to supply αβ-heterodimers and limit the accumulation of β-tubulin monomers.
Introduction
Cytoskeletal networks assemble from thousands of protein building blocks; therefore, the size and architecture of these networks sets a demand for subunit biogenesis and maintenance. That demand varies across organisms, cell types within an organism, and even time within a cell. For example, neurons require extensive microtubule networks for migration, axon formation and extension during development; and trafficking components to and from synapses in mature neurons (Alfadil and Bradke, 2022; Aiken and Holzbaur, 2021). Accordingly, the αβ-tubulin proteins that form microtubules represent ∼25% of the soluble protein in the mouse brain, compared to 3% of the soluble protein in cultured mouse fibroblasts and <1% of soluble protein in the mouse liver (Hiller and Weber, 1978). Within the lifetime of a cell, the demand for tubulin can shift in response to developmental cues or during cell division. For example, the amount of soluble αβ-tubulin protein in HeLa cells more than doubles from G1 to mitosis (Bravo and Celis, 1980). These observations raise the fundamental question of how the biogenesis and maintenance of α- and β-tubulin are coordinated to meet the cytoskeletal demands of a cell.
One potential mechanism for meeting different tubulin demands is through the expansion and diversification of α- and β-tubulin gene families, known as “isotypes.” Isotypes provide tissue-specific function and expression across metazoans (Raff, 1984; Kemphues et al., 1982; Latremoliere et al., 2018; Dumontet et al., 1996). Humans have 8–10 α- and 7–9 β-tubulin isotypes, and these provide a transcriptional modules for creating programs of tubulin expression for different cell types and/or developmental stages (Findeisen et al., 2014; Leandro-García et al., 2010; Park et al., 2021).
However, single-celled organisms also contain tubulin isotypes. For example, the budding yeast Saccharomyces cerevisiae possesses two α-tubulin genes, TUB1 and TUB3, and a single β-tubulin gene, TUB2. The two α-tubulins generate approximately equal levels of mRNA, but different levels of soluble protein (Nsamba et al., 2021; Kilmartin and Adams, 1984; Gupta et al., 2002; Gartz Hanson et al.,. 2016; Barnes et al., 1992). This suggests that tubulin isotypes work additively to supply tubulin, but that the composition of the soluble tubulin pool must also be regulated by additional post-transcriptional mechanisms.
Proteostasis represents a second potential mechanism for meeting tubulin demand. Here, we considered tubulin proteostasis to consist of the biogenesis of α- and β-tubulin monomers, the equilibrium between monomer and heterodimer states, and the degradation of tubulin. Newly synthesized α- or β-tubulin monomers are folded by cytosolic chaperonin and prefoldin, and then assembled into heterodimers by complexing with a series of tubulin binding cofactors (TBCs; Zabala and Cowan, 1992; Abruzzi et al., 2002; Nithianantham et al., 2015). Heterodimers undergo reversible dissociation with moderate kinetics into stable monomers of α- and β-tubulin (Montecinos-Franjola et al., 2016). A wide range of dissociation constants have been reported for purified αβ-heterodimers, from 0.1 nM to 1.0 µM (Mejillano and Himes, 1989; Detrich and Williams, 1978; Caplow and Fee, 2002; Fineberg et al., 2020). αβ-heterodimers purified from different organisms or from different tissues within an organism exhibit dissociation constants that differ by as much as 150-fold in the same experiment (Montecinos-Franjola et al., 2019). Furthermore, cells may preferentially sort α- or β-tubulin isotypes into different heterodimer pairs, which could be based on different affinities between α- and β-isotypes (Hoyle et al., 2001). TBCs are good candidates for regulating the monomer-dimer equilibrium, since they can promote subunit exchange in pre-existing heterodimers in vitro and are important for maintaining the polymerization-competent pool in cells (Li and Moore, 2020). However, the regulation of monomer-dimer equilibrium in cells is largely uncharacterized. Tubulin turnover is also poorly understood. We know that tubulin is degraded by the proteasome (Huff et al., 2010), but whether the heterodimer or monomer state is preferentially degraded in an open question. In general, proteostasis is likely to play an important role in meeting tubulin demand but is unexplored in the field.
In this study, we sought to better understand how cells coordinate α- and β-tubulin across genes and protein. We used budding yeast due to the simplified repertoire of α- and β-tubulins, genetic tractability, and well-defined microtubule networks. We found that cells maintain an excess of α-tubulin compared to β-tubulin and are more sensitive to the loss of α-tubulin genes than β-tubulin genes in diploid cells. Removing a copy of the α-tubulin isotype TUB1 causes slower proliferation, increased sensitivity to microtubule stress, and unstable mitotic spindles. We also found that super-stoichiometric levels of α- or β-tubulin create non-microtubule tubulin assemblies, but only super-stoichiometric β-tubulin disrupts microtubules. In contrast, α-tubulin overexpression leads to a transient increase in the levels of that α-tubulin isotype and a concomitant decrease of the alternative isotype, but does not disrupt microtubules or cell viability. We propose a model where cells use isotypes to create an excess of α-tubulin expression, and then rapidly exchange α-tubulin protein to ensure sufficient heterodimer production and prevent the accumulation of β-tubulin monomers.
Results
Distinct requirements for α- and β-tubulin gene copy number in microtubule function
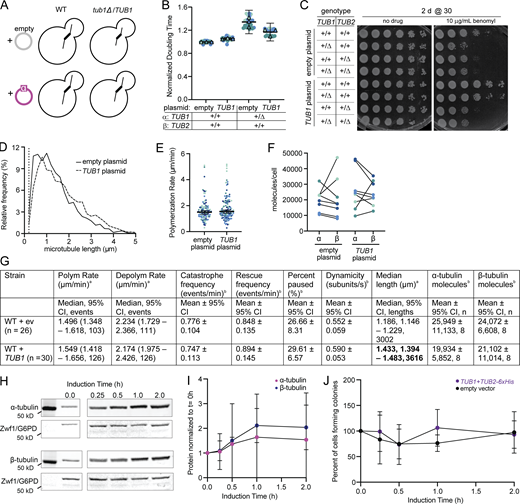
We used three experiments to test the prediction that altering gene copy number disrupts microtubule function. We first compared the proliferation of diploid yeast strains in which we knocked out one copy of an α- or β-tubulin gene. Wild-type cells take ∼127 ± 3 min to double in our assay (Fig. 1 B). Diploid cells with one copy of the α-tubulin isotype TUB1 take 13.1% longer to double than wild type (Fig. 1, B and C). In contrast, diploid cells with one copy of the α-tubulin isotype TUB3 are indistinguishable from wild type (Fig. 1 C). Diploid cells with one copy each of TUB1 and TUB3 take 14.5% longer to double than wild type, similar to TUB1 hemizygotes (Fig. 1 C). Cells hemizygous for the β-tubulin TUB2 exhibit a doubling time similar to wild type. Interestingly, double mutants hemizygous for TUB1 and TUB2 were also similar to wild-type controls (Fig. 1 C). This suggests that cell fitness is more sensitive to α-tubulin gene copy number, specifically of TUB1, than β-tubulin, and sensitivity to α-tubulin depletion is rescued by simultaneous depletion of β-tubulin.

Distinct requirements for α- and β-tubulin gene copy number in microtubule function. (A) Current model for how cells build microtubules from tubulin genes through folding and assembly of polymerization competent heterodimers. (B) Representative growth curves for wild-type and TUB1/tub1Δ heterozygous cells. All cultures were grown at 30°C with agitation for 24 h, and OD600 was measured every 5 min. Lines are mean of six technical replicates, and shading represents the 95% CI. (C) Doubling times of indicated heterozygous tubulin mutants normalized to wild-type controls. For each genotype, at least four technical replicates of two biological replicates were utilized across at least three independent experiments. Circles represent cultures in separate wells, and triangles are the means of each day. Colors indicate independent experiments. P value between wild type and mutant based on t test after one-way ANOVA with a Tukey post-hoc test. Bars are mean ±95% CI. (D) 10-fold dilution series of indicated strains were spotted onto rich media or rich media supplemented with benomyl. Cells were grown at the indicated temperature for the indicated number of days. (E) Representative image of a wild-type pre-anaphase cell expressing Spc110-mNeonGreen. Red line indicates distance between two poles. Scale bar = 1 µm. Image is a maximum intensity projection of z series. (F) Mean pre-anaphase spindle length per cell across 5-min imaging timeframe. For each genotype, two biological replicates were used across two independent experiments. Each dot represents the mean from one cell. Colors indicate independent experiments. P value between wild type and mutant based on t test after one-way ANOVA. Bars are mean ± 95% CI. (G) Coefficient of variance of pre-anaphase spindle length per cell across 5-min imaging timeframe from the dataset used in F. Each dot represents the mean from one cell. Colors indicate independent experiments. P value between wild type and mutant based on t test after one-way ANOVA. Bars are mean ±95% CI.
Distinct requirements for α- and β-tubulin gene copy number in microtubule function. (A) Current model for how cells build microtubules from tubulin genes through folding and assembly of polymerization competent heterodimers. (B) Representative growth curves for wild-type and TUB1/tub1Δ heterozygous cells. All cultures were grown at 30°C with agitation for 24 h, and OD600 was measured every 5 min. Lines are mean of six technical replicates, and shading represents the 95% CI. (C) Doubling times of indicated heterozygous tubulin mutants normalized to wild-type controls. For each genotype, at least four technical replicates of two biological replicates were utilized across at least three independent experiments. Circles represent cultures in separate wells, and triangles are the means of each day. Colors indicate independent experiments. P value between wild type and mutant based on t test after one-way ANOVA with a Tukey post-hoc test. Bars are mean ±95% CI. (D) 10-fold dilution series of indicated strains were spotted onto rich media or rich media supplemented with benomyl. Cells were grown at the indicated temperature for the indicated number of days. (E) Representative image of a wild-type pre-anaphase cell expressing Spc110-mNeonGreen. Red line indicates distance between two poles. Scale bar = 1 µm. Image is a maximum intensity projection of z series. (F) Mean pre-anaphase spindle length per cell across 5-min imaging timeframe. For each genotype, two biological replicates were used across two independent experiments. Each dot represents the mean from one cell. Colors indicate independent experiments. P value between wild type and mutant based on t test after one-way ANOVA. Bars are mean ± 95% CI. (G) Coefficient of variance of pre-anaphase spindle length per cell across 5-min imaging timeframe from the dataset used in F. Each dot represents the mean from one cell. Colors indicate independent experiments. P value between wild type and mutant based on t test after one-way ANOVA. Bars are mean ±95% CI.
For our second test of tubulin function, we compared sensitivity to the microtubule destabilizing drug, benomyl, and to low temperature. We found that the hemizygotes that exhibit slower doubling times above are also more sensitive to benomyl and low temperature (Fig. 1 D). These results also indicate a stronger requirement for α-tubulin gene copy number than β-tubulin gene copy number.
For our third test, we measured the lengths of pre-anaphase spindles, which are formed by interdigitating microtubules emanating from the two spindle pole bodies (SPBs; Winey et al., 1995). We tracked Spc110-mNeonGreen marked SPBs in asynchronous cells and identified pre-anaphase spindles that did not exhibit sustained lengths beyond 2.2 µm during imaging. We then measured pole-to-pole distance in three dimensions (X,Y,Z) to determine average spindle length and length variation (Thomas et al., 2020). Hemizygotes for TUB1 exhibit shorter pre-anaphase spindles compared to wild type (Fig. 1 F). In contrast, hemizygotes for TUB3 have mean preanaphase spindles similar to wild type (Fig. 1 F). Hemizygotes for TUB2 also exhibit shorter pre-anaphase spindles than wild-type controls (Fig. 1 F). Hemizygotes for TUB1 and TUB2 together exhibit shorter pre-anaphase spindles that are not significantly different from either single hemizygote (Fig. 1 F). We also measured the stability of each spindle by calculating the coefficient of variation over time. Whereas wild-type cells exhibit only small variation in pre-anaphase spindle length over time, TUB1 hemizygotes exhibit increased coefficients, indicating that spindle length is more variable (Fig. 1 G). In contrast, TUB3 or TUB2 hemizygotes have coefficient of variation similar to wild type (Fig. 1 G). Furthermore, hemizygotes for TUB1 and TUB2 together also show a coefficient of variation similar to wild type (Fig. 1 G). To summarize, loss of either α- or β-tubulin genes results in shorter spindles, but loss of TUB1 uniquely results in unstable spindles. We conclude that budding yeast is more sensitive to loss of α-tubulin genes than β-tubulin genes, and that this effect may be attributable to the creation of excess β-tubulin expression.
α- and β-tubulin gene copy number determines polymerization activity and the balance between subunits
We next investigated how altering tubulin gene copy number affects microtubule polymerization and tubulin protein levels. We predicted that decreasing gene copy number for either α- or β-tubulin would decrease heterodimer availability in cells, leading to shorter microtubules and slower polymerization rates. To test this prediction, we measured the dynamics of individual astral microtubules over time using CLIP-170/Bik1-3GFP to label growing microtubule ends (Fig. 2, A and B). Since there was no difference in pre-anaphase spindle length between wild type and TUB3 hemizygotes, we did not include this strain in this experiment. We found that TUB1 and TUB2 single hemizygotes and TUB1 TUB2 double heimzygotes each exhibit shorter astral microtubules that sample a narrower range of lengths than wild-type controls (Fig. 2 C). The length distributions for the mutants are all similar to each other, with the exception that TUB1 hemizygotes have some microtubules that reach long lengths (Fig. 2 C). In addition, polymerization rate is decreased in each of the mutant strains in our panel (Fig. 2 D and Table 1). Wild-type diploids have a median polymerization rate of 1.27 µm/min whereas TUB1 hemizygotes have a polymerization rate of 1.15 µm/min (Table 1 and Fig. 2 D). TUB2 single hemizygotes or TUB1 and TUB2 double hemizygotes show even slower polymerization rates (Fig. 2 D). We conclude that gene copy number for both α- and β-tubulin is important for polymerization activity, but the lower rates observed in TUB2 hemizygotes suggest that β-tubulin may be limiting for polymerization activity.

Changes in gene copy number alter microtubule activity. (A) Representative image of a wild-type cell expressing Bik1-3GFP. Red line indicates measured length between plus-end and spindle pole body. Scale bar = 1 µm. Image is a maximum intensity projection of z series. (B) Life plot of a single microtubule from a wild-type cell. Microtubule lengths were measured at 5-s intervals. (C) Histogram of all astral microtubule lengths from time lapse imaging of wild type, TUB1/tub1Δ, TUB2/tub2Δ, and TUB1/tub1Δ TUB2/tub2Δ. Data are from at least three separate experiments for each genotype, and a total of at least 20 cells were analyzed for each genotype. (D) Polymerization rates of astral microtubules. Each dot represents a single polymerization event, and dots are colored by experimental day. P value between wild type and mutant based on t test after one-way ANOVA. Bars are median ±95% CI. (E) Representative image of quantitative Western blot of α-tubulin in wild-type cells to determine molecules per cell. Known mass of purified yeast tubulin was used to make a standard curve. (F) Representative image of quantitative Western blot of β-tubulin in wild-type cells to determine molecules per cell. Known mass of purified yeast tubulin was used to make a standard curve. (G) Paired molecules of α- or β-tubulin per cell for each genotype. Protein mass (ng) was converted to molecules per cell. Data represent at least two independent experiments with two biological replicates, and each dot is mean molecules per cell calculated from at least three dilutions in that experiment. Dots are colored by experiment. (H) Ratio of α-to β-tubulin in cells with indicated genotypes. Ratios were calculated from data in G. Bars are mean ± 95% CI. Source data are available for this figure: SourceData F2.
Changes in gene copy number alter microtubule activity. (A) Representative image of a wild-type cell expressing Bik1-3GFP. Red line indicates measured length between plus-end and spindle pole body. Scale bar = 1 µm. Image is a maximum intensity projection of z series. (B) Life plot of a single microtubule from a wild-type cell. Microtubule lengths were measured at 5-s intervals. (C) Histogram of all astral microtubule lengths from time lapse imaging of wild type, TUB1/tub1Δ, TUB2/tub2Δ, and TUB1/tub1Δ TUB2/tub2Δ. Data are from at least three separate experiments for each genotype, and a total of at least 20 cells were analyzed for each genotype. (D) Polymerization rates of astral microtubules. Each dot represents a single polymerization event, and dots are colored by experimental day. P value between wild type and mutant based on t test after one-way ANOVA. Bars are median ±95% CI. (E) Representative image of quantitative Western blot of α-tubulin in wild-type cells to determine molecules per cell. Known mass of purified yeast tubulin was used to make a standard curve. (F) Representative image of quantitative Western blot of β-tubulin in wild-type cells to determine molecules per cell. Known mass of purified yeast tubulin was used to make a standard curve. (G) Paired molecules of α- or β-tubulin per cell for each genotype. Protein mass (ng) was converted to molecules per cell. Data represent at least two independent experiments with two biological replicates, and each dot is mean molecules per cell calculated from at least three dilutions in that experiment. Dots are colored by experiment. (H) Ratio of α-to β-tubulin in cells with indicated genotypes. Ratios were calculated from data in G. Bars are mean ± 95% CI. Source data are available for this figure: SourceData F2.
Astral microtubule dynamics and soluble tubulin levels in diploid cells
| Genotype | Median length (µm)a | Polym rate (µm/min)a | Depolym rate (µm/min)a | Catastrophe frequency (events/min)b | Rescue frequency (events/min)b | Dynamicity (subunits/s)b | α-tubulin molecules per cellc | β-tubulin molecules per cellc |
|---|---|---|---|---|---|---|---|---|
| Wild type (n = 30 cells) | 0.93 (0.91–0.96) | 1.27 (1.2–1.41) | 1.91 (1.72–2.22) | 0.81 ± 0.11 | 1.02 ± 0.19 | 0.49 ± 0.03 | 2.3 × 10⁴ ± 8.8 | 1.5 × 10⁴ ± 0.3 |
| tub1Δ/TUB1 (n = 20 cells) | 0.71 (0.69–0.73) | 1.15 (1.02–1.31) | 1.60 (1.34–1.84) | 0.62 ± 0.12 | 0.9 ± 0.2 | 0.43 ± 0.06 | 1.2 × 10⁴ ± 0.3 | 2.4 × 10⁴ ± 0.3 |
| tub2Δ/TUB2 (n = 35 cells) | 0.73 (0.7–0.76) | 1.02 (0.95–1.14) | 1.53 (1.42–1.71) | 0.8 ± 0.09 | 0.87 ± 0.12 | 0.41 ± 0.02 | 1.5 × 10⁴ ± 0.4 | 1.1 × 10⁴ ± 0.3 |
| tub1Δ/TUB1 tub2Δ/TUB2 (n = 36 cells) | 0.72 (0.7–0.74) | 0.97 (0.93–1.1) | 1.43 (1.27–1.70) | 0.74 ± 0.11 | 0.88 ± 0.14 | 0.39 ± 0.04 | 2.4 × 10⁴ ± 12.3 | 1.7 × 10⁴ ± 0.6 |
Values in bold have P < 0.05 from wild type, based on a t test of P < 0.05 from an ANOVA with a Tukey post-hoc test.
Median values (95% CI).
Mean values ±95% CI.
Mean values ±95% CI; values from Fig. 2 G.
Next, we measured the levels of α- and β-tubulin in cells with altered gene copy number. We used dilutions of purified yeast tubulin to create standard curves for calculating the number of α- or β-tubulin molecules per unit of signal from Western blots probed with antibodies for α- and β-tubulin (Fig. 2, E and F; see Materials and methods). Dilution series of cell lysates from log-phase cultures were then measured by Western blot, using a loading control to estimate the amount of cell lysate in each sample. We also counted cells by hemocytometer and by plating and counting colonies to confirm cell number in our samples (Fig. S2 A). We compared tubulin from cell lysates prepared by two different methods. Soluble protein lysates were prepared under nondenaturing conditions by lysing cells using high pressure. These lysates were clarified by centrifugation at 6,000 × g followed by 100,000 × g, and samples were normalized based on measurements of total protein concentration. We found that soluble protein lysates from wild-type cells contain variable amounts of α- and β-tubulin after 6,000 × g clarification, but are more consistent after 100,000 × g clarification (Fig. S1, A and B). As a second approach, we used denaturing conditions to weaken the cell wall and increase the efficiency of cell lysis and protein recovery (Zhang et al., 2011). Using this method, we estimated the number of α- and β-tubulin molecules per cell in each genotype. We found that levels of α-tubulin are consistently higher than levels of β-tubulin in wild-type cells, with a mean ratio of 1.5 α-tubulins per β-tubulin (Fig. 2, G and H; and Fig. S2, B–G). Excess of α-tubulin was observed across genotypes, with one exception—TUB1 hemizygotes exhibit higher levels of β-tubulin than α-tubulin, with a mean ratio of 0.49 α-tubulins per β-tubulin (Fig. 2, G and H; and Fig. S2, H–M, and Fig. S3). These results indicate that wild-type cells normally contain an excess of α-tubulin and that lowering α-tubulin gene copy number in TUB1 hemizygotes creates an aberrant excess of β-tubulin.

Alterative lysis of wild-type cells. (A) Plot of paired ng of α- or β-tubulin per µg of total protein lysate loaded for a 6,000 xg clarifying spin alone or a 6,000 xg spin followed by a 100,000 xg clarifying spin of wild-type cells. Data represent three independent experiments, and each dot is mean ng tubulin/µg total protein lysate across the dilutions. Dots are colored by experiment. (B) Ratio of α-to β-tubulin for the two spins. Ratios were calculated from data in A. Bars are mean ±95% CI. (C) Plot of µg total protein lysate loaded vs. α-tubulin intensity for wild-type cells with a line of best fit. Data are colored by experiment, and shape indicates spin conditions. (D) Plot of µg total protein lysate loaded vs. β-tubulin intensity for wild-type cells with a line of best fit. Data are colored by experiment and shape indicates spin conditions. (E) Plot of purified tubulin loaded vs. α-tubulin intensity for wild-type cells with a line of best fit. Data are colored by experiment. (F) Plot of purified tubulin loaded vs. β-tubulin intensity for wild-type cells with a line of best fit. Data are colored by experiment.

Alterative lysis of wild-type cells. (A) Plot of paired ng of α- or β-tubulin per µg of total protein lysate loaded for a 6,000 xg clarifying spin alone or a 6,000 xg spin followed by a 100,000 xg clarifying spin of wild-type cells. Data represent three independent experiments, and each dot is mean ng tubulin/µg total protein lysate across the dilutions. Dots are colored by experiment. (B) Ratio of α-to β-tubulin for the two spins. Ratios were calculated from data in A. Bars are mean ±95% CI. (C) Plot of µg total protein lysate loaded vs. α-tubulin intensity for wild-type cells with a line of best fit. Data are colored by experiment, and shape indicates spin conditions. (D) Plot of µg total protein lysate loaded vs. β-tubulin intensity for wild-type cells with a line of best fit. Data are colored by experiment and shape indicates spin conditions. (E) Plot of purified tubulin loaded vs. α-tubulin intensity for wild-type cells with a line of best fit. Data are colored by experiment. (F) Plot of purified tubulin loaded vs. β-tubulin intensity for wild-type cells with a line of best fit. Data are colored by experiment.

Quality control for wild-type and tub1Δ/TUB1 cells. (A) Fraction of colonies recovered for each genotype used in tubulin quantification experiments. Dots are colored by experiment. Bars represent mean ± 95% CI. (B) Plot of estimated cells loaded vs. α-tubulin intensity for wild-type cells with a line of best fit. Data are colored by experiment and shape indicates biological replicate. (C) Plot of volume loaded vs. Zwf1 (G6PD) loading control intensity on the α-tubulin Western blot for wild-type cells with a line of best fit. Data are colored by experiment and shape indicates biological replicate. (D) Plot of estimated cells loaded vs. β-tubulin intensity for wild-type cells with a line of best fit. Data are colored by experiment and shape indicates biological replicate. (E) Plot of volume loaded vs. Zwf1 (G6PD) loading control intensity on the β-tubulin Western blot for wild-type cells with a line of best fit. Data are colored by experiment and shape indicates biological replicate. (F) Plot of purified tubulin loaded vs. α-tubulin intensity with a line of best fit. Data are colored by experiment. (G) Plot of purified tubulin loaded vs. β-tubulin intensity with a line of best fit. Data are colored by experiment. (H) Plot of estimated cells loaded vs. α-tubulin intensity for tub1Δ/TUB1 cells with a line of best fit. Data are colored by experiment and shape indicates replicate. (I) Plot of volume loaded vs. Zwf1 (G6PD) loading control intensity on the α-tubulin Western blot for tub1Δ/TUB1 cells with a line of best fit. Data are colored by experiment and shape indicates replicate. (J) Plot of estimated cells loaded vs. β-tubulin intensity for tub1Δ/TUB1 cells with a line of best fit. Data are colored by experiment and shape indicates replicate. (K) Plot of volume loaded vs. Zwf1 (G6PD) loading control intensity on the β-tubulin Western blot for tub1Δ/TUB1 cells with a line of best fit. Data are colored by experiment and shape indicates replicate. (L) Plot of purified tubulin loaded vs. α-tubulin intensity with a line of best fit. Data are colored by experiment. (M) Plot of purified tubulin loaded vs. β-tubulin intensity with a line of best fit. Data are colored by experiment.

Quality control for wild-type and tub1Δ/TUB1 cells. (A) Fraction of colonies recovered for each genotype used in tubulin quantification experiments. Dots are colored by experiment. Bars represent mean ± 95% CI. (B) Plot of estimated cells loaded vs. α-tubulin intensity for wild-type cells with a line of best fit. Data are colored by experiment and shape indicates biological replicate. (C) Plot of volume loaded vs. Zwf1 (G6PD) loading control intensity on the α-tubulin Western blot for wild-type cells with a line of best fit. Data are colored by experiment and shape indicates biological replicate. (D) Plot of estimated cells loaded vs. β-tubulin intensity for wild-type cells with a line of best fit. Data are colored by experiment and shape indicates biological replicate. (E) Plot of volume loaded vs. Zwf1 (G6PD) loading control intensity on the β-tubulin Western blot for wild-type cells with a line of best fit. Data are colored by experiment and shape indicates biological replicate. (F) Plot of purified tubulin loaded vs. α-tubulin intensity with a line of best fit. Data are colored by experiment. (G) Plot of purified tubulin loaded vs. β-tubulin intensity with a line of best fit. Data are colored by experiment. (H) Plot of estimated cells loaded vs. α-tubulin intensity for tub1Δ/TUB1 cells with a line of best fit. Data are colored by experiment and shape indicates replicate. (I) Plot of volume loaded vs. Zwf1 (G6PD) loading control intensity on the α-tubulin Western blot for tub1Δ/TUB1 cells with a line of best fit. Data are colored by experiment and shape indicates replicate. (J) Plot of estimated cells loaded vs. β-tubulin intensity for tub1Δ/TUB1 cells with a line of best fit. Data are colored by experiment and shape indicates replicate. (K) Plot of volume loaded vs. Zwf1 (G6PD) loading control intensity on the β-tubulin Western blot for tub1Δ/TUB1 cells with a line of best fit. Data are colored by experiment and shape indicates replicate. (L) Plot of purified tubulin loaded vs. α-tubulin intensity with a line of best fit. Data are colored by experiment. (M) Plot of purified tubulin loaded vs. β-tubulin intensity with a line of best fit. Data are colored by experiment.

Quality control for tub2Δ/TUB2 cells and tub1Δ/TUB1 tub2Δ/TUB2 cells. (A) Plot of estimated cells loaded vs. α-tubulin intensity for tub2Δ/TUB2 cells with a line of best fit. Data are colored by experiment and shape indicates biological replicate. (B) Plot of volume loaded vs. Zwf1 (G6PD) loading control intensity on the α-tubulin Western blot for tub2Δ/TUB2 cells with a line of best fit. Data are colored by experiment and shape indicates biological replicate. (C) Plot of estimated cells loaded vs. β-tubulin intensity for tub2Δ/TUB2 cells with a line of best fit. Data are colored by experiment and shape indicates biological replicate. (D) Plot of volume loaded vs. Zwf1 (G6PD) loading control intensity on the β-tubulin Western blot for tub2Δ/TUB2 cells with a line of best fit. Data are colored by experiment and shape indicates biological replicate. (E) Plot of purified tubulin loaded vs. α-tubulin intensity with a line of best fit. Data are colored by experiment. (F) Plot of purified tubulin loaded vs. β-tubulin intensity with a line of best fit. Data are colored by experiment. (G) Plot of estimated cells loaded vs. α-tubulin intensity for tub1Δ/TUB1 tub2Δ/TUB2 cells with a line of best fit. Data are colored by experiment and shape indicates biological replicate. (H) Plot of volume loaded vs. Zwf1 (G6PD) loading control intensity on the α-tubulin Western blot for tub1Δ/TUB1 tub2Δ/TUB2 cells with a line of best fit. Data are colored by experiment and shape indicates biological replicate. (I) Plot of estimated cells loaded vs. β-tubulin intensity for tub1Δ/TUB1 tub2Δ/TUB2 cells with a line of best fit. Data are colored by experiment and shape indicates biological replicate. (J) Plot of volume loaded vs. Zwf1 (G6PD) loading control intensity on the β-tubulin Western blot for tub1Δ/TUB1 tub2Δ/TUB2 cells with a line of best fit. Data are colored by experiment and shape indicates biological replicate. (K) Plot of purified tubulin loaded vs. α-tubulin intensity with a line of best fit. Data are colored by experiment. (L) Plot of purified tubulin loaded vs. β-tubulin intensity with a line of best fit. Data are colored by experiment.

Quality control for tub2Δ/TUB2 cells and tub1Δ/TUB1 tub2Δ/TUB2 cells. (A) Plot of estimated cells loaded vs. α-tubulin intensity for tub2Δ/TUB2 cells with a line of best fit. Data are colored by experiment and shape indicates biological replicate. (B) Plot of volume loaded vs. Zwf1 (G6PD) loading control intensity on the α-tubulin Western blot for tub2Δ/TUB2 cells with a line of best fit. Data are colored by experiment and shape indicates biological replicate. (C) Plot of estimated cells loaded vs. β-tubulin intensity for tub2Δ/TUB2 cells with a line of best fit. Data are colored by experiment and shape indicates biological replicate. (D) Plot of volume loaded vs. Zwf1 (G6PD) loading control intensity on the β-tubulin Western blot for tub2Δ/TUB2 cells with a line of best fit. Data are colored by experiment and shape indicates biological replicate. (E) Plot of purified tubulin loaded vs. α-tubulin intensity with a line of best fit. Data are colored by experiment. (F) Plot of purified tubulin loaded vs. β-tubulin intensity with a line of best fit. Data are colored by experiment. (G) Plot of estimated cells loaded vs. α-tubulin intensity for tub1Δ/TUB1 tub2Δ/TUB2 cells with a line of best fit. Data are colored by experiment and shape indicates biological replicate. (H) Plot of volume loaded vs. Zwf1 (G6PD) loading control intensity on the α-tubulin Western blot for tub1Δ/TUB1 tub2Δ/TUB2 cells with a line of best fit. Data are colored by experiment and shape indicates biological replicate. (I) Plot of estimated cells loaded vs. β-tubulin intensity for tub1Δ/TUB1 tub2Δ/TUB2 cells with a line of best fit. Data are colored by experiment and shape indicates biological replicate. (J) Plot of volume loaded vs. Zwf1 (G6PD) loading control intensity on the β-tubulin Western blot for tub1Δ/TUB1 tub2Δ/TUB2 cells with a line of best fit. Data are colored by experiment and shape indicates biological replicate. (K) Plot of purified tubulin loaded vs. α-tubulin intensity with a line of best fit. Data are colored by experiment. (L) Plot of purified tubulin loaded vs. β-tubulin intensity with a line of best fit. Data are colored by experiment.
Super-stoichiometric β-tubulin creates aberrant tubulin assemblies
Our results thus far suggest that the unique phenotypes of TUB1 hemizygotes may be due to the creation of super-stoichiometric β-tubulin. We next sought to directly test how increasing β-tubulin expression impacts fitness and microtubule function. Previous studies have found that an additional copy of TUB2 is lethal in budding yeast (Weinstein and Solomon, 1990; Burke et al., 1989). We therefore designed a plasmid-based tool to overexpress ectopic TUB2 from a galactose-inducible promoter in wild-type cells. We determined relative α- or β-tubulin levels during the time course of ectopic β-tubulin expression by Western blot (Fig. 3, A and B). After 15 min of galactose induction, the level of β-tubulin in cell lysates is 1.3× the amount measured in uninduced control cells (Fig. 3, B and C). Cells collected after 15 min of induction and then plated to glucose-containing media to shut-off ectopic β-tubulin expression show a strong inhibition of colony formation (Fig. 3 D). At 1 h of galactose induction, β-tubulin is increased to 2× the level measured in uninduced cells and nearly all cells fail to form colonies (Fig. 3, B–D). At no point during the time course of β-tubulin overexpression did we observe an increase in α-tubulin levels (Fig. 3, B and C). This result demonstrates that even a small excess of β-tubulin is acutely toxic.

Super-stoichiometric β-tubulin creates aberrant tubulin assemblies. (A) Schematic for β-tubulin induction experiment. (B) Representative Western blot of β- and α-tubulin during TUB2-6xHIS induction. Blots were probed for α- or β-tubulin, and Zwf1 (G6PD) as a loading control. (C) Quantification of TUB2-6xHis induction for both α- and β-tubulin across overexpression. Dots represent mean ± SD from four independent induction experiments. (D) Quantification of cells forming colonies after TUB2-6xHis induction or empty vector control. Dots represent mean ± SD from four independent induction experiments. (E) Example images of wild-type cells overexpressing β-tubulin for 0 or 2 h and stained for α- or β-tubulin. Arrows indicate astral microtubules; arrowheads indicate tubulin assemblies. Scale bar = 1 µm. Images are maximum intensity projections of in focus z positions. (F) Quantification of astral microtubules (aMTs) across induction time for cells stained for either α- or β-tubulin. Dots represent mean ± 95% CI from three independent experiments with at least 100 cells in each experiment. (G) Quantification of tubulin assemblies across induction time for cells stained for either α- and β-tubulin. Dots represent mean ± 95% CI from three independent experiments with at least 100 cells in each experiment. (H) Example images of cells expressing Spc110-tdTomato and GFP-Tub1. TUB2-6xHis was induced for 3 h and then cells were shifted to 4°C for 2 h to depolymerize microtubules. Uninduced control cells are also shown. Arrows indicate microtubules; arrowheads indicate tubulin assemblies. Scale bar = 1 µm. Images are maximum intensity projections of z series. (I) Quantification of the fraction of astral microtubules or tubulin assemblies in induced or uninduced cells after indicated time at 4°C. Dots are mean ± 95% CI from at least 100 cells in three independent experiments. (J) Example images of cells expressing Bim1-3GFP and mRuby-Tub1 with TUB2-6xHis induced or uninduced for 2 h. Confocal images were processed in Fiji using the Despeckle filter and stacks were converted to sum projections. Scale bar = 1 µm. (K) Quantification of the fraction of cells exhibiting a focus of Bim1-GFP that tracks a dynamic microtubule plus end in uninduced or induced cells. Each dot represents a single experiment. Bars are mean ± 95% CI. (L) Example images of cells expressing the indicated + TIP and mRuby-Tub1 with TUB2-6xHis induced or uninduced for 2 h. Confocal images were processed in Fiji using the Despeckle filter and stacks were converted to sum projections. Scale bar = 1 µm. (M) Quantification of the fraction of cells exhibiting a focus of +TIP that tracks a dynamic microtubule plus end in uninduced or induced cells. Each dot represents a single experiment. Bars are mean ± 95% CI. Source data are available for this figure: SourceData F3.
Super-stoichiometric β-tubulin creates aberrant tubulin assemblies. (A) Schematic for β-tubulin induction experiment. (B) Representative Western blot of β- and α-tubulin during TUB2-6xHIS induction. Blots were probed for α- or β-tubulin, and Zwf1 (G6PD) as a loading control. (C) Quantification of TUB2-6xHis induction for both α- and β-tubulin across overexpression. Dots represent mean ± SD from four independent induction experiments. (D) Quantification of cells forming colonies after TUB2-6xHis induction or empty vector control. Dots represent mean ± SD from four independent induction experiments. (E) Example images of wild-type cells overexpressing β-tubulin for 0 or 2 h and stained for α- or β-tubulin. Arrows indicate astral microtubules; arrowheads indicate tubulin assemblies. Scale bar = 1 µm. Images are maximum intensity projections of in focus z positions. (F) Quantification of astral microtubules (aMTs) across induction time for cells stained for either α- or β-tubulin. Dots represent mean ± 95% CI from three independent experiments with at least 100 cells in each experiment. (G) Quantification of tubulin assemblies across induction time for cells stained for either α- and β-tubulin. Dots represent mean ± 95% CI from three independent experiments with at least 100 cells in each experiment. (H) Example images of cells expressing Spc110-tdTomato and GFP-Tub1. TUB2-6xHis was induced for 3 h and then cells were shifted to 4°C for 2 h to depolymerize microtubules. Uninduced control cells are also shown. Arrows indicate microtubules; arrowheads indicate tubulin assemblies. Scale bar = 1 µm. Images are maximum intensity projections of z series. (I) Quantification of the fraction of astral microtubules or tubulin assemblies in induced or uninduced cells after indicated time at 4°C. Dots are mean ± 95% CI from at least 100 cells in three independent experiments. (J) Example images of cells expressing Bim1-3GFP and mRuby-Tub1 with TUB2-6xHis induced or uninduced for 2 h. Confocal images were processed in Fiji using the Despeckle filter and stacks were converted to sum projections. Scale bar = 1 µm. (K) Quantification of the fraction of cells exhibiting a focus of Bim1-GFP that tracks a dynamic microtubule plus end in uninduced or induced cells. Each dot represents a single experiment. Bars are mean ± 95% CI. (L) Example images of cells expressing the indicated + TIP and mRuby-Tub1 with TUB2-6xHis induced or uninduced for 2 h. Confocal images were processed in Fiji using the Despeckle filter and stacks were converted to sum projections. Scale bar = 1 µm. (M) Quantification of the fraction of cells exhibiting a focus of +TIP that tracks a dynamic microtubule plus end in uninduced or induced cells. Each dot represents a single experiment. Bars are mean ± 95% CI. Source data are available for this figure: SourceData F3.
This result led us to test how β-tubulin overexpression alters the microtubule cytoskeleton. We first used immunofluorescence to visualize α- and β-tubulin. Microtubules containing a 1:1 stoichiometry of α- and β-tubulin should exhibit a characteristic morphology and abundance when stained with antibodies to either tubulin. In wild-type haploid cells, we found that the level of β-tubulin overexpression (Fig. 3 C) was inversely proportional to the presence of astral and nuclear microtubules (Fig. 3 E). Staining for α-tubulin shows that the frequency of cells containing astral microtubules steadily decreases as the level of β-tubulin overexpression increases (Fig. 3 F). Staining for β-tubulin shows a similar trend, although the images were less clear due to increasing background signal at greater levels of β-tubulin expression and poorer staining from the β-tubulin antibody (Fig. 3, E and F). While microtubules are lost during β-tubulin overexpression, we observed the formation of alternative structures that stained with tubulin antibodies. These structures could be distinguished from microtubules because they are typically disconnected from the SPBs and/or orthogonal to microtubules in the same cell, and are heterogeneous in shape and size, from small foci to tangled filaments (Fig. 3, E and G; and Fig. S4, A–H). We collectively termed these structures “tubulin assemblies.” We scored cells for the appearance of these assemblies and found that they emerged after 1 h of β-tubulin overexpression, and by 2 h 50% of cells had at least one tubulin assembly (Fig. 3, E and G). Similar tubulin assemblies could be detected by β-tubulin or α-tubulin immunofluorescence, indicating that tubulin assemblies contain both tubulins. These results suggest that super-stoichiometric β-tubulin dominantly disrupts normal microtubule architecture and creates new α- and β-tubulin-containing assemblies.

Immunofluorescence images of cells during β-tubulin induction or α-tubulin induction. (A) Example fields of immunofluorescence images at 0 h of β-tubulin induction, probed against α-tubulin. Scale bar = 5 µm. (B) Example fields of immunofluorescence images at 0.5 h of β-tubulin induction, probed against α-tubulin. Scale bar = 5 µm. (C) Example fields of immunofluorescence images at 1 h of β-tubulin induction, probed against α-tubulin. Scale bar = 5 µm. (D) Example fields of immunofluorescence images at 2 h of β-tubulin induction, probed against α-tubulin. Scale bar = 5 µm. (E) Example fields of immunofluorescence images at 0 h of β-tubulin induction, probed against β-tubulin. Scale bar = 5 µm. (F) Example fields of immunofluorescence images at 0.5 h of β-tubulin induction, probed against β-tubulin. Scale bar = 5 µm. (G) Example fields of immunofluorescence images at 1 h of β-tubulin induction, probed against β-tubulin. Scale bar = 5 µm. (H) Example fields of immunofluorescence images at 2 h of β-tubulin induction, probed against β-tubulin. Scale bar = 5 µm. (I) Example fields of immunofluorescence images at 0 h of α-tubulin induction, probed against α-tubulin. Scale bar = 5 µm. (J) Example fields of immunofluorescence images at 0.5 h of α-tubulin induction, probed against α-tubulin. Scale bar = 5 µm. (K) Example fields of immunofluorescence images at 1 h of α-tubulin induction, probed against α-tubulin. Scale bar = 5 µm. (L) Example fields of immunofluorescence images at 2 h of α-tubulin induction, probed against α-tubulin. Scale bar = 5 µm. (M) Example fields of immunofluorescence images at 0 h of α-tubulin induction, probed against β-tubulin. Scale bar = 5 µm. (N) Example fields of immunofluorescence images at 0.5 h of α-tubulin induction, probed against β-tubulin. Scale bar = 5 µm. (O) Example fields of immunofluorescence images at 1 h of α-tubulin induction, probed against β-tubulin. Scale bar = 5 µm. (P) Example fields of immunofluorescence images at 2 h of α-tubulin induction, probed against β-tubulin. Scale bar = 5 µm.

Immunofluorescence images of cells during β-tubulin induction or α-tubulin induction. (A) Example fields of immunofluorescence images at 0 h of β-tubulin induction, probed against α-tubulin. Scale bar = 5 µm. (B) Example fields of immunofluorescence images at 0.5 h of β-tubulin induction, probed against α-tubulin. Scale bar = 5 µm. (C) Example fields of immunofluorescence images at 1 h of β-tubulin induction, probed against α-tubulin. Scale bar = 5 µm. (D) Example fields of immunofluorescence images at 2 h of β-tubulin induction, probed against α-tubulin. Scale bar = 5 µm. (E) Example fields of immunofluorescence images at 0 h of β-tubulin induction, probed against β-tubulin. Scale bar = 5 µm. (F) Example fields of immunofluorescence images at 0.5 h of β-tubulin induction, probed against β-tubulin. Scale bar = 5 µm. (G) Example fields of immunofluorescence images at 1 h of β-tubulin induction, probed against β-tubulin. Scale bar = 5 µm. (H) Example fields of immunofluorescence images at 2 h of β-tubulin induction, probed against β-tubulin. Scale bar = 5 µm. (I) Example fields of immunofluorescence images at 0 h of α-tubulin induction, probed against α-tubulin. Scale bar = 5 µm. (J) Example fields of immunofluorescence images at 0.5 h of α-tubulin induction, probed against α-tubulin. Scale bar = 5 µm. (K) Example fields of immunofluorescence images at 1 h of α-tubulin induction, probed against α-tubulin. Scale bar = 5 µm. (L) Example fields of immunofluorescence images at 2 h of α-tubulin induction, probed against α-tubulin. Scale bar = 5 µm. (M) Example fields of immunofluorescence images at 0 h of α-tubulin induction, probed against β-tubulin. Scale bar = 5 µm. (N) Example fields of immunofluorescence images at 0.5 h of α-tubulin induction, probed against β-tubulin. Scale bar = 5 µm. (O) Example fields of immunofluorescence images at 1 h of α-tubulin induction, probed against β-tubulin. Scale bar = 5 µm. (P) Example fields of immunofluorescence images at 2 h of α-tubulin induction, probed against β-tubulin. Scale bar = 5 µm.
To determine whether tubulin assemblies formed in the presence of super-stoichiometric β-tubulin exhibit properties that are distinct from microtubules, we first asked whether they are cold labile. Cells with labeled SPBs (Spc110-tdTomato) and a GFP fusion to the N-terminus of ectopically expressed α-tubulin (GFP-Tub1) were induced to overexpress β-tubulin for 3 h, then shifted to 4°C for 0.25, 0.5, 1, 2, and 24 h, fixed, and imaged (Fig. 3 H). Whereas microtubules are lost in uninduced control cells within 1 h of the shift to 4°C, tubulin assemblies are retained in cells overexpressing β-tubulin after the shift to 4°C (Fig. 3 I). These assemblies appeared as a combination of linear filaments and non-linear clusters that contained GFP-Tub1 and were not connected to SPBs (Fig. 3 H). The characteristics of cold resistance and dissociation from the SPBs suggest that β-tubulin overexpression creates tubulin assemblies that are not bona fide microtubules.
As a second test, we asked whether the tubulin assemblies formed during β-tubulin overexpression recruit microtubule-associated proteins (MAPs). We tested this using four well-characterized MAPs that use distinct modes of binding to microtubule plus ends. We first tested Bim1, the budding yeast member of the EB protein family (Tirnauer and Bierer, 2000). EB proteins bind specifically to the microtubule lattice through a binding site that consists of α- and β-tubulins from four adjacent heterodimers (Maurer et al., 2012). Bim1 binds to a transition state of GTP hydrolysis that accompanies microtubule polymerization (Howes et al., 2018). Cells expressing Bim1-3GFP from its native locus and mRuby-Tub1 to label tubulin were induced to overexpress β-tubulin for 2 h and then cells were imaged by time lapse confocal microscopy (Fig. 3 J). 75% of uninduced control cells exhibit at least one focus of Bim1-3GFP in the cytoplasm at the end of a microtubule labeled with mRuby-Tub1 (Fig. 3 K). In most cells overexpressing β-tubulin, Bim1-3GFP signal is diffuse in the cytoplasm with no accumulation on tubulin assemblies (Fig. 3 J), while 23% of cells show Bim1-3GFP localization to an mRuby-Tub1-labeled astral microtubule (Fig. 3 K). This suggests that tubulin assemblies formed during β-tubulin overexpression do not contain the lattice state that is normally found at the microtubule plus end.
To further interrogate the composition of the tubulin assemblies we completed similar experiments using three other plus-end tracking proteins (+TIPs): Bik1/CLIP-170, Stu2/XMAP215, and Kip3/kinesin-8. Bik1-3GFP localizes to microtubules through CAP-Gly domains that bind to EEY/F motifs in α-tubulins (Pierre et al., 1992; Weisbrich et al., 2007; Badin-Larçon et al., 2004). We predicted that whether the tubulin assemblies contain sub-stoichiometric levels of α-tubulin due to excess β-tubulin, then Bik1 will exhibit diminished localization to tubulin assemblies. Indeed, cells overexpressing β-tubulin exhibit either diffuse Bik1-3GFP signal in the cytoplasm and/or colocalization along tubulin assemblies without clear enrichment at filament ends (Fig. 3, L and M). This suggests that β-tubulin-induced assemblies do contain α-tubulin but lack the plus end that is normally recognized by Bik1.
Stu2/XMAP215 uses a combination of αβ-heterodimer binding by its TOG domains and a poorly defined lattice-binding activity by its basic domain to localize to microtubule plus ends (Ayaz et al., 2012; Geyer et al., 2018). While the plus-end localization of Stu2-3GFP is lost when β-tubulin is overexpressed, we found that Stu2-3GFP exhibits strong co-localization to tubulin assemblies, albeit without enrichment at filament ends (Fig. 3, L and M). This indicates that tubulin assemblies may contain strong binding sites for either the TOG domains or the basic domain of Stu2.
Finally, we examined the plus-end directed kinesin-8, Kip3, which binds to microtubules at the intradimer interface and walks toward the plus end where it induces microtubule depolymerization (Varga et al., 2009; Arellano-Santoyo et al., 2021 Preprint). Kip3-mNeonGreen does not localize to tubulin assemblies, and instead is diffusely localized in the cytoplasm when β-tubulin is overexpressed (Fig. 3, L and M). This suggests that tubulin assemblies do not contain the intradimer interface in high abundance. Taken together, our results suggest that super-stoichiometric β-tubulin leads to loss of microtubules and the formation of cold-stable tubulin assemblies that lack conventional binding sites for MAPs.
Cells tolerate super-stoichiometric α-tubulin
If β-tubulin overexpression disrupts the microtubule cytoskeleton, we asked whether overexpressing α-tubulin elicits similar effects. In contrast to β-tubulin, ectopic copies of α-tubulin genes under control of the endogenous promoter are tolerated by budding yeast (Katz et al., 1990). We found that an additional copy of TUB1 on a low-copy, centromere-containing plasmid increases doubling time by ∼5% over that observed in wild-type diploid cells (Fig. S5, A and B). The same TUB1 plasmid partially rescues the growth defect of heterozygous cells lacking one chromosomal copy of TUB1, indicating that the plasmid-borne copy does provide functional TUB1 (Fig. S5 B). In other assays of tubulin function, an additional copy of TUB1 confers strong benomyl resistance and slightly increases the frequency of long microtubules in wild-type diploid cells but did not noticeably alter polymerization rate (Fig. S5, C–E). When we perform quantitative Western blotting, we found that the additional copy of TUB1 does not change the levels of α- or β-tubulin proteins (Schatz et al., 1986). Together these data suggest that increasing α-tubulin gene copy number confers resistance to microtubule destabilizing drugs, but otherwise does not lead to major changes in microtubule function or tubulin protein levels.
Exogenous copy of TUB1 and co-overexpression of α- and β-tubulin are tolerated. (A) Schematic of the CEN-based additional copy of TUB1.(B) Normalized doubling times of wild-type or tub1Δ/TUB1 with an empty vector or additional copy of TUB1 on a CEN plasmid. For each genotype, four technical replicates of two biological replicates were used across three independent experiments. Circles represent cultures in separate wells and triangles are the means of each day. Colors indicate independent experiments. Asterisk indicates P < 0.05 between wild type and mutant based on t test after one-way ANOVA. Bars are mean ±95% CI. (C) Tenfold dilution series of indicated strains were spotted onto rich medium or rich medium supplemented with benomyl. Cells were grown at the indicated temperature for the indicated number of days. (D) Histogram of all astral microtubule lengths from time-lapse imaging of wild-type cells with an empty vector or an extra copy of TUB1. Data are from at least three separate experiments for each genotype, and a total of at least 26 cells were analyzed for each genotype. (E) Polymerization rates of astral microtubules. Each dot represents a single polymerization event, and dots are colored by experimental day. Bars are median ± 95% CI. (F) Paired molecules of α- or β-tubulin per cell for each genotype. Protein mass (ng) was converted to molecules per cell. Data represent four independent experiments with two biological replicates, and each dot is mean molecules per cell of the four technical replicates. Dots are colored by experiment. (G) Table of astral microtubule dynamics and soluble tubulin levels in diploid cells + TUB1 or + ev. Values in bold have P < 0.05 from wild type + ev, based on a t test. a, Median values (95% CI); b, Mean values ±95% CI; c, Mean values ±95% CI. (H) Representative Western blot of β- and α-tubulin during TUB1 and TUB2 co-induction. Blots were probed for α- or β-tubulin and Zwf1 (G6PD) as a loading control. (I) Quantification of TUB1 and TUB2 co-induction for both α- and β-tubulin across overexpression. Dots represent mean ± SD from three independent induction experiments. (J) Quantification of cells forming colonies after TUB1 and TUB2 induction or with empty vector. Dots represent mean ± SD from three independent induction experiments. Source data are available for this figure: SourceData FS5.

Exogenous copy of TUB1 and co-overexpression of α- and β-tubulin are tolerated. (A) Schematic of the CEN-based additional copy of TUB1.(B) Normalized doubling times of wild-type or tub1Δ/TUB1 with an empty vector or additional copy of TUB1 on a CEN plasmid. For each genotype, four technical replicates of two biological replicates were used across three independent experiments. Circles represent cultures in separate wells and triangles are the means of each day. Colors indicate independent experiments. Asterisk indicates P < 0.05 between wild type and mutant based on t test after one-way ANOVA. Bars are mean ±95% CI. (C) Tenfold dilution series of indicated strains were spotted onto rich medium or rich medium supplemented with benomyl. Cells were grown at the indicated temperature for the indicated number of days. (D) Histogram of all astral microtubule lengths from time-lapse imaging of wild-type cells with an empty vector or an extra copy of TUB1. Data are from at least three separate experiments for each genotype, and a total of at least 26 cells were analyzed for each genotype. (E) Polymerization rates of astral microtubules. Each dot represents a single polymerization event, and dots are colored by experimental day. Bars are median ± 95% CI. (F) Paired molecules of α- or β-tubulin per cell for each genotype. Protein mass (ng) was converted to molecules per cell. Data represent four independent experiments with two biological replicates, and each dot is mean molecules per cell of the four technical replicates. Dots are colored by experiment. (G) Table of astral microtubule dynamics and soluble tubulin levels in diploid cells + TUB1 or + ev. Values in bold have P < 0.05 from wild type + ev, based on a t test. a, Median values (95% CI); b, Mean values ±95% CI; c, Mean values ±95% CI. (H) Representative Western blot of β- and α-tubulin during TUB1 and TUB2 co-induction. Blots were probed for α- or β-tubulin and Zwf1 (G6PD) as a loading control. (I) Quantification of TUB1 and TUB2 co-induction for both α- and β-tubulin across overexpression. Dots represent mean ± SD from three independent induction experiments. (J) Quantification of cells forming colonies after TUB1 and TUB2 induction or with empty vector. Dots represent mean ± SD from three independent induction experiments. Source data are available for this figure: SourceData FS5.
We next investigated how cells respond to acute overexpression of TUB1, using a galactose-inducible system similar to our TUB2 system. After 15 min of galactose induction, the level of α-tubulin in cell lysates is 1.3× the amount measured in uninduced control cells (Fig. 4, A and B), which is similar to the rate of β-tubulin induction measured in Fig. 3. However, we saw no change in the ability of cells to form colonies when α-tubulin is overexpressed (Fig. 4 C). At 1 h of galactose induction, the level of α-tubulin in cell lysates is 1.7× the amount measured in uninduced cells, and we found no loss in colony formation (Fig. 4, B and C). This suggests that excess α-tubulin does not impair fitness, which is in contrast to excess β-tubulin (Fig. 3 B). In a separate experiment, we found that after 24-h of induction, the level of α-tubulin in cell lysates is 1.2× the amount measured in uninduced cells, with no change in β-tubulin levels (Fig. 4 B). To test whether the toxicity associated with β-tubulin overexpression is attributable to increased tubulin levels or to super-stoichiometric β-tubulin, we simultaneously induced α- and β-tubulin overexpression from separate plasmids in the same cells (Fig. S5, H and I). Under these conditions, we found that α- and β-tubulin levels increase with kinetics similar to the individual overexpression experiments, but there is no change in colony formation over our time course of induction (Fig. S5 J). We conclude that super-stoichiometric β-tubulin is uniquely toxic to cells.

Cells tolerate super-stoichiometric α-tubulin. (A) Representative Western blot of α- and β-tubulin during TUB1 induction. Blots were probed for α- or β-tubulin and Zwf1 (G6PD) as a loading control. (B) Quantification of TUB1 induction for both α- and β-tubulin across overexpression. Data from 24 h post-induction is from a separate set of experiments. Dots represent mean ± SD from four independent induction experiments, open circle indicates the separate experiment used to measure tubulin levels at 24 h post-induction. (C) Quantification of cells forming colonies after TUB1 or empty vector induction. Dots represent mean ± SD from three independent induction experiments. (D) Example images of wild-type cells overexpressing TUB1 for 0 or 2 h and stained for α- or β-tubulin. Arrows indicate astral microtubules; arrowheads indicate tubulin assemblies. Scale bar = 1 µm. Images are maximum intensity projections of in focus z positions. (E) Quantification of astral microtubules across induction time for both α- and β-tubulin staining. Dots represent mean ±95% CI from three independent experiments with at least 100 cells per experiment. (F) Quantification of tubulin assemblies across induction time for both α- and β-tubulin staining. Dots represent mean ±95% CI from three independent experiments with at least 100 cells per experiment. (G) Example images of cells expressing the indicated + TIP and mRuby-Tub1 with TUB1 induced or uninduced for 2 h. Confocal images were processed in Fiji using the Despeckle filter and stacks were converted to sum projections. Scale bar = 1 µm. (H) Quantification of the fraction of cells exhibiting a focus of +TIP that tracks a dynamic microtubule plus end in uninduced or induced cells. Each dot represents a single experiment. Bars are mean ±95% CI. Source data are available for this figure: SourceData F4.
Cells tolerate super-stoichiometric α-tubulin. (A) Representative Western blot of α- and β-tubulin during TUB1 induction. Blots were probed for α- or β-tubulin and Zwf1 (G6PD) as a loading control. (B) Quantification of TUB1 induction for both α- and β-tubulin across overexpression. Data from 24 h post-induction is from a separate set of experiments. Dots represent mean ± SD from four independent induction experiments, open circle indicates the separate experiment used to measure tubulin levels at 24 h post-induction. (C) Quantification of cells forming colonies after TUB1 or empty vector induction. Dots represent mean ± SD from three independent induction experiments. (D) Example images of wild-type cells overexpressing TUB1 for 0 or 2 h and stained for α- or β-tubulin. Arrows indicate astral microtubules; arrowheads indicate tubulin assemblies. Scale bar = 1 µm. Images are maximum intensity projections of in focus z positions. (E) Quantification of astral microtubules across induction time for both α- and β-tubulin staining. Dots represent mean ±95% CI from three independent experiments with at least 100 cells per experiment. (F) Quantification of tubulin assemblies across induction time for both α- and β-tubulin staining. Dots represent mean ±95% CI from three independent experiments with at least 100 cells per experiment. (G) Example images of cells expressing the indicated + TIP and mRuby-Tub1 with TUB1 induced or uninduced for 2 h. Confocal images were processed in Fiji using the Despeckle filter and stacks were converted to sum projections. Scale bar = 1 µm. (H) Quantification of the fraction of cells exhibiting a focus of +TIP that tracks a dynamic microtubule plus end in uninduced or induced cells. Each dot represents a single experiment. Bars are mean ±95% CI. Source data are available for this figure: SourceData F4.
We next tested whether α-tubulin overexpression alters the microtubule cytoskeleton. We used immunofluorescence to visualize α- and β-tubulin in wild-type haploid cells at the same induction timepoints as our above experiments with β-tubulin. We found no change in the fraction of cells with astral microtubules during α-tubulin overexpression (Fig. 4, D and E; and Fig. S4, I–P). We also saw tubulin assemblies formed during α-tubulin induction, though these always appeared as foci (Fig. 4 F and Fig. S4, I–P). This suggests that super-stoichiometric levels of α-tubulin do not disrupt the microtubule cytoskeleton, in contrast to what we found for super-stoichiometric levels of β-tubulin.
We utilized the same panel of +TIPs to investigate the impact of α-tubulin overexpression on microtubules in living cells. We found that α-tubulin overexpression does not noticeably disrupt microtubule architecture or the localization of Bim1, Bik1, Stu2, or Kip3, even in cells that also exhibit α-tubulin assemblies (Fig. 4, G and H). Bim1 and Stu2 do not localize to the assemblies formed during α-tubulin overexpression; however, Bik1 and Kip3 do show some localization to these assemblies, albeit at weaker signal intensities than what is observed at microtubule plus ends (Fig. 4, G and H). Overall, our results suggest that overexpressed α-tubulin does not interfere with the microtubule cytoskeleton and can form ectopic tubulin assemblies, although the morphology is different than what we observed during β-tubulin overexpression.
α-tubulin isotypes Tub1 and Tub3 are balanced to prevent super-stoichiometric α-tubulin levels
Our results thus far suggest a major difference between α- and β-tubulin proteostasis: when α-tubulin expression in increased cells can readily equilibrate the newly expressed protein with existing tubulin to maintain the pool of αβ-tubulin heterodimers in the cell, but increasing β-tubulin expression destroys microtubules and creates a toxic accumulation of β-tubulin protein (Fig. 3 and Fig. 4 B). This led us to investigate how the two α-tubulin isotypes in budding yeast, TUB1 and TUB3, might be coordinated to maintain α-tubulin levels. To do this, we built a strain in which we fused GFP to the 5′ end of chromosomal TUB3 and replaced the endogenous TUB3 promoter with a galactose-inducible promoter (Fig. 5 A). We induced GFP-Tub3 expression by adding galactose to log-phase cultures and took samples for microscopy or Western blotting at 2, 3, and 24 h post-induction (Fig. 5 B). The GFP tag allows us to visualize the GFP-Tub3 production and the rate of assembly into microtubules in cells and allows us to separate GFP-Tub3 from endogenous untagged Tub1 on a Western blot probed for α-tubulin (Fig. 5, B and E). We first used microscopy to establish the temporal order of GFP signal accumulation in microtubules vs. the cytoplasm vs. ectopic tubulin assemblies (Fig. 5, C and D). We did this experiment in two ways: first, we induced cells and imaged at specific time points during induction (Fig. 5, B–D); and second, we induced cells and used time-lapse imaging to monitor GFP-Tub3 production and dynamics in living cells (Video 1). These experiments show that the total cellular GFP-Tub3 signal increases from 2 to 3 h of induction but is slightly decreased at 24 h of induction (Fig. 5 C). The accumulation of GFP-Tub3 into microtubules shows a different trend. GFP-Tub3 is detectable in microtubule polymer approximately an hour after galactose induction, before it is detectably increased in the cytoplasm, and the amount of GFP signal in microtubules steadily increases to reach the highest level 24 h after induction (Fig. 5, B and C). In addition to the accumulation of GFP-Tub3 in microtubules, we observed the formation of GFP-Tub3 assemblies that are separate from microtubules (Fig. 5 B). These foci are reminiscent of the tubulin assemblies observed during Tub1/α-tubulin overexpression in Fig. 4 D. Interestingly, GFP-Tub3-containing assemblies are not detectable by 24 h post-induction (Fig. 5 B). Together these results suggest that cells may limit the accumulation of α-tubulin protein during overexpression and identify α-tubulin-containing assemblies as a potential intermediate state involved in regulating α-tubulin levels.

Tub1 and Tub3 isotypes are balanced to set α-tubulin protein levels. (A) Schematic of gene composition for the GFP-Tub3 induction strain and time course of induction experiments. (B) Example images of GFP-Tub3 in cells at indicated induction time. Arrowheads indicate tubulin assemblies. Scale bar = 1 µm. Images are a maximum intensity projection of z series. (C) Quantification of whole cell GFP-Tub3 fluorescence intensity. Each dot represents a single cell and are colored by replicate, triangles represent the mean of each experiment. Bars are mean ± 95% CI. (D) Quantification of GFP-Tub3 fluorescence intensity in astral microtubules. Each dot represents a single microtubule in a single cell and are colored by replicate, triangles represent the mean of each experiment. P value between wild type and mutant based on t test after one-way ANOVA. Bars are mean ± 95% CI. (E) Representative Western blot of GFP-Tub3 induction. Blots were probed for α- or β-tubulin, and Zwf1 (G6PD) as a loading control. (F) Quantification of total α- and β-tubulin levels across GFP-Tub3 induction. Dots are mean ± SD from three independent experiments, normalized to the level of α- or β-tubulin prior to induction. (G) Quantification of Tub1 and GFP-Tub3 levels across induction. Dots are mean ± SD from three independent experiments, normalized to the Tub1 levels prior to induction. P values were determined by t test after a one-way ANOVA. (H) Representative Western blot of tubulin levels after GFP-Tub3 shut off. Blots were probed for α- or β-tubulin, and Zwf1 (G6PD) as a loading control. (I) Quantification of total α- and β-tubulin levels after GFP-Tub3 shut off. Dots are mean ± SD from four independent experiments, normalized to the α- or β-tubulin levels at shutoff (t = 0). P values were determined by t test compared to t = 0, after a one-way ANOVA. Only P values <0.05 are shown. (J) Quantification of Tub1 and GFP-Tub3 levels after GFP-Tub3 shut off. Dots are mean ± SD from four independent experiments, normalized to the Tub1 or GFP-Tub3 levels at shutoff (t = 0). P values were determined by t test compared to t = 0, after a one-way ANOVA. Only P values <0.05 are shown. Dashed line represents the estimated loss of protein due to titration by cell division, calculated from the increase in Zwf1 signal. (K) Representative Western blot of Tub2-6xHis induction. Blots were probed for α- or β-tubulin, and Zwf1 (G6PD) as a loading control. (L) Quantification of total α- and β-tubulin levels across Tub2-6xHis induction. Dots are mean ± SD from five independent experiments, normalized to α- or β-tubulin levels prior to induction. (M) Quantification of Tub2-438Δ and Tub2-6xHis levels across Tub2-6xHis induction. Dots are mean ± SD from five independent experiments, normalized to Tub2-438Δ levels prior to induction. (N) Representative Western blot of Tub2-6xHis shut off. Blots were probed for α- or β-tubulin, and Zwf1 (G6PD) as a loading control. (O) Quantification of total α- and β-tubulin levels after Tub2-6xHis shut off. Dots are mean ± SD from four independent experiments, normalized to the α- or β-tubulin levels at shutoff (t = 0). (P) Quantification of Tub2-438Δ and Tub2-6xHis levels after Tub2-6xHis shut off. Dots are mean ± SD from four independent experiments, normalized to Tub2-438Δ or Tub2-6xHis levels at shutoff (t = 0). (Q) Representative Western blot of GFP-Tub3 induction with or without cycloheximide (CHX) treatment. (R) Quantification of Tub1 protein levels in indicated treatment groups. Data represent four experiments and are colored by day. Bars are mean ±95% CI. Source data are available for this figure: SourceData F5.
Tub1 and Tub3 isotypes are balanced to set α-tubulin protein levels. (A) Schematic of gene composition for the GFP-Tub3 induction strain and time course of induction experiments. (B) Example images of GFP-Tub3 in cells at indicated induction time. Arrowheads indicate tubulin assemblies. Scale bar = 1 µm. Images are a maximum intensity projection of z series. (C) Quantification of whole cell GFP-Tub3 fluorescence intensity. Each dot represents a single cell and are colored by replicate, triangles represent the mean of each experiment. Bars are mean ± 95% CI. (D) Quantification of GFP-Tub3 fluorescence intensity in astral microtubules. Each dot represents a single microtubule in a single cell and are colored by replicate, triangles represent the mean of each experiment. P value between wild type and mutant based on t test after one-way ANOVA. Bars are mean ± 95% CI. (E) Representative Western blot of GFP-Tub3 induction. Blots were probed for α- or β-tubulin, and Zwf1 (G6PD) as a loading control. (F) Quantification of total α- and β-tubulin levels across GFP-Tub3 induction. Dots are mean ± SD from three independent experiments, normalized to the level of α- or β-tubulin prior to induction. (G) Quantification of Tub1 and GFP-Tub3 levels across induction. Dots are mean ± SD from three independent experiments, normalized to the Tub1 levels prior to induction. P values were determined by t test after a one-way ANOVA. (H) Representative Western blot of tubulin levels after GFP-Tub3 shut off. Blots were probed for α- or β-tubulin, and Zwf1 (G6PD) as a loading control. (I) Quantification of total α- and β-tubulin levels after GFP-Tub3 shut off. Dots are mean ± SD from four independent experiments, normalized to the α- or β-tubulin levels at shutoff (t = 0). P values were determined by t test compared to t = 0, after a one-way ANOVA. Only P values <0.05 are shown. (J) Quantification of Tub1 and GFP-Tub3 levels after GFP-Tub3 shut off. Dots are mean ± SD from four independent experiments, normalized to the Tub1 or GFP-Tub3 levels at shutoff (t = 0). P values were determined by t test compared to t = 0, after a one-way ANOVA. Only P values <0.05 are shown. Dashed line represents the estimated loss of protein due to titration by cell division, calculated from the increase in Zwf1 signal. (K) Representative Western blot of Tub2-6xHis induction. Blots were probed for α- or β-tubulin, and Zwf1 (G6PD) as a loading control. (L) Quantification of total α- and β-tubulin levels across Tub2-6xHis induction. Dots are mean ± SD from five independent experiments, normalized to α- or β-tubulin levels prior to induction. (M) Quantification of Tub2-438Δ and Tub2-6xHis levels across Tub2-6xHis induction. Dots are mean ± SD from five independent experiments, normalized to Tub2-438Δ levels prior to induction. (N) Representative Western blot of Tub2-6xHis shut off. Blots were probed for α- or β-tubulin, and Zwf1 (G6PD) as a loading control. (O) Quantification of total α- and β-tubulin levels after Tub2-6xHis shut off. Dots are mean ± SD from four independent experiments, normalized to the α- or β-tubulin levels at shutoff (t = 0). (P) Quantification of Tub2-438Δ and Tub2-6xHis levels after Tub2-6xHis shut off. Dots are mean ± SD from four independent experiments, normalized to Tub2-438Δ or Tub2-6xHis levels at shutoff (t = 0). (Q) Representative Western blot of GFP-Tub3 induction with or without cycloheximide (CHX) treatment. (R) Quantification of Tub1 protein levels in indicated treatment groups. Data represent four experiments and are colored by day. Bars are mean ±95% CI. Source data are available for this figure: SourceData F5.
pGAL-GFP-TUB3 induction example #1. Images were collected every 2 min. Video is a sum intensity projection and exported at 7 frames/s, scale bar = 1 µm.
pGAL-GFP-TUB3 induction example #1. Images were collected every 2 min. Video is a sum intensity projection and exported at 7 frames/s, scale bar = 1 µm.
Our time-lapse imaging captures the formation and dissolution of the GFP-Tub3-containing assemblies. We found that puncta of GFP-Tub3 signal begin to appear around 2 h post induction and diffuse around the cell before dissolving at around 5.5 h post induction (Videos 1, 2, and 3). We noted that the signal of GFP-Tub3 in microtubules gradually increases over this time course. These results suggest that GFP-Tub3-containing assemblies are transient structures.
pGAL-GFP-TUB3 induction example #2. Images were collected every 2 min. Video is a sum intensity projection and exported at 7 frames/s, scale bar = 1 µm.
pGAL-GFP-TUB3 induction example #2. Images were collected every 2 min. Video is a sum intensity projection and exported at 7 frames/s, scale bar = 1 µm.
pGAL-GFP-TUB3 induction example #3. Images were collected every 2 min. Video is a sum intensity projection and exported at 7 frames/s, scale bar = 1 µm.
pGAL-GFP-TUB3 induction example #3. Images were collected every 2 min. Video is a sum intensity projection and exported at 7 frames/s, scale bar = 1 µm.
We next compared how the induction of high levels of GFP-Tub3 expression impacts the levels of the other α-tubulin isotype, Tub1. Our Western blots show that total α-tubulin is increased approximately twofold at 2 h post induction, followed by a decrease that returns to pre-induction levels by 24 h (Fig. 5, E and F). When we compare individual levels of the GFP-Tub3 and Tub1 isotypes by Western blot, we saw that as GFP-Tub3 levels strongly increase during the first 2 h after induction, levels of endogenous Tub1 decrease (Fig. 5 G). After 24 h of induction, GFP-Tub3 levels decreased to nearly match the level of Tub1 that we measured prior to galactose-induction, while Tub1 was decreased to <0.5× of pre-induction levels (Fig. 5 F). Through this time course, we found no change in β-tubulin levels, even by 24 h (Fig. 5, E and F). The consistent level of β-tubulin stands in contrast to the decrease in Tub1 α-tubulin, and indicates that decrease in Tub1 is not attributable to titration of protein levels through cell division. To measure the stability of α-tubulin after overexpression, we performed a separate experiment where we induced GFP-Tub3 expression from the galactose promoter for 2 h, then shut off transcription by moving cells to glucose-containing media and monitored tubulin levels at 1, 3, and 5 h. These experiments show rapid loss of GFP-Tub3 after shut off and a return of total α-tubulin to pre-induction levels within several hours (Fig. 5, H–J). The rate of GFP-Tub3 loss is approximately 2× faster than we would expect for dilution of the protein across cell divisions. Together, these data suggest that overexpression transiently increases levels of α-tubulin and stimulates rapid protein turnover that includes depletion of other α-tubulin isotypes to return to pre-induction levels of total α-tubulin.
We next asked if β-tubulin protein levels are similarly balanced in response to increased β-tubulin expression. To answer this question, we created a strain where we could distinguish the endogenous β-tubulin from conditionally overexpressed β-tubulin by Western blot. We utilized a haploid strain in which the last 19 codons of the carboxy-terminal tail were removed from chromosomal TUB2, creating a tub2-438∆ allele, and transformed these cells with a plasmid for galactose-inducible expression of full-length Tub2 with a 6xHis tag fused to the carboxy-terminus. This allows us to distinguish the faster-migrating, endogenous tub2-438∆ polypeptide from the slower-migrating, exogenous Tub2-6xHis on a Western blot (Fig. 5 K). Due to the toxicity associated with excess β-tubulin expression, we used an abbreviated time course lasting 5 h for our Western blots. Nevertheless, we saw a steady increase in total β-tubulin levels during galactose induction, reaching a fourfold increase by 4 h (Fig. 5 L). The induced Tub2-6xHis increases steadily during this time course, while the endogenous tub2-438∆ β-tubulin shows no change in protein levels (Fig. 5 M). We also saw no change in the α-tubulin levels over the time course (Fig. 5 L). Separately, when we shut off Tub2-6XHis expression after 2 h of induction and then measure protein levels at 1, 3, and 5 h, we found that Tub2-6XHis and endogenous tub2-438∆ protein levels do not decrease (Fig. 5, N–P). During this shutoff experiment, we found little to no increase in cell density which is consistent with excess β-tubulin inhibiting proliferation. This suggests that excess β-tubulin is not rapidly turned over like excess α-tubulin.
Finally, we wanted to determine if the turnover of α-tubulin during GFP-Tub3 overexpression is stimulated by changes in mRNA levels or protein levels. To test this, we induced GFP-Tub3 expression for 3 h in cells treated with cycloheximide to inhibit translation or DMSO as a control, and took samples for Western blotting (Fig. 5 Q). We predicted that whether increased GFP-TUB3 mRNA levels are sufficient to trigger the decline in Tub1 protein levels, then inducing GFP-TUB3 transcription in the presence of cycloheximide would be sufficient to trigger the depletion of Tub1. We instead found that cells treated with cycloheximide and induced for GFP-Tub3 expression maintained steady Tub1 levels (Fig. 5 R). Together these data suggest that increased levels of α-tubulin protein stimulate the turnover of the α-tubulin pool in the cell.
Discussion
All eukaryotic genomes contain families of genes for α- and β-tubulins that typically exhibit developmental and cell-type specific expression programs (Miller et al., 1987; Erickson, 2007; Wickstead and Gull, 2011; Findeisen et al., 2014). How are the expression of these genes and proteostasis of α- and β-tubulins coordinated to meet a cell’s demand for tubulin heterodimers, while maintaining the appropriate balance of each subunit? In this study we identify an asymmetric requirement for tubulin gene copy number in budding yeast; cells have a stronger requirement for α-over β-tubulin genes. Diploid budding yeast contains ∼50% more α-tubulin than β-tubulin and there are distinct consequences when the normal ratio of α-to β-tubulin is disrupted. Increasing β-tubulin levels disrupts microtubules and forms non-microtubule tubulin assemblies. Conversely, increasing α-tubulin is tolerated through an equilibration mechanism that decreases excess α-tubulin. Our findings indicate that α- and β-tubulin are regulated through distinct mechanisms and identify an important role for α-tubulin in preventing β-tubulin toxicity.
We estimate that diploid yeast cells maintain ∼0.31 µM α-tubulin and ∼0.20 µM β-tubulin, based on an average volume of 120 fl per cell (Sherman, 2002). In principle, α- and β-tubulin proteins exist in multiple states in the cell, including αβ-tubulin heterodimers that exchange between a soluble pool and microtubule polymer, and non-heterodimer states that represent steps in tubulin biogenesis or recycling and could be present as soluble monomers (Fig. 6). Decreasing α- or β-tubulin gene copy number would be expected to undersupply the corresponding tubulin protein and deplete one or more of these states, manifesting as less tubulin detected in the cell and/or short, slowly polymerizing microtubules. Our results are consistent with that prediction, with β-tubulin genes having a stronger impact than α-tubulin genes (Fig. 2). This is consistent with the expected balance between soluble tubulin and microtubules (Jonasson et al., 2020), and suggests that in yeast β-tubulin is limiting for the heterodimer state. Loss of one copy of the α-tubulin gene TUB1 leads to a slight decrease in the amount of α-tubulin protein in the cell, accompanied by a strong increase in the amount of β-tubulin (Fig. 2 G). Overall, our results support a model in which gene copy number is important for maintaining the concentration of α- and β-tubulin in a cell and identifies an unexpected role for α-tubulin genes in limiting the accumulation of β-tubulin protein.

Proposed model for α-tubulin regulation of β-tubulin. (A) Updated model for how wild-type cells express tubulin from mRNA to protein and undergo folding and assembly into heterodimers. Our data suggests that cells hold an excess of α-tubulin that could exist as TBC-bound or soluble monomers. (B) In conditions where there is super-stoichiometric α-tubulin in cells, surplus α-tubulin drives monomerization and the formation of a transient α-tubulin assemblies. Our data shows that cells then down regulate the alternative isotype to restore endogenous expression and at the same time the assemblies dissipate. (C) In conditions where there is super-stoichiometric β-tubulin in cells, surplus β-tubulin drives the monomerization and formation of dead-end β-tubulin assemblies. Our data suggests these assemblies disrupt microtubule architecture and +TIP localization.
Proposed model for α-tubulin regulation of β-tubulin. (A) Updated model for how wild-type cells express tubulin from mRNA to protein and undergo folding and assembly into heterodimers. Our data suggests that cells hold an excess of α-tubulin that could exist as TBC-bound or soluble monomers. (B) In conditions where there is super-stoichiometric α-tubulin in cells, surplus α-tubulin drives monomerization and the formation of a transient α-tubulin assemblies. Our data shows that cells then down regulate the alternative isotype to restore endogenous expression and at the same time the assemblies dissipate. (C) In conditions where there is super-stoichiometric β-tubulin in cells, surplus β-tubulin drives the monomerization and formation of dead-end β-tubulin assemblies. Our data suggests these assemblies disrupt microtubule architecture and +TIP localization.
It is important to note that our measurements are likely an underestimate of the total number of tubulin molecules in the cell. Previously published tomograms of anaphase spindles in diploid S. cerevisiae show a total of ∼23 µm of microtubule polymer in the spindle (Winey et al., 1995). Assuming 1,625 heterodimers per µm of a 13-protofilament budding yeast microtubule lattice (Howes et al., 2018), we estimated that the amount of microtubule lattice in these anaphase spindles would require at least 37,375 heterodimers in polymer. Our measurements of tubulin after cell lysis under denaturing conditions indicate an average of 22,616 α-tubulins and 14,755 β-tubulins; therefore, our experiments either underrepresent anaphase cells or our lysates may not include all the tubulin in spindle microtubules (Fig. 2 G). We suspected that some tubulin in microtubule polymers is lost to the pelleted fraction after lysis, because we found in separate experiments that chilling cells at 4°C for 1 h to depolymerize microtubules prior to lysis leads to an increased but highly variable amount of α- and β-tubulin in the soluble fraction (L. Wethekam, unpublished observation). Thus, we regarded our lysate measurements as capturing most but not all of the tubulin in the yeast cell.
As further evidence of cells maintaining soluble pool at the expense of microtubule polymers, we found that pre-anaphase spindles are shorter in cells lacking a copy of α- or β-tubulin encoding genes, individually or in combination (Fig. 1, E and F). These shorter spindles are consistent with a decrease in microtubule polymer in the cell—we noted correlative changes in astral microtubule length and pre-anaphase spindle length across genotypes, suggesting an equilibrium between the cytoplasmic and nuclear pools of tubulin heterodimers are equally affected by changes in gene copy number. Despite the effect of α- or β-tubulin gene loss on microtubule polymer, our fitness assay shows that this effect alone does not strongly impact fitness (Fig. 1, B and C). This suggests that budding yeast cells produce more tubulin heterodimers than necessary to build a functional spindle, at least under optimal culturing conditions. In other words, supply exceeds demand and yeast cells normally maintain a surplus of α- and β-tubulin.
How do cells set the level of tubulin surplus? Mammals possess a defined autoregulatory mechanism for β-tubulin that responds to increases in soluble tubulin and prevents additional tubulin production through targeting tubulin mRNA for decay through the ribosome-associated protein TTC5 (Bachurski et al., 1994; Cleveland and Havercroft, 1983; Lin et al., 2020). Budding yeast lack a clear homologue for TTC5, calling into question whether autoregulation is broadly conserved. Our results suggest that budding yeast limit α-tubulin accumulation through an alternative mechanism. Providing cells with an extra of TUB1 does not increase tubulin levels or strongly affect microtubule assembly (Fig. S5, A–G). Conditionally inducing high levels of transcription of TUB3 stimulates a decrease in protein levels of the alternative α-tubulin isotype Tub1, and this requires the translation of TUB3 mRNA (Fig. 5). We found that these cells eventually return to total levels of α-tubulin that are similar to basal levels. Based on these results, we propose a model for α-tubulin regulation that is different from autoregulation. As depicted in Fig. 6, we propose that when α-tubulin is overexpressed, the surplus α-tubulin exists as tubulin monomers and assemblies that either exchange with αβ-heterodimers or are targeted for degradation (Fig. 6). In this way, newly created α-tubulin competes with pre-existing α-tubulin for binding to β-tubulin, and excess α-tubulin that is not in the heterodimer state may be degraded. The tubulin assemblies that we observe upon α-tubulin overexpression may represent a transient enrichment of the excess α-tubulin, which is subsequently incorporated into heterodimers or degraded. We speculate that exchange with the excess pool of α-tubulin may be an important part of tubulin proteostasis and could exist as either monomers or bound to TBCs that allow for the recycling of αβ-heterodimers and preventing the accumulation of monomeric β-tubulin.
Our results indicate that budding yeast regulate β-tubulin differently than α-tubulin. β-tubulin does not appear to access an alternative state that can be rapidly turned over. When we induced TUB2 overexpression, the levels of the native β-tubulin are not obviously affected (Fig. 5 M). Furthermore, when we shut off TUB2 overexpression, total β-tubulin levels remain elevated for hours, which is in contrast to the rapid loss of excess α-tubulin after shutting off its transcription (Fig. 5, H–J, N, and O). We speculate that the persistence of excess β-tubulin may reflect the formation of “dead-end” β-tubulin assemblies that exhibit slow exchange and are not readily targeted for degradation (Fig. 6).
While overexpression represents an extreme example of imbalanced α- and β-tubulin, our experiments in TUB1 hemizygotes demonstrate toxicity linked to an increase in β-tubulin (Fig. 2, G and H). This increase could represent the emergence of monomeric β-tubulin after saturating its binding partners, α-tubulin and TBCA/Rbl2. How might monomeric β-tubulin be toxic? We speculate that the tubulin assemblies formed when β-tubulin is in excess could involve interactions between β-tubulin monomers and/or between β-tubulin monomers and αβ-heterodimers. In this scenario, any β-β contacts along the longitudinal interface would lack the catalytic residues that α-tubulin normally provides to the exchangeable GTP-binding site (Anders and Botstein, 2001; LaFrance et al., 2022), and therefore these assemblies would be locked in a high affinity GTP-bound state. These hyperstable assemblies could then sequester tubulin heterodimers and select MAPs such as XMAP215/Stu2, depleting components from the cell’s microtubule network. Our overexpression experiments suggest that even a small excess of β-tubulin may be sufficient to set off this cascade and lead to microtubule loss. Further analysis of the structure and composition of β-tubulin assemblies is needed to test these possibilities. Together, this evidence suggests that budding yeast are unlikely to use the autoregulatory mechanism found in metazoans. Whereas autoregulation may have evolved in metazoans to manage the expanded isotype repertoire and programmed changes in tubulin expression during development, budding yeast may instead rely on increased α-tubulin gene copy number and expression to buffer against the toxic effects of excess β-tubulin.
The asymmetric requirement for α- vs. β-tubulin genes is also seen in metazoans. As multicellular species evolved, so did the requirement for robust tubulin expression. Some of the clearest examples of this come from studies of brain development in mouse models, where differentiating cells experience an increased demand for αβ-tubulin. Knocking out the α-tubulin gene TUBA1A causes severe brain malformation and is perinatal lethal, but knocking out any of several β-tubulin genes results in milder malformations or subsequent axon repair defects (Bittermann et al., 2019; Latremoliere et al., 2018). Missense mutations in any of these tubulin isotypes are linked to severe brain malformations in humans, demonstrating the important roles of these genes in supplying functional tubulin (Romaniello et al., 2018; Bahi-Buisson and Maillard, 2021; Park et al., 2021). Full knockouts of β-tubulin genes are less severe than knocking out TUBA1A indicates a stronger requirement for α-tubulin gene copy number than β-tubulin gene copy number, reminiscent of our findings in the single celled yeast. How could cells ensure sufficient α-tubulin expression to buffer against β-tubulin-induced toxicity? One way is through simply having more genes for α-tubulin than β-tubulin. Indeed, we found that in most species the number of α-tubulin genes is greater than or equal to the number of β-tubulin genes, suggesting unbalanced β-tubulin gene expansion is rare and perhaps detrimental (Findeisen et al., 2014). In S. cerevisiae, the greater number of α-tubulin genes arose from a whole genome duplication that resulted in two α-tubulin isotypes: TUB1 and TUB3. It is well-established that TUB1 is an essential gene in haploid yeast, while TUB3 is non-essential (Schatz et al., 1986), and our data suggest a stronger requirement for TUB1 over TUB3 in diploid cells (Fig. 1). This may be attributable to higher levels of α-tubulin expression from TUB1, compared to TUB3, which has been demonstrated by previous studies but recently called into question (Kilmartin, 1981; Barnes et al., 1992; Bode et al., 2003; Gartz Hanson et al., 2016; Nsamba et al., 2021). Nevertheless, our results suggest that maintaining two α-tubulin isotypes could provide a fitness advantage by together producing higher levels of α-tubulin. While both α-tubulins were maintained after the genome duplication, one β-tubulin gene was lost from the genome leaving only TUB2. Additional copies of TUB2 or aneuploidies of its chromosome (VI) are lethal, suggesting that loss of the second β-tubulin gene millions of years ago may have been advantageous (Katz et al., 1990; Burke et al., 1989; Torres et al., 2007; Anders et al., 2009). Further back in the evolution of tubulin, we knew that α- and β-tubulin are themselves the result of a gene duplication and diversification of the bacterial protein FtsZ. Perhaps an important step in this evolution from a monomer to a heterodimer was the emergence of an α-tubulin precursor to regulate the activity and prevent the toxicity of the β-tubulin precursor.
Materials and methods
Yeast manipulation and culturing
Yeast manipulation, media, and transformations were performed by standard methods (Amberg et al. 2000). A detailed list of strains, plasmids, and oligonucleotides are provided in Tables S1, S2, and S3. Deletion mutants were generated by PCR -based, homologous recombination methods (Petracek and Longtine, 2002). Spc110-mNeonGreen, Spc110-tdTomato, and Kip3-mNeonGreen were generated using PCR-based methods and expressed from the genomic locus (Sheff and Thorn, 2004). The mNeonGreen fluor was provided by Allele Biotechnology and Pharmaceuticals (Shaner et al., 2013). Bik1-3GFP, Bim1-3GFP, and Stu2-3GFP were generated using an integrating plasmid and expressed from the genomic locus. The Bik1-3GFP integrating plasmid was a gift from Dr. David Pellman (Carvalho et al., 2004). The Bim1-3GFP integrating plasmid was a gift from Dr. Tim Huffaker (Wolyniak et al., 2006). GFP-Tub1 fusions were integrated using plasmid pSK1050 (Song and Lee, 2001) and expressed in addition to the native α-tubulin.
Plasmid construction
To build the inducible Tub2 expression plasmid, we first built a diploid strain with one allele of wild-type Tub2 and the other allele tagged with 6xHis. This strain was generated by transforming a PCR fragment containing the c-terminal 6xHis tag with 331 base pairs of 3′ UTR followed by a TRP1 marker (Li and Moore, 2020). We confirmed that this Tub2-6xHis allele rescues β-tubulin function in yeast. Subsequently, a PCR fragment from pFA6a-KanMX6-PGAL1 containing homology to replace 185 base pairs 5′ of the start codon was transformed into the tub2-6xHis/TUB2 strain. A strain with both the promoter and the 6xHis tag on the same allele was used a template. Finally, to construct the plasmid, a fragment of DNA containing the galactose promoter, the TUB2 coding sequence, and 427 base pairs of the 3′ UTR (including the TRP1 marker) were cloned into the NotI and SacI sites of pRS316 or pRS313. To build the inducible Tub1 plasmid, a diploid strain was generated that replaced 166 base pairs of the endogenous promoter of one allele of TUB1 with KanMX6-PGAL1. To assemble the plasmid a fragment of DNA containing the galactose promoter, the TUB1 sequence (including intron), and 487 base pairs of the 3′ UTR were cloned into the NotI site of pRS315 or the NotI and SacI sites of pRS316. To build the extra copy of TUB1 a fragment of 992 base pairs 5′ of TUB1 through 487 base pairs of the 3′ UTR including the intron were cloned into the NotI and KpnI sites of pRS316. The Stu2-3GFP integrating plasmid was generated by PCR-amplification of base pairs 1,479-2,664 from chromosomal STU2 and cloning into the BamHI site of pBJ1376 (Lee et al. 2003), to create plasmid pJM459. This plasmid was digested with EcoRV for integration at the STU2 locus and confirmed by PCR.
Microscopy
All live-cell fluorescence images were collected by spinning disk confocal microscopy using a Nikon Ti-E microscope equipped with a 1.45 NA 100× CFI Plan Apo objective, piezo electric stage (Physick Instrumente), spinning disk confocal scanner unit (CSU10: Yokogawa), 488 and 561 nm lasers (Agilent Technologies), and an EMCCD camera (iXon Ultra 897, Andor Technology); using NIS Elements software (Nikon). All fixed-cell images and time-lapse DIC images were collected on a Nikon Ti-E wide field microscope equipped with a 1.49 NA 100xCFI160 Apochromat objective and an ORCA-Flash 4.0 LLT sCMOS camera (Hammamatsu Photonics) using NIS Elements software (Nikon). For live cell imaging on both microscopes, stages were incubated at 30°C using an ASI 400 Air Stream Incubator (NEVTEK). Images were processed in FIJI.
Liquid growth assay
Cells were grown in 3 ml of rich liquid media (YPD) to saturation at 30°C and diluted 50-fold into fresh media. The diluted cultures were then aliquoted into a 96-well plate, with three to six technical replicates per experiment, and incubated at 30°C with single orbital shaking in a plate reader. We used two different instruments for our experiments. A Cytation3 plate reader (BioTek) was used for experiments with strains: yJM0091, 3613, 0591, 1693, 0592, 2065, 0643, 3818, and an Epoch2 microplate reader (BioTek) was used for experiments with strains: yJM0091, 3613, 0099, 4908, 2618, 3982. The OD600 was measured every 5 min for 24 h. Doubling time was calculated by fitting the growth curves to a nonlinear exponential growth curve as previously published (Fees and Moore, 2018). Each experiment was repeated three independent times with wild-type cells included in each experiment as an internal control. To account for variability arising from using different plate readers we normalized the doubling times of each technical replicate to the mean of all technical replicates from wild-type controls for each experiment. P values are from Student’s t test after a one-way ANOVA with a Tukey post-hoc test for P < 0.05, or the Tukey post-hoc test for P > 0.05.
Solid growth assays
Cells were grown in rich liquid media to saturation at 30°C, and a 10-fold dilution series of each culture was spotted to either rich media plates or rich media plates supplemented with 5 or 10 µg/ml benomyl (#381586; Sigma Aldrich). Plates were grown at the indicated temperature for the indicated days. For the tubulin induction experiments, cells were grown in dropout media to select for the expression plasmid to saturation at 30°C, and a 10-fold dilution series of each culture was spotted to drop out plates supplemented with either 2% glucose to inhibit induction or 2% galactose to induce expression.
Pre-anaphase spindle measurements
Cells expressing Spc110-mNeonGreen were grown in rich liquid media at 30°C, then diluted and grown to log phase in fresh media. Cells were adhered to coverslips coated with concanavalin A and left in nonfluorescent media for imaging (Fees et al., 2017). Cells were imaged at 30°C. Z-series consisting of a 6 µm range at 0.35 µm steps were acquired every 20 s for 5 min.
Pre-anaphase cells were identified in image series of asynchronous cultures based on bud size and spindle length and cropped. Z-series images were processed in FIJI (Wayne Rasband, National Institutes of Health) using the “Despeckle” plugin followed by the “Remove Outlier” plugin with the radius set to 1 pixel and the threshold 25 to remove bright, outlier pixels. Spindle length over time was determined using a custom analysis program (Thomas et al. 2020). This program determines the X,Y,Z coordinates of the brightest pixel within the three-dimensional image stack (i.e., the first SPB), applying a Gaussian blur around this pixel, then identifying the second brightest pixel in the image stack (the second SPB). Spindle length was then defined as the linear distance between these points in three dimensions. This process was then repeated for every Z-series at each point in the time course. To calculate the coefficient of variation, the standard deviation of pre-anaphase spindle length measurements for an individual cell was divided by its mean length value. P-values are from Student’s t test after a one-way ANOVA with a Tukey post-hoc test for P < 0.05.
Microtubule dynamics in living cells
Cells expressing Bik1-3GFP were grown in rich liquid media or selective drop out media at 30°C, then diluted and grown to log phase in fresh media. Cells were adhered to coverslips coated with concanavalin A and left in nonfluorescent media for imaging. Cells were imaged at 30°C at 5 s intervals for 10 min. Z-series consisting of a 7 µm (Fig. 2, A–D) or 6 µm (Fig. S5, D and E) range with a step size of 0.45 µm was taken at each timepoint and analyzed as a 2-D maximum intensity projection in FIJI. Lengths were measured from the edge of the SPB to the tip of the astral microtubule at each time point. All analyses were done in asynchronous pre-anaphase cells. Lengths in pixels were processed using a custom analysis program (Estrem et al., 2017). P-values are from Student’s t test after a one-way ANOVA with a Tukey post-hoc test for P < 0.05.
Immunofluorescence
Cells with inducible TUB1 or TUB2 expression plasmids were grown in selective drop out media supplemented with 2% raffinose overnight. Cells were diluted into fresh medium, grown to log phase, and then induced with the addition of 2% galactose. The fixation and immunostaining protocol is modified from a previously published method (Miller, 2004). Cells were fixed with 3.7% formaldehyde (252549; Sigma-Aldrich) at 30°C for 2 h, centrifuged at 1,400 × g for 3 min, washed twice with wash buffer (40 mM KPO4, pH 6.5), and then stored overnight at 4°C. The fixed cells were then washed twice with wash buffer plus 1.2 M sorbitol and digested with 10 μl of 20T 50 mg/ml zymolyase (07663-91; Nacali Tesque) supplemented with 15 μl β-mercaptoethanol (M3148; Sigma-Aldrich) for 45 min at 37°C. Digested cells were spun down at 600 × g for 3 min, washed once with wash buffer plus 1.2 M sorbitol, and then resuspended in 20 μl wash buffer plus 1.2M sorbitol. 20 μl of cell suspension was spotted onto each well of a Teflon coated 10-well slide (18357; Polysciences) that had been pre-treated with 10 ng/μl poly-L-lysine. Cells adhered for 10 min at room temperature. Liquid was aspirated off before immediately permeabilizing the cells in a coplin jar of cold methanol (444310050; Acros Organics) for 6 min, followed by immersing the slide in cold acetone (A18-4; Fisher Chemical) for 30 s. Cells were blocked at room temperature for 1 h in blocking buffer (1X PBS + 0.5% BSA), then incubated overnight at 4°C in a humid chamber with mouse anti-α-tubulin (4A1; 1:100 in blocking buffer) or mouse anti-β-tubulin (E7, undiluted culture media collected from the hybridoma cells). Wells were washed 4 times for 10 min with blocking buffer, then incubated at room temperature for 1 h in a dark humid chamber with goat anti-mouse IgG-Alexa488 (1:500; A11001; Invitrogen in blocking buffer). Cells were washed 4 more times with blocking buffer. DAPI mounting solution (H-1200; Vector Laboratories) was added to the slide. Slides were imaged on the widefield microscope described above. Z-series consisting of a 7 µm range at 0.5 µm steps were acquired for Alexa488 and DAPI, with DIC image at home position. For analysis, in-focus planes were identified and maximum intensity projections were created.
Cold sensitivity assay
Cells expressing GFP-Tub1 Spc110-tdTomato and the pGal-Tub2-6xHis plasmid were grown in 3 ml of selective growth media supplemented with 2% raffinose at 30°C, diluted into fresh medium, and grown to mid-log phase. Cells were then induced with the addition of 2% galactose for 3 h at 30°C. As a control a second set of cultures were supplemented with 2% glucose to block induction. Cells were then moved to 4°C at 0, 0.25, 0.5, 1, 2, and 24 h of induction and then fixed with 3.7% formaldehyde in 0.1 M KPO4 for 2 min. The cells were pelleted in a benchtop mini microcentrifuge, resuspended in a quencher solution (0.1% Triton-X, 0.1 M KPO4, and 10 mM ethanolamine, pelleted again, and washed once in 0.1 M KPO4. Fixed cells were loaded into slide chambers coated with concanavalin A, washed with 0.1 M KPO4, and the chambers were sealed with VALAP. Z-series were acquired using a 7 µm range separated by 0.5 µm steps on the widefield microscope described above. For analysis, maximum intensity projections were created to score astral microtubules and tubulin assemblies.
+TIP behavior assay
Cells expressing the indicated GFP- or mNeonGreen-tagged + TIP with mRuby-Tub1 and TUB1 or TUB2 induction plasmids were grown overnight in drop out growth media supplemented with 2% raffinose at 30°C, then diluted back into fresh medium and grown to log phase. Cells were induced with 2% galactose, or control cells were not induced. At 2 h of induction cells were harvested and adhered to coverslips coated with concanavalin A. Cells were imaged 30°C at 10 s intervals for 1 min with a 5.4 µm range with at 0.45 µm step size. For analysis, 2D maximum intensity projections were generated in FIJI. Cells were scored for “+TIP activity,” which was defined by the presence of a focus of labeled + TIP that tracked the plus end of a microtubule as it grew and/or shortened.
Western blotting
Soluble protein lysates were prepared under denaturing conditions using the method of Zhang et al. (2011). Log-phase cells were pelleted and resuspended in 2 M Lithium acetate and incubated for 5 min at room temperature. Cells were pelleted again and resuspended in 0.4 M NaOH for 5 min on ice. Cells were pelleted and resuspended in 2.5× Laemmli buffer and boiled for 5 min. Before loading gels, samples were boiled and centrifuged at 6,000 × g for 3 min. Before blotting (for all Westerns in Figs. 3, 4, and 5) total protein concentration of clarified lysate was determined by Pierce 660 nm protein assay with the Ionic Detergent Compatibility Reagent (Cat. 1861426 and 22663). ∼10 μg of total protein were then loaded. Samples were run on 10% Bis-Tris PAGE gels in NuPAGE MOPS running buffer (50 mM MOPS, 50 mM TrisBase, 0.1% SDS, 1 mM EDTA, pH 7.7) at 0.04 mAmp per gel for 1 h, or 1.5 h to separate β-tubulins in Fig. 5, H–J. Gels were transferred to PVDF (IPFL85R; Millipore) in NuPAGE transfer buffer (25 mM Bicine, 25 mM Bis-Tris, 1 mM EDTA, pH 7.2) at 0.33 mAmp for 1 h. Membranes were then blocked for 1 h at room temperature in PBS blocking buffer (LI-COR, 927-70001). Membranes were probed in PBS blocking buffer including the following primary antibodies: mouse-anti-α-tubulin (4A1; at 1:100; Piperno and Fuller, 1985), mouse-anti-β-tubulin (E7; at 1:100; Developmental Studies Hybridoma Bank, University of Iowa), rabbi-anti-Zwf1 (Glucose-6-phosphate dehydrogenase; A9521; Sigma-Aldrich; at 1:10,000) overnight at 4°C. After incubation in primary antibody, membranes were washed once in PBS for 5 min at room temperature and then probed with the following secondary antibodies: goat-anti-mouse-680 (LI-COR 926-68070, Superior, NE; at 1:15,000) and goat-anti-rabbit-800 (LI-COR 926-32211; at 1:15,000) for 1 h at room temperature. After incubation in secondary antibodies, blots were washed twice in PBST (1XPBS, 0.1% Tween-20), once in PBS, and imaged on an Odyssey Imager (LI-COR, 2471).
Microfluidizer lysis and sample preparation
To lyse wild-type cells in under non-denaturing conditions, we used a high pressure microfluidizer (M-110P; Microfluidics). 5 ml cultures of wild-type cells were cultured overnight at 30°C, then 500 μl of overnight culture was diluted into 50 ml of fresh media for 36 h at 30°C. 4 ml of this culture was then diluted into 2 liters of YPD, and cells were grown to mid-log at 30°C. Cells were spun for 25 min at 4,500 rpm at 4°C (J6B, Beckman Coulter Life Sciences). Cells were frozen in 4 ml aliquots and stored at −80°C. For lysing, cells were thawed on ice and combined with cold lysis buffer (50 mM HEPES, 500 mM NaCl, 10 mM MgSO4) and 1 mM PMSF to 150 ml. The microfluidizer (Microfluidics, M-110) was packed with ice and pressurized to 27,000 PSI. Cells were passed four times with 10 min on ice between each pass. After the final pass 50 ml of cold lysis buffer with 1 mM PMSF was added to chase the cells. Lysed cells were first clarified at 6,000 × g for 30 min at 4°C (Avanti J-26S XPI, Beckman Coulter Life Sciences). Approximately 50 ml of lysate was taken to spin at 100,000 × g for 30 min at 4°C (Optima XPN-100 Ultracentrifuge, Beckman Coulter Life Sciences). Supernatant was collected and a Bradford assay was completed on both sets of clarified lysate to determine protein concentration for Western blot loading. Lysate for gel loading was made by adding Laemmli Buffer to 1×. Samples of increasing amounts of 6,000 × g clarified lysate (5, 10, 15, and 20 µg) and 100,000 × g clarified lysate (2, 5, 10, 15, and 20 µg) were loaded with purified yeast tubulin standards (2, 4, 10, 15, and 30 ng) and blotted as described.
Band intensities were quantified using the gel analysis plug-in in FIJI. We assessed the linearity of the band intensities by plotting intensity against the amount of protein loaded. We performed a linear regression analysis and points that were nonlinear (i.e., intensity was below a previous point) were removed and the linear regression was recalculated. All reported data for non-denaturing cell lysates have a correlation coefficient, r2 > 0.80. Signal intensities were converted to nanograms using the standard curves and then normalized to the amount of total protein lysate loaded per well.
Quantifying tubulin concentration
To determine levels of tubulin in the cell, wild-type or heterozygous null cells were grown to log phase in rich media at 30°C. To prepare lysate of 5 × 10⁷ cells in 50 μl samples, cells were counted on a hemocytometer and the appropriate volume of cells was determined based on the hemocytometer counts and prepared as described above. Cells were diluted to plate ∼200 cells and the number of colonies recovered after 2 d at 30°C was counted, and the fraction of cells recovered was counted. Lysate was resuspended in 2.5× Laemmli buffer and standards of purified yeast tubulin were prepared by diluting protein to 2.5 ng/μl in 2.5× Laemmli buffer. Samples containing increasing amounts of cells (3.5, 4.5, 6, and 8 × 10⁶) or purified tubulin (4,10, 15, 30 and 40 ng of total protein heterodimers or 2, 5, 7.5, 15, and 20 ng of each α- or β-tubulin subunit) were loaded and blotted as described above. Band intensities were quantified using the gel analysis plug-in in FIJI.
To estimate the number of α- or β-tubulin molecules per cell, we first used the Zwf1 loading control to determine the number of cells loaded in each lane. For each replicate Western blot, the integrated signal intensity for each band of the Zwf1 loading control was plotted as a function of the expected number of cells in the sample volume. These plots are displayed in Figs. S2 and S3. The r2 value for Zwf1 signal vs. expected cell number was calculated. If the r2 value was <0.75, we identified the outlier lane and excluded it. If at least three lanes from a replicate did not generate an r2 value ≥0.8, then that replicate was excluded from further analysis. Next, the proportionality of Zwf1 signal to cell number was determined by dividing the measured Zwf1 signal intensity in each lane by the number of expected cells loaded in the lane. The average of those quotients represents the Zwf1 signal per cell for that blot. We used that value to then recalculate the number of cells in each lane by dividing the Zwf1 band intensity by the average Zwf1 signal per cell.
The molecule/cell values for a biological replicate were averaged for a single experiment and the corresponding α- and β-tubulin were compared to determine the ratio of α- to β-tubulin. P values are from Student’s t test after a one-way ANOVA with a Tukey post-hoc test for P < 0.05.
Colony formation assay
Cells were grown overnight in drop out growth media supplemented with 2% raffinose. Cells were then diluted in fresh media containing 2% raffinose, grown to log phase, and induced by the addition of 2% galactose to the culture. At the indicated time points, samples were collected from the cultures and cell density was counted on a hemocytometer. Based on these counts, cells dilutions were adjusted in order to plate the same number of expected cells for each time point and condition. For the empty vector, TUB1 overexpression, and TUB1 and TUB2 simultaneous overexpression conditions, 300 cells were spread on each plate. For TUB2 overexpression alone, 500 cells were spread on each plate to enhance the sensitivity of the assay. Cells were plated onto drop out plates containing 2% glucose.
pGAL-GFP-Tub3 induction timepoint imaging
Cells containing pGAL1-GFP-TUB3 at the endogenous TUB3 locus were grown in rich media supplemented with 2% raffinose at 30°C, diluted back into fresh medium and grown to log phase, and then induced with 2% galactose. For single timepoint imaging: at 2, 3, and 24 h post induction, cells were harvested, suspended in nonfluorescent media and adhered to coverslips coated with concanavalin A. Z-series images consisting of 8 µm range in 0.45 µm steps were collected. Images were analyzed in FIJI. For time-lapse imaging: after 40 min of induction cultures were harvested and adhered to slides coated with concanavalin A and left in nonfluorescent media containing 2% galactose for imaging. Z-series images consisting of 6 µm range in 0.45 µm steps were captured at 2 min intervals for 6 h. P values are from Student’s t test after a one-way ANOVA with a Tukey post-hoc test for P < 0.05.
Statistical analysis
All statistical analysis was completed in Prism 9 by GraphPad. All data except for microtubule lengths distribution (Fig. 2 C) was assumed to be normal but this was not formally tested. For all experiments with 2 > experimental groups a one-way ANOVA was performed with a Tukey post-hoc test. Pairs with adjusted P values <0.05 were then compared by Student’s t test, and that P value was reported. For experiments with two experimental groups, two-tailed unpaired Student’s t test was performed. For data in Fig. 1 C and Fig. 5, C and D statistics were performed on the mean of technical replicates. All other statistics were performed on all data points.
Online supplemental material
Fig. S1 shows the quantification of α- and β-tubulin levels in cells lysed under non-denaturing conditions and raw intensity values and linear regressions from the Western blots. Fig. S2 shows the fraction of colonies recovered for each strain in our panel of mutants and raw intensity values and linear regressions from the Western blots for wild-type cells and tub1Δ/TUB1 cells. Fig. S3 shows the raw intensity values and linear regressions from the Western blots for tub2Δ/TUB2 cells and tub1Δ/TUB1 tub2Δ/TUB2 cells. Fig. S4 shows example images of α- and β-tubulin immunofluorescence during β-tubulin induction and during α-tubulin induction. Fig. S5 shows doubling times, spotting assays, microtubule dynamics and molecules/cell Western blots for cells with empty plasmid or an extra copy of TUB1; and example Western blots and quantification as well as colony formation assays for cells overexpression both α- and β-tubulin. Videos 1, 2, and 3 show example fields of GFP-Tub3 induction. Table S1 shows yeast strains. Table S2 shows plasmids used in this study. Table S3 shows oligonucleotides used in this study.
Acknowledgments
We are grateful to members of the Moore lab for helpful advice and discussions.
This work was supported by National Institutes of Health grants R01 GM112893 and R35 GM 136253 (J.K. Moore); L.C. Wethekam was supported by T32 GM136444 and the University of Colorado Molecular Biology Training Program Bolie Scholar Award.
Author contributions: L.C. Wethekam: Conceptualization, formal analysis, investigation, methodology, validation, visualization, writing—original draft, writing—review & editing. J.K. Moore: Conceptualization, funding acquisition, methodology, project administration, resources, supervision, visualization, writing—original draft, writing—review & editing.

