


Elevated levels of plasma-free fatty acids and oxidative stress have been identified as putative primary pathogenic factors in endothelial dysfunction etiology, though their roles are unclear. In human endothelial cells, we found that saturated fatty acids (SFAs)—including the plasma-predominant palmitic acid (PA)—cause mitochondrial fragmentation and elevation of intracellular reactive oxygen species (ROS) levels. TRPML1 is a lysosomal ROS-sensitive Ca2+ channel that regulates lysosomal trafficking and biogenesis. Small-molecule agonists of TRPML1 prevented PA-induced mitochondrial damage and ROS elevation through activation of transcriptional factor EB (TFEB), which boosts lysosome biogenesis and mitophagy. Whereas genetically silencing TRPML1 abolished the protective effects of TRPML1 agonism, TRPML1 overexpression conferred a full resistance to PA-induced oxidative damage. Pharmacologically activating the TRPML1–TFEB pathway was sufficient to restore mitochondrial and redox homeostasis in SFA-damaged endothelial cells. The present results suggest that lysosome activation represents a viable strategy for alleviating oxidative damage, a common pathogenic mechanism of metabolic and age-related diseases.
Introduction
Dysfunction of the endothelial tissue that lines the inner surface of blood vessels has been shown to be a major pathogenic contributor to cardiovascular complications associated with metabolic syndrome, atherosclerosis, hypertension, obesity, diabetes, and aging (Cornier et al., 2008; Eckel et al., 2005). Recent studies have implicated two common molecular events in the etiology of endothelial dysfunction associated with metabolic syndrome (Ghosh et al., 2017; Higashi et al., 2014). The first implicated event is the elevation of the plasma levels of free fatty acids (FFAs), a circumstance that has been reported to be associated with various cardiovascular complications (Ghosh et al., 2017; Heitzer et al., 2001; Higashi et al., 2014). Conversely, lipid-lowering drugs have been reported to improve vascular function in patients with cardiovascular risk factors (Higashi et al., 2014). Secondly, elevated oxidative stress due to an imbalance of cellular oxidants, such as reactive oxygen species (ROS), has been linked closely with endothelial dysfunction in patients with atherosclerosis (Higashi et al., 2014). In patients with metabolic syndrome, endothelial dysfunction is thought to be induced by sustained excessive ROS accumulation, and oxidative stress may be a common major pathogenic factor across a spectrum of cardiovascular disorders (Heitzer et al., 2001; Higashi et al., 2014). Antioxidant agents are reportedly beneficial for patients with cardiovascular risks (Halliwell, 2024; Higashi et al., 2014). However, the relationship between elevated plasma FFAs and ROS elevation in endothelial cells is unclear.
ROS acts as a double-edged sword in cellular physiology. Low ROS levels may exert a beneficial effect by serving as intracellular signaling molecules that trigger cell-survival mechanisms, including mitophagy (mitochondrion autophagy) (Underwood et al., 2010). However, high levels of intracellular ROS are toxic, causing oxidative damage to proteins, nucleic acids, and lipids (Kishi et al., 2024). Hence, intracellular ROS levels must be regulated tightly to maintain cellular redox homeostasis. Excess oxidant dys-homeostasis, a state known as oxidative stress can become pathogenic (Kishi et al., 2024; Yamamoto et al., 2018). Although supplementation with antioxidants (i.e., reducing agents) can alleviate many pathologies associated with oxidative stress (Halliwell, 2024), it may also impair normal cell physiology by diminishing ROS signaling functions. A more effective antioxidant strategy would be to target pools of excessive ROS selectively (Halliwell, 2024). The primary source of endogenous ROS is mitochondria (Balaban et al., 2005; Zorov et al., 2014). ROS bursts during mitochondrial electron handling may cause oxidative damage to mitochondrial proteins and lipids; the resultant damage to mitochondria further augments ROS production, resulting in a vicious cycle of ROS elevation that puts both mitochondrial and cytoplasmic ROS beyond physiological ranges (Balaban et al., 2005; Lee et al., 2023; Zorov et al., 2014). Hence, pathological events that cause mitochondrial damage may lead to oxidative stress, and vice versa (Lee et al., 2023; Pickles et al., 2018; Shadel and Horvath, 2015).
Autophagic processes, including mitophagy, are evolutionarily conserved cellular mechanisms that maintain biomolecule and organelle homeostasis (Ng et al., 2021; Pickles et al., 2018). Parkin, an E3 ubiquitin ligase encoded by PRKN, is recruited to damaged mitochondria to initiate autophagosome formation (Narendra et al., 2008; Palikaras et al., 2018). Parkin-evoked autophagosomes fuse with lysosomes to generate autolysosomes that carry out mitophagy by way of hydrolase-mediated degradation (Ballabio and Bonifacino, 2020; Pickles et al., 2018). Additionally, autophagy-independent lysosome-dependent mitochondrial quality mechanisms, including mitolysosome exocytosis, have been recently described (Bao et al., 2022; Tan et al., 2022). Hence, lysosomes play an important role in the maintenance of mitochondrial homeostasis.
Coping with prolonged oxidative stress may require sustained mitophagy and supplies of lysosomes (Zhang et al., 2016a, 2016b). Transcription factor EB (TFEB), a master transcriptional regulator of lysosome biogenesis, is activated when mitochondria are damaged to a sufficient degree to cause ROS elevation (Medina et al., 2015; Puertollano et al., 2018; Zhang et al., 2016a). ROS induce nuclear translocation of TFEB, transcription factor E3 (TFE3), and microphthalmia-associated transcription factor (MITF) directly by oxidizing them (Contreras and Puertollano, 2023; Martina and Puertollano, 2018; Wang et al., 2020), or indirectly by activating lysosomal transient receptor potential mucolipin 1 (TRPML1) channels to cause Ca2+/calcineurin-dependent dephosphorylation of TFEB/TFE3/MITF (Zhang et al., 2016a, 2016b). TRPML1 is the principal Ca2+ release channel in lysosomes and regulates multiple Ca2+-dependent lysosomal functions, including membrane trafficking, exocytosis, and biogenesis (Grimm et al., 2017; Li et al., 2019; Xu and Ren, 2015; Zhang et al., 2019). TRPML1 is required for stress-induced upregulation of lysosomal biogenesis and lysosomal clearance of damaged mitochondria and excess ROS (Zhang et al., 2016a, 2016b). When TRPML1 is inhibited pharmacologically, Ca2+/calcineurin-dependent TFEB activation caused by mitochondrial damage/stress is compromised, preventing mitophagy-dependent removal of damaged mitochondria (Zhang et al., 2016a, 2016b). ROS sensitivity of TRPML1 may be required for a basal level of lysosomal adaptation in response to mitochondrial stress (Zhang et al., 2016a, 2016b). Reduced lysosomal adaptation, may be beneficial in some regards, but may be inadequate to overcome chronic oxidative stress conditions.
In the current study, we found that exposure to saturated fatty acids (SFAs), but not to unsaturated fatty acids (UFAs), caused mitochondrial damage and oxidative stress in human endothelial cells. TRPML1 agonism abolished ROS elevation and mitigated SFA-induced mitochondria damage. Using genetic approaches, we demonstrated that these protective effects of TRPML1 agonism involved boosting lysosome biogenesis and mitophagy via the TRPML1–TFEB pathway. Hence, pharmacological activation of TRPML1 has the potential to relieve oxidative damage via a means involving lysosome activation, without compromising ROS signaling functions.
Results
SFAs increase intracellular ROS levels in human endothelial cells
To investigate FFA effects on endothelial oxidative stress, human umbilical vein cells (HUVECs) (Jaffe et al., 1973) were treated with various FFAs found in plasma, including two SFAs (palmitic acid [PA, C16:0] and stearic acid [SA]) and three UFAs (oleic acid [OA, C18:1], arachidonic acid [ArA], and eicosapentaenoic acid [EPA]) (Mathew et al., 2010; Ni et al., 2015; Zhao et al., 2020) (Fig. 1 A). PA and OA are the most abundant saturated and unsaturated FFAs in plasma, respectively (Ni et al., 2015; Zhao et al., 2020). Both PA and SA treatment induced substantial increases in intracellular ROS levels (Fig. 1, B and C; and Fig. S1, A and B) assessed with a H2-DCFDA (2′,7′-dichlorodihydrofluorescein diacetate) assay (Murphy et al., 2022). A vehicle control treatment with only bovine serum albumin (BSA), which was used to deliver fatty acids (see Materials and methods), was without effect (Fig. 1 B). ROS increases were not observed in HUVECs treated with any of the UFAs (Fig. 1, B and C; and Fig. S1, A and B), although the UFAs did promote the formation of lipid droplets (Fig. S1 B), as indicated by BODIPY 493/503 assays (Daemen et al., 2015). Hence, SFAs increased intracellular ROS levels selectively. Because PA is the most abundant SFA in plasma (Nakamura et al., 2009), hereafter we focus on PA.

Saturated fatty acids (SFAs), but not unsaturated fatty acids (UFAs), cause mitochondrial damage and ROS elevation in human endothelial cells. (A) Chemical structures of common free fatty acids (FFAs) in plasma, including the SFAs palmitic acid (PA) and stearic acid (SA), as well as the UFAs oleic acid (OA), arachidonic acid (ArA), and eicosapentaenoic acid (EPA). (B) Effects of FFA (100 μM, 6 h) treatments on intracellular ROS levels, as assessed by 2′7′-DCFDA assays, in human umbilical vein endothelial cells (HUVECs). FFAs were conjugated to bovine serum albumin (BSA) to facilitate intracellular delivery; BSA alone served as a vehicle control (CTL). (C) Summary of effects of FFA treatments on intracellular ROS levels in HUVECs shown in B. For each experimental condition, ≥50 randomly selected cells from at least three independent experiments were analyzed. Relative ROS level was determined by normalizing DCFDA intensity to that of the CTL group. Mean (±SEM) and individual-cell (blue dots) data are shown. (D) Dose-dependent effects of PA on intracellular ROS levels in HUVECs. Antioxidant NAC (5 mM) co-treatment effects were examined. (E) Summary of PA effects on intracellular ROS levels of HUVECs. (F) Subcellular localization of fluorescently labeled PA analog in HUVECs treated with BODIPY-FL-C16 (C16 FL, 10 μM) for 6 h. SIM images of mitochondria immunolabeled with anti-Tomm20 antibody are shown. (G) Effects of PA and OA on the morphology of MitoTracker-labeled mitochondria (green). (H) Summary of PA and OA effects on mitochondrial fragmentation (quantitated as mean length of mitochondria). For each experimental condition, ≥50 randomly selected cells from at least three independent repeats were analyzed. Mitochondrial length was normalized to that of the control group. (I) The effects of PA and OA on the morphology of mitochondria immunolabeled with anti-Tomm20 antibody. (J) SIM images showing PA and OA effects on mitochondrial morphology. (K) Summary of PA and OA effects on mitochondrial morphology, as shown in I. (L) Effects of PA and OA on mitochondria membrane potential monitored with JC-1 labeling. (M) Summary of PA and OA effects on mitochondrial membrane potential determined by the relative ratio of red (JC-1 monomer) versus green (JC-1 aggregate) signal, as shown in L. (N) Effects of PA and OA treatment on mitochondria membrane potential monitored with TMRE labeling. (O) Quantitative analysis of data in N. Scale bar = 10 µm. All data are presented as means ± SEMs; *P < 0.05, **P < 0.01, ***P < 0.001.
Saturated fatty acids (SFAs), but not unsaturated fatty acids (UFAs), cause mitochondrial damage and ROS elevation in human endothelial cells. (A) Chemical structures of common free fatty acids (FFAs) in plasma, including the SFAs palmitic acid (PA) and stearic acid (SA), as well as the UFAs oleic acid (OA), arachidonic acid (ArA), and eicosapentaenoic acid (EPA). (B) Effects of FFA (100 μM, 6 h) treatments on intracellular ROS levels, as assessed by 2′7′-DCFDA assays, in human umbilical vein endothelial cells (HUVECs). FFAs were conjugated to bovine serum albumin (BSA) to facilitate intracellular delivery; BSA alone served as a vehicle control (CTL). (C) Summary of effects of FFA treatments on intracellular ROS levels in HUVECs shown in B. For each experimental condition, ≥50 randomly selected cells from at least three independent experiments were analyzed. Relative ROS level was determined by normalizing DCFDA intensity to that of the CTL group. Mean (±SEM) and individual-cell (blue dots) data are shown. (D) Dose-dependent effects of PA on intracellular ROS levels in HUVECs. Antioxidant NAC (5 mM) co-treatment effects were examined. (E) Summary of PA effects on intracellular ROS levels of HUVECs. (F) Subcellular localization of fluorescently labeled PA analog in HUVECs treated with BODIPY-FL-C16 (C16 FL, 10 μM) for 6 h. SIM images of mitochondria immunolabeled with anti-Tomm20 antibody are shown. (G) Effects of PA and OA on the morphology of MitoTracker-labeled mitochondria (green). (H) Summary of PA and OA effects on mitochondrial fragmentation (quantitated as mean length of mitochondria). For each experimental condition, ≥50 randomly selected cells from at least three independent repeats were analyzed. Mitochondrial length was normalized to that of the control group. (I) The effects of PA and OA on the morphology of mitochondria immunolabeled with anti-Tomm20 antibody. (J) SIM images showing PA and OA effects on mitochondrial morphology. (K) Summary of PA and OA effects on mitochondrial morphology, as shown in I. (L) Effects of PA and OA on mitochondria membrane potential monitored with JC-1 labeling. (M) Summary of PA and OA effects on mitochondrial membrane potential determined by the relative ratio of red (JC-1 monomer) versus green (JC-1 aggregate) signal, as shown in L. (N) Effects of PA and OA treatment on mitochondria membrane potential monitored with TMRE labeling. (O) Quantitative analysis of data in N. Scale bar = 10 µm. All data are presented as means ± SEMs; *P < 0.05, **P < 0.01, ***P < 0.001.

PA, but not OA, caused ROS elevation in human endothelial cells. (A) Effects of OA (10 or 100 μM, 6 h) and PA (100 μM, 6 h) treatment on intracellular ROS levels, as assessed by 2′7′-DCFDA labeling, in HUVECs. (B) Summary effects of OA on intracellular ROS levels in HUVECs, as shown in A. For each experimental condition, ≥50 randomly selected cells from at least three independent experiments were analyzed. Relative ROS levels were determined by normalizing the intensity of DCFDA to that in the control group. Mean (±SEM) and individual cell (blue dots) data are shown. Effects of OA (100 μM, 6 h) and PA (100 μM, 6 h) on lipid droplet formation are shown in inset images. (C) Time-dependent effects of PA (100 μM) on ROS levels, as assessed by 2′7′-DCFDA labeling, in HUVECs. (D) Subcellular localizations of fluorescently labeled PA and OA analogs in HUVECs treated with BODIPY-FL-C16 (C16 FL, 10 μM) or BODIPY-FL-C18 (C18 FL, 10 μM) for 6 h. SIM images of mitochondria immunolabeled with anti-Tomm20 antibody are shown. (E) Intracellular puncta localization of BODIPY-FL-C16 (1 μM for 6 h) and lipid droplets (labeled with Nile Red) in HUVECs. Scale bar = 10 μm. Data are means ± SEMs; ***P < 0.001.
PA, but not OA, caused ROS elevation in human endothelial cells. (A) Effects of OA (10 or 100 μM, 6 h) and PA (100 μM, 6 h) treatment on intracellular ROS levels, as assessed by 2′7′-DCFDA labeling, in HUVECs. (B) Summary effects of OA on intracellular ROS levels in HUVECs, as shown in A. For each experimental condition, ≥50 randomly selected cells from at least three independent experiments were analyzed. Relative ROS levels were determined by normalizing the intensity of DCFDA to that in the control group. Mean (±SEM) and individual cell (blue dots) data are shown. Effects of OA (100 μM, 6 h) and PA (100 μM, 6 h) on lipid droplet formation are shown in inset images. (C) Time-dependent effects of PA (100 μM) on ROS levels, as assessed by 2′7′-DCFDA labeling, in HUVECs. (D) Subcellular localizations of fluorescently labeled PA and OA analogs in HUVECs treated with BODIPY-FL-C16 (C16 FL, 10 μM) or BODIPY-FL-C18 (C18 FL, 10 μM) for 6 h. SIM images of mitochondria immunolabeled with anti-Tomm20 antibody are shown. (E) Intracellular puncta localization of BODIPY-FL-C16 (1 μM for 6 h) and lipid droplets (labeled with Nile Red) in HUVECs. Scale bar = 10 μm. Data are means ± SEMs; ***P < 0.001.
PA induction of ROS level elevation was observed to be dose-dependent (Fig. 1 D) and time-dependent (Fig. S1 C) in our HUVEC cellular model. Significant ROS elevation was seen with as low as 3-μM PA, and the increase was most dramatic with 100-μM PA (Fig. 1 D). Note that a normal healthy plasma PA concentration is estimated to be ∼240 μM, whereas ∼340 μM PA has been reported for patients with cardiovascular complications and metabolic syndrome (Ni et al., 2015). PA-induced ROS elevation was abolished by co-treating cells with the ROS scavenger N-acetyl cysteine (NAC) (Zhang et al., 2016a) (Fig. 1, D and E).
PA treatment causes mitochondrial fragmentation and damage
Mitochondria are the predominant source of intracellular ROS, and excessive ROS production is a common consequence of mitochondrial damage (Ng et al., 2021; Shadel and Horvath, 2015; Su et al., 2023; Zorov et al., 2014). Upon tracking subcellular PA locations with a BODIPY-labeled PA analog (BODIPY-C16-FL) subjected to a 6-h incubation/1-h chase protocol, we observed partial co-localization of intracellular BODIPY-C16-FL with Tomm20, a mitochondrial outer membrane protein (Söllner et al., 1989) (Fig. 1 F). This result indicated that a substantial fraction of PA was delivered to mitochondria, in which FFAs could be metabolized, e.g., through fatty acid β-oxidation (Chen et al., 2023; Houten et al., 2016). In contrast, no significant co-localization was seen between the BODIPY-labeled OA analog C18-FL and TOMM20 (Fig. S1 D), suggesting that SFAs, but not UFAs, selectively increased intracellular ROS levels in HUVECs through mitochondrion-dependent mechanisms, as reported in other cell types (García-Ruiz et al., 2015; Nakamura et al., 2009).
To assess PA and OA effects on mitochondrial morphology, HUVECs were loaded with MitoTracker, a fluorescent dye that accumulates on mitochondrial membranes (Chazotte, 2011). Mitochondria in OA-treated cells exhibit a normal morphology as a network of long, frequently interconnected tubular segments, similar to mitochondria in untreated control cells (Balaban et al., 2005; Chen et al., 2023; Du et al., 2021) (Fig. 1 G). In contrast, mitochondria in PA-treated HUVECs were mostly fragmented and often vacuolated (Chen et al., 2023; Du et al., 2021) (Fig. 1, G and H). Similar morphological changes were observed when mitochondria were immunolabeled with the Tomm20 antibody (Fig. 1, I–K). Because mitochondrial fragmentation is often associated with a loss of mitochondrial membrane potential (Δψ), mitochondrial function was evaluated using the Δψ-sensitive dye JC-1 (Perelman et al., 2012; Smiley et al., 1991) and TMRE (Scaduto and Grotyohann, 1999). In healthy mitochondria with a very negative Δψ, JC-1 exists as monomers displaying both red and green fluorescent signals (Perelman et al., 2012). Normal mitochondrial Δψ signals were observed in control and OA-treated cells (Fig. 1, I–K). In PA-treated cells, the red JC-1 signal was diminished, evidencing a loss of Δψ, and thus mitochondrial depolarization (Fig. 1, L and M). PA-induced mitochondria Δψ loss was also seen with TMRE labeling, which could more reliably qualify mitochondrial membrane potential (Scaduto and Grotyohann, 1999) (Fig. 1, N and O). These data indicate that PA treatment caused mitochondrial damage and dysfunction.
Small molecule TRPML1 agonists prevent PA-induced ROS elevation
We hypothesized that activation of TRPML1 may boost TFEB-dependent lysosomal biogenesis to promote mitophagy, and thereby facilitate clearance of damaged mitochondria. Consistent with previous studies in other cell types, TRPML-specific synthetic agonists (ML-SAs) of varying potency (ML-SA8 > ML-SA5 > ML-SA1 [Du et al., 2021; Yu et al., 2020]) evoked large inwardly rectifying whole-endolysosome TRPML1-like currents (ITRPML1) in HUVECs (Fig. 2, A and B). The currents were abolished completely by the TRPML-specific synthetic inhibitors ML-SI3 and ML-SI5 (Du et al., 2021; Yu et al., 2020) (Fig. 2 A). Both ML-SA5 and ML-SA8 treatment reduced PA-induced ROS elevation in a dose-dependent manner (Fig. 2, C–F; and Fig. S2, A and B), although the uptake of FFAs and BODIPY-C16-FL was not affected by ML-SA treatments. Whereas ML-SA5 abolished ROS elevation completely at a concentration of 10 μM, a roughly threefold lower concentration (3 μM) of the more potent ML-SA8 achieved the same ROS-reducing effect (Fig. 2, C–F). Although there were ∼30-fold potency differences in channel-based versus cell-based assays, which might be caused by issues related to membrane permeability and cellular metabolism, as observed in previous TRPML1 studies (Du et al., 2021; Yu et al., 2020), the relative potency between ML-SAs was consistently correlated (see comparisons between Fig. 2, B and F), suggesting that the ROS-reducing effects of ML-SAs are specific. Consistently, the ROS-reducing effect of ML-SA5 was inhibited completely by ML-SI5 (Fig. 2, G and H).

Small-molecule activation of lysosomal TRPML1 channels prevents PA-induced ROS elevation in human endothelial and epithelial cells. (A) Representative traces of basal (red), ML-SA5-activated (SA5, black), and ML-SI5-inhibited (SA5+SI5, blue) whole-endolysosome TRPML1-like currents (ITRPML1) in HUVECs. Currents were elicited with a ramp voltage protocol (−120 to +120 mV, 400-ms duration; only partial voltage ranges are shown) and a holding potential of 0 mV. (B) Dose-dependent effects of ML-SA5 and the more potent ML-SA8 on ITRPML1 (current amplitudes measured at −120 mV; n = 3 endolysosomes). ML-SA-induced currents were normalized to maximal responses with 1,000 nM SA5 and 300 nM SA8. (C) Dose-dependent effects of ML-SA5/8 co-treatment on PA (100 μM, 6 h)-induced ROS increases in HUVECs; BSA alone served as the control (CTL). (D) Summary of ML-SA5 effects on PA-induced ROS increases. For each experimental condition, ≥50 randomly selected cells from at least three independent experiments were analyzed. Relative ROS level was determined by normalizing DCFDA intensity to that of the CTL group. Mean (±SEM) and individual-cell data are shown. (E) Summary of ML-SA8 effects on PA-induced ROS increases. (F) Dose-dependent effects of ML-SA5 and ML-SA8 treatment on intracellular ROS levels. (G) Effects of ML-SA5 (10 μM) with and without ML-SI5 (30 μM) co-treatment on PA-induced ROS increases in HUVECs. (H) Quantitation of the results as shown in G. Average and individual results of ≥50 cells from three independent repeats are shown. (I) Effects of ML-SA5 (10 μM) or ML-SA8 (3 μM) with and without ML-SI5 (30 μM) co-treatment on PA-induced mitochondrial ROS (MitoSOX Green) increases in HUVECs. (J) Quantitation of data shown in I. (K) Effects of ML-SA5 (10 μM) with or without ML-SI5 (30 μM) co-treatment on PA-induced ROS increases in renal tubular epithelial cells (RTECs). (L) Quantitation of the data shown in K. Average and individual results from ≥50 cells are shown. Quantitative data are presented as means ± SEMs; ***P < 0.001.
Small-molecule activation of lysosomal TRPML1 channels prevents PA-induced ROS elevation in human endothelial and epithelial cells. (A) Representative traces of basal (red), ML-SA5-activated (SA5, black), and ML-SI5-inhibited (SA5+SI5, blue) whole-endolysosome TRPML1-like currents (ITRPML1) in HUVECs. Currents were elicited with a ramp voltage protocol (−120 to +120 mV, 400-ms duration; only partial voltage ranges are shown) and a holding potential of 0 mV. (B) Dose-dependent effects of ML-SA5 and the more potent ML-SA8 on ITRPML1 (current amplitudes measured at −120 mV; n = 3 endolysosomes). ML-SA-induced currents were normalized to maximal responses with 1,000 nM SA5 and 300 nM SA8. (C) Dose-dependent effects of ML-SA5/8 co-treatment on PA (100 μM, 6 h)-induced ROS increases in HUVECs; BSA alone served as the control (CTL). (D) Summary of ML-SA5 effects on PA-induced ROS increases. For each experimental condition, ≥50 randomly selected cells from at least three independent experiments were analyzed. Relative ROS level was determined by normalizing DCFDA intensity to that of the CTL group. Mean (±SEM) and individual-cell data are shown. (E) Summary of ML-SA8 effects on PA-induced ROS increases. (F) Dose-dependent effects of ML-SA5 and ML-SA8 treatment on intracellular ROS levels. (G) Effects of ML-SA5 (10 μM) with and without ML-SI5 (30 μM) co-treatment on PA-induced ROS increases in HUVECs. (H) Quantitation of the results as shown in G. Average and individual results of ≥50 cells from three independent repeats are shown. (I) Effects of ML-SA5 (10 μM) or ML-SA8 (3 μM) with and without ML-SI5 (30 μM) co-treatment on PA-induced mitochondrial ROS (MitoSOX Green) increases in HUVECs. (J) Quantitation of data shown in I. (K) Effects of ML-SA5 (10 μM) with or without ML-SI5 (30 μM) co-treatment on PA-induced ROS increases in renal tubular epithelial cells (RTECs). (L) Quantitation of the data shown in K. Average and individual results from ≥50 cells are shown. Quantitative data are presented as means ± SEMs; ***P < 0.001.

Activation of lysosomal TRPML1 channels by synthetic agonists and oxidants in human endothelial cells. (A and B) Dose-dependent activation of whole-endolysosome ITRPML1 by ML-SA5 (A) and by ML-SA8 (B) in HUVECs. (C) Activation of whole-endolysosome ITRPML1 by chloramine-T (Ch-T, 100 μM) in TRPML1-transfected HUVECs.
Activation of lysosomal TRPML1 channels by synthetic agonists and oxidants in human endothelial cells. (A and B) Dose-dependent activation of whole-endolysosome ITRPML1 by ML-SA5 (A) and by ML-SA8 (B) in HUVECs. (C) Activation of whole-endolysosome ITRPML1 by chloramine-T (Ch-T, 100 μM) in TRPML1-transfected HUVECs.
To investigate whether mitochondria are the primary source of PA-induced ROS elevation, we assessed the effects of PA and ML-SAs using MitoSOX Green, a mitochondrion-specific superoxide-sensitive fluorescent dye (Zhou et al., 2011). Whereas PA treatment markedly elevated mitochondrial ROS levels, the elevations were prevented by ML-SA5 and ML-SA8 treatment, but not in the presence of ML-SI5 (Fig. 2, I and J).
Oxidative stress and FFA elevation are also known to be pathogenic to non-vascular cells and tissues (Halliwell, 2024; Ni et al., 2015). Because renal tubular epithelial cell (RTEC) dysfunction plays an important role in nephropathy, a common pathology in metabolic syndrome (Kawaguchi et al., 2021), we investigated the effects of PA and ML-SAs on ROS levels in RTECs. PA-induced increases in intracellular ROS levels in RTECs were blocked by ML-SA5 co-treatment, but not in the presence of ML-SI5 (Fig. 2, I and J). Hence, ML-SAs may have a general antioxidant effect across cell types. In endothelial cells, oxidative stress is known to cause upregulated expression of various ROS effector proteins, including P-selectin, an inflammation mediator in vascular injuries (Sellak et al., 1994). PA increased P-selectin (SELP) expression in a manner that was also blocked by ML-SA5 co-treatment (Fig. S3 A).

Effects of ML-SA5 treatment on PA-induced P-selectin expression, mitochondrial damage, and lysosomal acidification. (A) RT-qPCR analysis of P-selectin (SELP) expression level in HUVECs that were treated with PA (100 μM, 6 h) alone or with ML-SA5 (10 μM). (B) Effects of ML-SA5 treatment on PA-induced mitochondrial fragmentation. The effect of CCCP on mitochondrial fragmentation is shown for comparison. (C) Effects of ML-SA5 on LysoTracker labeling in HUVECs. Scale bar = 10 μm. Data are presented as means ± SEMs; ***P < 0.001.
Effects of ML-SA5 treatment on PA-induced P-selectin expression, mitochondrial damage, and lysosomal acidification. (A) RT-qPCR analysis of P-selectin (SELP) expression level in HUVECs that were treated with PA (100 μM, 6 h) alone or with ML-SA5 (10 μM). (B) Effects of ML-SA5 treatment on PA-induced mitochondrial fragmentation. The effect of CCCP on mitochondrial fragmentation is shown for comparison. (C) Effects of ML-SA5 on LysoTracker labeling in HUVECs. Scale bar = 10 μm. Data are presented as means ± SEMs; ***P < 0.001.
TRPML1 expression is required for the antioxidant effect of ML-SA5
Whereas mammalian TRPML1 is ubiquitously expressed in all cell types, TRPML2 and TRPML3 channels have more restricted expression (Grimm et al., 2017; Zhang et al., 2018). Whole-endolysosome TRPML-like currents in HUVECs resemble those mediated by TRPML1, but not TRPML2 or TRPML3 mediated currents, judging by distinct channel properties, including pH sensitivities and current–voltage characteristics (Dong et al., 2008; Grimm et al., 2017). When TRPML1 expression was reduced by >80∼90% with siRNA targeting human TRPML1 transcript (Fig. 3 A), ML-SA5-induced whole-endolysosome currents also decreased from −640 ± 110 pA/pF (at −120 mV, n = 5) to −117 ± 37 pA/pF in HUVECs (at −120 mV, n = 4) (Fig. 3, B and C), suggesting that TRPML1 is the primary TRPML channel in HUVEC lysosomes. Consistent with our previous TRPML1-ROS studies in other cell types using loss-of-function approaches (Zhang et al., 2016a), ROS levels were found to be higher in TRPML1 knockdown HUVECs than in control cells even without PA treatment (Fig. 3 D). Although PA treatment further increased ROS levels, ML-SA5 treatment failed to reduce PA-induced ROS elevation in TRPML1-knockdown HUVECs (Fig. 3, D and E), indicating that TRPML1 expression was required for the antioxidant effect of ML-SA5.

TRPML1 transcript levels determine PA effects on ROS elevation. (A) RT-qPCR (reverse transcription quantitative real-time PCR) analysis of siRNA-mediated TRPML1 knockdown (KD) efficiency in HUVECs (n = 3 repeats). Cells were transfected with a scramble (Scramble) or human TRPML1-targeting siRNA (ML1 KD). TRPML1 siRNA was co-transfected with Cy3-labeled siRNA (CY3) to monitor transfection efficiency. (B) Electrophysiological analysis of TRPML1 KD efficiency in HUVECs. Whole-endolysosome ITRPML1 was evoked by bath application of ML-SA5 (SA5, 3 μM). (C) The current densities of whole-endolysosome ITRPML1 (measured at −120 mV) in TRPML1 KD HUVECs (n = 5/4 endolysosomes for scramble/ML1 KD). (D) The effects of ML-SA5 (10 μM) treatment on PA-induced ROS elevation in TRPML1 KD HUVECs. Positive transfection of TRPML1 siRNA was confirmed with CY3 staining. (E) Quantitation of ML-SA5 effects on PA-induced ROS elevation in TRPML1 KD HUVECs. (F) RT-qPCR analysis of TRPML1 lentiviral overexpression in HUVECs (n = 3 repeats). (G) Representative traces of whole-endolysosome ITRPML1 evoked by ML-SA5 (SA5, 3 μM) in TRPML1-mScarlet-overexpressing HUVECs. Sham cells served as controls. (H) Current densities of whole-endolysosome ITRPML1 (measured at −120 mV) in TRPML1-overexpressing HUVECs (n = 7/4 endolysosomes for sham/ML1 OE). (I) The effects of PA on ROS levels in TRPML1-mScarlet-overexpressing HUVECs. (J) Summary of PA effects in TRPML1-mScarlet-overexpressing HUVECs, as shown in I. Average and individual results are shown. DCFDA intensities were measured and normalized to those in each control group. Scale bar = 10 μm. Data are presented as means ± SEMs; **P < 0.01, ***P < 0.001.
TRPML1 transcript levels determine PA effects on ROS elevation. (A) RT-qPCR (reverse transcription quantitative real-time PCR) analysis of siRNA-mediated TRPML1 knockdown (KD) efficiency in HUVECs (n = 3 repeats). Cells were transfected with a scramble (Scramble) or human TRPML1-targeting siRNA (ML1 KD). TRPML1 siRNA was co-transfected with Cy3-labeled siRNA (CY3) to monitor transfection efficiency. (B) Electrophysiological analysis of TRPML1 KD efficiency in HUVECs. Whole-endolysosome ITRPML1 was evoked by bath application of ML-SA5 (SA5, 3 μM). (C) The current densities of whole-endolysosome ITRPML1 (measured at −120 mV) in TRPML1 KD HUVECs (n = 5/4 endolysosomes for scramble/ML1 KD). (D) The effects of ML-SA5 (10 μM) treatment on PA-induced ROS elevation in TRPML1 KD HUVECs. Positive transfection of TRPML1 siRNA was confirmed with CY3 staining. (E) Quantitation of ML-SA5 effects on PA-induced ROS elevation in TRPML1 KD HUVECs. (F) RT-qPCR analysis of TRPML1 lentiviral overexpression in HUVECs (n = 3 repeats). (G) Representative traces of whole-endolysosome ITRPML1 evoked by ML-SA5 (SA5, 3 μM) in TRPML1-mScarlet-overexpressing HUVECs. Sham cells served as controls. (H) Current densities of whole-endolysosome ITRPML1 (measured at −120 mV) in TRPML1-overexpressing HUVECs (n = 7/4 endolysosomes for sham/ML1 OE). (I) The effects of PA on ROS levels in TRPML1-mScarlet-overexpressing HUVECs. (J) Summary of PA effects in TRPML1-mScarlet-overexpressing HUVECs, as shown in I. Average and individual results are shown. DCFDA intensities were measured and normalized to those in each control group. Scale bar = 10 μm. Data are presented as means ± SEMs; **P < 0.01, ***P < 0.001.
TRPML1 overexpression confers resistance to PA-induced ROS elevation
To explore the sufficiency role of TRPML1 in its antioxidant effect, we generated HUVECs stably expressing lentivirus-delivered human (h)TRPML1-mScarlet. Consistent with >10-fold increases in TRPML1 mRNA relative to endogenous levels demonstrated by our RT-qPCR (reverse transcription quantitative real-time PCR) analysis (Fig. 3 F), ML-SA5-induced whole-endolysosome TRPML1-like currents were found to increase more than fivefold relative to control cell levels (Fig. 3, G and H). Chloramine-T (Ch-T), a potent oxidant and TRPML1 agonist (Zhang et al., 2016a), activated much larger whole-endolysosomal TRPML1 currents (Fig. S2 C) in TRPML1-overexpressing HUVECs than in control HUVECs (Fig. 5 A and Fig. S2 C). Remarkably, PA had muted effects on intracellular ROS levels in hTRPML1-mScarlet-expressing HUVECs (Fig. 3, I and J), suggesting that hTRPML1 overexpression alone may have an antioxidant effect. TRPML1-overexpression in HUVECs may increase the likelihood of lysosomal TRPML1-channel activation by ambient levels of ROS or other endogenous agonists of TRPML1 (Li et al., 2019).
Activation of TRPML1 restores mitochondrial homeostasis in PA-injured cells
We investigated the effects of ML-SA treatment on the mitochondrial fragmentation phenotype seen in PA-treated HUVECs. When ML-SA5 was co-applied with PA, average mitochondrial length within HUVECs, which correlates inversely with fragmentation, increased to a level similar to that of untreated control cells (Fig. 4, A–D and Fig. S3 B). Hence, the PA-induced mitochondrial fragmentation phenotype was largely rescued. Furthermore, PA-induced loss of mitochondrial Δψ, determined with JC-1 or TMRE assay, was also prevented by ML-SA5 or ML-SA8 co-treatment (Fig. 4, E–H). These results suggest that ML-SA5 can prevent PA-induced mitochondrial fragmentation and damage.

Activation of TRPML1 protects PA-induced mitochondrial damage. (A) Effects of ML-SA5 treatment on PA-induced mitochondrial fragmentation. Mitochondria were fluorescently labeled with MitoTracker. (B) Quantitation of the effects of ML-SA5 treatment as shown in A. Average and individual results are shown. The relative mitochondrial length was calculated by normalizing the mitochondrial length under each condition with that in the control group. (C) Effects of ML-SA5 treatment on PA-induced mitochondrial fragmentation. Mitochondria were immunolabeled with an anti-Tomm20 antibody. Images in the left and right panels were taken with confocal and SIM microscopes, respectively. (D) The effects of ML-SA5 co-treatment (10 μM) on PA (100 μM, 6 h)-induced changes on mitochondria; membrane potential assessed with JC-1 labeling. (E) Summary of ML-SA5 effects on PA-induced mitochondrial fragmentation, as shown in panel C (SIM images) and quantified in terms of average mitochondrial length. For each experimental condition, ≥50 randomly selected cells from at least three independent repeats were analyzed. Mitochondrial length was measured and normalized to that of the control group. (F) Quantitation of ML-SA5 treatment effects on mitochondria membrane potential assessed by JC-1 labeling. Normalized mitochondrial membrane potentials were calculated by normalizing the ratio of red versus green signals to that in each control group. (G) Effects of ML-SA5 co-treatment (10 μM) or ML-SA8 (3 μM) on PA (100 μM, 6 h)-induced changes in mitochondrial membrane potential assessed with a TMRE assay. (H) Quantitation of the results as shown in G. Scale bar = 10 μm. Data are presented as means ± SEMs; ***P < 0.001.
Activation of TRPML1 protects PA-induced mitochondrial damage. (A) Effects of ML-SA5 treatment on PA-induced mitochondrial fragmentation. Mitochondria were fluorescently labeled with MitoTracker. (B) Quantitation of the effects of ML-SA5 treatment as shown in A. Average and individual results are shown. The relative mitochondrial length was calculated by normalizing the mitochondrial length under each condition with that in the control group. (C) Effects of ML-SA5 treatment on PA-induced mitochondrial fragmentation. Mitochondria were immunolabeled with an anti-Tomm20 antibody. Images in the left and right panels were taken with confocal and SIM microscopes, respectively. (D) The effects of ML-SA5 co-treatment (10 μM) on PA (100 μM, 6 h)-induced changes on mitochondria; membrane potential assessed with JC-1 labeling. (E) Summary of ML-SA5 effects on PA-induced mitochondrial fragmentation, as shown in panel C (SIM images) and quantified in terms of average mitochondrial length. For each experimental condition, ≥50 randomly selected cells from at least three independent repeats were analyzed. Mitochondrial length was measured and normalized to that of the control group. (F) Quantitation of ML-SA5 treatment effects on mitochondria membrane potential assessed by JC-1 labeling. Normalized mitochondrial membrane potentials were calculated by normalizing the ratio of red versus green signals to that in each control group. (G) Effects of ML-SA5 co-treatment (10 μM) or ML-SA8 (3 μM) on PA (100 μM, 6 h)-induced changes in mitochondrial membrane potential assessed with a TMRE assay. (H) Quantitation of the results as shown in G. Scale bar = 10 μm. Data are presented as means ± SEMs; ***P < 0.001.
TRPML1 agonists boost lysosomal biogenesis through TFEB/TFE3/MITF
Given the antagonistic effects of ML-SAs and PA on ROS elevation and mitochondrial fragmentation, we investigated whether PA treatment may acutely or chronically inhibit TRPML1’s channel activity, as has been seen with cholesterol and sphingomyelins effects on TRPML1 in Nieman-Pick type C cells (Shen et al., 2012; Zhong et al., 2017). However, no direct inhibitory effects of PA on whole-endolysosome ITRPML1 were seen (Fig. S4 A). Whole-endolysosome ITRPML1 amplitudes were comparable in HUVECs with and without a 6-h PA treatment (Fig. 5, B–D). Note that although PA treatment caused ROS elevations in intact cells, cytosolic ROS were lost in isolated enlarged lysosomes used for electrophysiological recordings. Collectively, ML-SAs may exert antioxidant effects through mechanisms downstream of TRPML1 activation.
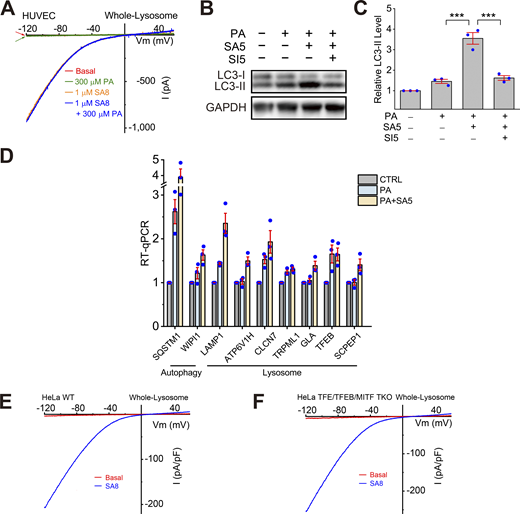
Effects of ML-SA5 treatment on TFEB-dependent lysosomal functions. (A) Lack of direct effects of PA on whole-endolysosome ITRPML1 in HUVECs. (B) Effects of PA (100 μM, 6 h), ML-SA5 (10 μM), or ML-SA5 + ML-SI5 (30 μM) on LC3-II expression levels. GAPDH served as the loading control. (C) Quantification of ML-SA5 effects on LC3-II levels. Ratios of LC3-II versus LC3-I were normalized to that in the control group (n = 3 repeats). (D) RT-qPCR analyses of the expression levels of lysosome-related and autophagy-related genes (n = 3 repeats). (E and F) Whole-endolysosome ITRPML1 evoked by ML-SA8 (SA8, 1 μM) in WT (E) and TFEB/TFE3/MITF TKO (F) HeLa cells. Source data are available for this figure: SourceData FS4.
Effects of ML-SA5 treatment on TFEB-dependent lysosomal functions. (A) Lack of direct effects of PA on whole-endolysosome ITRPML1 in HUVECs. (B) Effects of PA (100 μM, 6 h), ML-SA5 (10 μM), or ML-SA5 + ML-SI5 (30 μM) on LC3-II expression levels. GAPDH served as the loading control. (C) Quantification of ML-SA5 effects on LC3-II levels. Ratios of LC3-II versus LC3-I were normalized to that in the control group (n = 3 repeats). (D) RT-qPCR analyses of the expression levels of lysosome-related and autophagy-related genes (n = 3 repeats). (E and F) Whole-endolysosome ITRPML1 evoked by ML-SA8 (SA8, 1 μM) in WT (E) and TFEB/TFE3/MITF TKO (F) HeLa cells. Source data are available for this figure: SourceData FS4.
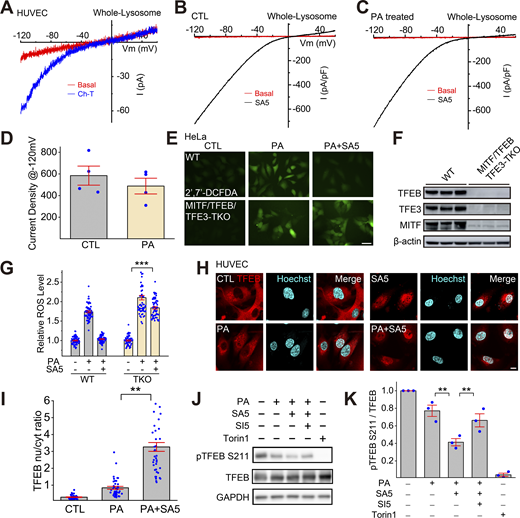
TFEB-family transcriptional factors that regulate lysosome biogenesis mediate the antioxidant and mitophagy-stimulating effects of TRPML1. (A) The oxidant Ch-T activated whole-endolysosome ITRPML1 in HUVECs. (B and C) Representative traces of ML-SA5 (3 μM)-induced whole-endolysosome ITRPML1 in BSA-treated (B) and PA-treated (C) HUVECs. (D) Quantitation of whole-endolysosome ITRPML1 in HUVECs with or without PA treatment. ML-SA5-induced currents at −120 mV in B (CTL) and C (PA) were normalized to the endolysosome size/capacitance (pF, n = 4 endolysosomes). (E) Effects of ML-SA5 (10 μM) on PA-induced ROS elevation in wild-type (WT) and MITF/TFEB/TFE3 triple knockout (TKO) HeLa cells. (F) Western blot analysis of MITF/TFEB/TFE3 expression in WT and MITF/TFEB/TFE3 TKO Hela cells. β-Actin served as the loading control. (G) Quantitation of ML-SA5 effects as shown in E. (H) Effects of ML-SA5 treatment on subcellular TFEB localization in PA-treated HUVECs, in which TFEB-mScarlet was stably expressed. (I) Quantitation of data in H based on ratios of TFEB-scarlet nuclear/cytoplasmic intensity; ≥50 randomly selected individual cells from three experimental repeats were analyzed. (J) Western blot analysis of ML-SA5 effects on the phosphorylation status of TFEB in TFEB-mScarlet stable HUVECs. GAPDH served as the loading control. (K) Quantitation analysis of data in J. The ratios of pS211 versus total TFEB were measured and normalized to that in the control group (n = 3 repeats). (L) Effects of ML-SA5 on Parkin puncta number in PA-treated Parkin-mScarlet stable HUVECs. (M) Quantitative analysis of data in L; ≥50 randomly selected cells from three experimental repeats were analyzed. Data are presented as means ± SEMs; **P < 0.01, ***P < 0.001. Source data are available for this figure: SourceData F5.
TFEB-family transcriptional factors that regulate lysosome biogenesis mediate the antioxidant and mitophagy-stimulating effects of TRPML1. (A) The oxidant Ch-T activated whole-endolysosome ITRPML1 in HUVECs. (B and C) Representative traces of ML-SA5 (3 μM)-induced whole-endolysosome ITRPML1 in BSA-treated (B) and PA-treated (C) HUVECs. (D) Quantitation of whole-endolysosome ITRPML1 in HUVECs with or without PA treatment. ML-SA5-induced currents at −120 mV in B (CTL) and C (PA) were normalized to the endolysosome size/capacitance (pF, n = 4 endolysosomes). (E) Effects of ML-SA5 (10 μM) on PA-induced ROS elevation in wild-type (WT) and MITF/TFEB/TFE3 triple knockout (TKO) HeLa cells. (F) Western blot analysis of MITF/TFEB/TFE3 expression in WT and MITF/TFEB/TFE3 TKO Hela cells. β-Actin served as the loading control. (G) Quantitation of ML-SA5 effects as shown in E. (H) Effects of ML-SA5 treatment on subcellular TFEB localization in PA-treated HUVECs, in which TFEB-mScarlet was stably expressed. (I) Quantitation of data in H based on ratios of TFEB-scarlet nuclear/cytoplasmic intensity; ≥50 randomly selected individual cells from three experimental repeats were analyzed. (J) Western blot analysis of ML-SA5 effects on the phosphorylation status of TFEB in TFEB-mScarlet stable HUVECs. GAPDH served as the loading control. (K) Quantitation analysis of data in J. The ratios of pS211 versus total TFEB were measured and normalized to that in the control group (n = 3 repeats). (L) Effects of ML-SA5 on Parkin puncta number in PA-treated Parkin-mScarlet stable HUVECs. (M) Quantitative analysis of data in L; ≥50 randomly selected cells from three experimental repeats were analyzed. Data are presented as means ± SEMs; **P < 0.01, ***P < 0.001. Source data are available for this figure: SourceData F5.
Activation of TRPML1 boosts lysosome biogenesis through the effects of TFEB, TFE3, and MITF, which are master regulators of lysosome biogenesis (Contreras and Puertollano, 2023; Medina et al., 2015; Napolitano and Ballabio, 2016; Settembre et al., 2011; Wang et al., 2015). PA treatment caused ROS elevation that was prevented by ML-SA5 in wild-type (WT) HeLa cells (Fig. 5, E–G), as seen in HUVECs. This blocking effect of ML-SA5, while partially reduced in the TFEB KO HeLa cells (Fig. S5 A), did not occur in TFEB/TFE3/MITF triple-knockout (TKO) HeLa cells (Fig. 5, E–G), which retained a normal whole-endolysosome ITRPML1 (Fig. S4, F and G). Note that although it is well established that TFEB/TFE3/MITF plays an essential role in stress-induced upregulation of lysosome biogenesis (i.e., lysosomal adaptation) (Raben and Puertollano, 2016; Sardiello et al., 2009; Settembre et al., 2011), the molecular mechanisms that regulate basal (house-keeping) lysosome biogenesis are still unclear, as basal lysosome biogenesis appeared to be not impaired in TFEB KO, TFEB/TFE3 DKO (Tan et al., 2021; Wang et al., 2019), and TFEB/TFE3/MITF TKO cells (see ref. Nezich et al. [2015] and the current study). Collectively, these results suggest that in HUVECs, TFEB, TFE3, and MITF were required for ML-SA-mediated ROS clearance, likely through their redundant roles in the regulation of lysosomal adaptation.

Effects of ML-SA5 treatment on PA-induced mitochondrial ROS elevations and Parkin puncta formation. (A) Quantitation of ML-SA5 effects on PA-induced mitochondrial ROS elevation in TFEB knockout (KO) HeLa cells. (B) Effects of ML-SA5 on PA-induced Parkin puncta formation in Parkin-mScarlet stable HUVECs. (C) Quantitative analysis of data as shown in B. (D) Effects of TRPML1 overexpression on Parkin puncta formation in PA-treated Parkin-mScarlet stable HUVECs. (E) Quantitative analysis of data as shown in D. In panels A, C, and E, ≥50 randomly selected cells from three experimental repeats were analyzed.
Effects of ML-SA5 treatment on PA-induced mitochondrial ROS elevations and Parkin puncta formation. (A) Quantitation of ML-SA5 effects on PA-induced mitochondrial ROS elevation in TFEB knockout (KO) HeLa cells. (B) Effects of ML-SA5 on PA-induced Parkin puncta formation in Parkin-mScarlet stable HUVECs. (C) Quantitative analysis of data as shown in B. (D) Effects of TRPML1 overexpression on Parkin puncta formation in PA-treated Parkin-mScarlet stable HUVECs. (E) Quantitative analysis of data as shown in D. In panels A, C, and E, ≥50 randomly selected cells from three experimental repeats were analyzed.
Subcellular localization of TFEB is determined by its phosphorylation status, particularly at site S211 (Contreras and Puertollano, 2023; Medina et al., 2015; Napolitano and Ballabio, 2016). In TFEB-mScarlet stably expressing HUVECs, PA induced TFEB nuclear translocation weakly, while ML-SA5 treatment yielded robust TFEB nuclear translocation (Fig. 5, H and I). PA treatment reduced p-S211-TFEB levels slightly, while co-treating cells with PA and ML-SA5 further decreased p-TFEB levels, and that further decrease was prevented by ML-SI5 treatment (Fig. 5 J). TFEB/TFE3/MITF regulates the expression of many autophagic and lysosomal genes, thereby boosting both autophagosome and lysosome biogenesis (Contreras and Puertollano, 2023; Napolitano and Ballabio, 2016). Consistently, the expression levels of several TFEB/TFE3/MITF targets were increased slightly by PA treatment, but further augmented by PA + ML-SA5 co-treatment (Fig. S4 D). Hence, ML-SAs may mediate the antioxidant effects through TFEB/TFE3/MITF activation.
Activation of TRPML1 promotes mitophagy
Damaged mitochondria are the predominant source of excessive ROS in cells, and TRPML1 is implicated in mitophagy regulation through multiple mechanisms (Fig. S4, B and C) (Scotto Rosato et al., 2019; Zhang et al., 2016a, 2019). We evaluated the role of mitophagy in the protective effect of ML-SAs in HUVECs stably expressing mScarlet-tagged Parkin (Parkin-mScarlet), a protein that is recruited to damaged mitochondria to initiate mitophagy (Narendra et al., 2008). In untreated cells, there was no obvious Parkin puncta formation, suggesting that there was negligible mitochondrial damage in normal cells or that damaged mitochondria had been mostly removed through elevated levels of mitophagy. Dramatically increased numbers of Parkin-mScarlet puncta were observed in PA-treated cells (Fig. S5, B and C) and the increases were abrogated by ML-SA5 treatment or TRPML1 overexpression (Fig. S5, B–E). Taken together, these data suggest that ML-SA activation of TRPML1 could boost lysosomal biogenesis and mitophagy to clear dysfunctional mitochondria and thus maintain a healthy pool of mitochondria (Fig. 6 and Fig. S5).

TPRML1 activation mitigates SFA-induced oxidative damage by boosting lysosome biogenesis and mitophagy. Working model of protective effects of TRPML1 agonists in SFA-induced oxidative damage. Upon intake, SFAs induce an elevation in intracellular ROS levels accompanied by mitochondrial fragmentation and damage. Increasing TRPML1 activity by small molecule agonists facilitates lysosome biogenesis by causing Ca2+/calcineurin-dephosphorylation and nuclear translocation of TFEB. Subsequently, mitophagy, a form of autophagy that removes damaged mitochondria, is promoted. Hence, activation of lysosomal TRPML1 channels may protect cells from SFA-induced oxidative damage by stimulating mitophagy to facilitate the clearance of damaged mitochondria, breaking a vicious cycle between ROS elevation and mitochondrial damage to maintain mitochondrial homeostasis.
TPRML1 activation mitigates SFA-induced oxidative damage by boosting lysosome biogenesis and mitophagy. Working model of protective effects of TRPML1 agonists in SFA-induced oxidative damage. Upon intake, SFAs induce an elevation in intracellular ROS levels accompanied by mitochondrial fragmentation and damage. Increasing TRPML1 activity by small molecule agonists facilitates lysosome biogenesis by causing Ca2+/calcineurin-dephosphorylation and nuclear translocation of TFEB. Subsequently, mitophagy, a form of autophagy that removes damaged mitochondria, is promoted. Hence, activation of lysosomal TRPML1 channels may protect cells from SFA-induced oxidative damage by stimulating mitophagy to facilitate the clearance of damaged mitochondria, breaking a vicious cycle between ROS elevation and mitochondrial damage to maintain mitochondrial homeostasis.
Discussion
In this study, we demonstrated that SFAs increased mitochondrial ROS levels in HUVECs, suggesting that SFAs in plasma may play a major role in causing endothelial oxidative stress in metabolic syndrome. These results are consistent with previous studies reporting that PA caused ROS elevation in pancreatic beta cells, cardiomyocytes, and hepatocytes (Nakamura et al., 2009; Wei et al., 2013). In contrast, UFAs did not induce ROS elevation, though they did cause the formation of lipid droplets, as shown previously in other cell types (Castillo-Quan et al., 2023; Chen et al., 2023). It has been suggested that UFAs may even help mitigate SFA-induced oxidative stress and lipotoxicity in cardiovascular diseases (Piccolis et al., 2019; Yki-Järvinen et al., 2021), perhaps by sequestering SFAs in lipid droplets (Chen et al., 2023; Olzmann and Carvalho, 2019).
PA analogs were found to be partially colocalized with mitochondria, which constitute the major source of intracellular ROS. Interestingly, blocking FFA transport into mitochondria can decrease PA-induced ROS elevation in hepatocytes (Nakamura et al., 2009), suggesting that accelerated lipid β-oxidation might cause mitochondrial damage (Piccolis et al., 2019). Although cells use multiple antioxidant pathways to maintain redox homeostasis, including the canonical Nrf2-Keap ROS clearance pathway (Yamamoto et al., 2018), mitophagy may be a unique antioxidant pathway that acts on the source of oxidative stress, namely ROS-releasing damaged mitochondria (D’Autréaux and Toledano, 2007; Su et al., 2023; Zhang et al., 2016b)). Defective mitophagy and elevated oxidative stress are seen in many lysosome storage diseases (LSDs), including Mucolipidosis IV, which is caused by loss-of-function mutations of TRPML1 (Ballabio and Bonifacino, 2020; Fraldi et al., 2016; Zhang et al., 2016a, 2016b). In line with such observations, we detected higher ROS levels in TRPML1-knockdown HUVECs. Notably, oxidants activate TRPML1 directly, and ROS-sensitivity of TRPML1 is required for ROS clearance (Zhang et al., 2016a). Whereas activation of TRPML1 may lead to calcineurin-dependent activation of TFEB, TFE3, and MITF, these master regulators of lysosome biogenesis can also be activated directly by ROS via cysteine oxidation (Contreras and Puertollano, 2023; Wang et al., 2020). Hence, the TRPML1–TFEB pathway might be necessary for maintaining cellular health and mitochondrial homeostasis under stress.
TFEB is mildly activated in PA-treated HUVECs, presumably as a compensatory mechanism attempting to maintain cellular homeostasis (Ballabio and Bonifacino, 2020; Puertollano et al., 2018). Severe mitochondrial damage, which can be induced by an electron transport chain decoupler, can increase ROS levels dramatically and thereby cause basal activation of TRPML1 in cells, although ROS can only activate TPRML1 much less potently than ML-SAs (Zhang et al., 2016a). Upon PA exposure, weak activation of TRPML1 by PA-induced ROS may lead to mild TFEB activation. During the early phase of PA exposure, this mild activation of TFEB may help remove damaged mitochondria. However, when ROS production was further increased upon prolonged PA exposure, a vicious cycle could be formed between mitochondrial damage and ROS elevation. Therefore, although TFEB-dependent lysosomal adaptation is minimally activated in many LSDs, disease progression still occurs in these pathological settings (Ballabio and Bonifacino, 2020; Contreras and Puertollano, 2023; Fraldi et al., 2016). A clinically relevant question is whether the benefits of lysosome activation can be amplified by pharmacological activation of the TRPML1–TFEB pathway in pathological conditions. Boosting lysosome function, either through TRPML1 or TFEB, has been shown to relieve the storage phenotypes in various cellular and animal models of lysosomal diseases (Ballabio and Bonifacino, 2020; Scotto Rosato et al., 2019; Yu et al., 2020).
Cardiovascular complications have been linked to high plasma FFA levels, but it is unclear whether this increase causes vascular dysfunction. The relationship of elevated plasma FFAs with oxidative stress has also not yet been firmly established. Here, we report that small-molecule agonist activation of TRPML1 is sufficient to activate TFEB/TFE3/MITF-dependent lysosomal biogenesis and thereby promote mitophagy to yield increased removal of damaged mitochondria and excessive ROS. Our findings suggest that artificial activation of an endogenous cellular clearance program could be used to break the vicious cycle between mitochondrial damage and ROS elevation. Given that oxidative stress is a common pathogenic mechanism underlying metabolic and age-related diseases (Halliwell, 2024; Higashi et al., 2014; Kishi et al., 2024; Su et al., 2023), it would be of interest to investigate whether the TRPML1–TFEB pathway can be manipulated to reduce these pathologies in vitro and in vivo.
Materials and methods
Cell culture
HUVECs, a widely used endothelial cell model (Jaffe et al., 1973), were purchased from the National Stem Cell Translational Resource Center (Shanghai, China) and cultured in the endothelial cell medium (ScienCell Research Laboratories) containing 5% fetal bovine serum (FBS), endothelial cell growth supplement, and antibiotics. Low-passage cells (3–10 passages) were used. RTECs (Saios Biotechnology Co., Ltd.) were cultured in the epithelial cell medium (ScienCell Research Laboratories) supplied with 2% FBS, epithelial cell growth supplement, and antibiotics. TFEB/TFE3/MITF/triple knockout (TKO) HeLa cell line was generated by creating frameshift mutations using CRISPR-Cas9. Briefly, HeLa cells were co-transfected with vectors harboring three guide RNA (gRNA) targeting exon 6, exon 4, and exon 3 of TFEB, TFE3, and MITF, respectively. The gRNA sequences are 5′-TGGCCAAGGAGCGGCAGAAG-3′ (for TFEB), 5′-CATGGCGCTGCTCACCATCG-3′ (for TFE3), and 5′-ACCACATACAGCAAGCCCAA-3′ (for MITF). The success of genome editing was confirmed by genotyping using sequencing primers listed in the primer table. WT, TFEB KO, and TFEB/TFE3/MITF TKO HeLa cells were cultured with DMEM (Thermo Fisher Scientific) supplied with 10% FBS and antibiotics.
RNA extraction and RT-qPCR
Total RNA was extracted from HUVECs with TRIzol (Invitrogen); cDNA was synthesized with a Superscript III RT kit (Vazyme). RT-qPCR was conducted with Thunderbird SYBR green mix (TOYOBO) and Roche LightCycler 480II. The mRNA expression level of target genes was normalized to that of the housekeeping gene GAPDH. The sequences of forward (F) and reverse (R) PCR primers are listed in the “Table 1.”
Primers used in this study
| Primers | Sequences |
|---|---|
| SELP, forward | 5′-TCCGCTGCATTGACTCTGGACA-3′ |
| SELP, reverse | 5′-CTGAAACGCTCTCAAGGATGGAG-3′ |
| SQSTM1, forward | 5′-CTGGGACTGAGAAGGCTCAC-3′ |
| SQSTM1, reverse | 5′-GCAGCTGATGGTTTGGAAAT-3′ |
| WIPI1, forward | 5′-CTTCAAGCTGGAACAGGTCACC-3′ |
| WIPI1, reverse | 5′-CGGAGAAGTTCAAGCGTGCAGT-3′ |
| GAPDH, forward | 5′-CACCCACTCCTCCACCTTTGAC-3′ |
| GAPDH, reverse | 5′-GTCCACCACCCTGTTGCTGTAG-3′ |
| MCOLN1, forward | 5′-TTGCTCTCTGCCAGCGGTACTA-3′ |
| MCOLN1, reverse | 5′-GCAGTCAGTAACCACCATCGGA-3′ |
| TFEB, forward | 5′-CAGAGTTCCACACCCTCCAG-3′ |
| TFEB, reverse | 5′-ATTGGCCTTGAGCAGGGAAG-3′ |
| TFE3, forward | 5′-GCGTGAGTCTAGGCACCAAT-3′ |
| TFE3, reverse | 5′-CGGGCAGATAGCTGAGCATT-3′ |
| MITF, forward | 5′-GCTGTTCTGTTCGCCAAGGA-3′ |
| MITF, reverse | 5′-TGGTGAATCGGGGACAAAGG-3′ |
siRNA-mediated knockdown
HUVECs were transfected with siRNA oligonucleotides (5′-CCUUCGCCGUCGUCUCAAA-3′) targeting human TRPML1/MCOLN1 or a scramble siRNA using Lipofectamine RNAiMAX (Invitrogen), according to the manufacturer’s instructions. Cy3-labeled siRNA was used to estimate the transfection efficiency. Cells were collected 72 h after transfection, and hTRPML1 siRNA knockdown efficacy was evaluated by RT-qPCR. The oligonucleotide sequence and RT-qPCR primers are listed in “Table 1.”
FFA treatment
Solutions of FFAs in complexes with BSA were prepared as described previously (Chen et al., 2023; Pascual et al., 2021). Briefly, a 100 mM FFA stock solution was prepared in 0.1 M NaOH by heating at 70°C in a shaking water bath. A 10% (wt/vol) FFA-free BSA solution was prepared by dissolving 1 g of BSA in 10 ml of H2O and incubating in a water bath at 55°C. Different concentrations of FFA/BSA solutions were prepared by adjusting FFA/BSA ratios. For example, a 5-mM FFA/10% BSA stock solution was prepared by adding 50 ml of 100 mM FFA solution to 950 ml of 10% BSA solution. After heating and shaking in a water bath, each solution was vortex-mixed for 10 s and then subjected to an additional 10-min incubation at 55°C. The FFA/BSA complex solutions were cooled to room temperature, sterile-filtered (0.45-μm pore membrane filter), and stored at −20°C. HEVEC cells were treated with various FFAs by adding the FFA/BSA complex solutions to the tissue culture medium. Unless otherwise indicated, the standard protocol for PA treatment is 100 µM for 6 h.
Western blotting
Cells were lysed in an ice-cold RIPA buffer with 1× protease/phosphatase inhibitor cocktail (Cell Signaling Technology). Total protein samples (20–40 µg) were loaded into 4–20% Bis-Tris gradient gels (GenScript) and transferred to polyvinylidene fluoride membranes (Millipore). The membranes were incubated in a blocking buffer (5% [wt/vol] skim milk in phosphate-buffered saline [PBS] with 0.05% Tween20) for 1 h and then incubated with the primary antibodies overnight in the blocking buffer at 4°C. The primary antibodies used were anti-GAPDH (Abcam) [1:10,000], anti-TOMM20 (Abcam) [1:500], anti-human Lamp1 (DSHB) [1:200], anti-human TFEB (Cell Signaling Technology) [1:1,000], anti-LC3 (Sigma-Aldrich) [1:1,000], and anti-Phospho-TFEB (Ser211) (Cell Signaling Technology) [1:1,000]. After washing the films with washing buffer three times, they were incubated with peroxidase-conjugated anti-rabbit, anti-mouse, or anti-rat secondary antibodies at room temperature for 1 h, followed by the addition of Super-Signal West Pico Chemiluminescence Substrate (Thermo Fisher Scientific). Band intensities were quantified in ImageJ software (NIH).
Intracellular ROS labeling
To examine intracellular ROS levels, cells were incubated with 10 μM H2DCFDA (Invitrogen), a cell-permeable oxidant-sensitive fluorescent dye (Murphy et al., 2022) or 2 μM MitoSOX Green (Invitrogen), in a serum-free medium at 37°C for 30 min in the dark followed by a 10-min recovery in complete medium. The cells were then washed in PBS, and images were taken with an Olympus IX73 microscope and analyzed in ImageJ.
Lentivirus production and infection
Lentiviruses were made by co-transfecting pLVX constructs with psPAX2 and pMD2.G packaging plasmids into HEK293T cells using PEI transfection reagent (MedChemExpress, MCE). Supernatants were collected 48 h after transfection and filtered through a 0.45-µm syringe filter. Lentiviruses were concentrated using a GML-PCTM lentivirus concentrator (Genomeditech) according to the manufacturer’s instruction and stored at −80°C. Cells were infected with viral particles and polybrene (5 µg/ml; Millipore). After a 24-h incubation period, the virus-containing medium was replaced with a fresh medium containing puromycin for selection. Experiments were performed 5 d after infection.
pLenti-CMV-hTRPML1 and pLenti-CMV-hTFEB-mScarlet constructs were purchased from Genomeditech (Shanghai, China). The pLenti-hPRKN-mScarlet was constructed by inserting cDNAs encoding PRKN and mScarlet into the pLenti vector. For transduction of HUVECs, 5 μl of lentiviral vector was added to each well in 6-well plates (1 × 10⁵ cells/well) for 12 h. Subsequently, a fresh complete medium was added to replace the medium. To eliminate non-transduced cells, puromycin (Thermo Fisher Scientific) was added to the medium at a final concentration of 1 μg/ml, followed by incubation for at least 72 h. The transduced cells were then stained with Hoechst (MCE) before microscopic observations. ImageJ software was used for quantitation of transduction efficiency.
JC-1 staining
HUVECs were incubated with 1 μM JC-1 (MCE) in a complete culture medium at 37°C for 30 min before imaging. Fluorescence was detected at 520 nm for JC-1 monomers and 600 nm for JC-1 aggregates by an Olympus FV3000 confocal microscope (Smiley et al., 1991).
TMRE staining
HUVECs were incubated with 50 nM tetramethylrhodamine, ethyl ester (TMRE; Invitrogen) in a complete culture medium at 37°C for 30 min before imaging. Fluorescence was detected at 561 nm by an Olympus FV3000 confocal microscope.
BODIPY FL C16 staining
After 6 h of incubation in 10 μM BODIPY FL C16 (Thermo-Fisher Scientific)–BSA at 37°C to enable BODIPY FL C16 internalization, cells were washed two times with PBS, fixed with 4% paraformaldehyde in PBS, and then immunolabeled with anti-TOMM20 antibody (Abcam). Structured illumination microscopy (SIM) was performed as described below.
LysoTracker
HUVECs were incubated with 50 nM LysoTracker Red DND-99 (Invitrogen) in a culture medium for 15 min in a 37°C incubator. Images were acquired with an Olympus IX-73 microscope.
BODIPY 493/503 and Nile Red labeling
HUVECs were washed two times in PBS and then incubated with BODIPY 493/503 or Nile Red (MCE) diluted in PBS at a final concentration of 2 μg/ml and 10 μg/ml, respectively, for 30 min. HUVECs were washed again to remove any residual reagent before imaging with an Olympus FV3000 confocal microscope.
Whole-endolysosome electrophysiology
Endolysosomal electrophysiology was performed on enlarged endolysosomes isolated from HUVECs that had been treated with 1 μM apilimod (MCE) for 6 h. The bath (cytoplasmic) solution contained 150 mM KOH, 5 mM NaCl, 2 mM MgCl2, 0.39 mM CaCl2, 1 mM EGTA, and 10 mM HEPES with a free (Ca2+) of ∼100 nM (calculated by MaxChelator software). The solution pH was adjusted to 7.2 with methane sulfonic acid. The pipette (luminal) solution was a modified Tyrode’s solution with 145 mM NaCl, 5 mM KCl, 0.5 mM CaCl2, 1 mM MgCl2, 10 mM HEPES, and 10 mM MES (pH adjusted to 4.6 with HCl). A gravity-driven perfusion system was used for rapid solution changes. Data were collected with an Axopatch 200B patch clamp amplifier, Digidata 1550A, and pClamp 10.0 software (Axon Instruments). Currents were filtered at 5 kHz and digitized at 50 kHz. All experiments were conducted at 21–23°C and all recordings were analyzed with the pClamp 10.0 and Origin 2022b programs (OriginLab).
Laser scanning microscopy and SIM imaging
Cells were imaged with an Olympus FV3000 confocal microscope system, a structured illumination microscope (HIS-SIM) (Guangzhou CSR Biotech Co. Ltd.), and an Olympus SpinSR10 spinning-disk microscope imaging system.
Data analysis
Data are presented as means with standard errors of the mean (SEM). Statistical comparisons were performed with analyses of variance (ANOVAs) and Turkey’s post hoc tests or with paired and unpaired Student’s t tests where appropriate. A P-value <0.05 was considered statistically significant.
Online supplemental material
Fig. S1 shows that PA, but not OA, caused ROS elevation in human endothelial cells. Fig. S2 shows the activation of lysosomal TRPML1 channels by synthetic agonists and oxidants in human endothelial cells. Fig. S3 shows the effect of ML-SA5 treatment on PA-induced P-selectin expression, mitochondrial damage, and lysosomal acidification. Fig. S4 shows the ML-SA5 effect on TFEB-dependent lysosomal functions. Fig. S5 shows the working model of the protective effect of TRPML1 agonist on SFA-induced oxidative damage.
Data availability
The data underlying all plots and figure panels displayed in this paper are available from the corresponding author upon request.
Acknowledgments
We appreciate the helpful comments from other members of the Xu laboratory.
This work is supported by grants from the National Key Research and Development Program of China (No. 2022YFE0210100), the National Science Foundation of China (NSFC, No. 92354306), and the New Cornerstone Investigator Program, as well as the start-up funds from the Liangzhu Laboratory and Zhejiang University.
Author contributions: X. Feng: Conceptualization, Data curation, Formal analysis, Investigation, Methodology, Project administration, Resources, Supervision, Validation, Visualization, Writing - original draft, Writing - review & editing, W. Cai: Data curation, Formal analysis, Methodology, Resources, Software, Validation, Visualization, Writing - original draft, Writing - review & editing, Q. Li: Data curation, Formal analysis, Methodology, Software, Validation, L. Zhao: Data curation, Investigation, Methodology, Resources, Software, Writing - review & editing, Y. Meng: Investigation, Methodology, Resources, Writing - review & editing, H. Xu: Conceptualization, Funding acquisition, Methodology, Project administration, Resources, Supervision, Visualization, Writing - original draft, Writing - review & editing.
