Skip to Main Content

SQSTM1/p62 is a master regulator of the autophagic and ubiquitination pathways of protein degradation and the antioxidant response. p62 functions in these pathways via reversible assembly and sequestration of additional factors into cytoplasmic phase-separated structures termed p62 bodies. The physiological roles of p62 in these various pathways depend on numerous mechanisms for regulating p62 body formation and dynamics that are incompletely understood. Here, we identify a new mechanism for regulation of p62 oligomerization and incorporation into p62 bodies by SHKBP1, a cullin-3 E3 ubiquitin ligase adaptor, that is independent of its potential functions in ubiquitination. We map an SHKBP1–p62 protein–protein interaction outside of p62 bodies that limits p62 assembly into p62 bodies and affects the antioxidant response involving sequestration of Keap1 and nuclear translocation of Nrf2. These studies provide a non–ubiquitination-based mechanism for an E3 ligase adaptor in regulating p62 body formation and cellular responses to oxidative stress.

Protein degradation and quality control are fundamental to cellular health, with autophagy and the ubiquitin–proteasome system serving as two major regulatory mechanisms (Pohl and Dikic, 2019). The molecular integration of these pathways is mediated by autophagy receptors, which simultaneously bind ubiquitinated proteins and autophagy-specific ubiquitin-like modifiers such as LC3/GABARAP (Kirkin et al., 2009). The best studied autophagy receptor is p62/SQSTM1, whose dysfunction is closely linked to multiple neurodegenerative diseases (Ma et al., 2019; Rubinsztein, 2006) and cancers (Moscat et al., 2016). p62 participates in two critical cellular processes: the clearance of ubiquitinated proteins via autophagy (Pankiv et al., 2007) and the activation of antioxidant responses through the Keap1-Nrf2 pathway (Fan et al., 2010; Lau et al., 2010; Jain et al., 2010). These functions are dependent on p62’s unique ability to form dynamic cellular structures known as p62 bodies, through liquid–liquid phase separation (LLPS) (Sun et al., 2018).

p62 bodies are non–membrane-bound compartments that form through self-oligomerization mediated by its N-terminal PB1 domain (Ciuffa et al., 2015) and are further enhanced by the binding of p62 to the ubiquitin chains of ubiquitinated proteins via its C-terminal ubiquitin-associated (UBA) domain (Zaffagnini et al., 2018). p62 bodies serve as essential platforms for both autophagosome formation and sequestration of Keap1, a key factor in antioxidant response pathways (Kageyama et al., 2021). The dynamic properties of p62 bodies are crucial determinants of their cellular functions. Recent studies have revealed that these structures are not static aggregates but undergo continuous fusion and reorganization (Zaffagnini et al., 2018; Sun et al., 2018), with their formation regulated by several factors. Negative regulators of p62 body formation include MOAP-1, a protein that binds to the PB1-ZZ domain of p62 (Tan et al., 2021); vault RNA1-1, a small noncoding RNA that interferes with p62 oligomerization (Horos et al., 2019); SPOP, an E3 ligase that ubiquitinates the UBA domain of p62 and decreases ubiquitin-binding capacity (Shi et al., 2022); and TRIM21, an E3 ligase that ubiquitinates the PB1 domain of p62 and inhibits oligomerization (Pan et al., 2016). Whereas several such factors negatively regulating p62 body assembly have been identified, the molecular mechanisms controlling the size and fluidity of p62 bodies and, consequently, the impact on Keap1 sequestration and downstream signaling functions remain poorly understood.

Here, we identify SH3KBP1-binding protein 1 (SHKBP1) as a regulator of p62 body dynamics and function. We find that SHKBP1 directly binds to p62, and SHKBP1 levels inversely correlate with p62 body size and fluidity. Though SHKBP1 contains a Broad-Complex, Tramtrack, and Bric a brac (BTB) domain and is thus a putative substrate adaptor of the cullin-3 (CUL3) E3 ubiquitin ligase, we find that SHKBP1 does not affect p62 ubiquitination levels (Wang et al., 2020). Instead, loss-of-function studies reveal that through these effects on p62 body dynamics, SHKBP1 inhibits the sequestration of Keap1 into p62 bodies and ultimate clearance of Keap1. These effects thereby enhance the stabilization, nuclear translocation, and activation of the transcription factor Nrf2, a Keap1 ubiquitination substrate that is a master regulator of the antioxidant response. Thus, our studies reveal an unexpected role of an E3 ligase substrate adaptor independent of ubiquitination in controlling the assembly of p62 into p62 bodies and activation of Keap1-Nrf2 antioxidant response pathway.

SHKBP1 interactome analysis using quantitative proteomics identifies p62 as a potential binding partner

Our interest in SHKBP1 stemmed ultimately from a series of studies aimed to elucidate connections between phosphoinositide lipids and the regulation of the ubiquitination machinery. In this work, we focused on members of the PLEKHA family of pleckstrin homology domain–containing proteins, which through their multidomain interactions could link lipid binding to signaling via protein–protein interactions. Studies of PLEKHA4 revealed that it sequestered the substrate-specific adaptor of CUL3, KLHL12 in clusters at the plasma membrane (PM) via PI(4,5)P2 binding and oligomerization, leading to diminished polyubiquitination of Dishevelled proteins and enhancements in Wnt signaling and G1/S cell cycle progression in mammalian cell lines, mouse models of melanoma, and Drosophila (Shami Shah et al., 2019; Shami Shah et al., 2021; Sun et al., 2024). The paralogous PLEKHA5 interacted with and regulated a different cullin family E3 ligase, the anaphase-promoting complex/cyclosome, albeit at microtubules, though the protein exhibited a cell cycle–dependent localization at the PM based on PI(4,5)P2 binding exclusively during mitosis (Cao et al., 2022; Cao et al., 2024).

Analysis of the PLEKHA5 interactome by affinity purification–mass spectrometry (MS) proteomics revealed two additional high-confidence putative interaction partners, the paralogous SHKBP1 and KCTD3 (Cao et al., 2022). Intriguingly, both of these proteins contain structural features that support a potential role as a CUL3 adaptor. Like KLHL12, they contain a BTB domain that binds to CUL3 (Pinkas et al., 2017; Balasco et al., 2024), and additionally, they contain C-terminal WD40 repeats that likely mediate additional protein–protein interactions (Ji et al., 2016; Pinkas et al., 2017; Esposito et al., 2021, 2022). Mutations in SHKBP1 have been identified in multiple cancers (The Cancer Genome Atlas Research Network, 2017; Angrisani et al., 2021), suggesting potentially important cellular roles. However, no SHKBP1- or KCTD3-dependent ubiquitination substrates, or other cellular or molecular functions, have been reported to date. Therefore, we began our studies by designing a series of proteomics studies aimed to identify putative ubiquitination substrates of SHKBP1 as a means to elucidate molecular and cellular functions of SHKBP1.

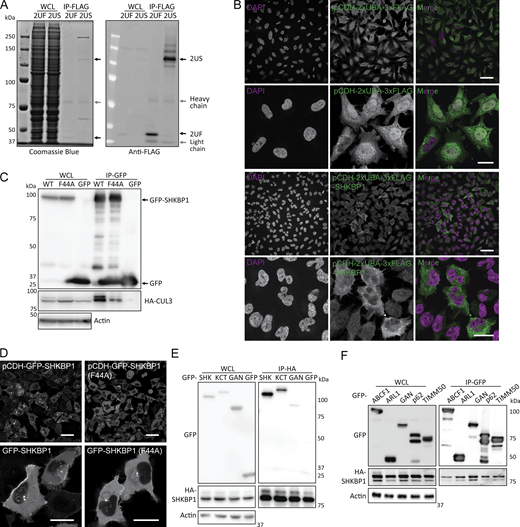
Due to the transient nature of E3–substrate interactions, identifying substrates of specific E3 ligases is a persistent challenge. We designed three distinct SILAC-based proteomics approaches aimed to stabilize interactions between adaptors and substrates either before or after ubiquitination events, each with their advantages and drawbacks. First, we used MLN4924, a neddylation inhibitor that disrupts the NEDD8 conjugation pathway and causes accumulation of unstable cullin-RING ligase (CRL) targets including but not limited to CUL3 (Tan et al., 2013). MLN4924 treatment would therefore be predicted to enhance the interaction of CUL3 substrate adaptors with their substrates by extending the time of an otherwise transient ubiquitination process. Potential drawbacks of this strategy are that unneddylated cullins could become targets of CAND1, which would exchange CUL3 adaptors such as SHKBP1 and release substrates, and that global CRL inhibition would perturb the cellular ubiquitination landscape. We performed such studies in SHKBP1 knockout (KO) cells generated using CRISPR/Cas9 mutagenesis engineered to stably express a GFP-tagged SHKBP1 for GFP-based affinity enrichment for MS (Fig. 1 A).

Second, we used a polyubiquitin-binding domain as a “ligase trap” to increase affinity for ligase–substrate complexes (Watanabe et al., 2020) (Fig. 1 B). By fusion of tandem UBA domains from Rad23, which delivers ubiquitinated substrates to the 26S proteasome, to SHKBP1, we aimed to bias enrichment of SHKBP1 interactors toward those inherently transient ligase–substrate interactions (Fig. S1, A and B). However, considering the limited recognition of UBA domains to only K48- and K63-linked chains, substrates modified with nondegraded linkage types may be underrepresented, and ongoing deubiquitylation or degradation could introduce peptide contaminants into the MS data. Third, we designed and used a point mutant of SHKBP1 incapable of binding to CUL3 to distinguish CUL3 complex components from substrates (Fig. 1 C). The CUL3 binding–deficient mutant SHKBP1F44A was designed according to a reported point mutation in the BTB domain of KBTBD8 (Fig. S1, C and D) (Werner et al., 2015). In principle, this strategy should enable distinguishing of CUL3 complex components (enriched in SHKBP1WT samples) from potential substrates (equally present in both samples or enriched in SHKBP1F44A samples), though a potential caveat is that the affinity of such substrates for SHKBP1F44A may also be altered.

In all cases, we performed affinity enrichment of the tagged SHKBP1 proteins and, using SILAC-based quantitative proteomics, identified hits predicted to be SHKBP1 interaction partners under the different conditions of each screen (i.e., + vs. – MLN4924, 2×UBA-SHKBP1 vs. 2×UBA only, and F44A vs. WT SHKBP1, respectively). To ensure robustness and to facilitate direct comparison between the experiments, all three SILAC screens were performed in biological triplicate and proteins were denoted as hits only if they displayed ≥1.2-fold enrichment in every replicate, a uniform cutoff chosen to balance sensitivity with stringency for low-abundance interactors. From the combined results from these three sets of proteomics experiments, we identified several hits of interest (Fig. 1, D–F). One group was additional CUL3 adaptors from the BTB family, including KCTD3, the closest paralog of SHKBP1, and GAN/KLHL16, which appeared as hits in the first two proteomics studies. Due to the propensity of BTB domains to homo- and hetero-oligomerize, it is possible that these BTB-containing proteins can hetero-oligomerize (Fig. S1 E). A second group of hits was classified as CUL3 regulators. These include CAND1, a cullin-RING exchange factor that preferentially binds to unneddylated cullins and, as expected, was more weakly enriched by SHKBP1F44A compared with SHKBP1WT in the third proteomics experiment, and the calcium sensor PDCD6, which has been implicated in the CUL3-KLHL12–mediated monoubiquitylation of SEC31 (Zheng et al., 2002; McGourty et al., 2016). A third and most diverse group was potential ubiquitination substrates, including SQSTM1/p62, TIMM50, ABCF1, AIFM1, VPS37A.

Among this third list, we were intrigued by the appearance of p62, which assembles into phase-separated p62 bodies to sequester intracellular polyubiquitinated cargos and mediate their autophagic clearance. Beyond its role in mediating autophagy of ubiquitinated proteins, p62 itself is heavily regulated by ubiquitination by several E3 ligases. At least five lysine residues within p62 (K7, K13, K91, K189, and K420) are targeted by at least four E3 ubiquitin ligases: TRIM21, Parkin, RNF166, and Keap1/SPOP, respectively (Pan et al., 2016; Song et al., 2016; Heath et al., 2016; Lee et al., 2017; Shi et al., 2022). We were therefore motivated to assess whether SHKBP1 could direct the ubiquitination of p62 by CUL3, acting as yet another layer of ubiquitin-related regulation of p62 function.

SHKBP1 interacts with p62 under resting conditions and upon blockade of neddylation and proteasomal degradation

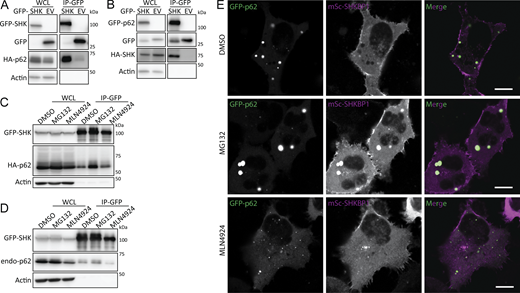
We first validated the interaction between SHKBP1 and p62 through reciprocal co-immunoprecipitation (co-IP) experiments. In these experiments, forms of SHKBP1 and p62 tagged with either GFP or HA demonstrated mutual interaction (Fig. 2, A and B). Given that p62 participates in degradation of ubiquitinated proteins and undergoes ubiquitination itself, we investigated the effects on this interaction by treatment of cells with either the proteasome inhibitor MG-132, to cause a buildup of ubiquitinated proteins destined for proteasomal degradation, or the neddylation inhibitor MLN4924, which prevents CRL-mediated ubiquitin ligase activity (Fig. 2, C and D). MG-132 increased, whereas MLN4924 decreased, total SHKBP1 and p62 levels, which was also reflected in the corresponding co-IP lanes. Despite these changes to protein levels, both treatments resulted in sustained SHKBP1 interactions with tagged p62 (Fig. 2 C) and endogenous p62 (Fig. 2 D).

Notably, these treatments influenced p62 body size. Confocal microscopy analysis of tagged SHKBP1 revealed localizations both at the PM and in the cytosol, with cytosolic puncta exhibiting partial colocalization with p62 bodies. MLN4924 treatment led to smaller p62 bodies, whereas MG-132 treatment caused larger p62 bodies to form (Fig. 2 E). We reasoned that the decrease in global ubiquitination caused by MLN4924 would lead to reduced sequestration of ubiquitinated proteins in p62 bodies, whereas accumulation of ubiquitinated proteins caused by MG-132 treatment would necessitate larger p62 bodies for autophagy-mediated degradation. Interestingly, p62 was initially identified in the MLN4924-treated proteomics, implying that neddylation stress renders p62 more accessible to SHKBP1. Together with imaging results that show smaller p62 condensates under MLN4924 treatment, we hypothesized that SHKBP1 preferentially engages the soluble p62 pool and that the extent of p62 body formation modulates their association.

The WD domain of SHKBP1 interacts with the PB1 domain of p62

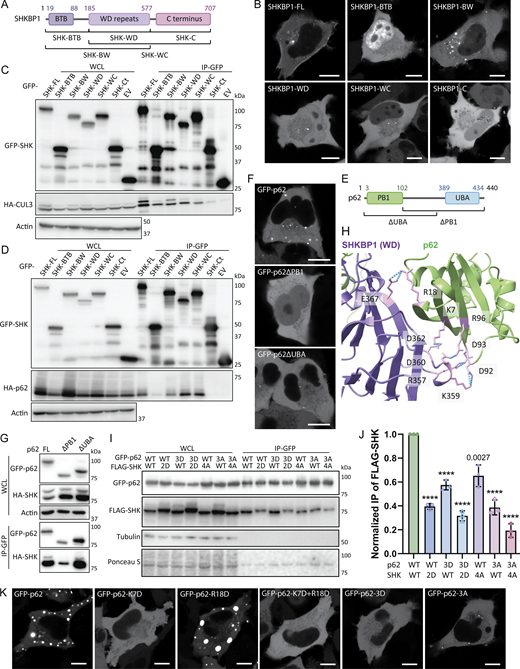
After confirming the SHKBP1-p62 interaction, we next mapped the domains in each protein responsible for mediating the interaction. SHKBP1 comprises an N-terminal BTB domain, a central WD domain with 8 repeats, and a C-terminal region. The BTB domain facilitates CUL3 binding, whereas the WD domains typically serve as a substrate interaction platform in other E3 ligases. To characterize SHKBP1 domain functions, we generated constructs encoding either individual domains (BTB, WD, C-term) or single domain deletions (BTB + WD (BW) and WD + C terminus (WC)) (Fig. 3 A). Interestingly, all six truncated constructs lost the PM localization characteristic of full-length SHKBP1, instead exhibiting distinct subcellular distribution patterns; BTB showed strong nuclear localization, BW formed many puncta, WD and WC formed fewer and smaller puncta, and C-term was cytosolic (Fig. 3 B). We expressed these constructs in cells to assess their ability to co-immunoprecipitate with CUL3 and p62 (Fig. 3, C and D). These studies indicated that BTB domain deletion substantially reduced CUL3 binding, and WD domain deletion significantly decreased p62 interaction. We note that due to the oligomerization property of both the PB1 domain of p62 and the BTB domain of SHKBP1, the excision of certain domains in truncation constructs, when overexpressed (OE) in cells containing low, endogenous levels of full-length, WT proteins, may not be sufficient to fully abrogate the ability of the OE, tagged protein constructs to interact with one another. Analysis of colocalization of p62 with SHKBP1 truncations by confocal microscopy consistently supported these findings (Fig. S2 A). Therefore, we conclude that the BTB domain of SHKBP1 mediates interaction with CUL3, and the WD domain of SHKBP1 interacts with p62.

Unlike SHKBP1, p62 has been well studied in terms of the functions of its individual domains. The two most important domains for p62 body formation are N-terminal Phox and Bem1 (PB1) domain and the C-terminal UBA domain (Fig. 3 E). The PB1 domain mediates self-oligomerization in a manner that is reduced by K7 ubiquitination (Wilson et al., 2003; Pan et al., 2016). The UBA domain mediates interactions with ubiquitinated substrates, and the binding affinity to ubiquitin chains is enhanced after S403 phosphorylation (Matsumoto et al., 2011). Both mechanisms contribute to p62 phase separation. Consequently, truncated versions of p62 lacking either of these domains could not form large p62 bodies (Fig. 3 F), and they showed consistent cytosolic localization when co-expressed with SHKBP1 (Fig. S2 B). Co-IP experiments of these two truncations with SHKBP1 demonstrated that the deletion of the PB1 domain more strongly decreased the binding of p62 with SHKBP1 than deletion of the UBA domain, indicating that the PB1 domain is responsible for the interaction of p62 with SHKBP1 (Fig. 3 G).

To further investigate the interaction interface between SHKBP1 and p62, we modeled the complex using AlphaFold 3 (Abramson et al., 2024), with full-length p62 (residues 1-440) and the WD domain of SHKBP1 (residues 185-577) used for the modeling. The predicted complex structure implicates an interface between the PB1 domain of p62 and the fourth WD repeat of SHKBP1 as primarily responsible for binding. Notably, five salt bridges were identified at the predicted interaction site (Fig. 3 H). To experimentally test this model, we constructed point mutations targeting these salt bridge-forming residues. For p62, we generated a charge-eliminating mutant (D92A, D93A, R96A (3A)) and a charge-reversal mutant (K7D, R18D, R96D (3D)), and for SHKBP1, we generated similar charge-eliminating (R357A, K359A, D360A, D362A (4A)) and charge-reversal (R357D, K359D (2D)) mutants. In co-IP experiments using GFP-tagged p62 to pull down FLAG-tagged SHKBP1, we found that both the charge-eliminating (4A) and charge-reversal (2D) mutants of SHKBP1 showed significantly decreased binding affinity to WT p62 or mutant p62 constructs. Conversely, substitutions in p62 to eliminate charge (3A) or reverse charge (3D) likewise reduced its binding to WT and mutant SHKBP1 constructs (Fig. 3, I and J).

Because p62 body formation appears to be related to the interaction with SHKBP1, we tested whether the p62 3A and 3D mutants also behaved abnormally in oligomerization using confocal microscopy analysis to assess subcellular localization. For these experiments, we not only used the 3A and 3D mutants of p62 but also K7D (which reverses charge at the known ubiquitination site), R18D, which was also predicted to interact with SHKBP1, and a K17D/R18D double mutant (Fig. 3 K). Surprisingly, except for R18D, all mutations adopted a fully cytosolic localization, suggesting that these sites are important for the oligomerization function of the PB1 domain. The co-expression of these p62 mutants with SHKBP1 provided consistent support for these findings (Fig. S2 C). Previous x-ray crystallography analysis of p62 has demonstrated that an intramolecular hydrogen bond between K7 and D69 is critical for p62 dimerization (Ichimura et al., 2008). Further, the E3 ligase TRIM21 modifies p62 at K7 with K63-linked polyubiquitin, which abrogates p62 oligomerization via the PB1 domain (Pan et al., 2016). Based on the above results, we hypothesize that the interaction with SHKBP1 via the p62 PB1 domain inhibits p62 oligomerization, thus negatively regulating p62 body formation.

SHKBP1 inhibits p62 oligomerization without affecting its ubiquitination state

Given the potential of SHKBP1 to act as a CUL3-based E3 ligase substrate adaptor, we next examined whether p62 represents a CUL3-SHKBP1 ubiquitination substrate. We performed in vivo ubiquitination assays by transfecting cells with His-tagged ubiquitin and enriching ubiquitinated proteins using Ni-NTA affinity chromatography, with p62 ubiquitination detected as the ensemble of high-molecular-weight species in the α-p62 blot (Fig. 4 A). However, no significant differences in p62 ubiquitination were observed between WT cells, SHKBP1 KO cells, and WT cells overexpressing SHKBP1 (OE). Notably, p62 was detected exclusively in the first proteomics experiment with statistical significance (Fig. 1 A). Its absence from the ligase-trap experiment (Fig. 1 B) is consistent with the fact that SHKBP1 does not ubiquitinate p62, whereas its exclusion from the third proteomics experiment (Fig. 1 C) indicates that the SHKBP1-p62 interaction occurs independently of CUL3. We then explored the extent of p62 degradation and found that endogenous p62 protein levels decreased upon SHKBP1 KO and increased upon SHKBP1 OE (Fig. 4 B). These results are consistent with a stabilizing physical interaction between these proteins, particularly through affecting the PB1 domain–mediated oligomerization mechanism.

Oligomerization of p62 drives LLPS to form p62 bodies, which have been considered as membraneless organelles (Komatsu, 2022). By confocal microscopy, we observed that SHKBP1 OE induced smaller p62 puncta compared with control cells, whereas SHKBP1 KO cells displayed larger p62 puncta compared with WT cells in a manner that could be rescued by expression of a CRISPR-resistant SHKBP1 construct (Fig. 4, C and D). We additionally quantified the colocalization between p62 and LC3 in SHKBP1 WT, KO, and OE conditions in the presence and absence of bafilomycin A1 (BafA1) (a vacuolar H+-ATPase inhibitor). Despite the pronounced differences in p62 body size, the extent of p62-LC3 colocalization was comparable across conditions, indicating that p62 bodies formed under different SHKBP1 levels are similarly engaged with the autophagy pathway (Fig. S3, A and B).

We further examined p62 oligomerization biochemically, using the reversible cross-linking agent dithiobis(succinimidyl propionate) (DSP), which cross-links lysine residues within or between proteins via a cleavable disulfide-containing linker. In the absence of reducing agents such as β-mercaptoethanol, large protein complexes migrate more slowly in SDS-PAGE upon DSP cross-linking, enabling the separation of monomers. To quantitatively assess p62 oligomerization, we treated WT and SHKBP1 KO cells with DSP and analyzed cell lysates under either reducing or nonreducing conditions. As a positive control, cells were also treated with MG-132 to induce proteotoxic stress, which as expected increased the extent of p62 oligomerization, which was quantified as a decrease in the ratio of p62 monomer to total p62 levels (Fig. 4 E). We compared this ratio in SHKBP1 KO cells with that in WT cells and found that SHKBP1 KO led to a further decrease in p62 monomer levels and hence an increase in aggregation (Fig. 4 F). Collectively, these data indicate that SHKBP1 inhibits p62 oligomerization in a ubiquitination-independent manner.

SHKBP1 decreases the fluidity of cellular p62 bodies

Biomolecular condensates, including p62 bodies, form through phase separation to create distinct cellular compartments that concentrate specific molecules (Shin and Brangwynne, 2017). Previous studies have established that p62 forms droplets in vivo exhibiting liquid-like behavior that is characterized by high sphericity and the ability to undergo fusion and rapid molecular exchange with their surroundings (Sun et al., 2018).

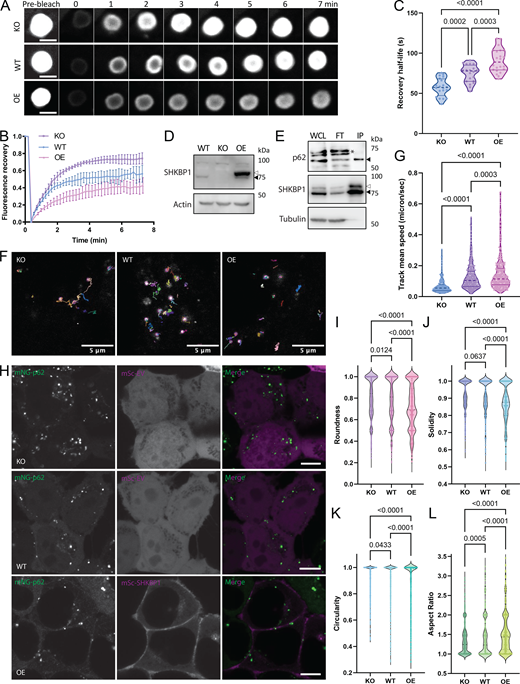
To investigate how SHKBP1 influences p62 body formation, we employed fluorescence recovery after photobleaching (FRAP) to quantify molecular dynamics within these cellular compartments. FRAP measures the rates of molecular exchange between p62 bodies and their surrounding environments, with faster rates of fluorescence recovery after local photobleaching indicating higher fluidity. To ensure consistent analysis across three different cell lines (WT, SHKBP1 KO, and SHKBP1-OE HeLa cells), we examined spherical p62 bodies with ∼2 µm diameter in all samples, as size determines surface area and can affect exchange rate and other dynamic properties. These studies revealed an inverse correlation between recovery kinetics and SHKBP1 expression status (Fig. 5 A). p62 bodies in SHKBP1-OE cells exhibited significantly slower fluorescence recovery rates compared with those in untransfected cells, whereas those in SHKBP1 KO cells exhibited accelerated recovery rates relative to those in WT cells. Further, p62 bodies in SHKBP1 KO cells had an increased mobile fraction of p62 relative to those in WT cells, whereas SHKBP1 OE increased the immobile fraction relative to untransfected cells (Fig. 5 B). Recovery half-time comparisons further supported these observations (Fig. 5 C). SHKBP1 KO cells showed significantly shorter half-times than WT cells and SHKBP1 OE. This enhanced molecular dynamics in KO cells aligned with our observation of an overall increase in p62 body size, as increased fluidity can promote condensate growth through more frequent molecular exchange and inter-condensate fusion (Xia et al., 2023; Shin and Brangwynne, 2017).

To complement the evidence on p62 body dynamics achieved from stable OE of GFP-tagged p62, we also analyzed the dynamics of endogenous p62 bodies in live cells upon perturbation of SHKBP1 levels. For these studies, we generated an endogenously tagged p62 stable cell line in HEK293T cells using CRISPR/Cas9-based knock-in of a split-mNeonGreen2 (mNG) fluorescent protein as first reported by the OpenCell project (Cho et al., 2022). Here, CRISPR/Cas9-based mutagenesis and homology-directed repair were used to fuse the mNG11 fragment to the N terminus of p62 in a cell line stably expressing the nonfluorescent mNG1-10 fragment. Reconstitution of the two mNG fragments led to green mNG fluorescence fused to SHKBP1 expressed at endogenous levels. In this cell line, we then generated SHKBP1 KO using CRISPR/Cas9-based mutagenesis as done previously, and we verified KO efficiency by WB (Fig. 5 D). For subsequent imaging experiments (vide infra), we used both WT and SHKBP1 KO versions of these cell lines, as well as an OE cell line, wherein the WT cell line was transfected with a large amount of FLAG-SHKBP1 to achieve supraphysiological SHKBP1 levels (Fig. 5 D). To further support the physical association between SHKBP1 and p62 in this endogenously tagged system, we performed co-IP with an anti-mNeonGreen antibody in the WT cell line that was transfected with a small amount of FLAG-SHKBP1 and detected enrichment of both FLAG-tagged and endogenous SHKBP1 with p62 in the immunoprecipitation (IP) fraction (and concomitant depletion from the flow-through fraction) under these near-physiological expression conditions (Fig. 5 E).

To compare the p62 body dynamics in SHKBP1 WT, KO, and OE conditions, we tracked the single particles and calculated the speed of their movement (Fig. 5, F and G; and Videos 1, 2, and 3). These studies revealed that p62 bodies exhibited the fastest movement (quantified as track mean speed) in SHKBP1-OE cells, where the p62 bodies also appeared the smallest. In contrast, the mean speed of p62 bodies in SHKBP1 KO cells was the slowest, consistent with the largest size of p62 bodies in these cells. We additionally quantified several shape properties of endogenous p62 bodies in these live-cell images (Fig. 5 H), including roundness, solidity, circularity, and aspect ratio, to assess these parameters as proxies for surface tension of p62 bodies (Alberti and Dormann, 2019). Larger bodies would be expected to exhibit higher circularity, higher roundness, and lower aspect ratios (i.e., closer to 1), because increases in surface tension drive the formation of larger droplets to minimize surface area and adopt spherical shapes (Shin and Brangwynne, 2017). Smaller bodies would be more likely to exhibit an irregular shape due to less surface tension-driven rounding or due to mechanical constraints from the cellular environment (Alberti et al., 2019). For solidity, larger bodies, if stable and driven by strong surface tension, would be generally expected to have fewer irregularities or internal voids, resulting in higher solidity. The quantification of these parameters under SHKBP1 KO, WT, and OE conditions revealed that p62 bodies in SHKBP1 KO cells were closer to idealized spheres than in WT cells, and SHKBP1 OE led to even less spherical and solid p62 bodies than WT (Fig. 5, I–L).

These results suggest that SHKBP1 regulates the fluidity of cellular p62 bodies by reducing molecular exchange rates. We propose that SHKBP1 achieves this negative regulation by modulating the dynamic exchange between two different pools of p62, namely, the phase-separated p62 inside of p62 bodies and the pool of free p62 in the cytosol. In this model, SHKBP1 preferentially binds to monomeric, dimeric, or low-complexity oligomeric p62, thereby inhibiting its further multimerization and ultimate incorporation into p62 bodies. This mechanism provides insight into how cells can tune the fluidity of cellular p62 bodies through protein–protein interactions. Studies to biochemically test the effects of the SHKBP1-p62 interaction on p62 condensate formation using in vitro reconstitution systems, which would require purified components, represent an interesting future direction (Yang et al., 2019).

SHKBP1 inhibits Keap1 aggregation and clearance via p62 bodies

p62 bodies play dual roles in cellular homeostasis by facilitating autophagic degradation and mediating antioxidant responses through the p62-Keap1-Nrf2 pathway. In this latter pathway, p62 competitively binds the CUL3 E3 ubiquitin ligase adaptor Keap1, preventing it from targeting the transcription factor Nrf2 for degradation, ultimately leading to Nrf2 nuclear translocation and activation of antioxidant gene expression (Komatsu, 2022; Baird and Yamamoto, 2020; Lau et al., 2010).

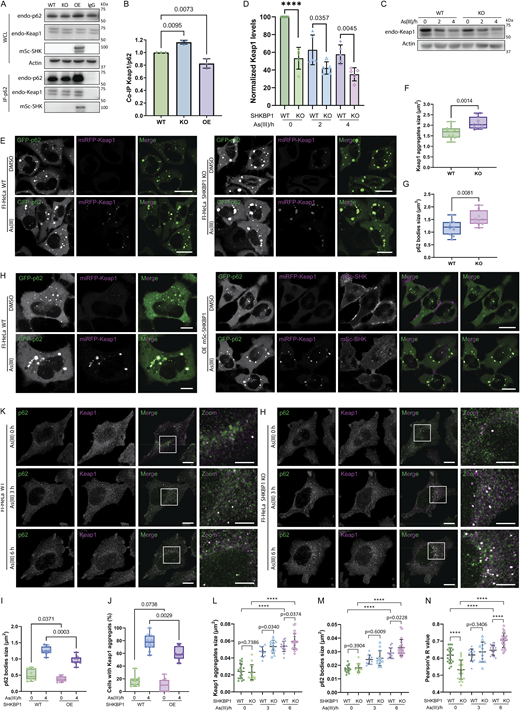
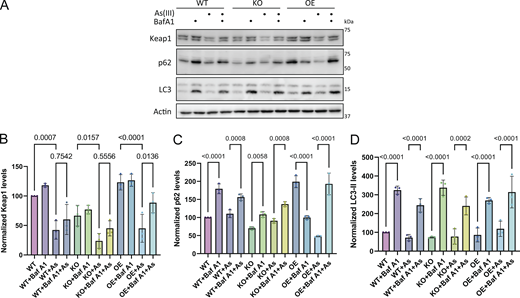
To investigate whether the interaction of SHKBP1 with p62 affects this antioxidant stress response, we first examined the binding between endogenous p62 and Keap1 in cells with different levels of SHKBP1. Enrichment of endogenous p62 by IP revealed that SHKBP1 KO enhanced p62-Keap1 binding relative to WT cells, whereas SHKBP1 OE reduced their interaction relative to untransfected cells, indicating that SHKBP1 antagonizes the association between endogenous p62 and Keap1 (Fig. 6, A and B). We next explored the effect of SHKBP1 on Keap1 levels under conditions of oxidative stress by treatment of cells with sodium arsenite (As(III)) (Lau et al., 2013). Here, SHKBP1 KO cells exhibited decreased Keap1 levels both before and after As(III) treatment compared with WT cells (Fig. 6, C and D). In addition, we examined autophagic flux by monitoring LC3 lipidation, as well as p62 and Keap1 turnover upon As(III) and BafA1 treatment (Fig. S4 A). Quantifications showed that BafA1 induced LC3-II accumulation and markedly suppressed As(III)-induced degradation of p62 and Keap1, indicating that their clearance is autophagy-dependent (Fig. S4, B–D).

Because oxidative stress induces Keap1 to form cytoplasmic aggregates that colocalize with p62 bodies before autophagic degradation, we quantified the size of both Keap1 aggregates and p62 bodies in cells co-expressing GFP-p62 and miRFP-Keap1 that contained different levels of SHKBP1. Compared with WT cells, SHKBP1 KO cells exhibited larger Keap1 aggregates and p62 bodies (Fig. 6, E–G), whereas SHKBP1 OE resulted in smaller p62 bodies and significantly reduced the percentage of cells containing Keap1 aggregates after As(III) treatment compared with untransfected cells (Fig. 6, H–J). A similar analysis of endogenous p62 and Keap1 by IF in SHKBP1 KO cells revealed an increase in p62 body size and Keap1 aggregate size compared with WT cells upon As(III) treatment, accompanied by increased colocalization between Keap1 and p62 (Fig. 6, K–N). Collectively, these findings demonstrate that SHKBP1 regulates p62-Keap1-Nrf2 signaling by modulating the ability of p62 to sequester Keap1, thereby influencing cellular antioxidant responses.

SHKBP1 KO enhances Nrf2 nuclear translocation

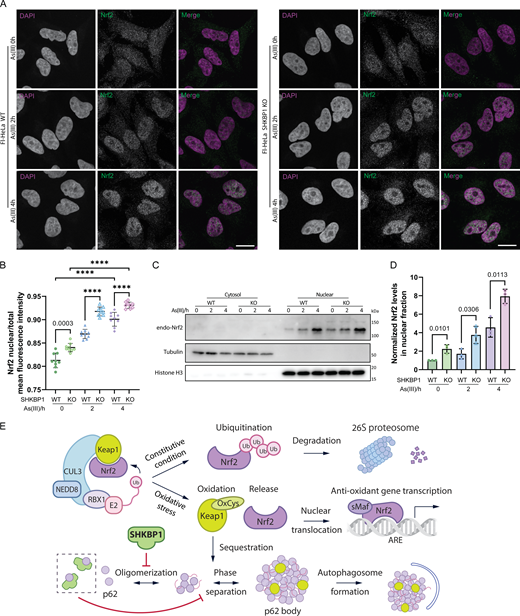
After establishing that SHKBP1 modulates Keap1 clearance via p62 bodies, we aimed to examine the downstream functional consequences on the antioxidant response. The sequestration of Keap1 in p62 bodies directly leads to the release of Nrf2, allowing Nrf2 translocation into the nucleus to induce the transcription of oxidative responsive genes (Saito et al., 2016). Therefore, we sought to study whether the effect of SHKBP1 on Keap1 sequestration has an impact on Nrf2 translocation. To this end, we performed IF of endogenous Nrf2 and found that loss of SHKBP1 resulted in marked elevation of nuclear Nrf2 both before and after As(III) treatment (Fig. 7, A and B). Further, we biochemically analyzed cytosolic and nuclear fractions and found that, though As(III) treatment increased the nuclear Nrf2 fraction as expected, SHKBP1 KO caused a further enhancement of nuclear Nrf2 compared with WT cells (Fig. 7, C and D).

Finally, p62 body accumulations have been reported in several diseases, including hepatocellular carcinoma (Inami et al., 2011) and neurodegenerative diseases (Ma et al., 2019), prompting us to examine whether SHKBP1 expression levels might correlate with disease progression. By examining mRNA levels from RNA-seq experiments in the NCBI Gene Expression Omnibus repository, we found that SHKBP1 expression was upregulated in models of hepatocellular carcinoma and Parkinson’s disease, suggesting a compensatory attempt to lessen pathological p62 aggregation (Fig. S5, A and B).

Collectively, these data suggest that SHKBP1 negatively modulates the Nrf2-mediated oxidative stress response, and taken together, our results indicate that SHKBP1 interacts with p62, thus preventing it from oligomerization, inhibiting the formation and degradation of p62 bodies during the activation of the Keap1-Nrf2 oxidative stress response pathway (Fig. 7 E).

p62 bodies are regulated in a multifaceted manner, including by phosphorylation, ubiquitination, and protein–protein interactions (Ichimura et al., 2013). Notable regulators include SPOP, TRIM21, MOAP-1, vault RNA1-1, DAXX, and Smurf1, all of which modulate p62 body formation through mechanistically distinct approaches (Shi et al., 2022; Pan et al., 2016; Tan et al., 2021; Horos et al., 2019; Yang et al., 2019; Xia et al., 2023). Compared with these established p62 regulators, SHKBP1 acts via a distinct and nuanced mechanism. Whereas it shares structural similarities with E3 ligase substrate receptors like SPOP and TRIM21, SHKBP1 does not mediate ubiquitination of p62 despite interacting with this protein. Instead, its interaction targets p62 oligomerization through direct interactions with relevant domains. The E3 ligase Smurf1 also interacts with p62 without ubiquitinating it, but its positive modulation on p62 body formation is indirectly achieved by an enhancement of p62 phosphorylation via mTORC1 signaling (Xia et al., 2023). MOAP-1 also binds to the PB1 domain, similar as SHKBP1, but it is recruited to p62 bodies to promote their dissociation upon stress (Tan et al., 2021). Instead, our data support a model wherein SHKBP1 interferes with p62 monomer oligomerization before condensate formation in a preventative mechanism that contrasts with direct engagement of MOAP-1 with p62 bodies (Fig. 7 E).

Previous studies have highlighted that only monomeric and low-complexity oligomeric p62 demonstrates strong RNA binding (Horos et al., 2019), similar to the preference of SHKBP1 for binding to pools of p62 that are not phase-separated into p62 body. However, the cellular factors determining the selectivity of p62 for vtRNA1-1 remain unclear. In contrast, our data support a direct and structurally well-defined interaction of SHKBP1 with the PB1 domain of p62. Finally, the interactions of DAXX with p62 provide an interesting counterpoint to the proposed mechanism for SHKBP1 action. Whereas DAXX increases p62 body solidity by regulating p62 oligomerization and promoting p62 phase separation (Yang et al., 2019), SHKBP1 appears to constrain p62 body formation, as SHKBP1 KO cells exhibit increased material exchange of p62 into and out of p62 bodies. These seemingly opposite roles in p62 aggregation will inspire deeper investigation into the molecular mechanisms that might contribute to p62 phase separation. This intricate constellation of regulatory mechanisms indicates that p62 body formation is a finely tuned process involving multiple molecular actors. Understanding the different contexts in which SHKBP1 contributes most strongly to this process could provide critical insights into cellular stress response and protein quality control mechanisms.

Beyond our primary findings, this study also reveals SHKBP1 as a BTB domain–containing protein with numerous molecular interactions. Our systematic proteomics experiments have identified multiple potential interactors beyond p62, suggesting interesting future directions. First, whereas we have confirmed binding of SHKBP1 to CUL3 (Pinkas et al., 2017; Esposito et al., 2022; Balasco et al., 2024), the functional assessment of the potential E3 ligase activity of CUL3-SHKBP1 remains unexplored. Proteins such as TIMM50, ABCF1, AIFM1, and VPS37A represent promising candidates to investigate potential ubiquitination mechanisms mediated by the CUL3-SHKBP1 complex. Second, the capacity of the BTB domain for multimerization presents additional avenues for investigation. BTB domain–mediated multimerization can significantly enhance local substrate concentration and ubiquitin transfer efficiency through homo- and hetero-multimerization mechanisms (Sumara et al., 2007; Frendo-Cumbo et al., 2019; Tong et al., 2006; Errington et al., 2012). Our identification of KCTD3 and GAN as SHKBP1 interactors is particularly noteworthy, given their shared structural characteristics: a BTB domain and a β-propeller architecture formed by either WD repeats (KCTD3) or Kelch repeats (GAN). These molecular features suggest the potential for SHKBP1 to form hetero-multimeric complexes, possibly while interacting with CUL3. Finally, mutations in SHKBP1 have been identified in cervical cancer (Greif et al., 2011), acute myeloid leukemia (Angrisani et al., 2021), and colorectal cancer (COSMIC database), suggesting potential roles of SHKBP1-mediated p62 dysfunction and/or the Keap1-Nrf2 antioxidant response pathway in tumorigenesis.

Reagents

The following antibodies were used for western blot: mouse anti-SQSTM1/p62 (D5L7G), Cell Signaling Technology (AB_2800125; RRID, 88588); rabbit anti SQSTM1/p62, ABclonal (AB_2862742; RRID, A19700); mouse anti-Keap1, Santa Cruz Biotechnology (AB_10844829; RRID, sc-365626); rabbit anti-SHKBP1, Bethyl Laboratories (AB_2621086; RRID, A304-891); mouse anti-SHKBP1, Santa Cruz Biotechnology (sc-390121; RRID unavailable); mouse anti-ubiquitin, Santa Cruz Biotechnology (AB_628423; RRID, sc-8017); mouse anti-GFP, Santa Cruz Biotechnology (AB_627695; RRID, sc-9996); mouse anti-mCherry, Sigma-Aldrich (AB_11034849; RRID, MAB131873); mouse anti-actin, MP Bio (AB_2335127; RRID, 08691001); rabbit anti-FLAG, Sigma-Aldrich (AB_439687; RRID, F7425); mouse anti-HA, Covance (AB_291262; RRID, MMS-101R); rabbit anti-tubulin, Cell Signaling Technology (AB_823664; RRID, 2128S); rabbit anti-Histone H3, Cell Signaling Technology (AB_10544537; RRID, 4499S); mouse anti-Nrf2 (A-10), Santa Cruz Biotechnology (AB_ 10917561; RRID, sc-365949). The following antibodies were used for IF: rabbit anti-FLAG, Sigma-Aldrich (AB_439687; RRID, F7425); rabbit anti-LC3A/B (D3U4C), Cell Signaling Technology (AB_2617131; RRID, 12741S); rabbit anti-SQSTM1/p62, ABclonal (AB_2862742; RRID, A19700); mouse anti-Keap1, Santa Cruz Biotechnology (AB_10844829; RRID, sc-365626); mouse anti-Nrf2 (D1Z9C), Cell Signaling Technology (AB_ 2715528; RRID, 12721S); Alexa Fluor 594–conjugated goat anti-mouse IgG, Thermo Fisher Scientific (AB_2556549; RRID, R37121); Alexa Fluor 488–conjugated goat anti-rabbit IgG, Thermo Fisher Scientific (AB_ 143165; RRID, A11008); goat anti-mouse HRP, Jackson ImmunoResearch Labs (AB_2307392; RRID, 115-035-146); goat anti-rabbit HRP, Jackson ImmunoResearch Labs (AB_2307391; RRID, 111-035-144).

Reagents were obtained from the following sources: DSP, TCI America (TCD2473); MLN4924, Cayman (15217); MG-132, Selleckchem (S2619); BafA1, Cayman (11038); GFP-Trap magnetic agarose, ChromoTek (gtma-20); Protein G Sepharose, BioVision (6511); Ni-NTA agarose, QIAGEN (133203974); anti-HA magnetic beads, Thermo Fisher Scientific (88836); anti-FLAG magnetic beads, made in-house from NHS magnetic beads, Nacalai USA (TAS8848N1141-10MG) and anti-DYKDDDDK tag, Fujifilm (012-22383); anti-mNG magnetic beads, Bulldog Bio (NTMA010); Lipofectamine 2000, Invitrogen (11668019); RNase A, Research Products International (R21750); puromycin dihydrochloride, Sigma-Aldrich (P8833); blasticidin S hydrochloride, 10 mg/ml in HEPES buffer, Alfa Aesar (J67216); cOmplete protease inhibitor cocktail, Roche (5056489001); digitonin, TCI Chemicals (D0540); ProLong Diamond Antifade Mountant with DAPI, Thermo Fisher Scientific (P36971); Clarity Western ECL Substrate, Bio-Rad (1705061).

Cloning

The SHKBP1 cDNA (Gene ID: 92799, a gift from Haiyuan Yu, Cornell University, Ithaca, NY) was cloned into the pEGFP-C1 vector (Clontech) using EcoRI and KpnI to generate EGFP-SHKBP1, and into the p3xFLAG-CMV-10 vector (Sigma-Aldrich) using HindIII and KpnI to generate FLAG-SHKBP1 using primers: 5′-GTC​AAG​CTT​ATG​GCA​GCA​GCG​GCT​ACT​G-3′, 5′-TCG​AGC​GGC​CGC​TCA​AAA​GGA​AGT​TTC​ATT​GAG​CTT​CAT​C-3′. Subsequently, truncations of SHKBP1 were generated by standard or overlap PCR, and inserts were cloned into the pEGFP-C1 vector using primers: 5′-GCT​TCG​AAT​TCT​ATG​GCA​GCA​GCG​GCT​ACT-3′, 5′-ACC​GTC​GAC​TTA​TCC​TAG​CTG​CTG​AGG​CCC​CA-3′, 5′-GCT​TCG​AAT​TCT​ATG​GCC​CCT​GCA​GGT​GGC​CTG​A-3′, 5′-ACC​GTC​GAC​TCA​AAA​GGA​AGT​TTC​ATT​GAG​CTT​CAT​CTT​GGG​AGG-3′, 5′-GCT​TCG​AAT​TCT​ATG​GGA​CGG​CCA​GCC​CCT​GTC-3′, 5′-ACC​GTC​GAC​TTA​CTG​GCC​GAG​GCC​GTC​CAT-3′. Mutant constructs were generated using the QuikChange XL site–directed mutagenesis kit (Agilent), including F44A, 4A, and 2D using primers: 5′-GTG​CAG​AAG​TTC​CCC​TTG​CGC​ATG​AAA​AGC​AAC​AGC​CTC​CTT​GTC​AGC​G-3′, 5′-CGC​TGA​CAA​GGA​GGC​TGT​TGC​TTT​TCA​TGC​GCA​AGG​GGA​ACT​TCT​GCA​C-3′, 5′-ATG​TGC​AGA​AGT​TCC​CCT​TGG​ACA​TGG​ATG​ACA​ACG​ACC​TCC​TTG​TCA​G-3′, 5′-CTG​ACA​AGG​AGG​TCG​TTG​TCA​TCC​ATG​TCC​AAG​GGG​AAC​TTC​TGC​ACA​T-3′, 5′-TGT​GCA​GAA​GTT​CCC​CTT​GGC​CAT​GGC​AGA​CAA​CGA​CCT​CCT​TGT​C-3′, 5′-GAC​AAG​GAG​GTC​GTT​GTC​TGC​CAT​GGC​CAA​GGG​GAA​CTT​CTG​CAC​A-3′, 5′-CTT​GCG​CAT​GAA​AGC​CAA​CGC​CCT​CCT​TGT​CAG​CG-3′, 5′-CGC​TGA​CAA​GGA​GGG​CGT​TGG​CTT​TCA​TGC​GCA​AG-3′, 5′-TGC​AGA​AGT​TCC​CCT​TGG​CCA​TGG​CAG​CCA​ACG​CCC​TCC​TTG​TCA​GCG​AGC-3′, 5′-GCT​CGC​TGA​CAA​GGA​GGG​CGT​TGG​CTG​CCA​TGG​CCA​AGG​GGA​ACT​TCT​GCA-3′. For the ligase-trap constructs, 2×UBA was subcloned from Rad23 into the p3×FLAG-CMV-14 vector (Sigma-Aldrich), and then, SHKBP1 was inserted after the FLAG tag using primers: 5′-GTC​AGA​ATT​CGC​GCT​TCC​TGA​TCC​GCG​GCC​GCC​GCT​ATC​TTC​ATC​AAA​GTT​CTG​CTG​TAG​AAG-3′, 5′-TAC​GAG​ATA​TCG​GGA​AGC​GGA​TCA​GGA​AGC​GGA​TCA​GGA​GTG​ACG​GGT​CAG​TCT​TAC​GAG-3′, 5′-ACT​CAC​TAT​AGG​GAG​ACC​CAC​GTC​AGA​ATT​AAG​CTT​GCC​ACC​ATG-3′, 5′-CTC​TAG​ATG​CAT​GCT​CGA​GCG​ATG​CCA​CCC​GGG​ATC​CTC-3′. For generating stable HeLa cells used in the proteomics experiments, silent mutations were incorporated into SHKBP1 to generate CRISPR KO SHKBP1 #1-resistant constructs using the QuikChange XL site–directed mutagenesis kit using primers: 5′-TCT​ATG​GCA​GCC​GCT​GCT​ACC​GCA​GCT​GAG​GGG​GTC​CC-3′, 5′-GGG​ACC​CCC​TCA​GCT​GCG​GTA​GCA​GCG​GCT​GCC​ATA​GA-3′. Resistant EGFP-SHKBP1 or 2×UBA-3×FLAG-SHKBP1 (2US) or GFP-SHKBP1 (F44A) was subcloned into the pCDH-CMV-MCS vector to yield the lentiviral plasmid. p62-related constructs were amplified from HA-p62, Addgene (28027), which was subcloned into the pEGFP-C1 vector (Clontech) using EcoRI and KpnI to generate GFP-p62 using primers: 5′-CCG​GAA​TTC​GAT​GGC​GTC​GCT​CAC​CGT​G-3′, 5′-CGG​GGT​ACC​TCA​CAA​CGG​CGG​GGG​ATG​CTT​TG-3′. Subsequently, truncations of p62 were generated by standard PCR, and inserts were cloned into the pEGFP-C1 vectors, using primers 5′-CCG​GAA​TTC​GAT​GAA​AGA​GTG​CCG​GCG​GGA​CCA​C-3′, 5′-CGG​GGT​ACC​TCA​TGG​CGG​GAG​ATG​TGG​GTA​CAA​GGC-3′. p62 mutations including K7D, R18D, 3D, 3A were generated using the QuikChange XL site–directed mutagenesis kit (Agilent), using primers: 5′-CGT​CGC​TCA​CCG​TGG​ATG​CCT​ACC​TTC​TGG​G-3′, 5′-CCC​AGA​AGG​TAG​GCA​TCC​ACG​GTG​AGC​GAC​G-3′, 5′-GGA​GGA​CGC​GGC​GGA​CGA​GAT​TCG​CCG​C-3′, 5′-GCG​GCG​AAT​CTC​GTC​CGC​CGC​GTC​CTC​C-3′, 5′-TGT​CCT​ACG​TGA​AGG​ATG​ACA​TCT​TCG​ACA​TCT​ACA​TTA​AAG​AGA​AAA​AAG​AGT​G-3′, 5′-CAC​TCT​TTT​TTC​TCT​TTA​ATG​TAG​ATG​TCG​AAG​ATG​TCA​TCC​TTC​ACG​TAG​GAC​A-3′, 5′-CTG​GAG​TTC​ACC​TGT​AGC​CGG​GTC​CAC​TTC​TTT​TG-3′, 5′-CAA​AAG​AAG​TGG​ACC​CGG​CTA​CAG​GTG​AAC​TCC​AG-3′, 5′-GAG​GAC​GCG​GCG​GCC​GAG​ATT​CGC​CG-3′, 5′-CGG​CGA​ATC​TCG​GCC​GCC​GCG​TCC​TC-3′, 5′-AAT​GGC​CAT​GTC​CTA​CGT​GAA​GGC​TGC​CAT​CTT​CGC​AAT​CTA​CAT​TAA​AGA​GAA​AAA​AGA-3′, 5′-TCT​TTT​TTC​TCT​TTA​ATG​TAG​ATT​GCG​AAG​ATG​GCA​GCC​TTC​ACG​TAG​GAC​ATG​GCC​ATT-3′, 5′-TGT​GCA​GAA​GTT​CCC​CTT​GGC​CAT​GGC​AGA​CAA​CGA​CCT​CCT​TGT​C-3′, 5′-GAC​AAG​GAG​GTC​GTT​GTC​TGC​CAT​GGC​CAA​GGG​GAA​CTT​CTG​CAC​A-3′.

Cell culture and transfection

Flp-In T-Rex HeLa (CVCL_C4ET; RRID, Thermo Fisher Scientific) and HEK293TN (Anthony Bretscher, Cornell University, Ithaca, NY) cells were cultured in high-glucose DMEM (Corning) supplemented with 10% FBS (Corning) and 1% penicillin/streptomycin (P/S, Corning) at 37°C in a 5% CO2 atmosphere. HEK293TN cells were also supplemented with 1% sodium pyruvate (Corning). An SHKBP1 KO stable cell line was generated by CRISPR/Cas9-mediated mutagenesis in Flp-In T-Rex HeLa cells. Stable expression of GFP-SHKBP1, 2UF, 2US, and GFP-SHKBP1F44A was achieved by lentiviral transduction as previously described (Cao et al., 2022), followed by selection with puromycin (Sigma-Aldrich) at 2 μg/ml or blasticidin (Alfa Aesar) at 50 μg/ml. Cell lines were used without further authentication, and Mycoplasma testing (MycoSensor PCR assay, Agilent) was performed yearly. Plasmid transfections were performed using Lipofectamine 2000 (Invitrogen) following the manufacturer’s protocol. Cells were incubated with the transfection mix in Transfectagro (Corning) or Opti-MEM (Gibco) with 10% FBS for 6-8 h, and then, the media were exchanged for regular growth medium.

IP and western blots

For all IP experiments except for those involving p62 endogenously tagged with split-mNG, cells were harvested and lysed in IP lysis buffer (150 mM NaCl, 1% NP-40, 0.25% sodium deoxycholate, 5 mM EDTA, 50 mM Tris, pH 7.5) supplemented with cOmplete protease inhibitor cocktail (Roche) on ice. Cell lysates were sonicated and centrifuged at 13,000 g for 5 min at 4°C. Protein concentration of the clarified cell lysates was quantified using the BCA assay (Thermo Fisher Scientific). Approximately 10% of the clarified cell lysates was reserved, normalized, and used as input whole-cell lysates (WCL). The rest was normalized and subjected to IP using anti-GFP or anti-FLAG or anti-HA beads with rotation at 4°C overnight (12–16 h). The beads were washed three times with lysis buffer before denaturation at 95°C for 5–10 min. WCL and IP samples were analyzed by SDS-PAGE and western blot, with detection by chemiluminescence using Clarity Western ECL Substrate (Bio-Rad), or by MS-based proteomics analysis as described in more detail below. For IP of endogenous proteins, the clarified cell lysates were incubated with primary antibodies or IgG control for 4 h at 4°C with rotation, followed by the addition of Protein G Sepharose (BioVision) and rotation at 4°C overnight. The resin was then centrifuged for 5 min at 1,000 g, washed three times with lysis buffer, denatured, and analyzed by SDS-PAGE and western blot.

For IP experiments of endogenous split-mNG–tagged p62, co-IP was performed as previously described (Cho et al., 2022). Briefly, HEK293T cells (CVCL_0063; RRID) with endogenously tagged mNG-p62 were transfected with a small amount of FLAG-tagged SHKBP1. Cells were lysed in buffer containing 50 mM HEPES-Na, pH 7.5, 150 mM KOAc, 5 mM NaCl, 2 mM MgOAc, 1 mM CaCl2, 15% glycerol, freshly supplemented with 1.5% digitonin and cOmplete protease inhibitor cocktail. After centrifugation at 1,800 g for 30 min at 4°C, clarified lysate was incubated with mNG-Trap (Bulldog Bio) for 3 h at 4°C with rotation, followed by washing with buffer containing 50 mM HEPES-Na, pH 7.5, 150 mM KOAc, 5 mM NaCl, 2 mM MgOAc, 1 mM CaCl2, 15% glycerol, and 0.1% digitonin.

For all western blots, proteins were transferred to nitrocellulose membranes (Amersham 10600004) for analysis. Chemiluminescent signals were detected using ChemiDoc MP Imaging System (Bio-Rad), and nonsaturated images were used for quantification.

Band intensities were measured in Fiji after background subtraction, and target proteins were normalized to tubulin or β-actin in the same lane.

SILAC labeling and MS-based proteomics analysis

For SILAC proteomics, the indicated cell lines were cultured in heavy or light SILAC DMEM (Thermo) supplemented with 10% dialyzed FBS (Corning) and 1% P/S for at least five passages to allow full labeling of cells before they were used in experiments. “Heavy” SILAC DMEM contained 13C6,15N2 L-lysine and 13C6,15N4 L-arginine. “Light” SILAC DMEM contained 12C6,14N2 L-lysine and 12C6,14N4 L-arginine. Samples for SILAC experiments were set up as follows: Experiment #1, GFP-SHKBP1WT +MLN4924 (heavy) and GFP-SHKBP1WT –MLN4924 (light); Experiment #2: 2×UBA-3×FLAG-SHKBP1 (heavy) and 2×UBA-3×FLAG (light); Experiment #3: GFP-SHKBP1F44A (heavy) and GFP-SHKBP1WT (light). Cells stably expressing the indicated construct were grown in the appropriate SILAC medium. For Experiment #1, cells were incubated with MLN4924 (10 µM) or vehicle for 16 h. For Experiment #2, cells were incubated with MG-132 (20 µM) for 2 h. Cells were collected, lysed in IP buffer, and normalized, and then, each pair of lysates from heavy and light cells within the same experiment was mixed together in a 1:1 ratio. Enrichment of GFP- or FLAG-tagged proteins was then performed by co-IP with GFP-Trap or anti-FLAG magnetic agarose as appropriate, as described above. Enriched proteins were eluted by denaturation at 95°C in elution buffer (2% SDS [wt/vol], 20% glycerol [vol/vol], 300 mM Tris-HCl [pH 6.8]), followed by methanol/chloroform precipitation, reconstitution and disulfide reduction in 6 M urea, 10 mm DTT, and 50 mM Tris-HCl (pH 8.0), and alkylation with iodoacetamide (40 mM) for 1 h. Samples were diluted in 50 mM Tris-HCl (pH 8.0), trypsinized overnight, desalted using a Sep-Pak C18 cartridge, lyophilized, reconstituted, and analyzed by nanoLC-ESI-MS/MS on an UltiMate 3000 RSLCnano–Orbitrap Fusion system (Thermo Fisher Scientific). Each experiment was run in triplicate, with samples prepared on different days and analyzed by nanoLC-ESI-MS/MS in series on the same day.

Confocal microscopy

Cells were seeded on 35-mm glass-bottom culture dishes or on 12-mm coverglass in 12-well plates and then subjected to either live-cell imaging or fixation 24–30 h after transfection for IF, respectively. Drug treatments including MG-132, MLN4924, and As(III) were performed right before harvest at the indicated concentrations and for the indicated times. For live-cell imaging, cells were incubated in imaging buffer (135 mM NaCl, 5 mM KCl, 20 mM HEPES, 1.8 mM CaCl2, 1 mM MgCl2, supplemented with 1 mg/ml glucose and 1 mg/ml BSA) during acquisition. For IF analysis, cells were fixed in 4% paraformaldehyde in PBS for 15–20 min, followed by permeabilization and blocking with 0.1% Triton X-100 and 5% BSA in PBS for 30 min. For nucleus protein Nrf2 staining, cells were first permeabilized in 0.5% Triton X-100 in PBS after fixation before blocking. Cells were subsequently incubated with primary antibodies diluted in blocking buffer for 1 h, then with Alexa Fluor–conjugated secondary antibodies diluted in blocking buffer for 1 h. All steps were performed at room temperature, and slides were stored at 4°C for long-term storage prior to imaging. Images were acquired via Zeiss Zen Blue 2.3 software on a Zeiss LSM 800 confocal laser scanning microscope equipped with 1.4 NA 40× and 1.4 NA 63× oil immersion objectives. Solid-state lasers (405, 488, 561, and 640 nm) were used to excite DAPI, EGFP/Alexa Fluor 488, mScarlet-i/Alexa Fluor 568, and miRFP, respectively. Endogenous protein staining, including p62 and Keap1, was acquired using Airyscan.

In vivo ubiquitination assays

Cells were transfected with His-Ubiquitin and other indicated constructs. 36 h after transfection, cells were harvested with PBS, and 10% of cells were reserved for WCL, which was generated by lysis in RIPA lysis buffer (150 mM NaCl, 25 mM Tris, pH 8.0, 1 mM EDTA, 1% Triton X-100, 0.5% sodium deoxycholate, and 0.1% SDS) supplemented with cOmplete protease inhibitor cocktail. The remaining 90% of cells were lysed in Buffer A (6 M guanidine-HCl, 0.1 M Na2HPO4/NaH2PO4, 10 mM imidazole, pH 8.0) by sonication and then incubated with equilibrated Ni-NTA-agarose (Qiagen) for 3 h at room temperature with agitation. The beads were washed once with Buffer A, then twice with Buffer B (10 mM Tris-Cl, pH 8.0, 8 M urea, 0.1 M NaH2PO4), and three times with a 1:4 dilution of Buffer B with an aqueous imidazole solution to a final concentration of 25 mM imidazole. The precipitate was resuspended in SDS loading buffer containing 200 mM imidazole, boiled at 95°C for 10 min, and analyzed by western blot.

DSP cross-linking

Cells at ∼80% confluence were washed twice with ice-cold washing buffer (10 mM Na2HPO4, 1.8 mM KH2PO4, 137 mM NaCl, 2.7 mM KCl, 0.1 mM CaCl2, and 1 mM MgCl2) and incubated in washing buffer containing 0.4 mg/ml DSP at 4°C for 2 h. After that, cells were lysed with IP lysis buffer (150 mM NaCl, 1% NP-40, 0.25% sodium deoxycholate, 5 mM EDTA, 50 mM Tris, pH 7.5) supplemented with 1% SDS. Lysates were clarified by centrifugation after a 30-min incubation on ice, and then, protein concentration was quantified using the BCA assay. Normalized WCL was then mixed with reducing or nonreducing loading buffer (i.e., with or without β-mercaptoethanol), denatured at 95°C for 5 min, and analyzed by western blot.

Fluorescence recovery after photobleaching

HeLa cells were transfected with GFP-p62 alone or in combination with mScarlet-i-SHKBP1. 24–30 h after transfection, cells were subjected to FRAP analysis, conducted on an LSM 800 (Zeiss) using the FRAP module of the ZEN software, with a 1.4 NA 40× oil immersion objective. Bleaching was focused on circular regions of interest encompassing entire individual GFP-p62 puncta, which were bleached for 8 times with an interval of 10 s using the 488-nm laser at 100% intensity. Recovery was recorded for 7 min using Definite Focus to maintain z-position. Fluorescence intensities were analyzed by FIJI using the FRAP profiler plugin.

Stable cell line generation

An endogenously tagged p62 stable HEK293T cell line was generated using CRISPR/Cas9-based knock-in of a split-mNG fluorescent protein, as reported by the OpenCell project (Cho et al., 2022). Here, CRISPR/Cas9-based mutagenesis and homology-directed repair were used to fuse the mNG11 fragment to the N terminus of p62 in cell lines stably expressing the nonfluorescent mNG1-10 fragment. FACS was performed to obtain a polyclonal population, followed by validation by confocal microscopy and western blot.

For generating stable SHKBP1 KO cell lines in HeLa cells and mNG-p62 stable HEK293T cells endogenously knocked in mNG-p62, we used CRISPR/Cas9-mediated genome editing. Specifically, we cloned the guide RNA targeting SHKBP1 into the pLentiCRISPRv2-Puro vector using the following forward primer 5′-CAC​CGC​AGC​GGC​TAC​TGC​AGC​CGA​G-3′ and reverse primer 5′-AAA​CCT​CGG​CTG​CAG​TAG​CCG​CTG​C-3′. Lentivirus particles were produced by cotransfection of HEK293TN cells seeded in a 35-mm dish with 0.25 µg of pCMV-VSV-G, 0.75 µg of psPAX2, and 1 µg of the pLentiCRISPRv2-SHKBP1-gRNA construct. HeLa and mNG-p62 HEK293T stable cells were transduced by incubation with lentivirus-containing medium for 24 h, followed by selection with puromycin at 5 μg/ml. After selection and amplification, western blot analysis confirmed the successful KO of SHKBP1.

Cytoplasmic and nuclear fractionation

Cells were resuspended in ice-cold cytosol lysis buffer (20 mM Tris-HCl, pH 7.4, 10 mM NaCl, 3 mM MgCl2) plus cOmplete protease inhibitors and incubated on ice for 30 min. NP-40 was then added to 0.5% (vol/vol), and the mixture was briefly vortexed and centrifuged at 4,000 g for 10 min at 4°C. The resulting supernatant was collected as the cytosol fraction. The precipitate was washed twice with cytosol lysis buffer, then resuspended in ice-cold RIPA buffer containing protease inhibitors. After incubated on ice for 10 min, the lysate was sonicated and centrifuged at 13,000 g for 15 min to obtain the nuclear fraction. Protein concentrations were determined by BCA assay.

Data processing, calculations, and statistics

All western blot images and confocal microscopy images shown in figures are representative images from experiments performed in at least three biological replicates on different days. For western blot quantification, band intensities were measured using FIJI. Statistical significance was calculated using one-way ANOVA or two-way ANOVA with Tukey’s multiple comparisons test in GraphPad Prism. For quantification of confocal microscopy images, fluorescence intensities and particle sizes were measured using FIJI. Single p62 bodies were tracked using the TrackMate plugin for FIJI (Tinevez et al., 2017). Time Interval was set to 0.51 s, estimated object diameter was set to 0.5 μm, and auto initial threshold of quality was used. Linking and gap closing max distance was set to 2 μm and max frame gap to 1. Statistical significance was calculated with unpaired two-tailed Student’s t test or one-way ANOVA or two-way ANOVA with Tukey’s multiple comparisons test as indicated. In figures containing bar graphs, each dot represents an individual biological replicate, the bar height represents the mean, and error bars represent the standard deviation. In figures containing scatter plots, each dot represents an image, the middle black line indicates the mean, and the top and bottom lines indicate the standard deviation. In figures containing box graphs, each dot represents an individual biological replicate or image. All experiments were in line with an approved Institutional Biosafety Committee protocol, and as no animal experiments were performed, no Institutional Animal Care and Use Committee protocol was relevant, and sex as a biological variable and subject demographics (e.g., age, weight) were not relevant parameters.

Online supplemental material

Fig. S1 shows preparation and verification of constructs and cell lines for proteomics studies. Fig. S2 shows intracellular localization of SHKBP1 and p62 truncations and mutants. Fig. S3 shows intracellular colocalization of p62 and LC3. Fig. S4 shows autophagy flux of Keap1, p62, and LC3. Fig. S5 shows expression level of SHKBP1 in disease models. Video 1 shows time-lapse confocal microscopy showing movement of endogenously tagged mNG-p62 in SHKBP1 KO cells. Video 2 shows time-lapse confocal microscopy showing movement of endogenously tagged mNG-p62 in WT cells. Video 3 shows time-lapse confocal microscopy showing movement of endogenously tagged mNG-p62 in SHKBP1-OE cells. Table S1 shows full datasets from proteomics experiments.

The data supporting the findings of this study are available within the published article and its online supplemental material.

We thank Sheng Zhang, Qin Fu, and Elizabeth Anderson from the Cornell Proteomics and Metabolomics Facility for performing SILAC proteomics studies. We thank Shun Enomoto, Jingyi Hu, Shiying Huang, Yizhen Jin, Adnan Shami Shah, and Hongyan Sun for technical assistance, the Fromme lab for access to equipment, and members of the Baskin lab for helpful discussions.

This work was supported by the National Institutes of Health (R01GM143367).

Author contributions: Lin Luan: conceptualization, data curation, formal analysis, investigation, methodology, project administration, resources, software, supervision, validation, visualization, and writing—original draft, review, and editing. Xiaofu Cao: conceptualization, data curation, and formal analysis. Zijun Xia: investigation and writing—review and editing. Shivanshi Vaid: resources. Manuel D. Leonetti: resources and supervision. Jeremy M. Baskin: conceptualization, funding acquisition, project administration, and writing—original draft, review, and editing.

Abramson
,
J.
,
J.
Adler
,
J.
Dunger
,
R.
Evans
,
T.
Green
,
A.
Pritzel
,
O.
Ronneberger
,
L.
Willmore
,
A.J.
Ballard
,
J.
Bambrick
, et al
.
2024
.
Accurate structure prediction of biomolecular interactions with AlphaFold 3
.
Nature
.
630
:
493
500
.
Alberti
,
S.
, and
D.
Dormann
.
2019
.
Liquid–liquid phase separation in disease
.
Annu. Rev. Genet.
53
:
171
194
.
Alberti
,
S.
,
A.
Gladfelter
, and
T.
Mittag
.
2019
.
Considerations and challenges in studying liquid-liquid phase separation and biomolecular condensates
.
Cell
.
176
:
419
434
.
Angrisani
,
A.
,
A.
Di Fiore
,
E.
De Smaele
, and
M.
Moretti
.
2021
.
The emerging role of the KCTD proteins in cancer
.
Cell Commun. Signal.
19
:
56
.
Baird
,
L.
, and
M.
Yamamoto
.
2020
.
The molecular mechanisms regulating the KEAP1-NRF2 pathway
.
Mol. Cell Biol.
40
:e00099-20.
Balasco
,
N.
,
L.
Esposito
,
G.
Smaldone
,
M.
Salvatore
, and
L.
Vitagliano
.
2024
.
A comprehensive analysis of the structural recognition between KCTD proteins and cullin 3
.
Int. J. Mol. Sci.
25
:
1881
.
Cao
,
X.
,
S.
Huang
,
M.M.
Wagner
,
Y.-T.
Cho
,
D.-C.
Chiu
,
K.M.
Wartchow
,
A.
Lazarian
,
L.B.
McIntire
,
M.B.
Smolka
, and
J.M.
Baskin
.
2024
.
A phosphorylation-controlled switch confers cell cycle-dependent protein relocalization
.
Nat. Cell Biol.
26
:
1804
1816
.
Cao
,
X.
,
A.
Shami Shah
,
E.J.
Sanford
,
M.B.
Smolka
, and
J.M.
Baskin
.
2022
.
Proximity labeling reveals spatial regulation of the anaphase-promoting complex/cyclosome by a microtubule adaptor
.
ACS Chem. Biol.
17
:
2605
2618
.
Cho
,
N.H.
,
K.C.
Cheveralls
,
A.-D.
Brunner
,
K.
Kim
,
A.C.
Michaelis
,
P.
Raghavan
,
H.
Kobayashi
,
L.
Savy
,
J.Y.
Li
,
H.
Canaj
, et al
.
2022
.
OpenCell: Endogenous tagging for the cartography of human cellular organization
.
Science
.
375
:eabi6983.
Ciuffa
,
R.
,
T.
Lamark
,
A.K.
Tarafder
,
A.
Guesdon
,
S.
Rybina
,
W.J.H.
Hagen
,
T.
Johansen
, and
C.
Sachse
.
2015
.
The selective autophagy receptor p62 forms a flexible filamentous helical scaffold
.
Cell Rep.
11
:
748
758
.
Errington
,
W.J.
,
M.Q.
Khan
,
S.A.
Bueler
,
J.L.
Rubinstein
,
A.
Chakrabartty
, and
G.G.
Privé
.
2012
.
Adaptor protein self-assembly drives the control of a cullin-RING ubiquitin ligase
.
Structure
.
20
:
1141
1153
.
Esposito
,
L.
,
N.
Balasco
,
G.
Smaldone
,
R.
Berisio
,
A.
Ruggiero
, and
L.
Vitagliano
.
2021
.
AlphaFold-Predicted structures of KCTD proteins unravel previously undetected relationships among the members of the family
.
Biomolecules
.
11
:
1862
.
Esposito
,
L.
,
N.
Balasco
, and
L.
Vitagliano
.
2022
.
Alphafold predictions provide insights into the structural features of the functional oligomers of all members of the KCTD family
.
Int. J. Mol. Sci.
23
:
13346
.
Fan
,
W.
,
Z.
Tang
,
D.
Chen
,
D.
Moughon
,
X.
Ding
,
S.
Chen
,
M.
Zhu
, and
Q.
Zhong
.
2010
.
Keap1 facilitates p62-mediated ubiquitin aggregate clearance via autophagy
.
Autophagy
.
6
:
614
621
.
Frendo-Cumbo
,
S.
,
J.R.
Jaldin-Fincati
,
E.
Coyaud
,
E.M.N.
Laurent
,
L.K.
Townsend
,
J.M.J.
Tan
,
R.J.
Xavier
,
N.J.
Pillon
,
B.
Raught
,
D.C.
Wright
, et al
.
2019
.
Deficiency of the autophagy gene ATG16L1 induces insulin resistance through KLHL9/KLHL13/CUL3-mediated IRS1 degradation
.
J. Biol. Chem.
294
:
16172
16185
.
Greif
,
P.A.
,
S.H.
Eck
,
N.P.
Konstandin
,
A.
Benet-Pagès
,
B.
Ksienzyk
,
A.
Dufour
,
A.T.
Vetter
,
H.D.
Popp
,
B.
Lorenz-Depiereux
,
T.
Meitinger
, et al
.
2011
.
Identification of recurring tumor-specific somatic mutations in acute myeloid leukemia by transcriptome sequencing
.
Leukemia
.
25
:
821
827
.
Heath
,
R.J.
,
G.
Goel
,
L.A.
Baxt
,
J.S.
Rush
,
V.
Mohanan
,
G.L.C.
Paulus
,
V.
Jani
,
K.G.
Lassen
, and
R.J.
Xavier
.
2016
.
RNF166 determines recruitment of adaptor proteins during antibacterial autophagy
.
Cell Rep.
17
:
2183
2194
.
Horos
,
R.
,
M.
Büscher
,
R.
Kleinendorst
,
A.-M.
Alleaume
,
A.K.
Tarafder
,
T.
Schwarzl
,
D.
Dziuba
,
C.
Tischer
,
E.M.
Zielonka
,
A.
Adak
, et al
.
2019
.
The small non-coding vault RNA1-1 acts as a riboregulator of autophagy
.
Cell
.
176
:
1054
1067.e12
.
Ichimura
,
Y.
,
T.
Kumanomidou
,
Y.
Sou
,
T.
Mizushima
,
J.
Ezaki
,
T.
Ueno
,
E.
Kominami
,
T.
Yamane
,
K.
Tanaka
, and
M.
Komatsu
.
2008
.
Structural basis for sorting mechanism of p62 in selective autophagy
.
J. Biol. Chem.
283
:
22847
22857
.
Ichimura
,
Y.
,
S.
Waguri
,
Y.-S.
Sou
,
S.
Kageyama
,
J.
Hasegawa
,
R.
Ishimura
,
T.
Saito
,
Y.
Yang
,
T.
Kouno
,
T.
Fukutomi
, et al
.
2013
.
Phosphorylation of p62 activates the Keap1-Nrf2 pathway during selective autophagy
.
Mol. Cell
.
51
:
618
631
.
Inami
,
Y.
,
S.
Waguri
,
A.
Sakamoto
,
T.
Kouno
,
K.
Nakada
,
O.
Hino
,
S.
Watanabe
,
J.
Ando
,
M.
Iwadate
,
M.
Yamamoto
, et al
.
2011
.
Persistent activation of Nrf2 through p62 in hepatocellular carcinoma cells
.
J. Cell Biol.
193
:
275
284
.
Jain
,
A.
,
T.
Lamark
,
E.
Sjøttem
,
K.B.
Larsen
,
J.A.
Awuh
,
A.
Øvervatn
,
M.
McMahon
,
J.D.
Hayes
, and
T.
Johansen
.
2010
.
p62/SQSTM1 is a target gene for transcription factor NRF2 and creates a positive feedback loop by inducing antioxidant response element-driven gene transcription
.
J. Biol. Chem.
285
:
22576
22591
.
Ji
,
A.X.
,
A.
Chu
,
T.K.
Nielsen
,
S.
Benlekbir
,
J.L.
Rubinstein
, and
G.G.
Privé
.
2016
.
Structural insights into KCTD protein assembly and cullin3 recognition
.
J. Mol. Biol.
428
:
92
107
.
Kageyama
,
S.
,
S.R.
Gudmundsson
,
Y.-S.
Sou
,
Y.
Ichimura
,
N.
Tamura
,
S.
Kazuno
,
T.
Ueno
,
Y.
Miura
,
D.
Noshiro
,
M.
Abe
, et al
.
2021
.
p62/SQSTM1-droplet serves as a platform for autophagosome formation and anti-oxidative stress response
.
Nat. Commun.
12
:
16
.
Kirkin
,
V.
,
D.G.
McEwan
,
I.
Novak
, and
I.
Dikic
.
2009
.
A role for ubiquitin in selective autophagy
.
Mol. Cell
.
34
:
259
269
.
Komatsu
,
M.
2022
.
p62 bodies: Phase separation, NRF2 activation, and selective autophagic degradation
.
IUBMB Life
.
74
:
1200
1208
.
Lau
,
A.
,
X.-J.
Wang
,
F.
Zhao
,
N.F.
Villeneuve
,
T.
Wu
,
T.
Jiang
,
Z.
Sun
,
E.
White
, and
D.D.
Zhang
.
2010
.
A noncanonical mechanism of Nrf2 activation by autophagy deficiency: Direct interaction between Keap1 and p62
.
Mol. Cell Biol.
30
:
3275
3285
.
Lau
,
A.
,
S.A.
Whitman
,
M.C.
Jaramillo
, and
D.D.
Zhang
.
2013
.
Arsenic-mediated activation of the Nrf2-Keap1 antioxidant pathway
.
J. Biochem. Mol. Toxicol.
27
:
99
105
.
Lee
,
Y.
,
T.-F.
Chou
,
S.K.
Pittman
,
A.L.
Keith
,
B.
Razani
, and
C.C.
Weihl
.
2017
.
Keap1/cullin3 modulates p62/SQSTM1 activity via UBA domain ubiquitination
.
Cell Rep.
19
:
188
202
.
Ma
,
S.
,
I.Y.
Attarwala
, and
X.-Q.
Xie
.
2019
.
SQSTM1/p62: A potential target for neurodegenerative disease
.
ACS Chem. Neurosci.
10
:
2094
2114
.
Matsumoto
,
G.
,
K.
Wada
,
M.
Okuno
,
M.
Kurosawa
, and
N.
Nukina
.
2011
.
Serine 403 phosphorylation of p62/SQSTM1 regulates selective autophagic clearance of ubiquitinated proteins
.
Mol. Cell
.
44
:
279
289
.
McGourty
,
C.A.
,
D.
Akopian
,
C.
Walsh
,
A.
Gorur
,
A.
Werner
,
R.
Schekman
,
D.
Bautista
, and
M.
Rape
.
2016
.
Regulation of the CUL3 ubiquitin ligase by a calcium-dependent co-adaptor
.
Cell
.
167
:
525
538.e14
.
Moscat
,
J.
,
M.
Karin
, and
M.T.
Diaz-Meco
.
2016
.
p62 in cancer: Signaling adaptor beyond autophagy
.
Cell
.
167
:
606
609
.
Pan
,
J.-A.
,
Y.
Sun
,
Y.-P.
Jiang
,
A.J.
Bott
,
N.
Jaber
,
Z.
Dou
,
B.
Yang
,
J.-S.
Chen
,
J.M.
Catanzaro
,
C.
Du
, et al
.
2016
.
TRIM21 ubiquitylates SQSTM1/p62 and suppresses protein sequestration to regulate redox homeostasis
.
Mol. Cell
.
61
:
720
733
.
Pankiv
,
S.
,
T.H.
Clausen
,
T.
Lamark
,
A.
Brech
,
J.-A.
Bruun
,
H.
Outzen
,
A.
Øvervatn
,
G.
Bjørkøy
, and
T.
Johansen
.
2007
.
p62/SQSTM1 binds directly to Atg8/LC3 to facilitate degradation of ubiquitinated protein aggregates by autophagy
.
J. Biol. Chem.
282
:
24131
24145
.
Pinkas
,
D.M.
,
C.E.
Sanvitale
,
J.C.
Bufton
,
F.J.
Sorrell
,
N.
Solcan
,
R.
Chalk
,
J.
Doutch
, and
A.N.
Bullock
.
2017
.
Structural complexity in the KCTD family of cullin3-dependent E3 ubiquitin ligases
.
Biochem. J.
474
:
3747
3761
.
Pohl
,
C.
, and
I.
Dikic
.
2019
.
Cellular quality control by the ubiquitin-proteasome system and autophagy
.
Science
.
366
:
818
822
.
Rubinsztein
,
D.C.
2006
.
The roles of intracellular protein-degradation pathways in neurodegeneration
.
Nature
.
443
:
780
786
.
Saito
,
T.
,
Y.
Ichimura
,
K.
Taguchi
,
T.
Suzuki
,
T.
Mizushima
,
K.
Takagi
,
Y.
Hirose
,
M.
Nagahashi
,
T.
Iso
,
T.
Fukutomi
, et al
.
2016
.
p62/Sqstm1 promotes malignancy of HCV-positive hepatocellular carcinoma through Nrf2-dependent metabolic reprogramming
.
Nat. Commun.
7
:
12030
.
Shami Shah
,
A.
,
A.G.
Batrouni
,
D.
Kim
,
A.
Punyala
,
W.
Cao
,
C.
Han
,
M.L.
Goldberg
,
M.B.
Smolka
, and
J.M.
Baskin
.
2019
.
PLEKHA4/kramer attenuates dishevelled ubiquitination to modulate wnt and planar cell polarity signaling
.
Cell Rep.
27
:
2157
2170.e8
.
Shami Shah
,
A.
,
X.
Cao
,
A.C.
White
, and
J.M.
Baskin
.
2021
.
PLEKHA4 promotes Wnt/β-Catenin signaling–mediated G1–S transition and proliferation in melanoma
.
Cancer Res.
81
:
2029
2043
.
Shi
,
Q.
,
X.
Jin
,
P.
Zhang
,
Q.
Li
,
Z.
Lv
,
Y.
Ding
,
H.
He
,
Y.
Wang
,
Y.
He
,
X.
Zhao
, et al
.
2022
.
SPOP mutations promote p62/SQSTM1-dependent autophagy and Nrf2 activation in prostate cancer
.
Cell Death Differ.
29
:
1228
1239
.
Shin
,
Y.
, and
C.P.
Brangwynne
.
2017
.
Liquid phase condensation in cell physiology and disease
.
Science
.
357
:eaaf4382.
Song
,
P.
,
S.
Li
,
H.
Wu
,
R.
Gao
,
G.
Rao
,
D.
Wang
,
Z.
Chen
,
B.
Ma
,
H.
Wang
,
N.
Sui
, et al
.
2016
.
Parkin promotes proteasomal degradation of p62: Implication of selective vulnerability of neuronal cells in the pathogenesis of Parkinson’s disease
.
Protein Cell
.
7
:
114
129
.
Sumara
,
I.
,
M.
Quadroni
,
C.
Frei
,
M.H.
Olma
,
G.
Sumara
,
R.
Ricci
, and
M.
Peter
.
2007
.
A Cul3-Based E3 ligase removes Aurora B from mitotic chromosomes, regulating mitotic progression and completion of cytokinesis in human cells
.
Dev. Cell
.
12
:
887
900
.
Sun
,
D.
,
R.
Wu
,
J.
Zheng
,
P.
Li
, and
L.
Yu
.
2018
.
Polyubiquitin chain-induced p62 phase separation drives autophagic cargo segregation
.
Cell Res.
28
:
405
415
.
Sun
,
H.
,
A.S.
Shah
,
D.-C.
Chiu
,
A.
Bonfini
,
N.
Buchon
, and
J.M.
Baskin
.
2024
.
Wnt/β-catenin signaling within multiple cell types dependent upon kramer regulates Drosophila intestinal stem cell proliferation
.
iScience
.
27
:
110113
.
Tan
,
C.T.
,
H.
Chang
,
Q.
Zhou
,
C.
Yu
,
N.Y.
Fu
,
K.
Sabapathy
, and
V.C.
Yu
.
2021
.
MOAP‐1‐mediated dissociation of p62/SQSTM1 bodies releases Keap1 and suppresses Nrf2 signaling
.
EMBO Rep.
22
:e50854.
Tan
,
M.-K.M.
,
H.-J.
Lim
,
E.J.
Bennett
,
Y.
Shi
, and
J.W.
Harper
.
2013
.
Parallel SCF adaptor capture proteomics reveals a role for SCFFBXL17 in NRF2 activation via BACH1 repressor turnover
.
Mol. Cell
.
52
:
9
24
.
The Cancer Genome Atlas Research Network
.
2017
.
Integrated genomic and molecular characterization of cervical cancer
.
Nature
.
543
:
378
384
.
Tinevez
,
J.-Y.
,
N.
Perry
,
J.
Schindelin
,
G.M.
Hoopes
,
G.D.
Reynolds
,
E.
Laplantine
,
S.Y.
Bednarek
,
S.L.
Shorte
, and
K.W.
Eliceiri
.
2017
.
TrackMate: An open and extensible platform for single-particle tracking
.
Methods
.
115
:
80
90
.
Tong
,
K.I.
,
Y.
Katoh
,
H.
Kusunoki
,
K.
Itoh
,
T.
Tanaka
, and
M.
Yamamoto
.
2006
.
Keap1 recruits Neh2 through binding to ETGE and DLG motifs: Characterization of the two-site molecular recognition model
.
Mol. Cell Biol.
26
:
2887
2900
.
Wang
,
P.
,
J.
Song
, and
D.
Ye
.
2020
.
CRL3s: The BTB-CUL3-RING E3 ubiquitin ligases
. In
Cullin-RING Ligases and Protein Neddylation: Biology and Therapeutics
.
Y.
Sun
,
W.
Wei
, and
J.
Jin
, editors.
Springer
,
Singapore
.
211
223
.
Watanabe
,
M.
,
Y.
Saeki
,
H.
Takahashi
,
F.
Ohtake
,
Y.
Yoshida
,
Y.
Kasuga
,
T.
Kondo
,
H.
Yaguchi
,
M.
Suzuki
,
H.
Ishida
, et al
.
2020
.
A substrate-trapping strategy to find E3 ubiquitin ligase substrates identifies Parkin and TRIM28 targets
.
Commun. Biol.
3
:
592
.
Werner
,
A.
,
S.
Iwasaki
,
C.A.
McGourty
,
S.
Medina-Ruiz
,
N.
Teerikorpi
,
I.
Fedrigo
,
N.T.
Ingolia
, and
M.
Rape
.
2015
.
Cell-fate determination by ubiquitin-dependent regulation of translation
.
Nature
.
525
:
523
527
.
Wilson
,
M.I.
,
D.J.
Gill
,
O.
Perisic
,
M.T.
Quinn
, and
R.L.
Williams
.
2003
.
PB1 domain-mediated heterodimerization in NADPH oxidase and signaling complexes of atypical protein kinase C with Par6 and p62
.
Mol. Cell
.
12
:
39
50
.
Xia
,
Q.
,
Y.
Li
,
W.
Xu
,
C.
Wu
,
H.
Zheng
,
L.
Liu
, and
L.
Dong
.
2023
.
Enhanced liquidity of p62 droplets mediated by Smurf1 links Nrf2 activation and autophagy
.
Cell Biosci.
13
:
37
.
Yang
,
Y.
,
T.L.
Willis
,
R.W.
Button
,
C.J.
Strang
,
Y.
Fu
,
X.
Wen
,
P.R.C.
Grayson
,
T.
Evans
,
R.J.
Sipthorpe
,
S.L.
Roberts
, et al
.
2019
.
Cytoplasmic DAXX drives SQSTM1/p62 phase condensation to activate Nrf2-mediated stress response
.
Nat. Commun.
10
:
3759
.
Zaffagnini
,
G.
,
A.
Savova
,
A.
Danieli
,
J.
Romanov
,
S.
Tremel
,
M.
Ebner
,
T.
Peterbauer
,
M.
Sztacho
,
R.
Trapannone
,
A.K.
Tarafder
, et al
.
2018
.
p62 filaments capture and present ubiquitinated cargos for autophagy
.
EMBO J.
37
:e98308.
Zheng
,
J.
,
X.
Yang
,
J.M.
Harrell
,
S.
Ryzhikov
,
E.H.
Shim
,
K.
Lykke-Andersen
,
N.
Wei
,
H.
Sun
,
R.
Kobayashi
, and
H.
Zhang
.
2002
.
CAND1 binds to unneddylated CUL1 and regulates the formation of SCF ubiquitin E3 ligase complex
.
Mol. Cell
.
10
:
1519
1526
.

Author notes

*

X. Cao and Z. Xia contributed equally to this paper.

Disclosures: The authors declare no competing interests exist.

This article is distributed under the terms as described at https://rupress.org/pages/terms102024/.

Data & Figures

Figure 1.

Quantitative affinity proteomics identifies SQSTM1/p62 as an interaction partner of the CUL3 adaptor SHKBP1. (A) Workflow of the first set of proteomics experiments using the neddylation inhibitor MLN4924 to enrich unstable CRL targets (left) and cartoon representation of drug treatment mechanism (right). Cells were treated with MLN4924 (10 μM) or vehicle for 16 h. (B) Workflow of the second set of proteomics experiments using tandem UBA domain fusions to SHKBP1 to enrich ubiquitinated substrates (left) and model of ligase trap (right). Cells stably expressing the corresponding construct were treated with MG-132 (20 μM) for 2 h. (C) Workflow of the third set of proteomics experiments using the SHKBP1F44A CUL3 binding–deficient mutant to reduce CRL complex components in IP compared with SHKBP1WT (left) and corresponding model (right). (D–F) Volcano plots from the three SILAC MS proteomics experiments, showing log2 (fold changes of protein abundance in heavy/light samples) vs. statistical significance (–log10 [P value]). Proteins whose change was below the cutoff (fold change < 1.2) are indicated in gray. Those above the cutoff with P values above 0.05 are shown in green, and those with P values below 0.05 are shown in purple.

Close modal
+ Expand view− Collapse view
Figure S1
Figure S1. Refer to the image caption for details.

Preparation and verification of constructs and cell lines for proteomics studies. (A) Western blot analysis of whole-cell lysates (WCL) and immunoprecipitates from HeLa cells stably expressing ligase-trap constructs, showing that proteins were significantly enriched in α-FLAG IP. 2UF, 2×UBA-3×FLAG; 2US, 2×UBA-3×FLAG-SHKBP1. (B) Immunofluorescence (IF) of cell lines stably expressing ligase-trap constructs shown at low and high magnification. Cells were fixed, stained with α-FLAG (green) and DAPI (magenta), and imaged by confocal microscopy. Scale bars: 50 μm (first and third rows), 20 μm (second and fourth rows). (C) Western blot analysis of α-GFP IP from HeLa cells transfected with GFP-only or GFP-tagged versions of SHKBP1WT or SHKBP1F44A. (D) Confocal microscopy of HeLa cells stably expressing GFP-tagged SHKBP1WT or SHKBP1F44A. Scale bars: 50 μm (top row), 20 μm (bottom row). (E and F) Western blot analysis of co-IP experiments for HA-SHKBP1 and GFP-tagged hits from proteomics studies to demonstrate the interaction between SHKBP1 and other BTB-containing proteins (E) and substrate candidates (F). SHK, SHKBP1; KCT, KCTD3. Source data are available for this figure: SourceData FS1.

Figure S1.

Preparation and verification of constructs and cell lines for proteomics studies. (A) Western blot analysis of whole-cell lysates (WCL) and immunoprecipitates from HeLa cells stably expressing ligase-trap constructs, showing that proteins were significantly enriched in α-FLAG IP. 2UF, 2×UBA-3×FLAG; 2US, 2×UBA-3×FLAG-SHKBP1. (B) Immunofluorescence (IF) of cell lines stably expressing ligase-trap constructs shown at low and high magnification. Cells were fixed, stained with α-FLAG (green) and DAPI (magenta), and imaged by confocal microscopy. Scale bars: 50 μm (first and third rows), 20 μm (second and fourth rows). (C) Western blot analysis of α-GFP IP from HeLa cells transfected with GFP-only or GFP-tagged versions of SHKBP1WT or SHKBP1F44A. (D) Confocal microscopy of HeLa cells stably expressing GFP-tagged SHKBP1WT or SHKBP1F44A. Scale bars: 50 μm (top row), 20 μm (bottom row). (E and F) Western blot analysis of co-IP experiments for HA-SHKBP1 and GFP-tagged hits from proteomics studies to demonstrate the interaction between SHKBP1 and other BTB-containing proteins (E) and substrate candidates (F). SHK, SHKBP1; KCT, KCTD3. Source data are available for this figure: SourceData FS1.

Close modal
Figure 2.

SHKBP1 interacts with p62 under resting conditions and upon blockade of neddylation and proteasomal degradation. (A) Western blot analysis of whole-cell lysates (WCL) and α-GFP immunoprecipitates from HeLa cells cotransfected with HA-p62 and GFP-SHKBP1 or GFP EV as a control. (B) Western blot analysis of WCL and α-GFP IP from HeLa cells cotransfected with GFP-p62 and HA-SHKBP1 or HA EV as a control. (C and D) Western blot analysis of WCL and α-GFP IP to assess the interaction between SHKBP1 and exogenous (C) or endogenous p62 (D). HeLa cells were transfected with GFP-SHKBP1 in combination with HA-p62 (C) or alone (D), and treated with DMSO or the proteasome inhibitor MG-132 (20 μM) for 2 h or MLN4924 (10 μM) for 16 h. (E) HeLa cells were cotransfected with GFP-p62 and mScarlet-i-SHKBP1, treated with DMSO or the proteasome inhibitor MG-132 (20 μM) for 2 h or MLN4924 (10 μM) for 16 h, and then observed under confocal microscope 24 h after transfection. Scale bars: 10 μm. EV, empty vector. Source data are available for this figure: SourceData F2.

Close modal
Figure 3.

WD domain of SHKBP1 interacts with the PB1 domain of p62. (A) Domain map of SHKBP1 and truncations used in this paper. (B) Representative live-cell images showing localization of full-length (FL) and truncated forms of SHKBP1. HeLa cells were transfected with the indicated GFP-tagged SHKBP1 construct and observed by confocal microscopy 24 h after transfection. Scale bars: 10 μm. (C) Western blot analysis of α-GFP IP of lysates from HeLa cells cotransfected with HA-CUL3 and either the indicated GFP-SHKBP1 truncation or GFP EV as a control. (D) Western blot analysis of α-GFP IP of lysates from HeLa cells cotransfected with HA-p62 and either the indicated GFP-SHKBP1 truncation or GFP EV as a control. (E) Domain map of p62 and truncations used in this paper. (F) Representative live-cell images showing localization of p62 truncations. HeLa cells were transfected with the indicated GFP-tagged p62 construct and observed by confocal microscopy 24 h after transfection. Scale bars: 10 μm. (G) Western blot analysis of α-GFP IP of lysates from HeLa cells cotransfected with HA-SHKBP1 and the indicated GFP-p62 construct. (H) AlphaFold 3 structural prediction of the interaction between SHKBP1-WD domain (magenta) and p62 (green). Electrostatic interactions (blue) indicated between p62 residues K7, R18, D92, D93, and R96 and SHKBP1 residues R357, K359, D360, D362, and E367 (pink), respectively. ipTM = 0.73, pTM = 0.54. (I) Western blot analysis of α-GFP IP of lysates from HeLa cells cotransfected with the indicated FLAG-SHKBP1 and GFP-p62 constructs. (J) Quantification of FLAG-SHKBP1 from GFP IP samples to assess the strength of interaction between p62 and SHKBP1, with band intensities normalized to FLAG-SHKBP1 levels in whole-cell lysate (WCL) and to GFP-p62 levels in IP (n = 3). Exact P values (****P < 0.0001) indicated from two-way ANOVA with Tukey’s post hoc test. (K) Representative live-cell images showing localization of p62 point mutants. HeLa cells were transfected with the indicated GFP-tagged p62 construct and observed by confocal microscopy 24 h after transfection. Scale bars: 10 μm. EV, empty vector; FL, full-length. Source data are available for this figure: SourceData F3.

Close modal
+ Expand view − Collapse view
Figure S2
Figure S2. Refer to the image caption for details.

Intracellular localization of SHKBP1 and p62 truncations and mutants. (A) Confocal microscopy analysis of HeLa cells cotransfected with mScarlet-i-p62 (magenta) and the indicated GFP-SHKBP1 construct (green). (B) Confocal microscopy analysis of HeLa cells cotransfected with mScarlet-i-SHKBP1 (magenta) and the indicated GFP-p62 construct (green). (C) Confocal microscopy analysis of HeLa cells cotransfected with mScarlet-i-SHKBP1 (magenta) and the indicated GFP-p62 construct (green). Scale bars: 10 μm.

Figure S2.

Intracellular localization of SHKBP1 and p62 truncations and mutants. (A) Confocal microscopy analysis of HeLa cells cotransfected with mScarlet-i-p62 (magenta) and the indicated GFP-SHKBP1 construct (green). (B) Confocal microscopy analysis of HeLa cells cotransfected with mScarlet-i-SHKBP1 (magenta) and the indicated GFP-p62 construct (green). (C) Confocal microscopy analysis of HeLa cells cotransfected with mScarlet-i-SHKBP1 (magenta) and the indicated GFP-p62 construct (green). Scale bars: 10 μm.

Close modal
Figure 4.

SHKBP1 inhibits p62 oligomerization without affecting its ubiquitination state. (A) Western blot analysis of in vivo ubiquitination assay. WT or SHKBP1 KO HeLa cells were cotransfected with His-ubiquitin and either GFP-p62 or GFP EV, and OE group represents WT cells that were also cotransfected with FLAG-SHKBP1. 24 h after transfection, cells were treated with MG-132 (20 μM) for 2 h and subjected to His pull-down using Ni-NTA agarose and western blot. (B) Western blot analysis of whole-cell lysates (WCL) from WT, SHKBP1 KO, and FLAG-SHKBP1–OE HeLa cells. (C) Representative live-cell images showing p62 body formation. WT or SHKBP1 KO HeLa cells were transfected with GFP-p62 either alone (left) or in combination with mScarlet-i-SHKBP1 (right, where OE refers to SHKBP1 OE in WT cells, and RE (rescue) refers to SHKBP1 OE in KO cells) and imaged using confocal microscopy 24 h after transfection. Scale bars: 20 μm. (D) Quantification of the average p62 body size of images shown in (C) from three independently plated samples. n = 51 (KO), 43 (WT), 37 (OE), and 35 (RE). Exact P values indicated (****P < 0.0001) from one-way ANOVA with Tukey’s post hoc test. (E) Western blot analysis of WCL from WT or SHKBP1 KO HeLa cells after DSP cross-linking. Cells were treated with MG-132 (0.5 μM) for 12 h, cross-linked with 0.4 mg/ml DSP at 4°C for 2 h, and lysed in IP lysis buffer with 1% SDS. The lysates were mixed with reducing or nonreducing loading buffer (i.e., with or without β-mercaptoethanol) and were analyzed by western blot. (F) Quantification of the ratio of intensities of monomeric to total p62. Intensities were normalized to the WT without the MG-132 treatment group. n = 6. Exact P values indicated (****P < 0.0001) from two-way ANOVA. EV, empty vector.

Close modal
+ Expand view − Collapse view
Figure S3
Figure S3. Refer to the image caption for details.

Intracellular colocalization of p62 and LC3. (A) Confocal microscopy analysis of WT, SHKBP1 KO, and OE HeLa cells cotransfected with GFP-p62 (green) and mScarlet-i-LC3 (magenta) with DMSO or BafA1 treatment. Scale bars: 10 μm. (B) Quantification of colocalization between Keap1 and p62. n = 6 images from three independently plated samples. Statistical analysis from two-way ANOVA with Tukey’s post hoc test.

Figure S3.

Intracellular colocalization of p62 and LC3. (A) Confocal microscopy analysis of WT, SHKBP1 KO, and OE HeLa cells cotransfected with GFP-p62 (green) and mScarlet-i-LC3 (magenta) with DMSO or BafA1 treatment. Scale bars: 10 μm. (B) Quantification of colocalization between Keap1 and p62. n = 6 images from three independently plated samples. Statistical analysis from two-way ANOVA with Tukey’s post hoc test.

Close modal
Figure 5.

SHKBP1 decreases the fluidity of cellular p62 bodies. (A) WT and SHKBP1 KO HeLa cells were transfected with GFP-p62 alone or in combination with mScarlet-i-SHKBP1. 24 h later, cells were subjected to live-cell imaging by confocal microscopy and analysis by FRAP. Shown is a representative image for each condition. A prebleach image is provided along with a time course of postbleach images (postbleach time indicated in min). Scale bars: 2 μm. (B) Quantification of the fluorescence recovery rates of GFP-p62 from FRAP experiments. Data were analyzed with GraphPad Prism using nonlinear regression (curve fit), shown as mean ± standard deviation (SD). n = 3 for each group from three independent experiments. (C) Quantification of the half-life of fluorescence recovery of GFP-p62 from FRAP experiments. n = 20 for each group from three independent experiments. Exact P values indicated from one-way ANOVA with Tukey’s post hoc test. (D) Western blot analysis of the whole-cell lysates (WCL) from three HEK293T cell lines stably expressing endogenously tagged p62 using mNG: SHKBP1 WT, SHKBP1 KO, and SHKBP1 WT with transient overexpression (OE) of a large amount of FLAG-SHKBP1. The hollow arrowhead indicates the FLAG-SHKBP1, and the solid arrowhead indicates untagged (endogenous) SHKBP1. (E) Western blot analysis of WCL, FT, and anti-mNeonGreen IP to assess the interaction between SHKBP1 and endogenously tagged p62 in a HEK293T cell line stably expressing mNG-p62 and transfected with a small amount of FLAG-SHKBP1. For the p62 blot, asterisks denote background bands from p62 antibody and the solid arrowhead indicates mNG11-tagged p62. For the SHKBP1 blot, hollow arrowhead indicates the FLAG-SHKBP1, and the solid arrowhead indicates untagged (endogenous) SHKBP1. FT, flow-through. (F) Representative live-cell images showing single particle tracking of endogenous mNG-p62 by confocal microscopy. HEK293T cell lines stably expressing mNG-p62 were transfected with either mScarlet-i (in both SHKBP1 KO and SHKBP1 WT backgrounds) or mScarlet-i-SHKBP1 (in SHKBP1 WT background, “OE”). Tracked p62 bodies are indicated by magenta circles, and movement tracks are shown by colored lines. Scale bars: 5 μm. (G) Quantification of the mean speed of tracked p62 bodies in SHKBP1 KO, WT, and OE conditions. n = 200–300 p62 bodies collected from three independently plated samples. Exact P values indicated from one-way ANOVA with Tukey’s post hoc test. (H) Representative live-cell images showing endogenous p62 body shapes. HEK293T stable cell lines were transfected with the indicated mScarlet-i constructs and observed by confocal microscopy 24 h after transfection. Scale bars: 5 μm. (I–L) Quantification of mNG-p62 body roundness, solidity, circularity, and aspect ratio. n = 1,000–1,300 p62 bodies collected from three independently plated samples. Exact P values indicated from one-way ANOVA with Tukey’s post hoc test. Source data are available for this figure: SourceData F5.

Close modal
Video 1.

Time-lapse confocal microscopy showing movement of endogenously tagged mNG-p62 in SHKBP1 KO cells. An SHKBP1 KO HEK293T cell line stably expressing mNG-p62 was transfected with mScarlet-i. Each tracked particle in the mNG fluorescence channel was outlined by a magenta circle, with its trajectory shown as a colored line. Frames were collected every 0.51 s. Video playback is 10 frames per second. Corresponding still image is shown in Fig. 5 F (left). Scale bar: 5 µm.

Close modal
Video 2.

Time-lapse confocal microscopy showing movement of endogenously tagged mNG-p62 in WT cells. An HEK293T cell line stably expressing mNG-p62 was transfected with mScarlet-i. Each tracked particle in the mNG fluorescence channel was outlined by a magenta circle, with its trajectory shown as a colored line. Frames were collected every 0.51 s. Video playback is 10 frames per second. Corresponding still image is shown in Fig. 5 F (middle). Scale bar: 5 µm.

Close modal
Video 3.

Time-lapse confocal microscopy showing movement of endogenously tagged mNG-p62 in SHKBP1-OE cells. An HEK293T cell line stably expressing mNG-p62 was transfected with mScarlet-i-SHKBP1. Each tracked particle in the mNG fluorescence channel was outlined by a magenta circle, with its trajectory shown as a colored line. Frames were collected every 0.51 s. Video playback is 10 frames per second. Corresponding still image is shown in Fig. 5 F (right). Scale bar: 5 µm.

Close modal
Figure 6.

SHKBP1 inhibits Keap1 aggregation and clearance via p62 bodies. (A) Western blot analysis of co-IP experiments for endogenous p62. Lysates were from WT HeLa cells, SHKBP1 KO HeLa cells, and HeLa cells transfected with mScarlet-i-SHKBP1 (OE). (B) Quantification of Keap1 from p62-IP to demonstrate the interaction between endogenous p62 and Keap1, with band intensities normalized to actin levels (n = 3). Exact P values indicated from one-way ANOVA with Tukey’s post hoc test. (C) Western blot analysis of whole-cell lysates (WCL) from WT and SHKBP1 KO HeLa cells treated with As(III) (10 µM) for the indicated times. (D) Quantification of Keap1 protein levels, with band intensities normalized to actin levels (n = 5). Exact P values indicated (****P < 0.0001) from two-way ANOVA. (E) Confocal microscopy analysis of WT and KO SHKBP1 HeLa cells cotransfected with GFP-p62 and miRFP-Keap1 and treated with As(III) (10 µM) for 4 h or with DMSO as a control. Scale bars: 20 μm. (F and G) Quantification of Keap1 aggregate size (F) and p62 body size (G) in WT and SHKBP1 KO HeLa cells after As(III) treatment (representative images shown in 6E). n = 11 images from three independently plated samples. Exact P values indicated from unpaired two-tailed Student’s t test. (H) Confocal microscopy analysis of HeLa cells cotransfected with GFP-p62 and miRFP-Keap1, with or without mScarlet-i-SHKBP1, and treated with As(III) (10 µM) for 4 h or with DMSO as a control. Scale bars: 20 μm. (I and J) Quantification of p62 body size (I) and the percentage of cells containing Keap1 aggregates (J) in control of SHKBP1-OE HeLa cells with or without As(III) treatment (representative images shown in 6H). n = 8–12 images from three independently plated samples. Exact P values indicated from two-way ANOVA. (K) Immunofluorescence (IF) analysis of endogenous p62 and Keap1 in WT and SHKBP1 KO HeLa cells by confocal microscopy. Cells were treated with As(III) (10 µM) for indicated times. Scale bars: 10 μm; 5 μm (zoomed-in images). (L–N) Quantification of Keap1 aggregate size (L), p62 body size (M), and colocalization of Keap1 and p62 (N) in WT and SHKBP1 KO HeLa cells with As(III) treatment for the indicated times (representative images shown in 6K). n = 13–18 images from three independently plated samples. Exact P values indicated (****P < 0.0001) from two-way ANOVA with Tukey’s post hoc test. Source data are available for this figure: SourceData F6.

Close modal
+ Expand view− Collapse view
Figure S4
Figure S4. Refer to the image caption for details.

Autophagy flux of Keap1, p62, and LC3. (A) Western blot analysis of whole-cell lysates (WCL) from WT, SHKBP1 KO, and FLAG-SHKBP1–OE HeLa cells treated with As(III) (10 µM) and BafA1 (100 nM) for 0 or 6 h. (B–D) Quantification of Keap1, p62, and LC3-II to demonstrate the turnover of endogenous p62, Keap1, and LC3-II, with band intensities normalized to actin levels (n = 3). Exact P values indicated from two-way ANOVA with Tukey’s post hoc test. Source data are available for this figure: SourceData FS4.

Figure S4.

Autophagy flux of Keap1, p62, and LC3. (A) Western blot analysis of whole-cell lysates (WCL) from WT, SHKBP1 KO, and FLAG-SHKBP1–OE HeLa cells treated with As(III) (10 µM) and BafA1 (100 nM) for 0 or 6 h. (B–D) Quantification of Keap1, p62, and LC3-II to demonstrate the turnover of endogenous p62, Keap1, and LC3-II, with band intensities normalized to actin levels (n = 3). Exact P values indicated from two-way ANOVA with Tukey’s post hoc test. Source data are available for this figure: SourceData FS4.

Close modal
Figure 7.

SHKBP1 KO enhances Nrf2 nuclear translocation. (A) IF analysis of endogenous Nrf2 in WT and SHKBP1 KO HeLa cells by confocal microscopy. Nuclei were stained with DAPI (magenta). Cells were treated with As(III) (10 µM) for the indicated times. Scale bars: 15 μm. (B) Quantification of nuclear levels of Nrf2 in WT and SHKBP1 KO HeLa cells with As(III) treatment for the indicated times (representative images shown in (A)). n = 9 images each including ∼30 cells from three independently plated samples. Exact P values indicated (****P < 0.0001) from two-way ANOVA with Tukey’s post hoc test. (C) Western blot analysis of cytosolic and nuclear fractions from WT and SHKBP1 KO HeLa cells treated with As(III) (10 µM) for the indicated times. Tubulin and Histone H3 are used to qualitatively assess the purity of each fraction. (D) Quantification of nuclear Nrf2 protein levels, with band intensities normalized to Histone H3 levels (n = 3). Exact P values indicated from two-way ANOVA. (E) Role of SHKBP1 in the p62-Keap1-Nrf2 pathway. Source data are available for this figure: SourceData F7.

Close modal
+ Expand view − Collapse view
Figure S5
Figure S5. Refer to the image caption for details.

Expression level of SHKBP1 in disease models. (A) SHKBP1 mRNA levels in TRIM24-deficient hepatocellular carcinoma tumors. n = 5. Exact P values indicated from unpaired two-tailed Student’s t test. (B) SHKBP1 mRNA levels in Parkinson’s disease: medial substantia nigra (HG-U133B). n = 9 (control) and 16 (disease). Exact P values indicated from unpaired two-tailed Student’s t test. Primary data were obtained from NCBI Gene Expression Omnibus repository.

Figure S5.

Expression level of SHKBP1 in disease models. (A) SHKBP1 mRNA levels in TRIM24-deficient hepatocellular carcinoma tumors. n = 5. Exact P values indicated from unpaired two-tailed Student’s t test. (B) SHKBP1 mRNA levels in Parkinson’s disease: medial substantia nigra (HG-U133B). n = 9 (control) and 16 (disease). Exact P values indicated from unpaired two-tailed Student’s t test. Primary data were obtained from NCBI Gene Expression Omnibus repository.

Close modal

References

Abramson
,
J.
,
J.
Adler
,
J.
Dunger
,
R.
Evans
,
T.
Green
,
A.
Pritzel
,
O.
Ronneberger
,
L.
Willmore
,
A.J.
Ballard
,
J.
Bambrick
, et al
.
2024
.
Accurate structure prediction of biomolecular interactions with AlphaFold 3
.
Nature
.
630
:
493
500
.
Alberti
,
S.
, and
D.
Dormann
.
2019
.
Liquid–liquid phase separation in disease
.
Annu. Rev. Genet.
53
:
171
194
.
Alberti
,
S.
,
A.
Gladfelter
, and
T.
Mittag
.
2019
.
Considerations and challenges in studying liquid-liquid phase separation and biomolecular condensates
.
Cell
.
176
:
419
434
.
Angrisani
,
A.
,
A.
Di Fiore
,
E.
De Smaele
, and
M.
Moretti
.
2021
.
The emerging role of the KCTD proteins in cancer
.
Cell Commun. Signal.
19
:
56
.
Baird
,
L.
, and
M.
Yamamoto
.
2020
.
The molecular mechanisms regulating the KEAP1-NRF2 pathway
.
Mol. Cell Biol.
40
:e00099-20.
Balasco
,
N.
,
L.
Esposito
,
G.
Smaldone
,
M.
Salvatore
, and
L.
Vitagliano
.
2024
.
A comprehensive analysis of the structural recognition between KCTD proteins and cullin 3
.
Int. J. Mol. Sci.
25
:
1881
.
Cao
,
X.
,
S.
Huang
,
M.M.
Wagner
,
Y.-T.
Cho
,
D.-C.
Chiu
,
K.M.
Wartchow
,
A.
Lazarian
,
L.B.
McIntire
,
M.B.
Smolka
, and
J.M.
Baskin
.
2024
.
A phosphorylation-controlled switch confers cell cycle-dependent protein relocalization
.
Nat. Cell Biol.
26
:
1804
1816
.
Cao
,
X.
,
A.
Shami Shah
,
E.J.
Sanford
,
M.B.
Smolka
, and
J.M.
Baskin
.
2022
.
Proximity labeling reveals spatial regulation of the anaphase-promoting complex/cyclosome by a microtubule adaptor
.
ACS Chem. Biol.
17
:
2605
2618
.
Cho
,
N.H.
,
K.C.
Cheveralls
,
A.-D.
Brunner
,
K.
Kim
,
A.C.
Michaelis
,
P.
Raghavan
,
H.
Kobayashi
,
L.
Savy
,
J.Y.
Li
,
H.
Canaj
, et al
.
2022
.
OpenCell: Endogenous tagging for the cartography of human cellular organization
.
Science
.
375
:eabi6983.
Ciuffa
,
R.
,
T.
Lamark
,
A.K.
Tarafder
,
A.
Guesdon
,
S.
Rybina
,
W.J.H.
Hagen
,
T.
Johansen
, and
C.
Sachse
.
2015
.
The selective autophagy receptor p62 forms a flexible filamentous helical scaffold
.
Cell Rep.
11
:
748
758
.
Errington
,
W.J.
,
M.Q.
Khan
,
S.A.
Bueler
,
J.L.
Rubinstein
,
A.
Chakrabartty
, and
G.G.
Privé
.
2012
.
Adaptor protein self-assembly drives the control of a cullin-RING ubiquitin ligase
.
Structure
.
20
:
1141
1153
.
Esposito
,
L.
,
N.
Balasco
,
G.
Smaldone
,
R.
Berisio
,
A.
Ruggiero
, and
L.
Vitagliano
.
2021
.
AlphaFold-Predicted structures of KCTD proteins unravel previously undetected relationships among the members of the family
.
Biomolecules
.
11
:
1862
.
Esposito
,
L.
,
N.
Balasco
, and
L.
Vitagliano
.
2022
.
Alphafold predictions provide insights into the structural features of the functional oligomers of all members of the KCTD family
.
Int. J. Mol. Sci.
23
:
13346
.
Fan
,
W.
,
Z.
Tang
,
D.
Chen
,
D.
Moughon
,
X.
Ding
,
S.
Chen
,
M.
Zhu
, and
Q.
Zhong
.
2010
.
Keap1 facilitates p62-mediated ubiquitin aggregate clearance via autophagy
.
Autophagy
.
6
:
614
621
.
Frendo-Cumbo
,
S.
,
J.R.
Jaldin-Fincati
,
E.
Coyaud
,
E.M.N.
Laurent
,
L.K.
Townsend
,
J.M.J.
Tan
,
R.J.
Xavier
,
N.J.
Pillon
,
B.
Raught
,
D.C.
Wright
, et al
.
2019
.
Deficiency of the autophagy gene ATG16L1 induces insulin resistance through KLHL9/KLHL13/CUL3-mediated IRS1 degradation
.
J. Biol. Chem.
294
:
16172
16185
.
Greif
,
P.A.
,
S.H.
Eck
,
N.P.
Konstandin
,
A.
Benet-Pagès
,
B.
Ksienzyk
,
A.
Dufour
,
A.T.
Vetter
,
H.D.
Popp
,
B.
Lorenz-Depiereux
,
T.
Meitinger
, et al
.
2011
.
Identification of recurring tumor-specific somatic mutations in acute myeloid leukemia by transcriptome sequencing
.
Leukemia
.
25
:
821
827
.
Heath
,
R.J.
,
G.
Goel
,
L.A.
Baxt
,
J.S.
Rush
,
V.
Mohanan
,
G.L.C.
Paulus
,
V.
Jani
,
K.G.
Lassen
, and
R.J.
Xavier
.
2016
.
RNF166 determines recruitment of adaptor proteins during antibacterial autophagy
.
Cell Rep.
17
:
2183
2194
.
Horos
,
R.
,
M.
Büscher
,
R.
Kleinendorst
,
A.-M.
Alleaume
,
A.K.
Tarafder
,
T.
Schwarzl
,
D.
Dziuba
,
C.
Tischer
,
E.M.
Zielonka
,
A.
Adak
, et al
.
2019
.
The small non-coding vault RNA1-1 acts as a riboregulator of autophagy
.
Cell
.
176
:
1054
1067.e12
.
Ichimura
,
Y.
,
T.
Kumanomidou
,
Y.
Sou
,
T.
Mizushima
,
J.
Ezaki
,
T.
Ueno
,
E.
Kominami
,
T.
Yamane
,
K.
Tanaka
, and
M.
Komatsu
.
2008
.
Structural basis for sorting mechanism of p62 in selective autophagy
.
J. Biol. Chem.
283
:
22847
22857
.
Ichimura
,
Y.
,
S.
Waguri
,
Y.-S.
Sou
,
S.
Kageyama
,
J.
Hasegawa
,
R.
Ishimura
,
T.
Saito
,
Y.
Yang
,
T.
Kouno
,
T.
Fukutomi
, et al
.
2013
.
Phosphorylation of p62 activates the Keap1-Nrf2 pathway during selective autophagy
.
Mol. Cell
.
51
:
618
631
.
Inami
,
Y.
,
S.
Waguri
,
A.
Sakamoto
,
T.
Kouno
,
K.
Nakada
,
O.
Hino
,
S.
Watanabe
,
J.
Ando
,
M.
Iwadate
,
M.
Yamamoto
, et al
.
2011
.
Persistent activation of Nrf2 through p62 in hepatocellular carcinoma cells
.
J. Cell Biol.
193
:
275
284
.
Jain
,
A.
,
T.
Lamark
,
E.
Sjøttem
,
K.B.
Larsen
,
J.A.
Awuh
,
A.
Øvervatn
,
M.
McMahon
,
J.D.
Hayes
, and
T.
Johansen
.
2010
.
p62/SQSTM1 is a target gene for transcription factor NRF2 and creates a positive feedback loop by inducing antioxidant response element-driven gene transcription
.
J. Biol. Chem.
285
:
22576
22591
.
Ji
,
A.X.
,
A.
Chu
,
T.K.
Nielsen
,
S.
Benlekbir
,
J.L.
Rubinstein
, and
G.G.
Privé
.
2016
.
Structural insights into KCTD protein assembly and cullin3 recognition
.
J. Mol. Biol.
428
:
92
107
.
Kageyama
,
S.
,
S.R.
Gudmundsson
,
Y.-S.
Sou
,
Y.
Ichimura
,
N.
Tamura
,
S.
Kazuno
,
T.
Ueno
,
Y.
Miura
,
D.
Noshiro
,
M.
Abe
, et al
.
2021
.
p62/SQSTM1-droplet serves as a platform for autophagosome formation and anti-oxidative stress response
.
Nat. Commun.
12
:
16
.
Kirkin
,
V.
,
D.G.
McEwan
,
I.
Novak
, and
I.
Dikic
.
2009
.
A role for ubiquitin in selective autophagy
.
Mol. Cell
.
34
:
259
269
.
Komatsu
,
M.
2022
.
p62 bodies: Phase separation, NRF2 activation, and selective autophagic degradation
.
IUBMB Life
.
74
:
1200
1208
.
Lau
,
A.
,
X.-J.
Wang
,
F.
Zhao
,
N.F.
Villeneuve
,
T.
Wu
,
T.
Jiang
,
Z.
Sun
,
E.
White
, and
D.D.
Zhang
.
2010
.
A noncanonical mechanism of Nrf2 activation by autophagy deficiency: Direct interaction between Keap1 and p62
.
Mol. Cell Biol.
30
:
3275
3285
.
Lau
,
A.
,
S.A.
Whitman
,
M.C.
Jaramillo
, and
D.D.
Zhang
.
2013
.
Arsenic-mediated activation of the Nrf2-Keap1 antioxidant pathway
.
J. Biochem. Mol. Toxicol.
27
:
99
105
.
Lee
,
Y.
,
T.-F.
Chou
,
S.K.
Pittman
,
A.L.
Keith
,
B.
Razani
, and
C.C.
Weihl
.
2017
.
Keap1/cullin3 modulates p62/SQSTM1 activity via UBA domain ubiquitination
.
Cell Rep.
19
:
188
202
.
Ma
,
S.
,
I.Y.
Attarwala
, and
X.-Q.
Xie
.
2019
.
SQSTM1/p62: A potential target for neurodegenerative disease
.
ACS Chem. Neurosci.
10
:
2094
2114
.
Matsumoto
,
G.
,
K.
Wada
,
M.
Okuno
,
M.
Kurosawa
, and
N.
Nukina
.
2011
.
Serine 403 phosphorylation of p62/SQSTM1 regulates selective autophagic clearance of ubiquitinated proteins
.
Mol. Cell
.
44
:
279
289
.
McGourty
,
C.A.
,
D.
Akopian
,
C.
Walsh
,
A.
Gorur
,
A.
Werner
,
R.
Schekman
,
D.
Bautista
, and
M.
Rape
.
2016
.
Regulation of the CUL3 ubiquitin ligase by a calcium-dependent co-adaptor
.
Cell
.
167
:
525
538.e14
.
Moscat
,
J.
,
M.
Karin
, and
M.T.
Diaz-Meco
.
2016
.
p62 in cancer: Signaling adaptor beyond autophagy
.
Cell
.
167
:
606
609
.
Pan
,
J.-A.
,
Y.
Sun
,
Y.-P.
Jiang
,
A.J.
Bott
,
N.
Jaber
,
Z.
Dou
,
B.
Yang
,
J.-S.
Chen
,
J.M.
Catanzaro
,
C.
Du
, et al
.
2016
.
TRIM21 ubiquitylates SQSTM1/p62 and suppresses protein sequestration to regulate redox homeostasis
.
Mol. Cell
.
61
:
720
733
.
Pankiv
,
S.
,
T.H.
Clausen
,
T.
Lamark
,
A.
Brech
,
J.-A.
Bruun
,
H.
Outzen
,
A.
Øvervatn
,
G.
Bjørkøy
, and
T.
Johansen
.
2007
.
p62/SQSTM1 binds directly to Atg8/LC3 to facilitate degradation of ubiquitinated protein aggregates by autophagy
.
J. Biol. Chem.
282
:
24131
24145
.
Pinkas
,
D.M.
,
C.E.
Sanvitale
,
J.C.
Bufton
,
F.J.
Sorrell
,
N.
Solcan
,
R.
Chalk
,
J.
Doutch
, and
A.N.
Bullock
.
2017
.
Structural complexity in the KCTD family of cullin3-dependent E3 ubiquitin ligases
.
Biochem. J.
474
:
3747
3761
.
Pohl
,
C.
, and
I.
Dikic
.
2019
.
Cellular quality control by the ubiquitin-proteasome system and autophagy
.
Science
.
366
:
818
822
.
Rubinsztein
,
D.C.
2006
.
The roles of intracellular protein-degradation pathways in neurodegeneration
.
Nature
.
443
:
780
786
.
Saito
,
T.
,
Y.
Ichimura
,
K.
Taguchi
,
T.
Suzuki
,
T.
Mizushima
,
K.
Takagi
,
Y.
Hirose
,
M.
Nagahashi
,
T.
Iso
,
T.
Fukutomi
, et al
.
2016
.
p62/Sqstm1 promotes malignancy of HCV-positive hepatocellular carcinoma through Nrf2-dependent metabolic reprogramming
.
Nat. Commun.
7
:
12030
.
Shami Shah
,
A.
,
A.G.
Batrouni
,
D.
Kim
,
A.
Punyala
,
W.
Cao
,
C.
Han
,
M.L.
Goldberg
,
M.B.
Smolka
, and
J.M.
Baskin
.
2019
.
PLEKHA4/kramer attenuates dishevelled ubiquitination to modulate wnt and planar cell polarity signaling
.
Cell Rep.
27
:
2157
2170.e8
.
Shami Shah
,
A.
,
X.
Cao
,
A.C.
White
, and
J.M.
Baskin
.
2021
.
PLEKHA4 promotes Wnt/β-Catenin signaling–mediated G1–S transition and proliferation in melanoma
.
Cancer Res.
81
:
2029
2043
.
Shi
,
Q.
,
X.
Jin
,
P.
Zhang
,
Q.
Li
,
Z.
Lv
,
Y.
Ding
,
H.
He
,
Y.
Wang
,
Y.
He
,
X.
Zhao
, et al
.
2022
.
SPOP mutations promote p62/SQSTM1-dependent autophagy and Nrf2 activation in prostate cancer
.
Cell Death Differ.
29
:
1228
1239
.
Shin
,
Y.
, and
C.P.
Brangwynne
.
2017
.
Liquid phase condensation in cell physiology and disease
.
Science
.
357
:eaaf4382.
Song
,
P.
,
S.
Li
,
H.
Wu
,
R.
Gao
,
G.
Rao
,
D.
Wang
,
Z.
Chen
,
B.
Ma
,
H.
Wang
,
N.
Sui
, et al
.
2016
.
Parkin promotes proteasomal degradation of p62: Implication of selective vulnerability of neuronal cells in the pathogenesis of Parkinson’s disease
.
Protein Cell
.
7
:
114
129
.
Sumara
,
I.
,
M.
Quadroni
,
C.
Frei
,
M.H.
Olma
,
G.
Sumara
,
R.
Ricci
, and
M.
Peter
.
2007
.
A Cul3-Based E3 ligase removes Aurora B from mitotic chromosomes, regulating mitotic progression and completion of cytokinesis in human cells
.
Dev. Cell
.
12
:
887
900
.
Sun
,
D.
,
R.
Wu
,
J.
Zheng
,
P.
Li
, and
L.
Yu
.
2018
.
Polyubiquitin chain-induced p62 phase separation drives autophagic cargo segregation
.
Cell Res.
28
:
405
415
.
Sun
,
H.
,
A.S.
Shah
,
D.-C.
Chiu
,
A.
Bonfini
,
N.
Buchon
, and
J.M.
Baskin
.
2024
.
Wnt/β-catenin signaling within multiple cell types dependent upon kramer regulates Drosophila intestinal stem cell proliferation
.
iScience
.
27
:
110113
.
Tan
,
C.T.
,
H.
Chang
,
Q.
Zhou
,
C.
Yu
,
N.Y.
Fu
,
K.
Sabapathy
, and
V.C.
Yu
.
2021
.
MOAP‐1‐mediated dissociation of p62/SQSTM1 bodies releases Keap1 and suppresses Nrf2 signaling
.
EMBO Rep.
22
:e50854.
Tan
,
M.-K.M.
,
H.-J.
Lim
,
E.J.
Bennett
,
Y.
Shi
, and
J.W.
Harper
.
2013
.
Parallel SCF adaptor capture proteomics reveals a role for SCFFBXL17 in NRF2 activation via BACH1 repressor turnover
.
Mol. Cell
.
52
:
9
24
.
The Cancer Genome Atlas Research Network
.
2017
.
Integrated genomic and molecular characterization of cervical cancer
.
Nature
.
543
:
378
384
.
Tinevez
,
J.-Y.
,
N.
Perry
,
J.
Schindelin
,
G.M.
Hoopes
,
G.D.
Reynolds
,
E.
Laplantine
,
S.Y.
Bednarek
,
S.L.
Shorte
, and
K.W.
Eliceiri
.
2017
.
TrackMate: An open and extensible platform for single-particle tracking
.
Methods
.
115
:
80
90
.
Tong
,
K.I.
,
Y.
Katoh
,
H.
Kusunoki
,
K.
Itoh
,
T.
Tanaka
, and
M.
Yamamoto
.
2006
.
Keap1 recruits Neh2 through binding to ETGE and DLG motifs: Characterization of the two-site molecular recognition model
.
Mol. Cell Biol.
26
:
2887
2900
.
Wang
,
P.
,
J.
Song
, and
D.
Ye
.
2020
.
CRL3s: The BTB-CUL3-RING E3 ubiquitin ligases
. In
Cullin-RING Ligases and Protein Neddylation: Biology and Therapeutics
.
Y.
Sun
,
W.
Wei
, and
J.
Jin
, editors.
Springer
,
Singapore
.
211
223
.
Watanabe
,
M.
,
Y.
Saeki
,
H.
Takahashi
,
F.
Ohtake
,
Y.
Yoshida
,
Y.
Kasuga
,
T.
Kondo
,
H.
Yaguchi
,
M.
Suzuki
,
H.
Ishida
, et al
.
2020
.
A substrate-trapping strategy to find E3 ubiquitin ligase substrates identifies Parkin and TRIM28 targets
.
Commun. Biol.
3
:
592
.
Werner
,
A.
,
S.
Iwasaki
,
C.A.
McGourty
,
S.
Medina-Ruiz
,
N.
Teerikorpi
,
I.
Fedrigo
,
N.T.
Ingolia
, and
M.
Rape
.
2015
.
Cell-fate determination by ubiquitin-dependent regulation of translation
.
Nature
.
525
:
523
527
.
Wilson
,
M.I.
,
D.J.
Gill
,
O.
Perisic
,
M.T.
Quinn
, and
R.L.
Williams
.
2003
.
PB1 domain-mediated heterodimerization in NADPH oxidase and signaling complexes of atypical protein kinase C with Par6 and p62
.
Mol. Cell
.
12
:
39
50
.
Xia
,
Q.
,
Y.
Li
,
W.
Xu
,
C.
Wu
,
H.
Zheng
,
L.
Liu
, and
L.
Dong
.
2023
.
Enhanced liquidity of p62 droplets mediated by Smurf1 links Nrf2 activation and autophagy
.
Cell Biosci.
13
:
37
.
Yang
,
Y.
,
T.L.
Willis
,
R.W.
Button
,
C.J.
Strang
,
Y.
Fu
,
X.
Wen
,
P.R.C.
Grayson
,
T.
Evans
,
R.J.
Sipthorpe
,
S.L.
Roberts
, et al
.
2019
.
Cytoplasmic DAXX drives SQSTM1/p62 phase condensation to activate Nrf2-mediated stress response
.
Nat. Commun.
10
:
3759
.
Zaffagnini
,
G.
,
A.
Savova
,
A.
Danieli
,
J.
Romanov
,
S.
Tremel
,
M.
Ebner
,
T.
Peterbauer
,
M.
Sztacho
,
R.
Trapannone
,
A.K.
Tarafder
, et al
.
2018
.
p62 filaments capture and present ubiquitinated cargos for autophagy
.
EMBO J.
37
:e98308.
Zheng
,
J.
,
X.
Yang
,
J.M.
Harrell
,
S.
Ryzhikov
,
E.H.
Shim
,
K.
Lykke-Andersen
,
N.
Wei
,
H.
Sun
,
R.
Kobayashi
, and
H.
Zhang
.
2002
.
CAND1 binds to unneddylated CUL1 and regulates the formation of SCF ubiquitin E3 ligase complex
.
Mol. Cell
.
10
:
1519
1526
.

or Create an Account

Close Modal
Close Modal