Ribosome stalling during co-translational translocation at the ER causes translocon clogging and impairs ER protein biogenesis. Mammalian cells resolve translocon clogging via a poorly characterized translocation-associated quality control (TAQC) process. Here, we combine a genome-wide CRISPR screen with live-cell imaging to dissect the molecular linchpin of TAQC. We show that TAQC substrates translated from mRNAs bearing a ribosome-stalling poly(A) sequence are degraded by lysosomes and the proteasome. By contrast, the degradation of defective nascent chains encoded by nonstop (NS) mRNAs involves an unconventional ER-associated protein degradation (ERAD) mechanism depending on ER-to-Golgi trafficking, KDEL-mediated substrate retrieval at the Golgi, and a tRNA-binding factor NEMF that appends an aggregation-prone carboxyl tail to stalled NS nascent chains. We propose that NEMF-mediated CAT tailing targets a subset of TAQC substrates via Golgi retrieval for ERAD, safeguarding ER homeostasis.
Introduction
Maintaining protein homeostasis is a critical cellular function involving various protein quality control (PQC) mechanisms. At the ER, a protein biogenesis site for secretory and membrane proteins, ER-associated protein degradation (ERAD) is a major PQC pathway. ERAD identifies and exports misfolded or incompletely assembled proteins to the cytoplasm for degradation by the ubiquitin–proteasome system (Bhattacharya and Qi, 2019; Christianson and Ye, 2014; Ruggiano et al., 2014). This process involves chaperones for substrate recognition, ubiquitin ligase–containing membrane complexes for protein retrotranslocation, and the conserved ATPase VCP/p97, which dislocates substrates from the ER membrane for cytosolic degradation by the proteasome (Vembar and Brodsky, 2008; Ye et al., 2001).
While significant progress has been made in understanding how ERAD removes misfolded proteins after their ER entry, less is known about how cells eliminate nascent chains stalled in the Sec61 translocon as a result of translation arrest during co-translational protein translocation (Wang and Ye, 2021). Translation arrest and/or ribosome stalling can be triggered by defective mRNAs, mRNAs with secondary structures, or difficult-to-translate sequences such as those coding the proline-rich domains of collagens (Wang et al., 2023; Yip and Shao, 2021). In the cytoplasm, a ribosome-associated quality control (RQC) pathway resolves translation stalling, starting with the ubiquitination of small ribosomal proteins (Filbeck et al., 2022; Joazeiro, 2019). Ribosome-splitting factors then separate ribosomal subunits, exposing a binding site for the RQC complex consisting of the ubiquitin ligase LTN1 and nuclear export mediator factor (NEMF) (Shao et al., 2015). LTN1 ubiquitinates stalled nascent chains (Inada, 2020), while NEMF catalyzes CAT tailing, adding short peptide tails to these substrates in an mRNA-independent manner (Howard and Frost, 2021; Kostova et al., 2017). Although the role of LTN1 in RQC is well understood, the function of NEMF is less clear, particularly for dealing with ribosome stalling at the ER.
Ribosome stalling at the ER imposes a unique challenge, as translation-stalled nascent chains can clog the Sec61 translocon, inhibiting protein flow into the ER and secretion (Wang et al., 2020). Recent studies have shown that translation stalling at the ER activates a ubiquitin-like modifier 1 (UFM1) E3 ligase complex, which modifies the 60S ribosomal protein RPL26 with multiple single UFM1 moieties (Walczak et al., 2019; Wang et al., 2020). We further showed that RPL26 UFMylation engages a translocon-associated UFM1 sensor named SAYSD1, which facilitates the clearance of translocon “cloggers” by lysosomes (Wang et al., 2023; Wang and Ye, 2021). These findings define a translocation-associated quality control (TAQC) mechanism distinct from cytosolic RQC. However, a contradictory study concluded that the proteasome acts in conjunction with VCP/p97 to eliminate abnormal translation products at the ER via a mechanism similar to cytosolic RQC (Scavone et al., 2023).
In this study, we combine live-cell imaging with CRISPR-mediated genetic fingerprinting to define the fate of model translocon cloggers. Our results reveal an unexpected role for NEMF-mediated CAT tailing in TAQC, which unifies previous findings into a cohesive model. We propose that TAQC is a unique PQC mechanism bearing features of both RQC and ERAD.
Results and discussion
TAQC substrates can be degraded by both lysosomes and the proteasome
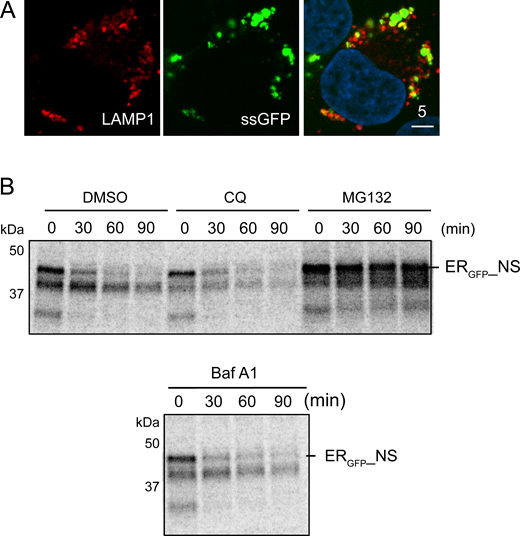
To resolve the discrepancy between our studies (Wang et al., 2020, 2023) and that of Kopito and colleagues (Scavone et al., 2023), we used live-cell confocal microscopy to reanalyze the fate of SSGFP, which was shown to be a proteasome substrate (Scavone et al., 2023). SSGFP contains an ER-targeting signal sequence (SS) at the amino terminus of GFP, followed by 20 consecutive Lys residues, encoded by a poly(A) sequence known to stall ribosomes (Dimitrova et al., 2009; Juszkiewicz and Hegde, 2017). When ribosomes stall, co-translational protein translocation also pauses, generating truncated polypeptides that clog the Sec61 translocon (Wang et al., 2020). We transfected U2OS cells with SSGFP and treated these cells with either ubiquitin-activating enzyme (E1) inhibitor (TAK-243), a VCP/p97 inhibitor (NMS-873), a lysosome inhibitor (Baf A1), a proteasome inhibitor (MG132), or a combination of Baf A1 and MG132. As expected, MG132 treatment stabilized SSGFP in a time-dependent manner, as did NMS-873 and TAK-243 (Fig. 1, A–D). Notably, MG132 and TAK-243 caused SSGFP to accumulate not only in the ER but also in large nuclear puncta in ∼54 and ∼40% of the transfected cells, respectively (Fig. 1 A, panels 2, 4). By contrast, NMS-873 only caused SSGFP to accumulate in the ER (panel 5). Co-staining with nucleolin antibodies confirmed the nuclear puncta as nucleoli (Fig. 1 E), suggesting that SSGFP is retrotranslocated; when its degradation in the cytosol is inhibited, SSGFP accumulates in nucleoli, likely because it contains a Lys-rich nucleolar localization sequence (Martin et al., 2015). Surprisingly, Baf A1 treatment also stabilized SSGFP, as ∼28% of SSGFP-expressing cells showed vesicle-like puncta, while ∼22% cells contained nucleolus-like puncta and ∼5% of cells had both (Fig. 1 A, panel 3). Co-immunostaining and live-cell imaging revealed extensive co-localization of SSGFP with either endogenous lysosomal protein LAMP1 or transfected LAMP1-mCherry (Fig. 1 F and Fig. S1 A). Although it is unclear why Baf A1 causes SSGFP to accumulate in nucleoli in some cells, our findings suggested that a fraction of SSGFP is degraded by lysosomes (Fig. 1 G). Interestingly, in cells co-treated with MG132 and Baf A1, we observed nucleolar and lysosomal accumulation of SSGFP in distinct populations of cells (∼34% each), while only a small fraction of transfected cells (∼6%) had both patterns (Fig. 1 A, panel 6). These results suggest that cells use either the proteasome or lysosomes to degrade SSGFP.
To further dissect the degradation mechanism of TAQC, we tested an additional SS-containing ribosome-stalling reporter, ERGFP_NS. The mRNA-encoding ERGFP_NS lacks any stop codons for translation termination, causing ribosome to stall (Fig. 1 G). When we treated HEK293T cells stably expressing ERGFP_NS with Baf A1 or MG132, we found that MG132, but not Baf A1, increased GFP fluorescence (Fig. 1 H). Pulse-chase experiments further confirmed that ERGFP_NS was short-lived, and its turnover was inhibited by MG132 but not by the lysosomal inhibitors chloroquine or Baf A1 (Fig. S1, B and C). Collectively, these results indicate that ERGFP_NS degradation is mediated entirely by the proteasome (Fig. 1 G).
ERGFP_NS is degraded by an ERAD-like mechanism involving SAYSD1 and the TRAPP complex
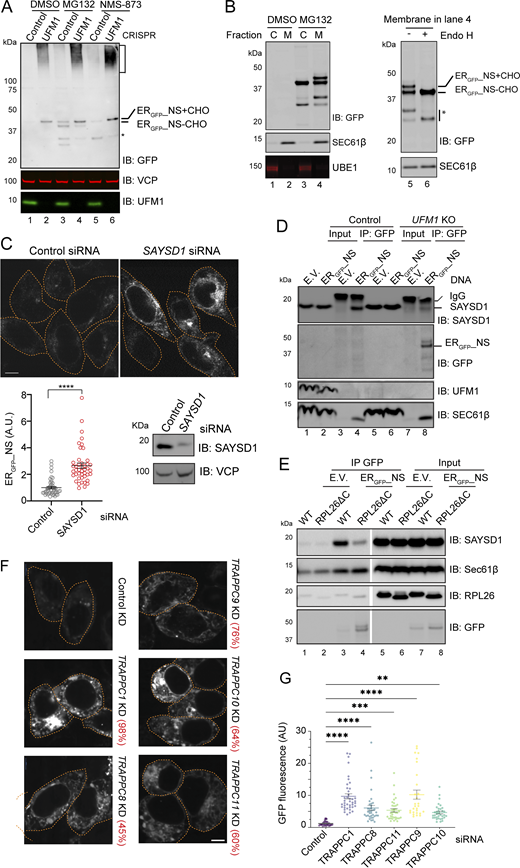
The observed proteasomal degradation of ERGFP_NS is surprising because, like previously reported TAQC substrates ERGFP_K20 and SSGFP (Scavone et al., 2023; Wang et al., 2023), the degradation of ERGFP_NS also requires UFM1 (Wang et al., 2023). We therefore combined cell fractionation with inhibitor treatment and UFM1 knockdown to dissect how UFM1 cooperates with the proteasome to promote ERGFP_NS degradation. Consistent with UFM1 being a positive TAQC facilitator, immunoblotting detected ERGFP_NS accumulation in UFM1-depleted cells in both full-length (∼45 kDa) and an SDS-resistant high molecular weight (HMW) form (Fig. 2 A, lane 2). The HMW ERGFP_NS “smear” was not apparent in proteasome inhibitor–treated cells, excluding ubiquitination as the main cause of this molecular weight shift. Instead, MG132 treatment caused accumulation of mostly full-length and a cleaved ERGFP_NS species, each containing a fast- and a slow-migrating band on the blot (lane 3 versus 1). Biochemical fractionation showed that ER-enriched microsomes from MG132-treated cells had all four ERGFP_NS bands, but the corresponding cytosolic faction contained only the fast-migrating band for each species (Fig. 2 B, lane 4 versus 3). When membrane fractions from MG132-exposed cells were treated with Endo H, the slow-migrating ERGFP_NS forms were converted to the corresponding fast-migrating species (Lane 6 versus 5), suggesting that the former was caused by N-glycosylation. Collectively, these results suggest that ERGFP_NS is retrotranslocated from the ER and deglycosylated similarly to previously reported glyco-ERAD substrates (Shamu et al., 1999). Consistent with this notion, the VCP/p97 inhibitor NMS-873 only caused ERGFP_NS to accumulate in the glycosylated forms (Fig. 2 A, lane 5). Knockdown of UFM1 in MG132-or NMS-873-treated cells reduced both deglycosylated and cleaved ERGFP_NS (Fig. 2 A, lanes 4, 6 versus 3, 5), suggesting that UFMylation acts upstream of retrotranslocation.
Our previous study demonstrated that the lysosomal transport of ERGFP_K20 requires a translocon-associated, ribosome- and UFM1-binding protein SAYSD1 and the trafficking protein particle (TRAPP) complex (Wang et al., 2023), the latter is a known Rab1 modulator regulating the ER-to-Golgi trafficking (Barrowman et al., 2010). We therefore tested whether these factors also regulate ERGFP_NS trafficking and turnover. First, we used SAYSD1-specific siRNA to knock down SAYSD1 in ERGFP_NS-expressing HEK293T cells. Confocal microscopy detected a significant accumulation of ERGFP_NS in SAYSD1-depleted cells (Fig. 2 C). Co-immunostaining showed that ERGFP_NS accumulated in SAYSD1 knockdown cells was largely co-localized with the ER marker calreticulin (Fig. S2 A). We next tested whether ERGFP_NS interacts with SAYSD1 by co-immunoprecipitation. To this end, we transfected WT and UFM1 knockout cells with either an empty vector or an ERGFP_NS-expressing construct. Immunoprecipitation with GFP antibodies pulled down ERGFP_NS together with endogenous SAYSD1 and Sec61β from WT cells (Fig. 2 D, lane 4). By contrast, in UFM1 knockout cells, although we detected more ERGFP_NS and Sec61 β in the precipitated samples, less SAYSD1 was co-precipitated (lane 8 versus 4). No SAYSD1 was detected when immunoprecipitation was performed using empty vector–transfected cells (lane 3). These results suggest that, similar to ERGFP_K20 (Wang et al., 2023), ERGFP_NS interacts with SAYSD1 in a UFMylation-dependent manner.
To determine whether the interaction between ERGFP_NS and SAYSD1 depends on RPL26 UFMylation, we repeated the co-immunoprecipitation experiment using a CRISPR-engineered knock-in cell line that has the RPL26 carboxyl-terminal UFMylation sites removed (RPL25ΔC) (Wang et al., 2023). Like in UFM1 knockout cells, GFP antibodies precipitated more ERGFP_NS from RPL26ΔC cells, but less SAYSD1 was co-precipitated (Fig. 2 E, lane 4 versus 3), suggesting that RPL26 UFMylation enhances ERGFP_NS’s interaction with SAYSD1. By contrast, the interactions of ERGFP_NS with the Sec61 translocon and ribosome were not affected in RPL26ΔC cells. Together, these findings implicate SAYSD1 as a regulator that engages ERGFP_NS downstream of RPL26 UFMylation to facilitate its degradation.
To test whether ERGFP_NS degradation requires the TRAPP complex, we used siRNA to knock down several TRAPP complex components in ERGFP_NS cells. Quantitative RT-PCR (qRT-PCR) confirmed the knockdown efficiency, ranging from 45 to 98% (Fig. 2 F). Fluorescence confocal microscopy showed significant upregulation of ERGFP_NS in cells depleted of TRAPPC1, TRAPPC8, TRAPPC9, TRAPPC10, or TRAPPC11 (Fig. 2, F and G). Co-immunostaining showed that in cells depleted of TRAPPC8, ERGFP_NS mainly accumulated in a perinuclear region overlapping with the ER marker calreticulin (Fig. S2 B). Thus, TRAPPC-mediated ER-to-Golgi trafficking also facilitates ERGFP_NS degradation.
ERGFP_NS degradation requires an ER-retrieval pathway and ERAD
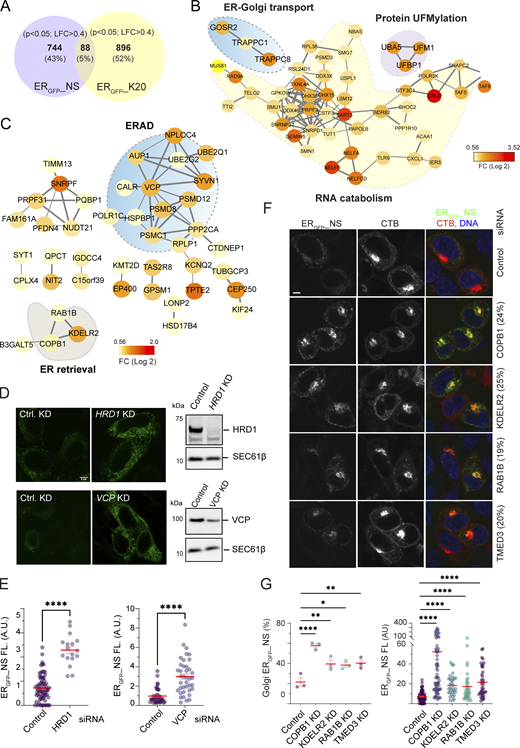
To define the genetic requirement of ERGFP_NS degradation, we conducted an unbiased genome-wide CRISPR screen using HEK293T cells stably expressing ERGFP_NS. To this end, we targeted the ∼20,000 human genes, each with six single gRNAs (sgRNAs), expressed from a lentivirus-based CRISPR-Cas9 library (Sanjana et al., 2014). The transduced cells were separated into a GFP-high (∼10%) and the remaining (∼90%) population by flow cytometry. We then used PCR amplification and high-throughput sequencing to identify sgDNAs enriched in the GFP-high population. Statistical analysis revealed 832 genes whose inactivation increased ERGFP_NS significantly (Fig. 3 A). We compared this list to genes identified previously in a similar screen using ERGFP_K20 as the reporter (Wang et al., 2023). Since these two substrates are degraded by different mechanisms, most identified genes did not overlap, as expected. Nevertheless, 88 genes (∼5%), when inactivated, increased GFP fluorescence of both ERGFP_K20 and ERGFP_NS. STRING-based protein network analyses showed that most common “hits” were associated with RNA catabolism, which likely affected these reporters via changing the mRNA abundance. Notably, the overlapping gene list includes several UFMylation components and ER-to-Golgi trafficking regulators, such as components of the TRAPP complex (Fig. 3 B and Fig. S3), further validating the involvement of UFMylation and ER-to-Golgi trafficking in ERGFP_NS degradation. Our screen did not uncover SAYSD1 and several other factors implicated in ERGFP_K20 degradation (e.g., some TRAPPC subunits, LTN1, and NEMF), suggesting that the screen is not saturated.
Next, we used STRING-based analysis to identify functional networks associated only with the degradation of ERGFP_NS but not ERGFP_K20. This approach identified one major network—ERAD—and several smaller ones (Fig. 3 C). While the role of these small networks in ERGFP_NS regulation awaits further characterization, siRNA-mediated knockdown of Hrd1/SYVN1 or VCP/p97, two well-established ERAD regulator (Bhattacharya and Qi, 2019), significantly increased the ERGFP_NS level in cells (Fig. 3, D and E), confirming the role of ERAD in ERGFP_NS degradation.
At first glance, the degradation of ERGFP_NS by ERAD appears inconsistent with the involvement of UFMylation, SAYSD1, and TRAPP-dependent ER-to-Golgi trafficking in this pathway. However, further examination of the gene networks specific for ERGFP-NS degradation identified components of the KDEL-dependent ER-retrieval pathway, including KDELR2, COPB1, and RAB1B (Fig. 3 C). This finding raised the possibility that ERGFP_NS is exported to the Golgi and then retrieved back to the ER before ERAD. Consistent with this view, knockdown of KDELR2, COPB1, RAB1B, and TMED3 in ERGFP_NS cells not only increased ERGFP_NS fluorescence but also caused ERGFP_NS to accumulate in a perinuclear region, co-localizing with the Golgi marker, cholera toxin B (Fig. 3, F and G). Altogether, our results suggest that following TRAPP-dependent transport to the Golgi, ERGFP_NS is retrieved back to the ER before undergoing retrotranslocation and ERAD.
NEMF-dependent CATylation is involved in the degradation of ERGFP_NS
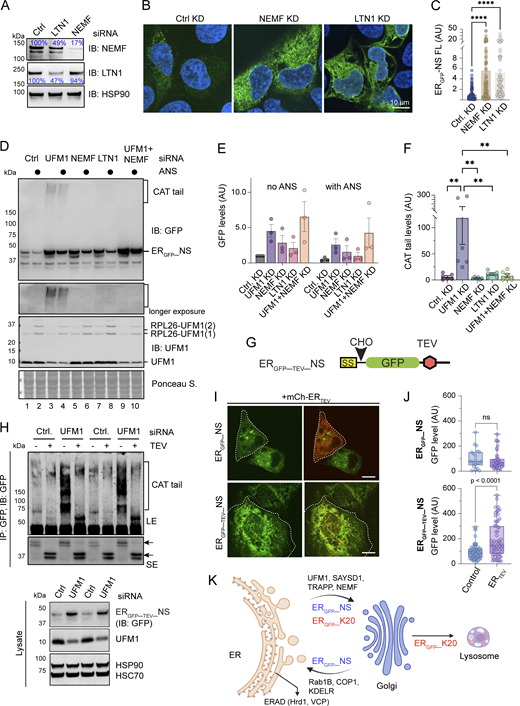
Previous studies showed that the degradation of ERGFP_K20 and SSGFP involves LTN1 and NEMF (Scavone et al., 2023; Wang et al., 2023). LTN1 catalyzes ubiquitination, while NEMF mediates CATylation of translation-stalled proteins (Inada, 2020). To explore whether these factors regulate ERGFP_NS degradation, we transfected into U2OS cells ERGFP_NS together with siRNAs targeting LTN1 or NEMF. Immunoblotting showed that knockdown of LTN1 by ∼50% also downregulated NEMF1 to a similar level, whereas knockdown of NEMF did not affect LTN1 (Fig. 4 A). Confocal microscopy showed that knockdown of NEMF or LTN1 caused approximately fivefold upregulation of ERGFP_NS in cells (Fig. 4, B and C). Immunoblotting further confirmed that knockdown of LTN1 or NEMF increased the steady-state ERGFP_NS level, similarly to knockdown of UFM1; this phenotype was observed regardless of whether cells were treated with a low concentration of anisomycin, which induces ribosome stalling and RPL26 UFMylation (Fig. 4, D and E). Noticeably, NEMF or LTN1 knockdown did not cause ERGFP_NS to accumulate in the SDS-resistant HMW form, as it was seen in UFM1 knockdown cells (Fig. 4 D, lanes 3, 4 versus lanes 5–8). However, when NEMF and UFM1 were knocked down simultaneously, no HMW smear was observed (Fig. 4 D, lanes 9, 10 versus 3, 4; Fig. 4 F). Given the well-established function of NEMF in CATylation of translation-stalled polypeptides (Lyumkis et al., 2014; Shen et al., 2015; Tesina et al., 2023), the HMW ERGFP_NS species likely results from NEMF-mediated CATylation, which accumulates when its degradation is inhibited in UFM1-depleted cells. Since CATylation usually appends small tags of <5 kDa to stalled nascent chains, as reported for SSGFP and cytosolic RQC substrates (Mizuno et al., 2021; Scavone et al., 2023; Shen et al., 2015; Thrun et al., 2021), the larger molecular weight shift seen with ERGFP_NS suggested that the tail appended to ERGFP_NS might have a sequence composition more prone to aggregation.
To further prove that the HMW ERGFP_NS species is a CATylation product, we generated an ERGFP_NS variant that has a tobacco etch virus (TEV nuclear inclusion—a endopeptidase) protease site ∼60 amino acids upstream of the stalling site (ERGFP_TEV_NS) (Fig. 4 G). Like ERGFP_NS, the TEV-bearing NS variant was also stabilized by MG132, but not by Baf A1. When ERGFP_TEV_NS was immunoprecipitated from UFM1 knockdown cells and treated with TEV, its carboxyl terminus was cleaved (Fig. 4 H, middle panel), which also caused the disappearance of the HMW ERGFP_TEV_NS species (top panel), suggesting that the formation of this HMW species depends on the carboxyl terminus of ERGFP_ TEV_NS.
To see whether the carboxyl terminus of ERGFP_ TEV_NS is required for its degradation, we co-expressed ERGFP_TEV_NS with ER-targeted TEV protease (mCh-ERTEV) in U2OS cells and used confocal microscopy to compare the level of ERGFP_TEV_NS in mCh-ERTEV–positive cells to that in mCh-ERTEV–negative cells in the same field. If the carboxyl terminus is essential for ERGFP_TEV_NS degradation, TEV-positive cells should accumulate ERGFP_TEV_NS to a higher level than TEV-negative cells, which was indeed observed (Fig. 4, I and J). By contrast, mCh-ERTEV expression did not affect ERGFP_NS that lacks the TEV site. Collectively, these results suggest that ERGFP_NS is subjected to NEMF-mediated CATylation, which appends a CAT tail to facilitate its degradation.
Our study has revealed two distinct degradation pathways for nascent chains that clog the Sec61 translocon in TAQC, which resolves a major discrepancy in the field. We show that “translocon cloggers” released into the ER lumen can be transported to lysosomes or targeted for proteasomal degradation. In both cases, they use a mechanism that depends on RPL26 UFMylation, SAYSD1, and the TRAPP complex to traffic out of the ER. Once arriving at the Golgi, some substrates, as exemplified by ERGFP_NS, use a KDEL-dependent retrieval pathway to return to the ER for subsequent elimination by ERAD. Others (e.g., ERGFP_K20) continue to reach lysosomes (Fig. 4 K). Although we cannot exclude that some cloggers in an early phase of protein translocation (those with only a small portion inserted into the ER) might “slip” back into the cytoplasm and be degraded by a mechanism akin to cytosolic RQC (Scavone et al., 2023), our results are consistent with the finding that defective translocation products are mostly released into the ER lumen before being targeted by PQC mechanisms (Arakawa et al., 2016).
Our study also demonstrates a critical function for NEMF in TAQC. NEMF and its yeast homolog Rqc2 catalyze a unique co-translational modification to facilitate substrate ubiquitination by ribosome-associated LTN1 or other cytosolic ubiquitin ligases (Sitron and Brandman, 2019; Thrun et al., 2021). However, whether CAT tailing occurs and its roles in TAQC have been unclear since substrates released into the ER lumen are inaccessible by these cytosolic ubiquitin ligases. In this regard, although knockdown of LTN1 and NEMF both inhibits the degradation of model TAQC substrates (Crowder et al., 2015; Scavone et al., 2023; Wang et al., 2023), the LTN1’s contribution to TAQC may be limited to NEMF stabilization (Fig. 4 A) (Lv et al., 2024). Because CAT tail added to ERGFP_NS is more aggregation prone than those on ERGFP_K20 or SSGFP, and because these substrates are triaged differently, we propose that NEMF-mediated CAT tailing may have a sorting function in mammalian TAQC. Future studies are required to determine whether NEMF can specify distinct CAT tails for TAQC substrates and how this process is linked to distinct triaging fates in TAQC.
Materials and methods
Chemicals, plasmids, and antibodies
Bafilomycin A1, NMS-873, and MG132 were purchased from LC Laboratories, Xcess Biosciences, and Millipore, respectively. TAK-243 was from Selleck Chemicals. Anisomycin was purchased from Sigma-Aldrich. Bortezomib was from Takeda Pharmaceuticals. Cholera toxin subunit B (CF 594 conjugated) was from Biotium.
The pERGFP-K20 and pERGFP-NS plasmids were reported previously (Wang et al., 2020). We purchased the plasmid expressing an ER-localized hook protein from Addgene (#65308; Ii-Str_Neomycin). To generate various model substrates with artificial CAT tails, we used restriction enzymes BamHI and XbaI to cut pERGFP-K20 (#133861; Addgene plasmid), removing most of the sequence downstream of GFP-3xFLAG. Various CAT tail–encoding sequences (listed below) were synthesized by IDT and PCR-amplified using the corresponding primer pairs. PCR products were digested with BamH1 and XbaI. The digested products were ligated into digested pERGFP-K20. To make pGFPER-ext, a stop codon was introduced at the site to include a short nucleotide (encoding NH2-AGSPGPTPSGTNVGS-COOH) in the ORF downstream of 3xFLAG by site-directed mutagenesis. To make pGFPER, a stop codon was introduced right after the 3xFLAG-conding sequence. ERGFP-TEV–NS was generated by inserting a DNA fragment coding the TEV site (ENLYFQ/S), 177-bp upstream of the predicted RNA termination site using PCR-based mutagenesis.
Inhibitor treatments
To test the effect of several inhibitors on the expression and trafficking of SSGFP and model substrates with artificial CAT tails, U2OS were seeded at 25,000 cells/well on an 8-well chamber. After 24 h, cells were co-transfected with 250 ng SSGFP plus 50 ng mCh-Lamp1 (to identify localization of SSGFP expression) or with 200 ng CAT tail–containing model substrates using Invitrogen’s Lipofectamine 2000 transfection reagent. 24 h later, cells were treated for ∼6 h with either 200 nM Baf A1, 20 μM MG132, or 1 µM bortezomib and imaged by live-cell imaging. To cause partial translation arrest, cells were treated with 200 nM anisomycin for 1 h before analysis. To test the degradation pathway for SSGFP, cells transfected with SSGFP for 24 h were treated with 200 nM Baf A1, 20 μM MG132, 1 µM bortezomib, 5 µM NMS-873, or 10 μM TAK243 before imaging.
Genome-wide CRISPR/Cas9 knockout screen
A genome-wide CRISPR/Cas9 knockout screen was performed as described previously (Wang et al., 2023). Briefly, the GeckoV2 library (#1000000048; Addgene) was amplified according to the online protocol (Sanjana et al., 2014), and the complexity of the library was determined by high-throughput sequencing. Lentiviruses expressing the sgRNA library and Cas9 were used for spin infection as follows: 60 million ERGFP_NS-expressing stable HEK293T cells supplemented with 8 μg/ml polybrene (Sigma-Aldrich) were seeded into two 12-well plates at a density of 3 million cells/well. Concentrated GeCKO v2 lentivirus was added to each well at a MOI of 0.3. Cells were spun at 1,000 g at room temperature for 2 h, followed by incubation at 37°C in a humidified incubator for 1 h. After medium removal, fresh medium was added, and cells were incubated for 48 h before puromycin selection (0.3 μg/ml). The transduced cells were subcultured in medium supplemented with puromycin every 2 days for a total of 8 days, and 80 million cells were maintained for each passage. After puromycin treatment, cells were recovered in a medium lacking puromycin for 24 h before sorting. In total, 60 million cells were sorted into GFP-high (1% of total cells) or GFP-low (80% of total cells) cell populations by a FACS AriaII cell sorter. Genomic DNA was extracted from each cell population using a QIAGEN Blood Maxi kit (for GFP low cells) or QIAGEN Blood Midi kit (for GFP high cells) according to the manufacturer’s instructions. sgRNAs were amplified from genomic DNA samples using the Herculase II Fusion DNA polymerase (Agilent Technologies) in two PCR steps as follows. In the first PCR, the genomic region containing sgRNAs was amplified from 130 μg total DNA using the following primers: forward: 5′-AATGGACTATCATATGCTTACCGTAACTTGAAAGTATTTCG-3′; reverse: 5′-CTTTAGTTTGTATGTCTGTTGCTATTATGTCTACTATTCTTTCC-3′. In total, 13 PCR reactions were performed in parallel, with 10 μg genomic DNA in each reaction using Herculase II Fusion DNA polymerase (Agilent) for 18 cycles, and the resulting PCR products were combined. In the second step of PCR, 5 μl of the first PCR product was used in a 100 μl reaction volume, and 24 PCR cycles were used. The primers used for the second PCR include staggered sequences of variable lengths and a 6-bp barcode for multiplexing of different biological samples. The second step PCR primers used are forward: 5′-AATGATACGGCGACCACCGAGATCTACACTCTTTCCCTACACGACGCTCTTCCGATCT-3′ (1–9-bp variable length sequence) (6-bp barcode) 5′-TCTTGTGGAAAGGACGAAACACCG-3′; reverse: 5′-CAAGCAGAAGACGGCATACGAGATGTGACTGGAGTTCAGACGTGTGCTCTTCCGATCTTCTACTATTCTTTCCCCTGCACTGT-3′. The PCR products were gel extracted, quantified, and sequenced using a NovaSeq sequencer (Illumina) by the National Heart, Lung, and Blood Institute (NHLBI) DNA Sequencing and Genomics Core. sgRNA sequences were obtained per sample by extracting 20 bps followed by the index sequence of “5′-TTGTGGAAAGGACGAAACACCG-3′” on the de-multiplexed FASTQ files from Illumina’s NGS sequencer using the Cutadapt software, version 2.8 (https://doi.org/10.14806/ej.17.1.200, Martin, 2011). FASTQC, version 0.11.9, was used to assess the sequencing quality (http://www.bioinformatics.babraham.ac.uk/projects/fastqc/). MAGeCK, version 0.5.9, was used to quantify and to identify differentially expressed sgRNAs. The MAGeCK count command was run on the merged two-half libraries of A and B to quantify. Differentially expressed sgRNAs with statistical significance were determined by running the MAGeCK test command in paired mode. Genes were ranked based on the number of unique sgRNAs enriched in the GFP-high population versus the GFP-low population. Data were derived from two biological repeats.
Cells and siRNA transfections
For all experiments, HEK293T and U2OS cells (ATCC) were cultured in DMEM (Corning) containing 10% FBS and antibiotics (penicillin/streptomycin, 10 U/ml) at 37°C in a 5% CO2 humidified incubator. To test the effect of NEMF and UFM1 knockdowns on ERGFP_NS expression by microscopy, U2OS cells were seeded at 25,000 cells/well on an 8-well chamber (Ibidi). 24 h after seeding, cells were transfected with 4 pmol of siRNAs targeting genes specified in the figure legends using Invitrogen RNAiMax transfection reagent. 24 h later, cells were transfected with 300 ng ERGFP_NS with Invitrogen Lipofectamine 2000 transfection reagent. Cells were incubated with fresh media for 24 h before fixation and imaging. A similar protocol was used to knock down COPB1, KDELR2, RAB1B, and TMED3 in HEK293T cells to check the role of these genes in ERGFP_NS trafficking by fluorescence microscopy. In some experiments, a Cy3-labeled negative control siRNA was included to verify transfection efficiency.
To test the effect of NEMF and UFM1 knockdowns on ERGFP_NS protein level by immunoblotting, HEK293T cells were seeded on a 6-well plate at 500,000 cells/well. Plates were pre-coated with poly-D-lysine to assist with cell adherence to the well. 24 h after seeding, cells were transfected with 120 pmol of siRNAs (a 1:1:1 mixture of three siRNAs targeting the same gene) using Invitrogen RNAiMax transfection reagent. After an additional 24 h, cells were split 1:2 onto pre-coated 12-well plates and 4 h later were transfected with 500 ng ERGFP_NS using TransIT-293 Transfection Reagent (Mirus). Media was changed after 24 h, and then cells were incubated for an additional ∼20 h before cell extracts were made with NP40 lysis buffer (0.5% NP40, 50 mM Tris-HCl, pH 7.4, 2 mM MgCl2, 150 mM NaCl, and 1 mM EDTA) plus 1,000x protease inhibitor and 0.5 mM TCEP (tris(2-carboxyethyl)phosphine). Cells were washed with cold 1x PBS, then 150 μl NP40 lysis buffer was added directly to wells and rocked for 30 min at 4°C. After lysis, lysate was transferred to a microcentrifuge tube and centrifuged at top speed for 5 min. The supernatant (120 μl) was collected in a clean microcentrifuge tube, and 40 μl of 4x Laemmli sample buffer (plus β-mercaptoethanol) was added to each tube. Samples were heated at 90°C for 15 min and loaded on an SDS-PAGE gel for immunoblotting analysis. siRNAs targeting UFM1, SAYSD1, and various TRAPP genes were reported previously (Wang et al., 2023). Other siRNAs are listed below in Table 1.
Immunostaining and immunoblotting
To prepare cells for immunofluorescence (IF) staining and imaging, cells grown and transfected in µ-Slide 8-well high-glass bottom imaging chambers (Catalog# 80807; Ibidi) were washed once with ice-cold PBS, fixed with 4% paraformaldehyde in PBS for 15–20 min at room temperature, and then washed three times with PBS. Cells were treated with PBS containing 0.1% NP40 and 5% FBS for 15 min at room temperature and then stained for 1 h at room temperature with the primary antibodies listed below in Table 2. Stained cells were washed three times with PBS and then stained with the corresponding secondary antibody conjugated to a fluorescent dye (Alexa488, Alexa566, or Alexa640). In some experiments, cells were also stained with Hoechst 33342 to reveal the nuclei. Stained cells were washed three times with PBS.
For immunoblotting analyses, cell lysates or immunoprecipitated materials were fractionated on 4–12% NuPAGE gels following the manufacture’s instruction (Thermo Fisher Scientific). Proteins were transferred to nitrocellulose membranes (BioRad) using a semidry protein transfer apparatus (Trans-Blot Turbo; BioRad). Membranes were treated with PBS containing 5% nonfat milk to block nonspecific binding and then incubated with primary antibodies in PBS containing 5% BSA as indicated below. After washing with PBS three times, we incubated the membranes for 1 h with HRP-conjugated or fluorescent secondary antibodies (Invitrogen). Chemiluminescent or fluorescent signals were detected by the BioRad ChemDoc scanning system.
Microscope image acquisition and processing
Fluorescence confocal microscopy images were collected on a Nikon CSU-W1 SoRa spinning disc super-resolution confocal microscope equipped with a 60× TIRF objective lens (NA = 1.6) and four laser lines (405, 488, 561, and 638 nm). Image collection was done using Nikon Element. Cells fixed and stained were imaged under an immersion oil. For live-cell imaging, cells were maintained in a temperature-controlled chamber incubator equipped with a CO2 control. Temperature was set as 37°C. Acquired images were processed and analyzed by Fiji (ImageJ). Presented figures were made using Adobe Photoshop v 26.41 and Adobe Illustrator v 29.31.
Statistical analysis
Immunoblot data were analyzed with BioRad Image Lab. Imaging data were analyzed with ImageJ, Imaris, or Nikon Elements Analysis (live cell only). All statistical analyses were completed with GraphPad Prism 10 and are displayed as mean ± SEM.
Online supplemental material
Fig. S1 shows that TAQC substrates can be degraded by either lysosomes or proteasome. Fig. S2 shows the accumulation of ERGFP_NS in the ER in SAYSD1 and TRAPPC8 knockdown cells. Fig. S3 shows the CRISPR screen result for the UFMylation pathway genes and components of the TRAPP complex. Table S1 shows a list of statistically significant CRISPR screen hits.
Data availability
The data presented in this study are available in the published article and its online supplemental material.
Acknowledgments
We thank the Advanced Light Microscope Core at the National Institute of Diabetes and Digestive and Kidney Diseases (NIDDK) for assistance with imaging, the NHLBI flow cytometry core for cell sorting, and the NHLBI Genomic Core for high-throughput sequence. We also thank R. Kopito (Stanford University, Stanford, CA, USA) for the SSGFP plasmid.
The research is supported by an intramural research program of NIDDK and by the National Institutes of Health grant R35GM145249 (L. Huang).
Author contributions: A. Ennis: conceptualization, data curation, formal analysis, investigation, methodology, project administration, validation, visualization, and writing—original draft. L. Wang: conceptualization, data curation, formal analysis, investigation, methodology, and writing—review and editing. Y. Xu: formal analysis, methodology, and resources. L. Saidi: investigation and validation. X. Wang: data curation. C. Yu: investigation and visualization. S. Yun: formal analysis and software. L. Huang: funding acquisition and resources. Y. Ye: conceptualization, data curation, formal analysis, funding acquisition, investigation, methodology, project administration, resources, supervision, validation, visualization, and writing—original draft, review, and editing.
References
Author notes
A. Ennis and L. Wang contributed equally to this paper.
Disclosures: The authors declare no competing interests exist.
L. Wang’s current affiliation is Innovent USA, Mountain View, CA, USA.
S. Yun’s current affiliation is Yottabiomed, LLC, Bethesda, MD, USA.