The gene encoding superoxide dismutase 1 (SOD1) is often mutated in familial amyotrophic lateral sclerosis (ALS), affecting motor neurons. Compared with ALS-associated mutant SOD1, the function of WT SOD1 is less explored. We demonstrate that during starvation, WT and mutant SOD1 are transported into lysosomes. Genome-wide CRISPR interference (CRISPRi) screening identified autophagy-related proteins and the autophagic receptor TP53INP1 as key mediators. TP53INP1 binds ATG8 family proteins, preferentially LC3C, and directly interacts with SOD1. Within lysosomes, SOD1 retains its enzymatic activity. Starvation induces elevated levels of lysosomal reactive oxygen species (ROS), which are further increased by knocking down SOD1 or TP53INP1. Lysosomal degradation activities and membrane integrity are also compromised in the absence of SOD1 or TP53INP1. We reveal a novel function of SOD1 in maintaining lysosomal activity and integrity, and a previously unrecognized role of autophagy in delivering cytosolic enzymes into lysosomes for catalytic purposes, rather than for degradation.
Introduction
As a pivotal antioxidant enzyme, Cu, Zn-superoxide dismutase 1 (SOD1) is crucial for cellular defense by catalyzing the dismutation of superoxide radicals into oxygen and hydrogen peroxide (Mondola et al., 2016; Trist et al., 2021). The gene encoding SOD1 is associated with amyotrophic lateral sclerosis (ALS), a fatal neurodegenerative disease marked by motor neuron degeneration (Hardiman et al., 2017; Mead et al., 2023). Over 150 mutations in the SOD1 gene are genetically linked with ALS (Ghasemi and Brown, 2018; Hardiman et al., 2017; Mead et al., 2023; Rosen et al., 1993; Saccon et al., 2013). Mutant SOD1 proteins misfold and oligomerize into larger aggregates (Bosco et al., 2010; Münch et al., 2011; Puttaparthi et al., 2003). However, the relationship between aggregation and toxicity remains debated. An alternative hypothesis suggests that loss of function of mutant SOD1 proteins, which results in diminished anti-oxidative activity and redox imbalance (Saccon et al., 2013), may increase the susceptibility of neurodegeneration in ALS, particularly in the presence of toxic SOD1 aggregates. The exact mechanism by which mutations in the SOD1 gene lead to ALS remains unclear.
The lysosome is pivotal for maintaining cellular homeostasis by breaking down both extracellular and intracellular materials (Ballabio and Bonifacino, 2020), serving as signaling hubs that respond to nutrient changes and stress (Perera and Zoncu, 2016). Preserving lysosomal integrity is critical for cellular and organismal homeostasis. Lysosomes are integral in mitigating oxidative stress by degrading damaged organelles and proteins through autophagy. This process involves the sequestration of cellular components into autophagosomes, which are subsequently delivered to lysosomes for degradation (Mizushima and Komatsu, 2011). Mitophagy, the selective degradation of damaged mitochondria, is particularly important due to their role as a major source of reactive oxygen species (ROS) (Youle and Narendra, 2011). Oxidative stress can compromise lysosomal integrity and function, like in aging brains (Butler and Bahr, 2006; Butterfield et al., 2014; Ollinger and Brunk, 1995). However, it remains unclear if the lysosomes have an intrinsic mechanism to manage intra-lysosomal oxidative stress. SOD1, primarily localized in the cytoplasm (Crapo et al., 1992), is also found in the nucleus, mitochondria, and lysosomes (Chang et al., 1988; Geller and Winge, 1982). Lysosomal SOD1 likely originates from the cytoplasm, with increased levels observed in lysosomes of fasted rat livers, though the underlying mechanism and function remain unexplored (Geller and Winge, 1982).
Here, we demonstrate that SOD1, both WT and ALS-associated mutant forms, are transported into lysosomes via autophagy upon starvation. This process is mediated by the specific autophagy receptor TP53INP1, which recognizes SOD1 and facilitates its delivery to lysosomes. Once inside the lysosomes, SOD1 retains its enzymatic activity, contributing to the reduction of lysosomal ROS and thereby protecting lysosomal integrity and function. This study underscores the crucial role of autophagic delivery of SOD1 to lysosomes as an intrinsic lysosomal mechanism for mitigating oxidative stress and preserving lysosomal function.
Results and discussion
WT and mutant SOD1 are delivered to lysosomes upon starvation
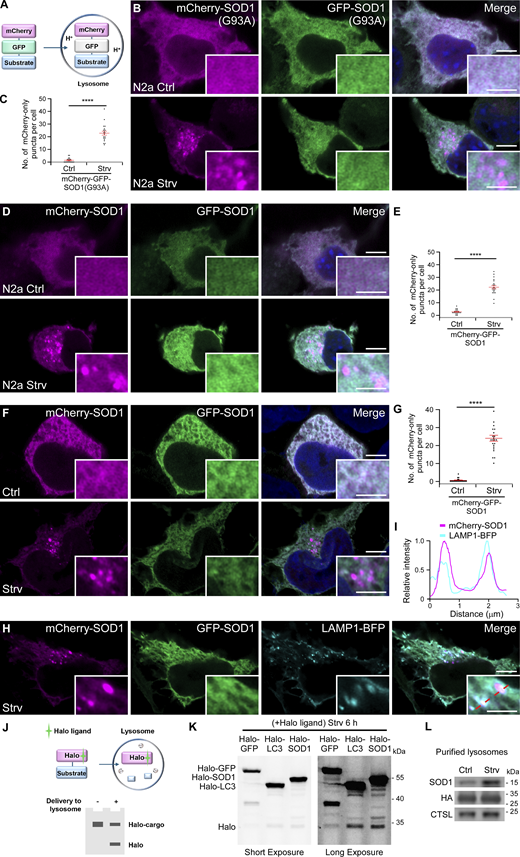
Accumulation of protein aggregates is a hallmark of most neurodegenerative diseases, including ALS (Finkbeiner, 2020; Nixon and Rubinsztein, 2024). Lysosomes have been indicated to participate in clearing these aggregate-prone proteins (Ma et al., 2022; Settembre et al., 2013), but it is still unclear how specific substrates are recognized and transported. To investigate this, we generated a reporter expressing ALS-associated mutant SOD1(G93A) with a tandem mCherry-GFP tag (mCherry-GFP-SOD1[G93A]) (Rosen et al., 1993). Given that the GFP signal is quenched in acidic environments, only the red mCherry signal is preserved if the substrate (SOD1[G93A]) is delivered to lysosomes (Fig. 1 A) (Kimura et al., 2007). When expressed in mouse neuroblastoma Neuro-2a (N2a) cells, mCherry-GFP-SOD1(G93A) showed diffuse signals (Fig. 1 B). Upon EBSS starvation to induce autophagy, the cells exhibited a significant accumulation of mCherry-only puncta from the mCherry-GFP-SOD1(G93A) reporter (Fig. 1, B and C). Surprisingly, we found that mCherry- and GFP-tagged WT SOD1, named mCherry-GFP-SOD1, also formed numerous mCherry-only foci upon starvation (Fig. 1, D and E). In addition, mCherry-only puncta were observed in cells expressing other ALS-related mutants of SOD1, mCherry-GFP-SOD1(A4V) or mCherry-GFP-SOD1(G85R) (Fig. S1, A–C) (Andersen et al., 1997; Rosen et al., 1993). These observations suggest that both WT and mutant SOD1 are transported to lysosomes under nutrient-deprived conditions. Similar phenotypes were also observed in other nonneural cell lines, including 293T and COS7 cells (Fig. 1, F and G; and Fig. S1, D and E), which indicates that transfer of SOD1 to lysosomes occurs ubiquitously. Given that 293T cells are easy to culture and transfect, we utilized this cell line for the remainder of the study.
To confirm the lysosomal localization of the mCherry-only SOD1 puncta, we co-transfected the cells with the lysosomal marker LAMP1-BFP. The results demonstrated strong colocalization between mCherry foci and LAMP1-BFP (Fig. 1, H and I). When the lysosomal pH was increased using the vacuolar-type H+-ATPase inhibitor bafilomycin A1 (Baf), the puncta exhibited both colors (Fig. S1, F and G). A HaloTag assay was used to monitor cargo delivery to lysosomes (Yim et al., 2022). When Halo-tagged substrates are transported to lysosomes, free Halo resists lysosomal proteolysis upon ligand binding and can be detected by in-gel fluorescence imaging (Yim et al., 2022) (Fig. 1 J). Compared with Halo-GFP, Halo-SOD1 demonstrated obvious free Halo ligand signal upon starvation, similar to the positive control Halo-LC3 (Fig. 1 K). Using coimmunoprecipitation (co-IP), we further purified lysosomes from control and starved cells expressing 3×HA-TMEM192 (Abu-Remaileh et al., 2017). SOD1 and the lysosomal enzyme cathepsin L, but not the ER protein EMC1, the mitochondrial protein TOMM20, or the cytosol protein GAPDH, were present in the purified lysosomes, and SOD1 levels were dramatically increased after EBSS treatment (Fig. 1 L and Fig. S1 H). This is consistent with the previous report that livers from fasted rats contained more SOD1 in lysosomes (Chang et al., 1988; Geller and Winge, 1982). These findings indicate that SOD1 is delivered to lysosomes in response to starvation.
Autophagosomes sequester and transfer SOD1 to lysosomes
To explore the mechanism of SOD1 delivery to lysosomes upon starvation, we conducted CRISPR interference (CRISPRi) screens to identify the involving factors. We first generated 293T cells stably expressing both mCherry-GFP-SOD1 and dCas9-BFP-KRAB (Tian et al., 2019). Flow cytometry analysis revealed that the GFP/mCherry fluorescence intensity ratio of mCherry-GFP-SOD1 was significantly decreased after starvation, which was reversed by Baf treatment (Fig. 2 A). This indicates that our reporter line is suitable for the CRISPRi screen.
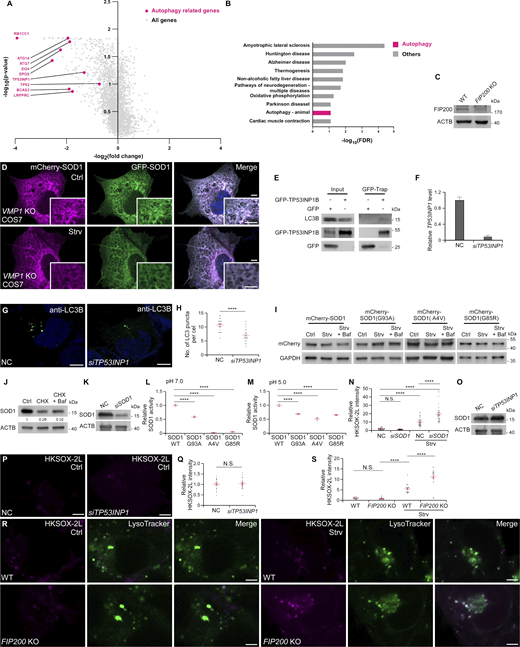
Using this system, we performed a fluorescence-activated cell sorting (FACS)-based CRISPRi screen to identify potential pathways involved in delivering SOD1 into lysosomes (Fig. 2 B). To avoid the possibility that knockout (KO) of essential genes with CRISPR may cause cell death, we used CRISPRi (Horlbeck et al., 2016). After transduced with an sgRNA library containing 24,000 sgRNAs targeting 11,217 genes adapted from the human CRISPRi-v2 library (Horlbeck et al., 2016), cells were sorted into two populations (enhanced vs. inhibited) based on their mCherry/GFP ratios under starvation. sgRNA abundances in each population were determined using next-generation sequencing (NGS). The MAGeCK pipeline was employed to determine phenotypes and significances for each gene perturbation.
The screen identified 168 genes whose knockdown (KD) reduced the mCherry/GFP ratios (Table S1). Among them, essential autophagy genes were prominent hits (Fig. 2, C and D; and Table S2). Similar results were obtained from an independent CRISPRi screen using the mCherry-GFP-SOD1(G93A) reporter with the h2 sublibrary of the human CRISPRi-v2 library (Horlbeck et al., 2016) (Fig. S2, A and B; and Tables S3 and S4). These results indicate the critical role of autophagy in the transport of SOD1 to lysosomes.
To verify the direct involvement of autophagy, we transfected the mCherry-GFP-SOD1–expressing cells with the autophagosome marker BFP-LC3. After EBSS treatment, mCherry-GFP-SOD1 puncta showed strong colocalization with LC3 (Fig. 2, E and F). We further inhibited autophagy flux using the PI3 kinase inhibitor wortmannin, and it completely abolished the mCherry signals in mCherry-GFP-SOD1–transfected cells after starvation (Fig. 2, A, G, and H). Furthermore, after EBSS treatment, no mCherry puncta were formed in mCherry-GFP-SOD1–transfected FIP200 KO 293T or VMP1 KO COS7 cells, which are depleted of key autophagy genes (Fig. 2, I and J; and Fig. S2, C and D). Taken together, these results provide evidence that autophagy is responsible for transporting SOD1 to lysosomes.
TP53INP1 acts as the receptor protein for transporting SOD1
Our CRISPRi screen highlighted TP53INP1 as a potential receptor in selectively sequestering SOD1 by autophagosomes (Fig. 2 C and Fig. S2 A). TP53INP1 has previously been reported to interact with the autophagosome protein LC3 (Seillier et al., 2012). We verified that LC3C, and to a lesser extent LC3A and LC3B, were precipitated by TP53INP1 (Fig. 3 A and Fig. S2 E). As previously reported (Seillier et al., 2012), a TP53INP1 mutant with a nonfunctional LC3-interacting region (D19A/W31A/V34A, ΔLIR) failed to bind to LC3 (Fig. 3 B). Co-IP analysis validated the binding between SOD1 and TP53INP1 (Fig. 3 D). Domain mapping results demonstrated that the C-terminal fragment (aa 164–240) of TP53INP1 mediated its interaction with SOD1 (Fig. 3, C and D). MBP-SOD1 and Trx-TP53INP1, purified from an Escherichia coli expression system, interacted with each other in vitro, which suggests a physical binding between the proteins (Fig. 3 E). After starvation, GFP-TP53INP1 formed punctate structures that colocalized well with mCherry-SOD1, which was more obvious following Baf incubation (Fig. 3, F–I).
KD of TP53INP1 greatly suppressed the formation of mCherry-only SOD1 puncta in cells expressing mCherry-GFP-SOD1, compared with cells treated with negative control (NC) siRNA (Fig. 3, J and K; and Fig. S2 F). Additionally, purified lysosomes from siTP53INP1-treated cells contained lower levels of SOD1 than those from controls (Fig. 3 L). Collectively, these results suggest that TP53INP1 functions as an autophagic receptor for the translocation of SOD1 from the cytoplasm into lysosomes.
TP53INP1 has been shown to promote autophagy (Seillier et al., 2012). Accordingly, we observed reduced LC3-II levels and autophagosome formation in siTP53INP1 cells (Fig. 3 M; and Fig. S2, G and H). Rescue experiments demonstrated that the LC3-II reduction in TP53INP1 KD cells was reversed by reintroducing RNAi-resistant WT TP53INP1 and TP53INP1(ΔC), but not by the LIR mutant (Fig. 3 M). These observations suggest that disrupting the binding of TP53INP1 to SOD1 does not affect TP53INP1’s role in autophagy. Neither the LIR mutant nor the C-terminal truncation of TP53INP1 could restore the SOD1 delivery defects in siTP53INP1 cells, while WT TP53INP1 was highly effective (Fig. 3, N and O). These results suggest that both the interaction with LC3 and the binding to SOD1 are critical for the role of TP53INP1 in transferring SOD1 into lysosomes.
SOD1 is functional in lysosomes and is not degraded
Autophagy was previously reported to degrade SOD1(G93A) (Kabuta et al., 2006). However, we detected no significant changes in the levels of WT or mutant SOD1 under starvation conditions (Fig. 4 A and Fig. S2 I). Furthermore, Baf treatment did not lead to elevated levels of either WT or mutant SOD1 (Fig. 4 A and Fig. S2 I). When translation was inhibited by cycloheximide, SOD1 degradation was detected, and inhibition of autophagy by Baf only slightly reversed the reduced SOD1 levels, which suggests that autophagy may play a limited role in degrading SOD1 (Fig. S2 J). Taken together, these data indicate that SOD1 delivered to lysosomes may not be intended for degradation.
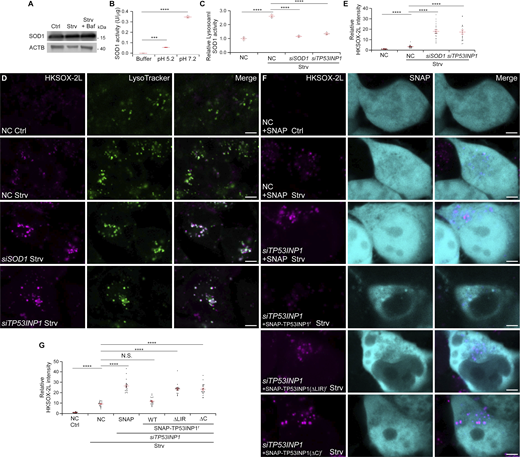
The acidic luminal environment of lysosomes provides optimal conditions for acidic hydrolases (Settembre and Perera, 2024), but it is typically too harsh for cytosolic enzymes. However, Cu, Zn-superoxide dismutase (SOD) activity was detected in the lysosomal fraction purified from rat liver (Geller and Winge, 1982). Thus, we speculated that SOD1 may remain active in lysosomes. Then we measured the SOD activity of purified SOD1 at pH 7.2 and 5.2, mimicking cytosolic and lysosomal environments, respectively, and found that SOD1 retained activity at acidic pH, although the activity was reduced to ∼20% of that at neutral conditions (Fig. 4 B), consistent with previous reports (Lin et al., 2009; Yang et al., 2015). Furthermore, the SOD activity was detected in purified lysosomes and increased upon starvation (Fig. 4 C). siSOD1 reduced the SOD activity in lysosomes back to normal levels (Fig. 4 C and Fig. S2 K), which indicates that the increased SOD activity is attributed to SOD1 transport to lysosomes.
Different SOD1 ALS mutants display varying degrees of reduced enzymatic activity (Borchelt et al., 1994; Bowling et al., 1993; Deng et al., 1993; Saccon et al., 2013). We also observed reduced enzymatic activity at both neutral and acidic pH levels for all tested SOD1 mutants, including G93A, A4V, and G85R (Fig. S2, L and M). These findings suggest a novel role for SOD1 within lysosomes and underscore the impact of ALS-associated mutations on SOD1 activity in the lysosomal environment.
SOD1 is important for maintaining lysosome function by clearing lysosomal ROS
SOD1 is a frontline antioxidant enzyme to protect cells from oxidative stress (Mondola et al., 2016; Trist et al., 2021). Maintaining redox balance is critical for lysosomal function (He et al., 2023). Changes in lysosomes induced by ROS can reduce lysosomal protein levels, cause membrane permeabilization, and even release cathepsins (Dehay et al., 2010; Wang et al., 2018). To specifically detect lysosomal superoxide levels, we used the lysosome-targeted probe HKSOX-2L. This molecule, based on a quenched fluorescein derivative, carries an aryl trifluoromethanesulfonate group, which is cleaved by superoxide to yield a highly fluorescent-free phenol moiety (Hu et al., 2015; Lu et al., 2016). The results showed that superoxide levels in lysosomes were greatly increased after starvation (Fig. 4 D). Moreover, superoxide levels were markedly increased in siSOD1-treated cells compared with controls (Fig. 4, D and E; and Fig. S2 N).
Elevated lysosomal levels of superoxide in SOD1-deficient cells may result from increased ROS due to reduced cytosolic and/or mitochondrial SOD1 levels. To address this, we silenced TP53INP1 to prevent SOD1 transfer to lysosomes without altering total SOD1 levels (Fig. S2 O). The results demonstrated that compared with controls, lysosomal SOD activity decreased and HKSOX-2L intensity increased in starved siTP53INP1 cells, with no notable difference in fed conditions (Fig. 4, C–E; and Fig. S2, P and Q). Reintroduction of WT TP53INP1, but not its LIR mutant or C-terminal truncation, rescued the elevated lysosomal superoxide levels in siTP53INP1 cells (Fig. 4, F and G). Similarly, KO of the key autophagy gene FIP200 also increased lysosomal superoxide levels under starvation conditions, but not under nutrient repletion conditions (Fig. S2, R and S), suggesting an important role of autophagy in ROS clearance during starvation. These findings highlight the significance of SOD1 transport into lysosomes in regulating ROS levels in lysosomes.
Additionally, the downstream enzyme thioredoxin (THIO), crucial for reducing H2O2 (Fukai and Ushio-Fukai, 2011), was also transported from the cytoplasm to lysosomes via the autophagy pathway (Fig. S3, A–D). THIO protein levels and catalase activity were detected in purified lysosomes, with further enhancement by starvation (Fig. S3, E and F). Moreover, akin to SOD1, purified THIO exhibited enzymatic activity in acidic conditions (Fig. S3 G). Taken together, these findings indicate a critical role of the antioxidant system, including SOD1 and THIO, in mitigating oxidative stress within lysosomes. Although THIO exhibited a weak interaction with TP53INP1 (Fig. S3 H), the lysosomal delivery of THIO was not affected by siTP53INP1 (Fig. S3 I), which indicates that other receptors may be involved in delivering THIO.
Increased levels of ROS can impair lysosomal function (Pivtoraiko et al., 2009). LysoTracker staining revealed no obvious difference between NC and siSOD1 cells (Fig. 4 D), indicating that lysosomal acidification remains unaffected when SOD1 is depleted. The β–N-acetylglucosaminidase (NAG) assay revealed a significant decrease in lysosomal protease activity in siSOD1 cells (Fig. 5 A). Similarly, cathepsin B activity, measured by Magic Red staining, was reduced in SOD1 KD cells compared with controls (Fig. 5, B and C). Evaluation of puncta formed by DQ-BSA, a fluorophore-conjugated protein that fluoresces upon lysosomal degradation (Humphries and Payne, 2012), revealed fewer puncta in siSOD1 cells than in NC cells (Fig. S3, J and K). Moreover, siTP53INP1 also resulted in compromised lysosomal function (Fig. 5, A–C; and Fig. S3, J and K). Compared with control cells, the size of lysosomes in siSOD1 or siTP53INP1 cells was slightly increased, possibly due to defective degradation (Fig. S3, L–N). The decreased NAG activity in siTP53INP1 cells was reversed by reintroducing WT TP53INP1 but not its LIR mutant or SOD1-binding mutant (Fig. 5 D). Although cellular ROS levels increased in siTP53INP1 cells (Saadi et al., 2015), reintroducing TP53INP1(ΔC) rescued the increased ROS levels (Fig. S3 O) but failed to rescue the increased lysosomal superoxide levels and defective lysosomal function (Fig. 4, F and G; and Fig. 5 D). These suggest that lysosomal dysfunction in siTP53INP1 cells was not due to elevated overall ROS levels. Moreover, vesicles isolated from the brains of SOD1(G93A)-transgenic mice showed a notable reduction in NAG activity compared with those from WT mice (Fig. 5 E and Fig. S3 P), which indicates compromised lysosomal function in SOD1 mutant animals. Taken together, our findings suggest that SOD1 plays a crucial role in maintaining lysosomal function.
The role of SOD1 in preserving lysosomal membrane integrity
Lysosomes are particularly vulnerable to membrane permeabilization (Meyer and Kravic, 2024), which was exacerbated by oxidative stress (Van der Paal et al., 2016). To elucidate the role of SOD1 in preserving lysosomal membrane integrity, we treated cells with the methylated peptide L-leucyl–L-leucine methyl ester (LLoMe), which specifically disrupts the lysosomal membrane after conversion into a hydrophobic form within the lysosomes (Thiele and Lipsky, 1985). Compared with fed cells, starved cells exhibited more CHMP4B or IST1-GFP puncta, markers for lysosomal membrane permeabilization (Fig. 5, F and G; and Fig. S3, Q and R), which indicates that cargo loading into lysosomes may compromise lysosomal membrane stability. KD of SOD1 or TP53INP1 significantly increased the number of CHMP4B or IST1-GFP puncta in LLoMe–treated starved cells (Fig. 5, H and I; and Fig. S3, S and T). Collectively, our findings reveal the important role of lysosomal SOD1 in regulating the redox status, functionality, and structural integrity of lysosomes.
As the primary degradation organelles, lysosomes are responsible for breaking down various protein substrates and organelles. This activity, however, can increase oxidative stress in lysosomes, particularly under starvation conditions that trigger the bulk delivery of cytoplasmic contents, including ROS-producing mitochondria, to lysosomes (Feng et al., 2014; Lamb et al., 2013; Mizushima, 2018; Nakatogawa et al., 2009; Zhao et al., 2021; Zhao and Zhang, 2019). It remains unclear how cells manage the high demand for degradative activity while maintaining lysosomal function. Here, our study uncovers a novel function of SOD1 within lysosomes, especially under elevated ROS levels during starvation. To prevent excess oxidative stressors from damaging lysosomes, cells concurrently deliver cytoplasmic SOD1—the primary enzyme for clearing ROS—to lysosomes as a practical and efficient way to support lysosomal activity (Fig. 5 J). In yeast, several key hydrolases and enzymes, such as aminopeptidase 1 and α-mannosidase, are transported from the cytoplasm to the vacuole via autophagy (Kim et al., 1997). In mammals, lysosomal enzymes are primarily delivered to lysosomes via the mannose-6-phosphate pathway (Yang and Wang, 2021). Our study reveals that the cytosolic enzyme SOD1 can also be delivered to lysosomes via autophagy, a process previously unidentified in mammals. Additionally, our findings provide novel insights into the pathogenesis of ALS. ALS-associated SOD1 mutations lead to compromised enzyme activity, especially in an acidic environment. Transport of the mutant SOD1 to lysosomes may potentially occupy receptor proteins and competitively inhibits their ability to transport WT SOD1.
In conclusion, our study reveals a novel mechanism for maintaining lysosome homeostasis whereby SOD1 is delivered to lysosomes to clear lysosomal ROS and support normal lysosomal function. This mechanism not only underscores the intricate balance that cells must achieve to manage oxidative stress but also provides new perspectives on the molecular underpinnings of neurodegenerative diseases, such as ALS.
Materials and methods
Plasmids
mCherry-SOD1 was generated by inserting human SOD1 into mCherry-C1 vector. mCherry-SOD1(G93A), mCherry-SOD1(A4V), and Cherry-SOD1(G85R) were generated by PCR-based mutagenesis from mCherry-SOD1. mCherry-GFP-SOD1 was generated by inserting GFP between mCherry and SOD1. mCherry-GFP-SOD1(G93A), mCherry-GFP-SOD1(A4V), and mCherry-GFP-SOD1(G85R) were generated by PCR-based mutagenesis from mCherry-GFP-SOD1. LAMP1-GFP and GFP-LC3 were generated as previously described (Ji et al., 2021). LAMP1-BFP was generated by replacing GFP of LAMP1-GFP with BFP. BFP-LC3 was generated by replacing GFP of GFP-LC3 with BFP. THIO-GFP was generated by inserting human THIO into GFP-C1 vector. THIO-Flag was generated by replacing GFP of THIO-GFP with Flag. THIO-mCherry was generated by inserting human THIO into mCherry-C1 vector. THIO-GFP-mCherry was generated by inserting GFP between mCherry and THIO. TMEM192-GFP was generated by inserting human TMEM192 into GFP-N1 vector. TMEM192-3×HA was generated by replacing GFP of TMEM192-GFP with 3×HA. THIO-MBP was generated by inserting human THIO into a modified pET-32a vector with an N-terminal MBP-6×His tag and an HRV-3C protease-cutting site. MBP-SOD1 was generated by inserting human SOD1 into a modified pET-32a vector with an N-terminal MBP-6×His tag and an HRV-3C protease-cutting site. MBP-SOD1(G93A), MBP-SOD1(A4V), and MBP-SOD1(G85R) were generated by PCR-based mutagenesis from MBP-SOD1. TrxA-TP53INP1 was generated by inserting human TP53INP1 into a modified pET-32a vector with an N-terminal Trx-His8 tag and an HRV-3C protease-cutting site. GFP-TP53INP1 was generated by inserting human TP53INP1 into GFP-C1 vector. mCherry-TP53INP1 was generated by replacing GFP of GFP-TP53INP1 with mCherry. GFP-TP53INP1(ΔN) was generated by deleting aa 1–74 from GFP-TP53INP1. GFP-TP53INP1(ΔM) was generated by deleting aa 75–163 from GFP- TP53INP1. GFP-TP53INP1(ΔC) was generated by deleting aa 164–240 from GFP-TP53INP1. GFP-TP53INP1(D19A/W31A/V34A, ΔLIR) was generated by PCR-based mutagenesis from GFP-TP53INP1. SNAP-TP53INP1 was generated by replacing GFP of GFP-TP53INP1 with SNAP. RNA-resistant SNAP-TP53INP1r was generated by PCR-based mutagenesis from SNAP-TP53INP1. SNAP-TP53INP1(ΔC)r was generated by deleting aa 164–240 from SNAP-TP53INP1r. SNAP-TP53INP1(ΔLIR)r was generated by PCR-based mutagenesis from SNAP-TP53INP1r. Halo-GFP and Halo-LC3 were kind gifts from Dr Noboru Mizushima from the Department of Biochemistry and Molecular Biology, Graduate School of Medicine, The University of Tokyo, Bunkyo-ku, Tokyo, Japan. Flag-LC3A, Flag-LC3B, and Flag-LC3C were kind gifts from Dr Yueguang Rong at School of Basic Medicine, Tongji Medical College and State Key Laboratory for Diagnosis and Treatment of Severe Zoonotic Infectious Disease, Huazhong University of Science and Technology, Wuhan, China. Flag-SOD1 was generated by replacing LC3A of Flag-LC3A with SOD1.
Antibodies
The following antibodies were used in this study: mouse anti-GFP (11814460001; Roche), mouse anti-Flag (F1804; Sigma-Aldrich), rabbit anti-mCherry (GTX59788; Genetex), rabbit anti-EMC1 (ab153890; Abcam), rabbit anti-TOMM20 (ab78547; Abcam), rabbit anti-HA (H6908; Sigma-Aldrich), rabbit anti-Cathepsin L (27952-1-AP; Proteintech), rabbit anti-SOD1 (10269-1-AP; Proteintech), rabbit anti-TP53INP1 (ab9775; Abcam), mouse anti-GAPDH (60004-1-Ig; Proteintech), rabbit anti-CHMP4B (13683-1-AP; Proteintech), rabbit anti-LC3B (ab192890; Abcam), rabbit anti-LC3 (M152-3; Medical & Biological Laboratories), mouse anti-CD107a (555798; BD Biosciences), and mouse anti-ACTB (60008-1-Ig; Proteintech).
The following secondary antibodies were used in this study: goat anti-rabbit IgG(H+L)-HRP (BE0101; EASYBIO), goat anti-mouse IgG(H+L)-HRP (BE0102; EASYBIO), and goat anti–rabbit-Fluorescein (FITC) (111-095-003; Jackson).
Cell lines
293T cells, N2a cells, and COS7 cells used in this study were purchased from ATCC. N2a cells were grown with DMEM/F12 (11320082; Invitrogen) supplemented with 10% FBS (10099-141C; Thermo Fisher Scientific) and penicillin-streptomycin under conditions of 37°C and 5% CO2. 293T and COS7 cells were maintained in DMEM (C11965500BT; Thermo Fisher Scientific), supplemented with 10% FBS and penicillin-streptomycin. Cells were cultured at 37°C in a 5% CO2 atmosphere. To inhibit PI3 kinase activity, cells were treated to 200 nM wortmannin (PHZ1301; Life Technologies) for 16 h. To block lysosomal function, cells were exposed to 20 nM Baf (B1793; Sigma-Aldrich) for 16 h.
293T cells stable expressing dCas9 were generated as follows: 293T cells were co-transfected with plasmids encoding pC13N-dCas9-BFP-KRAB (Tian et al., 2019) and TALENs, targeting the human CLYBL intragenic safe harbor locus (pZT-C13-R1 and pZT-C13-L1; Addgene #62,196 and #62,197). Cells expressing BFP were enriched via FACS using the FACSAria SORP (BD Biosciences). This cell line was named CRISPRi-293T. To generate CRISPRi-293T cells stably expressing mCherry-GFP-SOD1 or mCherry-GFP-SOD1(G93A), mCherry-GFP-SOD1 or mCherry-GFP-SOD1(G93A) sequences were inserted into pLenti-CMV-puro vector (kindly provided by Dr Ying Sun from Department of Systems Biology, School of Life Sciences, Guangdong Provincial Key Laboratory of Cell Microenvironment and Disease Research, Shenzhen Key Laboratory of Cell Microenvironment, Southern University of Science and Technology, Shenzhen, China) to generate specific lentivirus plasmids. For lentivirus packaging, HEK293T cells were co-transfected with lentiviral mCherry-GFP-SOD1 or mCherry-GFP-SOD1(G93A) with psPAX and pMD at a ratio of 4:3:1 for 48 h. Then lentiviral particles were collected, filtered, and added to the CRISPRi-293T cells in 6-cm dishes. Subsequently, lentivirus-infected cells were seeded into a 96-well plate, and positive single clones were selected after 2 wk.
To generate FIP200 KO cell lines, gRNA-expressing plasmids were constructed using the vector pmd127 (kindly provided by Dr Pengpeng Liu from Institute of Advanced Biotechnology, Institute of Homeostatic Medicine, and School of Medicine, Southern University of Science and Technology, Shenzhen, China). Two gRNAs were designed to target upstream and downstream of exon 4 of FIP200 to facilitate exon skipping and gene KO. 293T cells were transiently transfected with the corresponding plasmids. Single KO clones were validated through immunoblotting and PCR-based sequencing. The following gRNA sequences were utilized for targeting:
Human FIP200 exon4 upstream: 5′-ACTATGTAAAAACACCTTAG-3′ and
Human FIP200 exon4 downstream: 5′-CAACATCTTTACATCACATT-3′.
VMP1 KO COS7 cells were generated as previously described (Zhao et al., 2017).
Transfection and RNA interference
Cells were transfected with the indicated plasmids using Lipofectamine 2000 (12566014; Life Technologies). For RNA interference, cells were transfected with either negative control (NC) or siRNA oligos using Lipofectamine RNAi MAX (13778150; Life Technologies). Cells were harvested 72 h after transfection.
siRNAs oligos were obtained from GenePharma. The sequences of siRNAs used in this study are listed below:
NC, 5′-UUCUCCGAACGUGUCACGUTT-3′,
Human SOD1, 5′-GGAAAUGAAGAAAGUACAA-3′, and
Human TP53INP1, 5′-GAUUCUUGUUGACUUCAUA-3′.
Quantitative RT-PCR
Cells were transfected with siRNAs as indicated. 72 h after transfection, RNA was isolated with Trizol (15596026; Invitrogen) according to the manufacturer’s instructions. cDNA was reverse transcribed using a SuperRT cDNA Synthesis Kit (CW0741M; CWBIO). The cDNA was analyzed using quantitative PCR with 2*TSINGKE Master qPCR Mix (TSE201; TSINGKE) on an Applied Biosystems QuantStudio 1 (Thermo Fisher Scientific). The primers for quantitative PCR assays in this study were as follows:
F-Human ACTB, 5′-GGACATCCGCAAAGACCTGT-3′,
R-Human ACTB, 5′-ACACGGAGTACTTGCGCTCA-3′,
F-Human SOD1, 5′-TGCAGGGCATCATCAATTTCG-3′,
R-Human SOD1, 5′-CCCAAGTCTCCAACATGCCTC-3′,
F-Human TP53INP1, 5′-GTCACCTACTGAGCAC-3′, and
R-Human TP53INP1, 5′-CACTTGTATCAGCCAAGCACT-3′.
Immunostaining
Cells were cultured on coverslips (12–545-83; Fisherbrand) and transfected with the indicated plasmids or siRNAs for 24 or 72 h, respectively. Then cells were washed three times with PBS (140 mM NaCl, 2.7 mM KCl, 10 mM Na2HPO4, and 1.8 mM KH2PO4) and fixed with 4% PFA (E672002; Sangon Biotech) for 30 min. Cells were then blocked with 1% BSA for 1 h, followed by overnight incubation at 4°C with primary antibodies diluted in 1% BSA. After three washes with PBS, cells were exposed to fluorescently labeled secondary antibodies for 1 h at room temperature. To remove cytosolic signals, cells were treated with 200 μg/ml digitonin (D141; Sigma-Aldrich) for 2 min at room temperature before fixation. To label lysosomes, cells were incubated with 1 µM LysoTracker for 1 h before fixation. For visualization of lysosomal superoxide, cells were plated on 35-mm glass-bottom cell culture dishes (706001; NEST) and loaded with 5 μM HKSOX-2L (kindly provided by Dr Dan Yang from Westlake Laboratory of Life Sciences and Biomedicine, Hangzhou, Zhejiang, China) 1 h before live-cell imaging. To measure cathepsin B activity, cells were starved for 16 h and stained with Magic Red (937; ImmunoChemistry) for 1 h. To determine the proteolytic activity in lysosomes, cells were starved for 10 h and incubated with 1 μg/ml DQ-BSA (937; ImmunoChemistry) for 6 h.
Coverslips mounted using an antifade solution (without DAPI, ZLI-9556; with DAPI, ZLI-9557; ORIGENE) or live cells were imaged using a confocal microscope (LSM 980 Meta plus Zeiss Axiovert zoom; Zeiss) equipped with a 63×/1.40 oil-immersion objective lens (Plan-Apochromat; Zeiss) and a GaAsP PMT point detector (Zeiss). Image acquisition was performed using Zeiss ZEN software (blue edition) at room temperature.
Flow cytometry analysis
To assess the lysosomal delivery of SOD1, 293T cells were transfected with mCherry-GFP-SOD1 for 24–48 h and subjected to various treatments. Then cells were collected for analysis. To assess the cytosolic ROS level, 293T cells were transfected with siRNA for 72 h and starved for 16 h. Then cells were incubated with the DCFH probe (S0033S; Beyotime Biotechnology) for 20 min to detect ROS levels and collected for analysis. Flow cytometry was performed using a BD FACSCanto SORP flow cytometer (BD Biosciences). The ratio of GFP to mCherry fluorescence was analyzed, and the resulting histograms were processed using FlowJo software version 10.8.1.
CRISPRi screen
The CRISPRi libraries were packaged into lentivirus as previously detailed (Tian et al., 2019). 293T cells stably expressing mCherry-GFP-SOD1 (or mCherry-GFP-SOD1[G93A]) and dCas9-BFP-KRAB were infected with the sgRNA libraries at a MOI of 0.4–0.6, determined by BFP fluorescence from the lentiviral vector, ensuring ∼1,000× coverage per library element. Two days after infection, cells were selected for successful lentiviral integration using puromycin (1 μg/ml) for 3 days while the cultures were expanded for the screens. After selection, cells were starved in EBSS for 16 h and subjected to flow cytometry analysis. The top 40% and bottom 40% of mCherry/GFP ratios correspond to increased and inhibited SOD1 delivery to lysosomes, respectively. Cells of each population were sorted by flow cytometry and processed for NGS to identify sgRNAs. Genomic DNA was extracted from CRISPRi-293T cells with DNAiso Reagent (9770Q; Takara) according to the manufacturer’s protocol. The sgRNA fragment was amplified using 2 × Phanta Flash Master Mix (P510-02; Vazyme) and size-selected using Hieff NGS DNA Selection Beads (12601ES08; Yeasen). The sgRNA products were sequenced using a DNBSEQ-T7 instrument (MGI Tech). The MAGeCK-iNC pipeline was used for screening data analysis. The entire CRISPRi screen was performed in two biological replicates.
NAG assay
The NAG assay was performed with a NAG assay kit (CS0780; Sigma-Aldrich) according to the manufacturer’s instructions. Briefly, cells were pretreated with EBSS for 16 h and harvested with RIPA buffer (P0013; Beyotime Biotechnology). Protein concentrations of each sample were measured using the BCA protein assay kit (23225; Thermo Fisher Scientific). 10 μl of cell lysate from each sample were used to measure the NAG activity in triplicate.
co-IP and immunoblotting
For co-IP assays, cells were transfected with the indicated plasmids for 24–48 h. Following transfection, cells were lysed using a lysis buffer composed of 20 mM HEPES (pH 7.5), 150 mM NaCl, 1 mM EDTA, and 0.1% Triton X-100, supplemented with a protease inhibitor cocktail (11836170001; Roche). The cell lysates were incubated on ice for 30 min and then centrifuged at 13,000 rpm for 10 min at 4°C. The resulting supernatants were transferred to fresh tubes and incubated with GFP-Trap agarose beads (KTSM1334; Shenzhen KT Life Technology) at 4°C for 1 h. The proteins bound to the beads were eluted using SDS sample buffer (cw0027; CWBIO) and subsequently analyzed by immunoblotting.
For immunoblotting, cells were lysed in the lysis buffer. The lysates were placed on ice for 30 min, followed by centrifugation at 13,000 rpm for 10 min at 4°C. The resulting supernatants were collected and mixed with SDS sample buffer. The samples were then subjected to SDS-PAGE for protein separation. Following electrophoresis, the proteins were transferred onto hydrophobic PVDF membranes with a 0.45-µm pore size (IPVH00010; Millipore). Protein detection was performed using the specified primary and secondary antibodies, and the signals were visualized using the 5200SF imaging system (5200SF; Tanon).
Halo-Tag assay
Cells were incubated with 100 nM TMR-conjugated Halo Tag ligand (G8251; Promega) for 30 min. After washing twice with PBS, the cells were cultured in starvation medium for 6 h. Subsequently, cells were harvested in SDS sample buffer. Samples were separated using SDS-PAGE, and the gel was immediately visualized for TMR in-gel fluorescence with an Amersham ImageQuant 800 (Cytiva).
Lysosome purification
Lysosomes from cells expressing TMEM192-3×HA were purified as previously described (Lim et al., 2019). Briefly, cells cultured in a 15-cm dish were transfected with TMEM192-3×HA for 24 h. After removing the medium, the cell monolayers were rinsed with ice-cold homogenization buffer (250 mM sucrose, 20 mM Tris-HCl, pH 7.4, and 1 mM EDTA) containing protease inhibitor and 0.3 mM DTT. All steps were performed on ice or at 4°C unless stated otherwise. Cells were scraped into 1 ml of homogenization buffer and collected by centrifugation at 1,500 rpm for 5 min. The cell pellet was resuspended in 1 ml of homogenization buffer and subjected to fractionation using a Dounce homogenizer with a tight pestle. Homogenization was performed with 50–80 strokes on ice. The postnuclear supernatant was harvested and incubated with 40 μl of anti-HA magnetic beads (88836; Thermo Fisher Scientific) with end-over-end rotation for 1 h. Lysosome-bound beads were washed with homogenization buffer three times. For immunoblotting, lysosomal proteins were eluted using SDS sample buffer. For the enzyme activity test, samples were snap-frozen with liquid nitrogen and then thawed at 37°C, repeating this cycle three times to disrupt the lysosomes in the samples and release the enzymes.
Measurement of SOD activity
SOD activity was detected using the xanthine oxidase coupling reaction system, as previously described (Beauchamp and Fridovich, 1971; Stewart and Bewley, 1980; Yang et al., 2015). Different samples were mixed with the reaction mixtures, which contained 2.4 μM riboflavin (A600470; Sangon Biotech), 0.01 M methionine (A100801; Sangon Biotech), 167 μM nitro blue tetrazolium (A610379; Sangon Biotech), and 0.05 M potassium phosphate at pH 7.2 or 5.2. The mixtures were incubated at 25°C under 2500 lux illumination for 0.5–1 h. Absorbance was then measured at 620 nm. The inhibition rate was calculated by dividing the decrease in absorbance in the experimental group by the decrease in absorbance in the control group. A standard curve was constructed using a standard SOD enzyme (S0086; Beyotime Biotechnology), based on the linear relationship between the reciprocal of enzyme activity and the reciprocal of inhibition rate. The enzyme activity of each sample was calculated based on its inhibition rate using this standard curve.
Measurement of catalase activity
Catalase activity was measured by using a Catalase Assay Kit (S0051; Beyotime Biotechnology) following the manufacturer’s instructions. The pH was adjusted with HCl.
Protein purification and in vitro pull-down assays
Proteins were expressed in E. coli BL21 cells (KTSM104L; Shenzhen KT life Bio) and Rosetta cells (KTSM106L; Shenzhen KT life Bio) grown in lysogeny broth medium at 16°C for 18 h, with induction by 0.2 mM isopropyl-β-D-thiogalactoside. Cells were harvested by centrifugation at 4°C and lysed with a buffer specific to the protein tag: for Trx-TP53INP1, the buffer was 50 mM Tris-HCl (pH 8.0), 1 M NaCl, and 7 M Urea, while for MBP-SOD1 and THIO-MBP, the buffer was 50 mM Tris-HCl (pH 8.0) and 1 M NaCl. Recombinant proteins were purified using a Ni2+-NTA affinity column (17531801; Cytiva), followed by Superdex 75 increase 10/300 size exclusion chromatography (29148721; Cytiva). The column buffer for Trx-tagged proteins was 50 mM Tris-HCl (pH 8.0), 500 mM NaCl, 1 mM DTT, and 1 mM EDTA, while for MBP-tagged proteins, it was 50 mM Tris-HCl (pH 8.0), 500 mM NaCl, 1 mM DTT, and 1 mM EDTA.
MBP-SOD1 and Trx-TP53INP1 were equilibrated in 700 μl of assay buffer (75 mM Tris, pH 8.0, 150 mM NaCl, and 1 mM DTT) and incubated overnight at 4°C with 10 μl of MBP-beads (E8021; New England Biolabs). The resin was then washed twice with the assay buffer, eluted using SDS sample buffer, and subsequently analyzed by immunoblotting.
Purification of mouse brain vesicles by density gradient centrifugation
SOD1 G93A mice were kind gifts from Dr Yichang Jia at Tsinghua-Peking Joint Center for Life Sciences, Tsinghua University, Beijing, China. All mice were maintained with free access to food and water under specific pathogen-free conditions in the animal facility at Southern University of Science and Technology. All animal experiments were approved by the institutional committee of the university. To isolate brain vesicles, 6-mo-old mouse brains were homogenized in 3 ml of a buffer containing 250 mM sucrose, 20 mM Tris-HCl (pH 7.4), and 1 mM EDTA, supplemented with a protease inhibitor. The homogenization process was carried out using a Dounce homogenizer with a tight pestle, performing 50–80 strokes on ice. Subsequently, the homogenate was centrifuged at 4,800 g for 10 min to remove the pellet and collect the supernatant. The supernatant was then centrifuged at 20,000 g for 20 min to isolate the vesicle fraction as the pellet. The pellet was resuspended in 1.4 ml of homogenization buffer and mixed with 1 ml of 60% OptiPrep (D1556; Sigma-Aldrich). Layered OptiPrep solutions were prepared in the homogenization buffer: 2.4 ml of the diluted pellet in 25% OptiPrep, 1.8 ml in 20%, 2 ml in 15%, 2 ml in 10%, 2 ml in 5%, and 2.0 ml of homogenization buffer. The samples were then centrifuged at 150,200 g (34,488 rpm) using an SW40 rotor for 3 h at 4°C. Following centrifugation, the vesicle fraction shown in Fig. S3 P was used for immunoblotting analysis and NAG assays.
Quantification and statistical analysis
The immunoblotting and co-IP results presented are representative of at least three independent experiments. Sample sizes were determined based on preliminary experiments. For statistical analysis, cells or images were selected randomly. Fluorescence intensity along dotted lines was measured using ImageJ software. For KEGG pathway analysis, positive hits from CRISPRi screens were selected and analyzed with the DAVID tool (Huang da et al., 2009; Sherman et al., 2022) (https://davidbioinformatics.nih.gov/home.jsp). Levene’s test was employed to assess the equality of variances, and the normality of the data was evaluated using the Shapiro–Wilk test. Detailed statistical parameters, including sample size (n), mean, and SEM, are provided in the corresponding Fig. legends. Statistical significance was determined using one-way ANOVA, with a P value of <0.05 considered significant. Post hoc tests were conducted to further analyze the differences between groups. The Kolmogorov–Smirnov test was used to compare cumulative distributions. The Chi-square test was used to determine the significance of differences in percentages among groups.
Online supplemental material
Fig. S1 shows that the SOD1 is transported to lysosomes across different kinds of cell lines. Fig. S2 shows that the autophagy and the receptor TP53INP1 is required for delivering SOD1 to lysosomes. Fig. S3 shows that the THIO retains its catalase activity within lysosomes, and SOD1 is important for preserving lysosomal homeostasis. Table S1 shows the results from the genome-wide CRISPRi screen in 293T cells expressing mCherry-GFP-SOD1(WT). Table S2 shows the KEGG pathway analysis of the list of genes that caused reduction of the mCherry/GFP fluorescence intensity ratios from the mCherry-GFP-SOD1(WT) reporter in the genome-wide CRISPRi screen (Table S1). Table S3 shows the results from CRISPRi screen with the h2 sublibrary of the human CRISPRi-v2 library in 293T cells expressing mCherry-GFP-SOD1(G93A). Table S4 shows the KEGG pathway analysis of the list of genes that caused reduction of the mCherry/GFP fluorescence intensity ratios from the mCherry-GFP-SOD1(G93A) reporter in the CRISPRi screen with the h2 sublibrary of the human CRISPRi-v2 library (Table S3).
Data availability
All data are available in the main text or the supplemental materials. Further reasonable requests should be directed to and will be fulfilled by the lead contact, Yan G. Zhao ([email protected]).
Acknowledgments
We are grateful to Dr. Isabel Hanson for editing work.
This work was supported by the National Natural Science Foundation of China (32222021 and 32170753), the National Key Research and Development Program (2021YFA1300800), the Guangdong Innovative and Entrepreneurial Research Team Program (2021 ZT09Y104), the Shenzhen Talent Program (KQTD20210811090115021), the Shenzhen Science and Technology Program (ZDSYS20220402111000001), R&D Program of Guangzhou Laboratory (GZNL2024A01008), the Guangdong Program (2021QN02Y378), and SUSTech Distinguished Young Scientist Team Program.
Author contributions: Y. Zheng: conceptualization, data curation, formal analysis, investigation, methodology, and validation. M. Li: investigation. X. Chen: methodology and resources. Z. Zheng: validation. Z. Chen: validation. R. Tian: conceptualization, formal analysis, resources, supervision, and writing—review and editing. Y.G. Zhao: conceptualization, data curation, formal analysis, funding acquisition, investigation, project administration, supervision, visualization, and writing—original draft, review, and editing.
References
Author notes
Disclosures: The authors declare no competing interests exist.