


Gametogenesis requires packaging of the cellular components needed for the next generation. In budding yeast, this process includes degradation of many mitotically stable proteins, followed by their resynthesis. Here, we show that one such case—Superoxide dismutase 1 (Sod1), a protein that commonly aggregates in human ALS patients—is regulated by an integrated set of events, beginning with the formation of pre-meiotic Sod1 aggregates. This is followed by degradation of a subset of the prior Sod1 pool and clearance of Sod1 aggregates. As degradation progresses, Sod1 protein production is transiently blocked during mid-meiotic stages by transcription of an extended and poorly translated SOD1 mRNA isoform, SOD1LUTI. Expression of SOD1LUTI is induced by the Unfolded Protein Response, and it acts to repress canonical SOD1 mRNA expression. SOD1LUTI is no longer expressed following the meiotic divisions, enabling a resurgence of canonical mRNA and synthesis of new Sod1 protein such that gametes inherit a full complement of Sod1 protein. Failure to aggregate and degrade Sod1 results in reduced gamete fitness in the presence of oxidants, highlighting the importance of this regulation. Investigation of Sod1 during yeast gametogenesis, an unusual cellular context in which Sod1 levels are tightly regulated, could shed light on conserved aspects of its aggregation and degradation, with relevance to understanding Sod1’s role in human disease.

Introduction
The transformation of precursor cells into gametes by meiosis and gametogenesis is responsible for determining which cellular material is passed on to the next generation. In the budding yeast Saccharomyces cerevisiae, this complex differentiation program is driven by tightly regulated changes in protein synthesis for almost every annotated gene, including many with no established roles in meiosis or gamete formation (Brar et al., 2012). For many genes, this regulation is achieved through transcript toggling between the expression of a canonical mRNA isoform and a poorly translated Long Undecoded Transcript Isoform (LUTI). LUTIs are 5′-extended transcripts containing competitive upstream open reading frames (uORFs) whose translation represses translation of the main ORF (Chen et al., 2017; Tresenrider et al., 2021). Transcription of LUTIs interferes in cis with the downstream transcription start site that drives the canonical, translatable mRNA isoform (Chia et al., 2017). This noncanonical regulation is common during meiosis in budding yeast, regulating at least 8% of genes, and is a core part of the ER Unfolded Protein Response (UPRER) that long went unrecognized (Cheng et al., 2018; Van Dalfsen et al., 2018). LUTI-like regulation has also been found to control gene expression in diverse organisms, including human cells, flies, and plants (Corbin and Maniatis, 1989; Moseley et al., 2002; Sehgal et al., 2008; Hollerer et al., 2019; Jorgensen et al., 2020).
The functional significance of LUTI-based regulation has been shown for the kinetochore gene, NDC80 (Chen et al., 2017; Chia et al., 2017), for which dynamic modulation of protein levels has a known role in chromosome segregation during meiosis (Miller et al., 2012). However, we previously identified hundreds of genes that seem to be regulated in this manner, including so-called housekeeping genes, which are thought to be constitutively expressed, and the role of this regulation in these cases remains unclear (Cheng et al., 2018). An example is SOD1, which encodes the highly abundant antioxidant enzyme Superoxide dismutase 1, a Cu-Zn superoxide dismutase that converts superoxide radicals into hydrogen peroxide and molecular oxygen (McCord and Fridovich, 1969). Sod1 is highly conserved from yeast to humans, and the human SOD1 gene can complement loss of the yeast gene (Corson et al., 1998). Human SOD1 (hSOD1) has been studied extensively due to its involvement in familial cases of Amyotrophic Lateral Sclerosis (fALS). Over 170 unique point mutations in the SOD1 gene have been identified in ALS patients (Saccon et al., 2013; Taylor et al., 2016), many of which increase the propensity of hSOD1 to form aggregates, particularly within tissues of the nervous system (Watanabe et al., 2001). Despite the discovery of Sod1’s association with ALS nearly 30 yr ago (Rosen et al., 1993), its precise role in disease progression remains unclear. Some models propose that Sod1 aggregates are toxic, whereas others propose that they may be protective (Gill et al., 2019). The links between Sod1’s aggregation, toxicity, and degradation have been difficult to mechanistically assess, in part due to the complex nature of the contexts in which aggregation has been observed (Pansarasa et al., 2018; Di Gregorio and Duennwald, 2018).
Sod1 is inherently highly stable in its fully folded and metalated state, even remaining enzymatically active at 90°C (Hallewell et al., 1991) and—most remarkably—in tissue from a 3,000-yr-old mummy (Weser et al., 1989). During exponential mitotic growth, yeast Sod1 is thought to be decreased not by active degradation but rather by passive dilution, along with 85% of the proteome (Christiano et al., 2014). We investigated the impact of LUTI regulation on Sod1 protein levels during gametogenesis and found that it drives transient inhibition of new Sod1 synthesis during the meiotic divisions, followed by rapid Sod1 protein repopulation. This pause in Sod1 synthesis coincides with degradation of preexisting Sod1, which begins prior to meiosis and follows the pervasive natural aggregation of wild-type protein. These findings reveal a complex and coordinated gene regulatory program during gametogenesis that achieves depletion of preexisting protein and replenishment of the Sod1 protein pool that is passed on to the next generation. Moreover, this work reveals yeast meiosis as a useful system for studying the differential regulation of wild-type and ALS-associated mutant Sod1 protein.
Results
An alternative transcript isoform is expressed from the SOD1 locus during meiosis
A previous global study from our lab identified a high degree of regulation for Sod1 during meiosis in budding yeast, with its translation and protein levels dropping in mid-meiosis and rising again as gametes (spores in yeast) are formed (Cheng et al., 2018). We also found SOD1 to be one of nearly 400 genes that showed signatures of LUTI-based regulation (Cheng et al., 2018), including an unexpectedly poor correlation between mRNA and protein levels over a 24-h meiotic time course (Fig. 1 A). Analysis of the SOD1 locus in these global datasets revealed that during mitotic (vegetative) growth and early in meiosis, budding yeast cells expressed the expected canonical SOD1 transcript (SOD1canon.), which is roughly 600 nucleotides long (Fig. 1 B). During the meiotic divisions, however, mRNA-seq read density extended from this canonical locus to a region 1.6 kb upstream of the canonical transcription start site (TSS), which appeared to be a result of production of an extremely 5′ extended mRNA isoform (Fig. 1 B). The presence of this elongated transcript was correlated with translation of an upstream open reading frame (uORF) that is housed in the extended 5′ transcript region, as well a decrease in ribosome footprint density mapping to the SOD1 ORF by ribosome profiling analysis (Fig. 1 B). These signatures of transcription and translation suggested that a LUTI was transiently expressed from the SOD1 locus during the meiotic divisions (Cheng et al., 2018). We became interested in studying this case further because Sod1 protein is thought to be constitutively and abundantly expressed, making temporary repression of its synthesis during meiosis surprising. Furthermore, whereas mitotically dividing cells lacking Sod1 show reduced fitness (Fig. S1 A), Sod1 is completely essential for the production of viable gametes (Fig. 1 C).
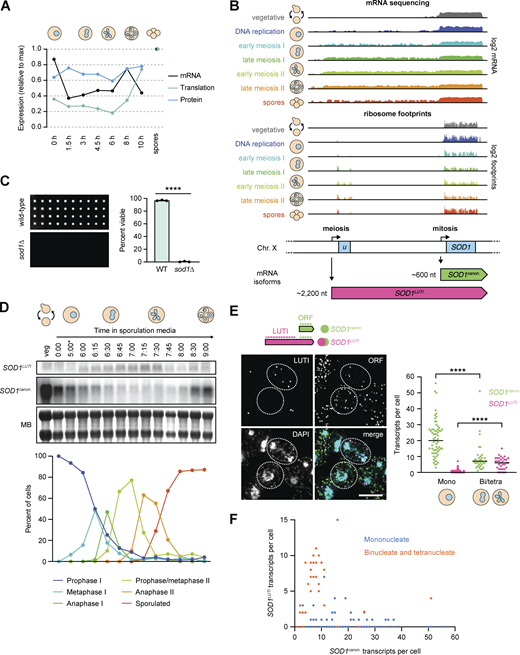
An alternative transcript isoform is expressed from the SOD1 locus during meiosis. (A) Matched relative expression of SOD1 mRNA, translation, and protein (Cheng et al., 2018). All values are normalized to max expression (spores). (B) mRNA-sequencing (top) and ribosome profiling (bottom) reads mapping to the SOD1 locus of the S. cerevisiae genome (on Chr. X) in vegetative growth and throughout a meiotic time course (Brar et al., 2012). During the meiotic divisions, ribosome footprints show translation of a uORF of 293 nucleotides. (C) Viability of spores derived from wild-type control and homozygous sod1∆ cells dissected on rich media (YEP + 2% dextrose) and incubated at 30°C for 48 h. Each column represents four spore colonies from the same tetrad, and quantification represents the average viability of 20 tetrads (n = 80 spores) of each genotype (biological triplicate). Error bars indicate standard deviation and data were analyzed by Welch’s t test (****, two-tailed P < 0.0001). (D) Northern blot probing for SOD1 mRNA (top) throughout an Ndt80-synchronized meiotic time course (MB = methylene blue, *pGAL-NDT80 release at 5 h) and matched tubulin immunofluorescence (bottom; at least 100 cells counted per time point). (E) Single molecule RNA fluorescence in situ hybridization (smRNA-FISH) probing for SOD1 mRNAs using two sets of probes (scale bar = 5 µm). Quantification of smRNA-FISH data in mononucleate (Mono) vs. binucleate/tetranucleate (Bi/tetra) cells shows a significant drop in SOD1canon. levels (Mann–Whitney U = 340, two-tailed P < 0.0001) and a significant increase in SOD1LUTI levels (Mann–Whitney U = 275.5, two-tailed P < 0.0001; mononucleate n = 66, binucleate/tetranucleate n = 34). (F) smRNA-FISH quantification of SOD1canon. (X axis) vs. SOD1LUTI (Y axis) transcripts per cell. For quantification in E and F, SOD1LUTI transcripts were defined as colocalized foci of “LUTI” and “ORF” probe sets (“LUTI”-only foci, representing ∼30% of LUTI probe signal, were excluded from analysis). Source data are available for this figure: SourceData F1.
An alternative transcript isoform is expressed from the SOD1 locus during meiosis. (A) Matched relative expression of SOD1 mRNA, translation, and protein (Cheng et al., 2018). All values are normalized to max expression (spores). (B) mRNA-sequencing (top) and ribosome profiling (bottom) reads mapping to the SOD1 locus of the S. cerevisiae genome (on Chr. X) in vegetative growth and throughout a meiotic time course (Brar et al., 2012). During the meiotic divisions, ribosome footprints show translation of a uORF of 293 nucleotides. (C) Viability of spores derived from wild-type control and homozygous sod1∆ cells dissected on rich media (YEP + 2% dextrose) and incubated at 30°C for 48 h. Each column represents four spore colonies from the same tetrad, and quantification represents the average viability of 20 tetrads (n = 80 spores) of each genotype (biological triplicate). Error bars indicate standard deviation and data were analyzed by Welch’s t test (****, two-tailed P < 0.0001). (D) Northern blot probing for SOD1 mRNA (top) throughout an Ndt80-synchronized meiotic time course (MB = methylene blue, *pGAL-NDT80 release at 5 h) and matched tubulin immunofluorescence (bottom; at least 100 cells counted per time point). (E) Single molecule RNA fluorescence in situ hybridization (smRNA-FISH) probing for SOD1 mRNAs using two sets of probes (scale bar = 5 µm). Quantification of smRNA-FISH data in mononucleate (Mono) vs. binucleate/tetranucleate (Bi/tetra) cells shows a significant drop in SOD1canon. levels (Mann–Whitney U = 340, two-tailed P < 0.0001) and a significant increase in SOD1LUTI levels (Mann–Whitney U = 275.5, two-tailed P < 0.0001; mononucleate n = 66, binucleate/tetranucleate n = 34). (F) smRNA-FISH quantification of SOD1canon. (X axis) vs. SOD1LUTI (Y axis) transcripts per cell. For quantification in E and F, SOD1LUTI transcripts were defined as colocalized foci of “LUTI” and “ORF” probe sets (“LUTI”-only foci, representing ∼30% of LUTI probe signal, were excluded from analysis). Source data are available for this figure: SourceData F1.
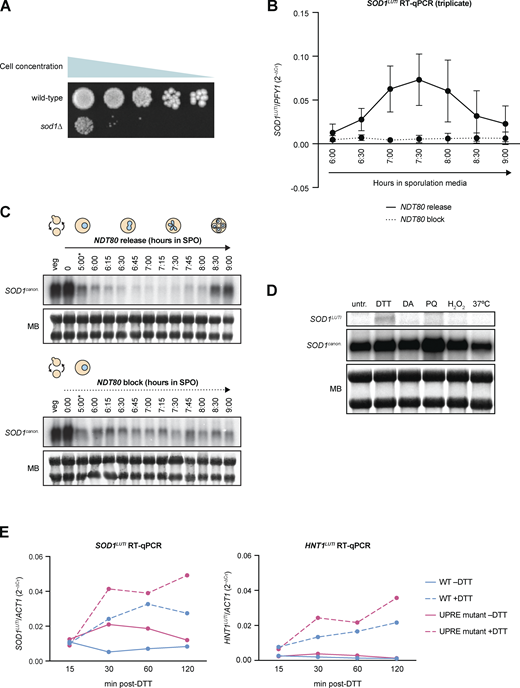
SOD1LUTI expression during meiosis and cellular stress. (A) Mitotic growth of wild-type and sod1∆ diploids. To assess mitotic growth, wild-type and sod1∆ strains were serial-diluted and plated on rich media (1X YEP with 2% dextrose). From left to right, OD600 values plated were 0.2, 0.04, 0.008, 0.0016, and 0.00032. Image shows growth after 72 h at 30°C. (B) RT-qPCR analysis of SOD1LUTI in the presence or absence of NDT80 expression (pGAL-NDT80 release at 5 h; error bars show standard deviation of biological triplicate experiments). (C) Northern blots probing for SOD1LUTI and SOD1canon. in the presence or absence of NDT80 (MB = methylene blue; *pGAL-NDT80 release at 5 h). (D)SOD1 mRNA expression under various stress conditions. Northern blotting for SOD1LUTI and SOD1canon. under stress conditions during vegetative exponential growth (MB = methylene blue). From left to right: untreated (untr.), 5 mM DTT (DTT), 1.5 mM diamide (DA), 1 mM paraquat (PQ), 0.3 mM hydrogen peroxide (H2O2), and 37°C heat shock (37°C). Conditions tested were based on Gasch et al. (2000), and samples were harvested 1 h after treatment. (E)SOD1LUTI and HNT1LUTI expression in wild-type and UPRE mutant cells upon UPRER activation. RT-qPCR analysis of SOD1LUTI and HNT1LUTI levels 15–120 min after treatment with 5 mM DTT. For RT-qPCR, cDNA was prepared from total RNA samples used in Fig. 3 D, and fold-change (2−∆CT) values were calculated using ACT1 mRNA as a control. HNT1LUTI is a positive control for UPRER induction (Van Dalfsen et al., 2018). Source data are available for this figure: SourceData FS1.
SOD1LUTI expression during meiosis and cellular stress. (A) Mitotic growth of wild-type and sod1∆ diploids. To assess mitotic growth, wild-type and sod1∆ strains were serial-diluted and plated on rich media (1X YEP with 2% dextrose). From left to right, OD600 values plated were 0.2, 0.04, 0.008, 0.0016, and 0.00032. Image shows growth after 72 h at 30°C. (B) RT-qPCR analysis of SOD1LUTI in the presence or absence of NDT80 expression (pGAL-NDT80 release at 5 h; error bars show standard deviation of biological triplicate experiments). (C) Northern blots probing for SOD1LUTI and SOD1canon. in the presence or absence of NDT80 (MB = methylene blue; *pGAL-NDT80 release at 5 h). (D)SOD1 mRNA expression under various stress conditions. Northern blotting for SOD1LUTI and SOD1canon. under stress conditions during vegetative exponential growth (MB = methylene blue). From left to right: untreated (untr.), 5 mM DTT (DTT), 1.5 mM diamide (DA), 1 mM paraquat (PQ), 0.3 mM hydrogen peroxide (H2O2), and 37°C heat shock (37°C). Conditions tested were based on Gasch et al. (2000), and samples were harvested 1 h after treatment. (E)SOD1LUTI and HNT1LUTI expression in wild-type and UPRE mutant cells upon UPRER activation. RT-qPCR analysis of SOD1LUTI and HNT1LUTI levels 15–120 min after treatment with 5 mM DTT. For RT-qPCR, cDNA was prepared from total RNA samples used in Fig. 3 D, and fold-change (2−∆CT) values were calculated using ACT1 mRNA as a control. HNT1LUTI is a positive control for UPRER induction (Van Dalfsen et al., 2018). Source data are available for this figure: SourceData FS1.
mRNA-seq data suggested that a 5′ extended SOD1 transcript (SOD1LUTI) of ∼2.2 kilobases (kb) in length was transiently produced during meiosis, but these data could not preclude the possibility that the mRNA read density represented an adjacent transcript. To test whether SOD1LUTI is expressed as a continuous mRNA, we performed northern blotting using a probe that hybridized to a sequence within the SOD1 ORF to detect both canonical (SOD1canon.) and LUTI (SOD1LUTI) transcripts. To increase temporal resolution of SOD1 mRNA expression changes, we used a strain expressing both pGAL-NDT80 and a GAL4-ER trans-activator, allowing us to arrest cells in prophase I until the addition of β-estradiol, which results in highly synchronous progression through subsequent meiotic stages (Carlile and Amon, 2008). During the meiotic divisions, approximately from metaphase I to anaphase II as assessed by tubulin immunofluorescence, SOD1canon. expression decreased dramatically, and this decrease corresponded in timing with appearance of a higher band that represents SOD1LUTI (Fig. 1 D). After both meiotic divisions occurred, LUTI expression decreased, and canonical mRNA was restored. This “transcript toggling” is a hallmark of LUTI-based regulation and suggests that SOD1LUTI blocks SOD1canon. expression through transcriptional interference (Chen et al., 2017; Chia et al., 2017; Cheng et al., 2018).
We further validated the expression of SOD1LUTI by single-molecule RNA fluorescence in situ hybridization (smRNA-FISH; Raj et al., 2008; Chen et al., 2018). Using two fluorescently labeled probe sets that hybridize to either shared sequences within the SOD1 ORF or LUTI-specific sequences, we visualized individual SOD1canon. and SOD1LUTI transcripts in single cells. To examine mRNA expression during meiosis, we fixed cells after 6 h in sporulation media (SPO) and counted transcript levels in mononucleate and binucleate/tetranucleate cells (Fig. 1 E). Signal representing LUTI-specific regions colocalized with SOD1 ORF regions in ∼70% of cases (173/241 foci), and these were the foci that we scored as representing LUTIs. Consistent with our population-based measurements (Fig. 1, B and D), in mononucleate cells which have yet to begin the process of chromosome segregation, SOD1canon. was expressed almost exclusively. In contrast, binucleate and tetranucleate cells (representing cells late in the first meiotic division and after) showed a significant reduction in SOD1canon. expression, which coincided with an increase in SOD1LUTI expression (Fig. 1 E). On a single-cell level, we observed an inverse relationship between LUTI and canonical transcript abundance, a defining feature of LUTI-based regulation (Fig. 1 F; Chen et al., 2017; Chia et al., 2017; Cheng et al., 2018; Van Dalfsen et al., 2018; Hollerer et al., 2019). Taken together, our northern blot and smRNA-FISH data support the existence of SOD1LUTI, a meiotic mRNA isoform that is associated with reduced canonical SOD1 mRNA expression.
SOD1LUTI expression depends on the meiotic program and is sufficient to downregulate canonical SOD1 mRNA
Because SOD1LUTI transcription is coincident with the meiotic nuclear divisions, we suspected that its expression was downstream of Ndt80, a transcription factor responsible for the induction of a large set of mid-meiotic genes and thus meiotic progression past prophase (Xu et al., 1995; Chu et al., 1998). After a 5-h incubation in sporulation media to synchronize pGAL-NDT80 cells in prophase, cultures were split and treated with β-estradiol (“NDT80 release”) or ethanol (vehicle control; “NDT80 block”). RT-qPCR analysis revealed that SOD1LUTI expression peaked between 2 and 3 h after β-estradiol treatment (7–8 total h in SPO) and was not observed in control samples (Fig. 2 A and Fig. S1 B). Comparison of SOD1canon. by northern blotting in the presence or absence of NDT80 expression showed that SOD1canon. levels decreased in both cases (Fig. 2 B and Fig. S1 C), but were lower when NDT80 was expressed, coincident with expression of SOD1LUTI (Fig. 2, A and B; and Fig. S1 B). These data demonstrate that SOD1LUTI acts downstream of NDT80 to repress SOD1canon. during meiosis. Based on the delayed timing of SOD1LUTI relative to known direct Ndt80 targets (Cheng et al., 2018) and the lack of characterized Ndt80-binding sites upstream of the LUTI TSS (Chu et al., 1998), it is likely that SOD1LUTI is not induced directly by Ndt80. We noted that the robust resurgence of canonical mRNA seen after the meiotic divisions is absent in cells lacking Ndt80 expression (Fig. 2 B and Fig. S1 C), indicating that both the strong decrease and eventual reappearance of translatable SOD1 mRNA depends on the meiotic program.
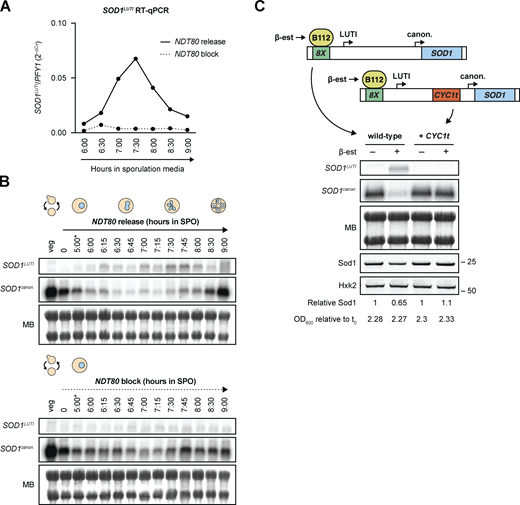
SOD1LUTIexpression depends on the meiotic program and is sufficient to downregulate canonical SOD1 mRNA. (A) RT-qPCR analysis of SOD1LUTI in the presence or absence of NDT80 expression (pGAL-NDT80 release at 5 h; one replicate of the data shown in Fig. S1 B). (B) Northern blots probing for SOD1LUTI and SOD1canon. in the presence or absence of NDT80 (MB = methylene blue; *pGAL-NDT80 release at 5 h). (C) Northern blot and SDS-PAGE immunoblot probing for SOD1 mRNA and Sod1 protein upon mitotic overexpression of SOD1LUTI via an inducible lexA/lexO system. To disrupt the LUTI, a transcriptional terminator (CYC1t) was inserted between the TSSs. Samples shown were harvested 2 h post-treatment with either vehicle control (100% ethanol) or 30 nM β-estradiol. Immunoblot quantification was performed by normalizing to Hexokinase (Hxk2) expression and “Relative Sod1” refers to expression of Sod1 in the treated vs. untreated sample for each genotype. Source data are available for this figure: SourceData F2.
SOD1LUTIexpression depends on the meiotic program and is sufficient to downregulate canonical SOD1 mRNA. (A) RT-qPCR analysis of SOD1LUTI in the presence or absence of NDT80 expression (pGAL-NDT80 release at 5 h; one replicate of the data shown in Fig. S1 B). (B) Northern blots probing for SOD1LUTI and SOD1canon. in the presence or absence of NDT80 (MB = methylene blue; *pGAL-NDT80 release at 5 h). (C) Northern blot and SDS-PAGE immunoblot probing for SOD1 mRNA and Sod1 protein upon mitotic overexpression of SOD1LUTI via an inducible lexA/lexO system. To disrupt the LUTI, a transcriptional terminator (CYC1t) was inserted between the TSSs. Samples shown were harvested 2 h post-treatment with either vehicle control (100% ethanol) or 30 nM β-estradiol. Immunoblot quantification was performed by normalizing to Hexokinase (Hxk2) expression and “Relative Sod1” refers to expression of Sod1 in the treated vs. untreated sample for each genotype. Source data are available for this figure: SourceData F2.
To test whether mitotic overexpression of SOD1LUTI is sufficient to reduce SOD1canon., we integrated an 8lexO array just upstream of the LUTI TSS, as determined by mRNA-seq and transcript leader (TL-seq) data (Brar et al., 2012; Chia et al., 2021), in a strain containing an inducible lexA trans-activator (B112) to allow conditional overexpression of SOD1LUTI (Ottoz et al., 2014). Indeed, during vegetative exponential growth, overexpression of SOD1LUTI results in a robust decrease in SOD1canon. (Fig. 2 C). Previous work has found that the characterized transcriptional repression associated with LUTI-based interference relies on transcription from the upstream LUTI TSS through the canonical promoter (Chia et al., 2017). To test whether this was the case for SOD1, we used CRISPR-Cas9 (Jinek et al., 2012; Anand et al., 2017) to insert a transcriptional terminator sequence from the CYC1 gene (CYC1t) prior to the canonical promoter and, consistently, observed no decrease in SOD1canon. in this case (Fig. 2 C). Given these results, we conclude that production of SOD1LUTI is both necessary and sufficient to drive down canonical SOD1 transcript levels.
The UPRER drives SOD1LUTI expression
The UPRER is naturally and transiently activated during meiosis (Brar et al., 2012; Cheng et al., 2018), reflected by translation of the UPRER transcription factor Hac1, the ortholog of metazoan XBP1. We noted that SOD1LUTI expression begins approximately when UPRER activation occurs and subsides when UPRER activation is no longer seen (Fig. 3 A). Furthermore, two putative Hac1 binding sites, or unfolded response elements (UPREs; Mori et al., 1992; Kohno et al., 1993; Fordyce et al., 2012), exist upstream of the SOD1LUTI TSS (Fig. 3 A). We therefore hypothesized that LUTI expression may be induced by UPRER activation. To test this, we treated mitotic cells during vegetative exponential growth with dithiothreitol (DTT) or tunicamycin (Tm), two drugs commonly used to activate the UPRER. We found that treatment with either drug drove SOD1LUTI expression as assessed by smRNA-FISH in wild-type cells (Fig. 3, B and C). This effect was largely dependent on the presence of Hac1 (Fig. 3, B and C), indicating that the conserved Hac1/XBP1 branch of the UPRER drives expression of SOD1LUTI. We also found that this regulation was not general to cellular stress, as no SOD1LUTI production resulted from other forms of oxidative stress or heat shock (Fig. S1 D).
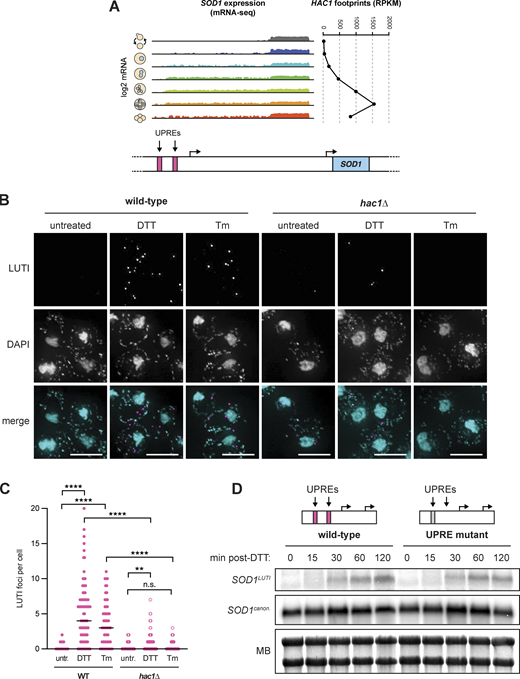
The UPRERdrives SOD1LUTIexpression. (A) mRNA-seq reads mapping to the SOD1 locus during meiosis (Brar et al., 2012) next to matched HAC1 translation data (ribosome footprints). (B) smRNA-FISH using the SOD1LUTI-specific probe set in wild-type and hac1∆ vegetative cells fixed 1 h after treatment with 5 mM DTT or 2 µg/ml Tm (scale bars = 5 µm). (C) Quantification of smRNA-FISH LUTI foci from experiment shown in 3B. For wild-type cells, significant increases in LUTI foci were observed with both DTT (Mann–Whitney U = 695.5, ****, two-tailed P < 0.0001) and Tm (Mann–Whitney U = 599.5, ****, two-tailed P < 0.0001). For hac1∆ cells, DTT still resulted in a significant increase in LUTI foci (Mann–Whitney U = 1,493, **, two-tailed P = 0.0038), but Tm did not (Mann–Whitney U = 972, not significant, two-tailed P = 0.5042). The differences between wild-type and hac1∆ cells treated with DTT (Mann–Whitney U = 1,117, ****, two-tailed P < 0.0001) and Tm (Mann–Whitney U = 354.4, ****, two-tailed P <0.0001) were also significant. Cell counts: WT untr. n = 74, WT DTT n = 86, WT Tm n = 56, hac1∆ untr. n = 52, hac1∆ DTT n = 77, hac1∆ Tm n = 40. (D) Northern blot probing for SOD1 mRNAs in wild-type and UPRE mutant vegetative exponential cultures 0–120 min after 5 mM DTT treatment. Source data are available for this figure: SourceData F3.
The UPRERdrives SOD1LUTIexpression. (A) mRNA-seq reads mapping to the SOD1 locus during meiosis (Brar et al., 2012) next to matched HAC1 translation data (ribosome footprints). (B) smRNA-FISH using the SOD1LUTI-specific probe set in wild-type and hac1∆ vegetative cells fixed 1 h after treatment with 5 mM DTT or 2 µg/ml Tm (scale bars = 5 µm). (C) Quantification of smRNA-FISH LUTI foci from experiment shown in 3B. For wild-type cells, significant increases in LUTI foci were observed with both DTT (Mann–Whitney U = 695.5, ****, two-tailed P < 0.0001) and Tm (Mann–Whitney U = 599.5, ****, two-tailed P < 0.0001). For hac1∆ cells, DTT still resulted in a significant increase in LUTI foci (Mann–Whitney U = 1,493, **, two-tailed P = 0.0038), but Tm did not (Mann–Whitney U = 972, not significant, two-tailed P = 0.5042). The differences between wild-type and hac1∆ cells treated with DTT (Mann–Whitney U = 1,117, ****, two-tailed P < 0.0001) and Tm (Mann–Whitney U = 354.4, ****, two-tailed P <0.0001) were also significant. Cell counts: WT untr. n = 74, WT DTT n = 86, WT Tm n = 56, hac1∆ untr. n = 52, hac1∆ DTT n = 77, hac1∆ Tm n = 40. (D) Northern blot probing for SOD1 mRNAs in wild-type and UPRE mutant vegetative exponential cultures 0–120 min after 5 mM DTT treatment. Source data are available for this figure: SourceData F3.
To determine the potential importance of the UPREs located upstream of the LUTI TSS, we used Cas9 to delete the proximal UPRE. Due to its overlap with a gene on the opposite strand (ECM27), we could not delete the distal UPRE and instead used Cas9 to scramble the sequence to abolish the predicted UPRE while maintaining the coding sequence of ECM27. When cells were treated with DTT during vegetative exponential growth, LUTI expression was still observed by northern blotting (Fig. 3 D) and RT-qPCR (Fig. S1 E) in the absence of both UPREs. From these data, we concluded that these predicted UPREs are not essential for SOD1LUTI expression. This result could indicate that either SOD1LUTI production is indirectly dependent on Hac1, or that it is dependent on Hac1 binding to elements other than these predicted UPREs. There is precedent for Hac1-dependent transcriptional activation through DNA motifs that have yet to be defined, as approximately half of known Hac1-dependent UPR targets identified by drug-based activation do not contain predicted UPREs within 1 kb of their TSS (Travers et al., 2000; Patil et al., 2004; Van Dalfsen et al., 2018).
SOD1LUTI expression and abatement modulate Sod1 levels
What impact does this transcript toggling have on meiotic Sod1 protein levels? The timing of SOD1LUTI expression during meiosis (Fig. 1 D), which drives loss of the canonical and translatable transcript (Fig. 2 C), was correlated with a steady decrease in Sod1 protein to less than half of vegetative levels after 8 h in sporulation media (Fig. 4 A). Furthermore, forced expression of SOD1LUTI in mitotic cells reduces Sod1 protein levels to ∼65% of wild-type levels, consistent with severely reduced new protein synthesis and dilution of the pre-existing pool by cellular division (Fig. 2 C). Following the meiotic divisions, Sod1 levels increased with timing that mirrored the return of SOD1canon. transcript levels (Fig. 1, B and D), with Sod1 protein returning to its early meiotic levels within 4 h and approaching vegetative abundance levels by 24 h, when spores are fully formed (Fig. 4 A). The timed loss and resurgence of Sod1 protein during meiosis that we observed using endogenously tagged Sod1-3V5 mirrored mass spectrometry results in a strain with untagged Sod1 protein (Fig. 1 A; Cheng et al., 2018), arguing that the 3V5 tag did not interfere with the normal regulation of Sod1 protein abundance in meiosis. Additionally, we observed a similar pattern of total Sod1 during meiosis in 8M urea-denatured lysates (Fig. S2 A), arguing that SDS-solubility changes in Sod1 did not drive these trends.
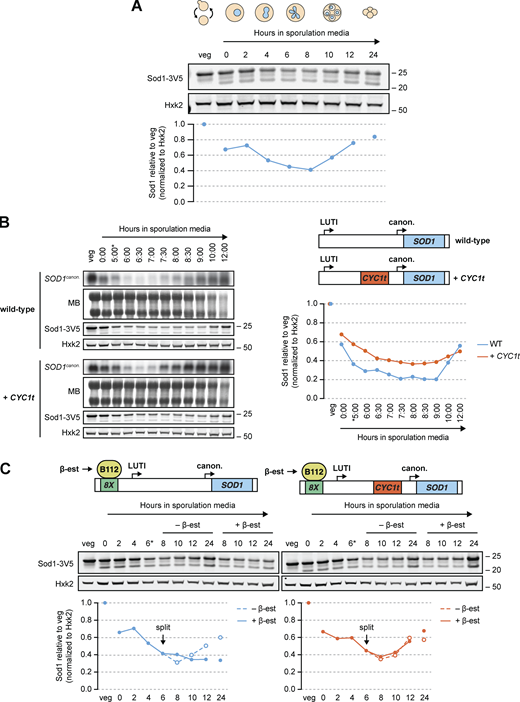
SOD1LUTIexpression and abatement modulate Sod1 levels. (A) SDS-PAGE and immunoblotting for Sod1 throughout a meiotic time course (quantification shown below). (B) Northern blots and SDS-PAGE immunoblots surveying SOD1 mRNA and Sod1 protein levels in Ndt80-synchronized cells with or without LUTI expression (MB = methylene blue, *pGAL-NDT80 release at 5 h). To disrupt the LUTI, a transcriptional terminator (CYC1t) was inserted between the TSSs. Immunoblot quantification (right) represents one replicate of the data in Fig. S2 B. (C) Sod1 protein levels in the presence or absence of LUTI overexpression mid-meiosis. To overexpress the LUTI, meiotic cultures of lexA/lexO strains (also used in Fig. 2 B) were split after 6 h in sporulation media and treated with either ethanol (vehicle control) or 30 nM β-estradiol (quantification shown below). Immunoblot quantification represents one replicate of the data in Fig. S2 D. Source data are available for this figure: SourceData F4.
SOD1LUTIexpression and abatement modulate Sod1 levels. (A) SDS-PAGE and immunoblotting for Sod1 throughout a meiotic time course (quantification shown below). (B) Northern blots and SDS-PAGE immunoblots surveying SOD1 mRNA and Sod1 protein levels in Ndt80-synchronized cells with or without LUTI expression (MB = methylene blue, *pGAL-NDT80 release at 5 h). To disrupt the LUTI, a transcriptional terminator (CYC1t) was inserted between the TSSs. Immunoblot quantification (right) represents one replicate of the data in Fig. S2 B. (C) Sod1 protein levels in the presence or absence of LUTI overexpression mid-meiosis. To overexpress the LUTI, meiotic cultures of lexA/lexO strains (also used in Fig. 2 B) were split after 6 h in sporulation media and treated with either ethanol (vehicle control) or 30 nM β-estradiol (quantification shown below). Immunoblot quantification represents one replicate of the data in Fig. S2 D. Source data are available for this figure: SourceData F4.
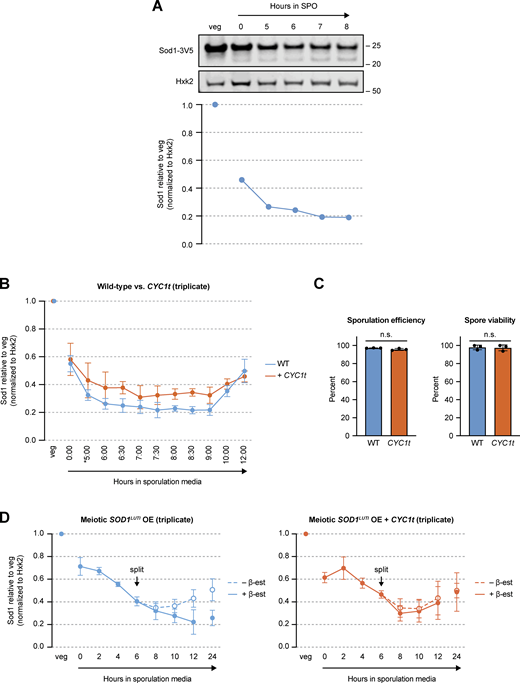
Sod1 protein levels with urea denaturation, SOD1LUTI disruption, and SOD1LUTI overexpression. (A) Total Sod1 protein decreases in meiotic, urea-denatured lysates. SDS-PAGE and immunoblotting for Sod1-3V5 in lysates prepared with 8M urea (quantification shown below). (B) Triplicate SDS-PAGE immunoblot quantification of the data presented in Fig. 4 B in synchronized cells with or without (+ CYC1t) LUTI expression (*pGAL-NDT80 release at 5 h; error bars show standard deviation of biological triplicate experiments). (C) Sporulation efficiency (n = 500 cells per replicate) and spore viability (n = 80 spore colonies per replicate) of wild-type (WT) and LUTI-disrupted (CYC1t) strains. Statistical significance was assessed using Welch’s t tests (sporulation efficiency two-tailed P = 0.1333; spore viability two-tailed P = 0.8726; error bars show standard deviation of biological triplicate experiments). (D) Triplicate SDS-PAGE immunoblot quantification of the data presented in Fig. 4 C (error bars show standard deviation of biological triplicate experiments). Source data are available for this figure: SourceData FS2.
Sod1 protein levels with urea denaturation, SOD1LUTI disruption, and SOD1LUTI overexpression. (A) Total Sod1 protein decreases in meiotic, urea-denatured lysates. SDS-PAGE and immunoblotting for Sod1-3V5 in lysates prepared with 8M urea (quantification shown below). (B) Triplicate SDS-PAGE immunoblot quantification of the data presented in Fig. 4 B in synchronized cells with or without (+ CYC1t) LUTI expression (*pGAL-NDT80 release at 5 h; error bars show standard deviation of biological triplicate experiments). (C) Sporulation efficiency (n = 500 cells per replicate) and spore viability (n = 80 spore colonies per replicate) of wild-type (WT) and LUTI-disrupted (CYC1t) strains. Statistical significance was assessed using Welch’s t tests (sporulation efficiency two-tailed P = 0.1333; spore viability two-tailed P = 0.8726; error bars show standard deviation of biological triplicate experiments). (D) Triplicate SDS-PAGE immunoblot quantification of the data presented in Fig. 4 C (error bars show standard deviation of biological triplicate experiments). Source data are available for this figure: SourceData FS2.
To directly test causality of SOD1LUTI expression on the loss of Sod1 protein in mid-meiosis, we inserted the CYC1 transcription termination sequence (CYC1t) between the distal and proximal TSSs at the endogenous SOD1 locus to prematurely terminate SOD1LUTI transcripts prior to the canonical TSS. Northern blotting of LUTI-disrupted cells demonstrated increased SOD1canon. abundance relative to wild-type during the period in which SOD1LUTI is typically expressed (Fig. 4 B). Some decrease in canonical transcript is seen even when the LUTI is disrupted by CYC1t insertion and the cause of this decrease is unknown, but a stronger and more sustained decrease in canonical SOD1 mRNA is seen when full-length SOD1LUTI is transcribed, demonstrating that SOD1LUTI transcription through the SOD1canon. TSS drives the bulk of the transient decrease in canonical mRNA that occurs during meiosis. Examination of Sod1 protein levels in these strains revealed LUTI-disrupted (+ CYC1t) cells to show a significant increase in Sod1 protein during mid-meiosis compared to wild-type controls (Fig. 4 B and Fig. S2 B), consistent with the hypothesis that the increase in SOD1canon. in the absence of LUTI-based repression leads to translation of new Sod1 protein.
After the meiotic divisions, SOD1LUTI expression ceases and SOD1canon. levels increase (Fig. 1, B and D; and Fig. 4 B), allowing for synthesis of new Sod1 protein concomitant with spore formation (Fig. 1 A; and Fig. 4, A and B). To test whether loss of LUTI production is needed for this resurgence of Sod1 protein levels, 8XlexO-driven SOD1LUTI was induced at 6 h after transfer to sporulation media, when most cells have progressed into meiosis II, a time after which SOD1LUTI expression normally ceases in cells synchronized by traditional nutritional cues alone (rather than the aforementioned pGAL-NDT80 system). As expected, ectopic SOD1LUTI expression in late meiosis effectively blocked the synthesis of new protein seen at late meiotic timepoints in the vehicle control (Fig. 4, C and Fig. S2 D). Thus, the precise timing of transient SOD1LUTI production controls a temporary cessation of Sod1 protein synthesis in mid-meiosis and its resurgence following the meiotic divisions, as gamete packaging is occurring.
Sod1 loss is proteasome dependent
Unlike in mitosis, dilution of cell contents through growth and cell division does not occur in meiosis. This means that a decrease in protein abundance indicates protein degradation under these conditions, which we have previously shown to be pervasive during budding yeast meiosis (Eisenberg et al., 2018). The loss of Sod1 protein that we observed was dependent on the meiotic program, as cells lacking Ime1, the transcription factor required for the expression of early meiotic genes and meiotic entry, showed an increase in Sod1 protein levels relative to wild-type controls in matched sporulation media (Fig. 5 A and Fig. S3 A). Furthermore, even in cells lacking LUTI-mediated SOD1canon. downregulation, decreased Sod1 protein levels were observed in mid-meiosis (Fig. 4 B and Fig. S3 B). The increase in Sod1 the absence of Ime1, and the decrease in its presence, began shortly after transfer to sporulation media, prior to the time that cells enter the meiotic divisions (Fig. 5 A and Fig. S3 A). This early onset of degradation is consistent with the finding that cells arrested in late prophase due to lack of Ndt80 displayed robust degradation of Sod1 (Fig. 5 B and Fig. S3 B). The reduced Sod1 protein levels in cells arrested in the absence of Ndt80 (Fig. 5 B) compared to those lacking LUTI production (+ CYC1t; Fig. 4 B) is interesting, considering that both backgrounds do not express SOD1LUTI, and suggests that protein degradation for Sod1 may actually be enhanced in the Ndt80-block condition relative to mid- to late-meiotic stages. Altogether, these findings show that degradation of Sod1 begins early in the meiotic program.
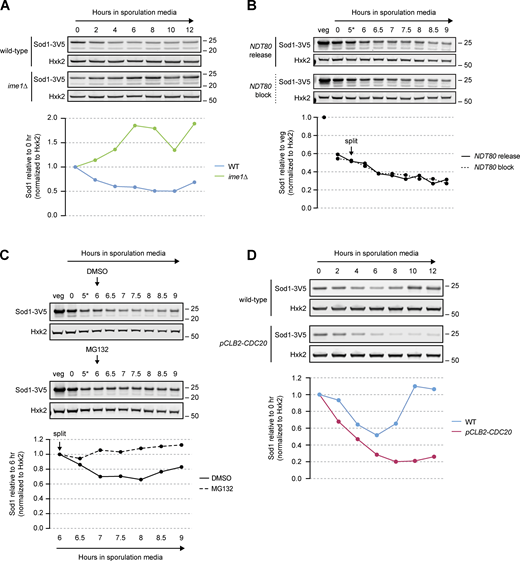
Sod1 loss is proteasome dependent. (A) SDS-PAGE and immunoblotting for Sod1 in wild-type and ime1∆ cells throughout a meiotic time course (quantification shown below). Immunoblot quantification represents one replicate of the data in Fig. S3 A. (B) SDS-PAGE and immunoblotting for Sod1 in the presence or absence of NDT80 expression (*pGAL-NDT80 release at 5 h; quantification shown below). Immunoblots represent one replicate of the data in Fig. S3 B. (C) SDS-PAGE and immunoblotting for Sod1 in the presence or absence of the proteasome inhibitor MG132 (*pGAL-NDT80 release at 5 h; quantification shown below). Cultures were split after 6 h in sporulation media and treated with either DMSO (vehicle control) or 100 μM MG132. A replicate experiment with a strain not expressing pGAL-NDT80 can be found in Fig. S3 D. (D) SDS-PAGE and immunoblotting for Sod1 in wild-type and pCLB2-CDC20 cells (quantification shown below). Immunoblot quantification represents one replicate of the data in Fig. S3 F. Source data are available for this figure: SourceData F5.
Sod1 loss is proteasome dependent. (A) SDS-PAGE and immunoblotting for Sod1 in wild-type and ime1∆ cells throughout a meiotic time course (quantification shown below). Immunoblot quantification represents one replicate of the data in Fig. S3 A. (B) SDS-PAGE and immunoblotting for Sod1 in the presence or absence of NDT80 expression (*pGAL-NDT80 release at 5 h; quantification shown below). Immunoblots represent one replicate of the data in Fig. S3 B. (C) SDS-PAGE and immunoblotting for Sod1 in the presence or absence of the proteasome inhibitor MG132 (*pGAL-NDT80 release at 5 h; quantification shown below). Cultures were split after 6 h in sporulation media and treated with either DMSO (vehicle control) or 100 μM MG132. A replicate experiment with a strain not expressing pGAL-NDT80 can be found in Fig. S3 D. (D) SDS-PAGE and immunoblotting for Sod1 in wild-type and pCLB2-CDC20 cells (quantification shown below). Immunoblot quantification represents one replicate of the data in Fig. S3 F. Source data are available for this figure: SourceData F5.
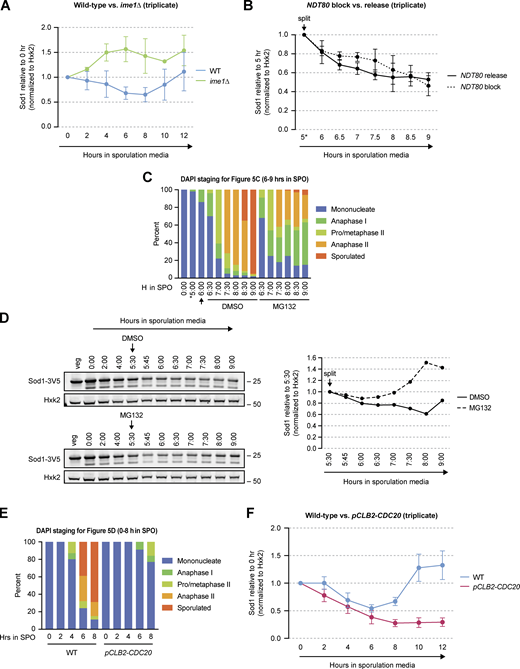
Sod1 levels with meiotic progression disruption and proteasome inhibition. (A) Triplicate SDS-PAGE immunoblot quantification of the data presented in Fig. 5 A (error bars show standard deviation of biological triplicate experiments). (B) Triplicate SDS-PAGE immunoblot quantification of the data presented in Fig. 5 B (Sod1 levels are relative to the 5 h time point at the time cultures were split; error bars show standard deviation of biological triplicate experiments). (C) DAPI staging for the experiment shown in Fig. 5 C (n = 100 cells per time point). Arrow indicates time of MG132 or DMSO (vehicle control) addition. (D) SDS-PAGE and immunoblotting for Sod1 in the presence or absence of the proteasome inhibitor MG132 (quantification shown to the right). Cultures were split after 5.5 h in sporulation media and treated with either DMSO (vehicle control) or 100 μM MG132. (E) DAPI staging for the experiment shown in Fig. 5 D (n = 100 cells per time point). (F) Triplicate SDS-PAGE immunoblot quantification of the data presented in Fig. 5 D (error bars show standard deviation of biological triplicate experiments). Source data are available for this figure: SourceData FS3.
Sod1 levels with meiotic progression disruption and proteasome inhibition. (A) Triplicate SDS-PAGE immunoblot quantification of the data presented in Fig. 5 A (error bars show standard deviation of biological triplicate experiments). (B) Triplicate SDS-PAGE immunoblot quantification of the data presented in Fig. 5 B (Sod1 levels are relative to the 5 h time point at the time cultures were split; error bars show standard deviation of biological triplicate experiments). (C) DAPI staging for the experiment shown in Fig. 5 C (n = 100 cells per time point). Arrow indicates time of MG132 or DMSO (vehicle control) addition. (D) SDS-PAGE and immunoblotting for Sod1 in the presence or absence of the proteasome inhibitor MG132 (quantification shown to the right). Cultures were split after 5.5 h in sporulation media and treated with either DMSO (vehicle control) or 100 μM MG132. (E) DAPI staging for the experiment shown in Fig. 5 D (n = 100 cells per time point). (F) Triplicate SDS-PAGE immunoblot quantification of the data presented in Fig. 5 D (error bars show standard deviation of biological triplicate experiments). Source data are available for this figure: SourceData FS3.
The ubiquitin proteasome system targets proteins for degradation by the proteasome, a large, ATP-powered complex. During budding yeast meiosis, virtually all components of the proteasome are upregulated. This upregulation peaks in late prophase at fivefold above what is observed in mitotic cells (Brar et al., 2012; Cheng et al., 2018; Eisenberg et al., 2018), which suggests elevated general proteasome activity. To determine if the meiotic decrease in Sod1 is mediated by the proteasome, we measured Sod1 levels in pGAL-NDT80 cells treated with the proteasome inhibitor MG132 compared to vehicle control-treated cells. Because the proteasome is essential for the meiotic divisions, we timed MG132 treatment to minimize disruption of the divisions but to still fall within the window when Sod1 levels are decreasing. Upon MG132 treatment, 1 h after β-estradiol-driven-Ndt80 expression, Sod1 protein levels did not continue to decline (Fig. 5 C), demonstrating that proteasome activity contributes to the mid-meiotic decrease in its abundance. We also observed a consistent disruption of Sod1 protein degradation in traditionally synchronized cells treated with MG132 (Fig. S3 D). To assess whether the effect of MG132 treatment was due to poor progression past the anaphase transitions that is inherent to proteasome inhibition (Fig. S3 C), we assessed Sod1 levels in cells expressing a meiotic null allele of Cdc20 (pCLB2-CDC20), a genetic background that prevents cells from completing anaphase I (Lee and Amon, 2003; Fig. S3 E). Sod1 levels still decreased in pCLB2-CDC20 cells (Fig. 5 D and Fig. S3 F), in fact to a greater degree than wild-type cells, arguing that the stabilized Sod1 levels observed with MG132 treatment are due to proteasome inhibition and not disruption of the meiotic divisions.
Pre-meiotic Sod1 aggregates naturally occur and are cleared during the meiotic program
ALS-associated, aggregation-prone mutant hSOD1 exhibits increased turnover (Farrawell and Yerbury, 2021), leading us to consider the possibility that meiotic degradation of wild-type yeast Sod1 could be triggered by a change in its oligomerization status. To determine whether Sod1 aggregation was occurring in meiotic cells, we performed immunofluorescence (IF) on fixed meiotic cells expressing endogenous Sod1-3V5. We found that over 90% of cells contained at least one bright focus at the time that they were resuspended in sporulation media (Fig. 6, A and B), consistent with the presence of Sod1 aggregates (Zeineddine et al., 2015; Gill et al., 2019). In contrast, mitotic cells in rich media did not contain bright foci of this nature and instead demonstrated heterogeneous, grainy Sod1 staining (YPD; Fig. 6 C). As cells progressed through meiosis, we saw disappearance of these foci with timing similar to the decrease in overall Sod1 protein levels, as assessed by SDS-PAGE (Fig. 4 A; and Fig. 6, A and B). Staging of cells fixed after 6–8 h in sporulation media by DAPI staining revealed that only ∼20% of tetranucleate cells contain 1–2 foci, and none contained three or more, providing additional evidence that loss of foci takes place during the meiotic divisions (Fig. 6 B). Complementary analyses using per cell maximum intensity measurements of Sod1 signal revealed trends consistent with focus quantification (Fig. S4 A). Cells that were unable to enter the meiotic program due to the lack of Ime1 still formed Sod1 foci equivalently to matched wild-type controls, indicating that the trigger for focus formation is independent of meiotic entry (Fig. 6 D). However, the disappearance of Sod1 foci did not occur normally in cells lacking Ime1, which indicates that their removal is a programmed part of meiosis (Fig. 6 D and Fig. S4 B).
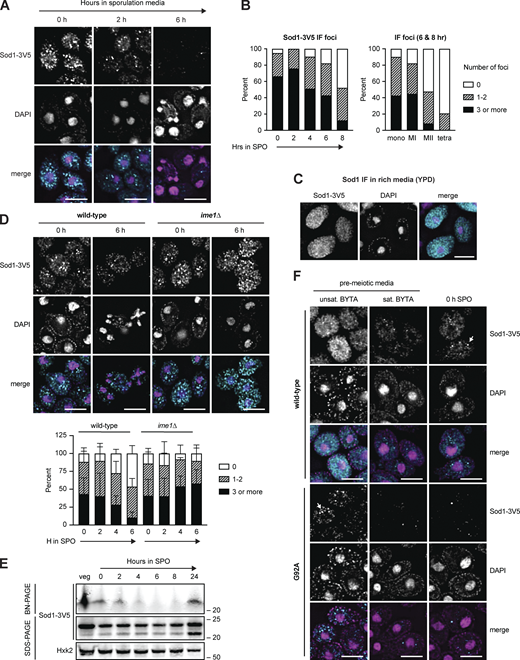
Pre-meiotic Sod1 aggregates naturally occur and are cleared during the meiotic program. (A) Immunofluorescence (IF) staining for Sod1 in cells fixed after 0, 2, and 6 h in sporulation media. (B) Quantification of the number of Sod1-3V5 IF foci in individual cells after 0–8 h in sporulation media (left) and quantification of IF signal appearance in mononucleate (mono, n = 152), meiosis I (MI, n = 67), meiosis II (MII, n = 82), and tetranucleate (tetra, n = 53) cells from 6- and 8-h samples (right). Data show 0 h (n = 134), 2 h (n = 158), 4 h (n = 135), 6 h (n = 191), and 8 h (n = 163) cells harvested from a single experiment. (C) IF staining for wild-type Sod1 in rich media (YPD) during exponential growth. (D) IF staining for Sod1 in wild-type and ime1∆ cells after 0 and 6 h in sporulation media. Quantification of Sod1 IF foci in wild-type and ime1∆ cells fixed after 0–6 h in sporulation media is shown below. Quantification was performed for three experimental replicates (n = 100 cells per time point per replicate). Error bars indicate standard deviation between replicates. (E) Blue native PAGE (BN-PAGE) and SDS-PAGE immunoblotting for Sod1 during a meiotic time course. (F) IF staining for wild-type and G92A mutant Sod1-3V5 in pre-meiotic (unsaturated and saturated BYTA) and meiotic media (0 h SPO). Identical exposure conditions were used during image acquisition, but post-acquisition exposures are different for wild-type and G92A micrographs to improve the visibility of G92A protein. All scale bars = 5 µm. Source data are available for this figure: SourceData F6.
Pre-meiotic Sod1 aggregates naturally occur and are cleared during the meiotic program. (A) Immunofluorescence (IF) staining for Sod1 in cells fixed after 0, 2, and 6 h in sporulation media. (B) Quantification of the number of Sod1-3V5 IF foci in individual cells after 0–8 h in sporulation media (left) and quantification of IF signal appearance in mononucleate (mono, n = 152), meiosis I (MI, n = 67), meiosis II (MII, n = 82), and tetranucleate (tetra, n = 53) cells from 6- and 8-h samples (right). Data show 0 h (n = 134), 2 h (n = 158), 4 h (n = 135), 6 h (n = 191), and 8 h (n = 163) cells harvested from a single experiment. (C) IF staining for wild-type Sod1 in rich media (YPD) during exponential growth. (D) IF staining for Sod1 in wild-type and ime1∆ cells after 0 and 6 h in sporulation media. Quantification of Sod1 IF foci in wild-type and ime1∆ cells fixed after 0–6 h in sporulation media is shown below. Quantification was performed for three experimental replicates (n = 100 cells per time point per replicate). Error bars indicate standard deviation between replicates. (E) Blue native PAGE (BN-PAGE) and SDS-PAGE immunoblotting for Sod1 during a meiotic time course. (F) IF staining for wild-type and G92A mutant Sod1-3V5 in pre-meiotic (unsaturated and saturated BYTA) and meiotic media (0 h SPO). Identical exposure conditions were used during image acquisition, but post-acquisition exposures are different for wild-type and G92A micrographs to improve the visibility of G92A protein. All scale bars = 5 µm. Source data are available for this figure: SourceData F6.
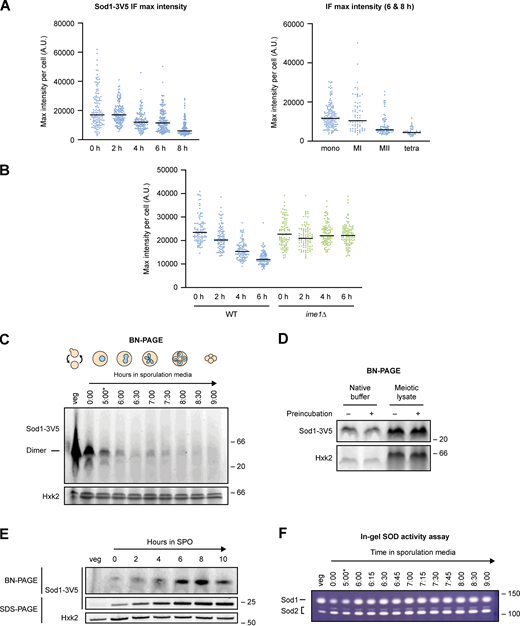
Immunofluorescence and native gel analysis of meiotic Sod1. (A) Maximum Sod1-3V5 IF intensities (A.U. = arbitrary units) per cell for the data shown in Fig. 6 B. The graph on the left shows maximum intensities for cells after 0–8 h in sporulation media, while the graph on the right shows maximum intensities for cells after 6–8 h in sporulation media that are sorted by meiotic stage based on DAPI staining (the 6–8 h cell population analyzed is the same in both graphs). Data show 0 h (n = 134), 2 h (n = 158), 4 h (n = 135), 6 h (n = 191), and 8 h (n = 163) cells harvested from a single experiment. (B) Maximum Sod1-3V5 IF intensities per cell for the data shown in Fig. 6 D. Quantification was performed for three biological replicates (n = 100 cells per time point per replicate). (C) Blue native PAGE (BN-PAGE) of Sod1-3V5 in meiosis. Soluble, dimeric Sod1-3V5 (42.6 kD) detected in vegetative and meiotic native lysates (*pGAL-NDT80 release at 5 h). (D) Vacuolar protease activity is not responsible for the loss of dimeric Sod1 from native meiotic lysates. Vegetative native lysate was incubated in either native buffer or meiotic lysate (prepared from meiotic sample harvested after 7 h in sporulation media) and either preincubated on ice for 30 min (+) or prepared fresh prior to loading (−). (E) Soluble, dimeric Sod1 is generated from a pATG8-SOD1-3V5 transgene. BN-PAGE (top) and SDS-PAGE (bottom) probing for Sod1-3V5 produced from a pATG8-driven transgene. (F) Sod enzymatic activity during meiosis. In-gel activity assay probing for Sod1 (top band) and Sod2 (bottom bands) activity in native lysates (*pGAL-NDT80 release at 5 h). Source data are available for this figure: SourceData FS4.
Immunofluorescence and native gel analysis of meiotic Sod1. (A) Maximum Sod1-3V5 IF intensities (A.U. = arbitrary units) per cell for the data shown in Fig. 6 B. The graph on the left shows maximum intensities for cells after 0–8 h in sporulation media, while the graph on the right shows maximum intensities for cells after 6–8 h in sporulation media that are sorted by meiotic stage based on DAPI staining (the 6–8 h cell population analyzed is the same in both graphs). Data show 0 h (n = 134), 2 h (n = 158), 4 h (n = 135), 6 h (n = 191), and 8 h (n = 163) cells harvested from a single experiment. (B) Maximum Sod1-3V5 IF intensities per cell for the data shown in Fig. 6 D. Quantification was performed for three biological replicates (n = 100 cells per time point per replicate). (C) Blue native PAGE (BN-PAGE) of Sod1-3V5 in meiosis. Soluble, dimeric Sod1-3V5 (42.6 kD) detected in vegetative and meiotic native lysates (*pGAL-NDT80 release at 5 h). (D) Vacuolar protease activity is not responsible for the loss of dimeric Sod1 from native meiotic lysates. Vegetative native lysate was incubated in either native buffer or meiotic lysate (prepared from meiotic sample harvested after 7 h in sporulation media) and either preincubated on ice for 30 min (+) or prepared fresh prior to loading (−). (E) Soluble, dimeric Sod1 is generated from a pATG8-SOD1-3V5 transgene. BN-PAGE (top) and SDS-PAGE (bottom) probing for Sod1-3V5 produced from a pATG8-driven transgene. (F) Sod enzymatic activity during meiosis. In-gel activity assay probing for Sod1 (top band) and Sod2 (bottom bands) activity in native lysates (*pGAL-NDT80 release at 5 h). Source data are available for this figure: SourceData FS4.
Properly folded and enzymatically active Sod1 exists as a homodimer. If Sod1 foci represented higher order multimers of Sod1, we would expect loss of this dimeric state by native gel analysis. Blue native polyacrylamide gel electrophoresis (BN-PAGE) and immunoblotting of endogenous Sod1-3V5 revealed abundant homodimer in vegetative native lysate (Fig. 6 E), but little to no soluble dimeric Sod1 during mid-meiosis, in contrast to the relatively moderate dip in denatured protein observed by SDS-PAGE (Fig. 4 A, Fig. 6 E, and Fig. S4 C). By 24 h in sporulation media, dimeric Sod1 becomes visible again, which we hypothesize represents new Sod1 synthesized late in sporulation. Because vacuolar protease activity is highly elevated during meiosis (Zubenko and Jones, 1981), we wondered whether the disappearance of dimeric Sod1 might be due to degradation following cell lysis during sample preparation. However, preincubating vegetative lysate in meiotic lysate on ice for 30 min prior to performing BN-PAGE revealed a similar level of soluble, dimeric Sod1 as without preincubation (Fig. S4 D), arguing that post-lysis degradation by proteases is not likely to be causing the disappearance of Sod1 dimer in meiotic lysates. Further, overexpression of 3V5-tagged Sod1 in meiosis through addition of a pATG8 transgene in strains housing endogenous, untagged Sod1 revealed soluble dimer during these mid-meiotic timepoints (Fig. S4 E), arguing that cellular conditions at these timepoints do not preclude the presence of soluble Sod1 dimer. We could not observe higher molecular weight species by BN-PAGE, which could be a result of the multiple centrifugation steps involved in the native extract preparation protocol. Together, these experiments support the model that formation of multimeric forms of wild-type Sod1 are triggered by pre-meiotic conditions, and that their removal is a natural aspect of the meiotic program.
Based on the focus formation observed by IF and the disappearance of soluble Sod1 dimer by BN-PAGE, we hypothesized that aggregation of Sod1 dimers was occurring prior to meiotic entry. If the foci we observed by IF indeed represented Sod1 aggregates, we hypothesized that their formation should be enhanced in cells carrying known aggregation-prone versions of Sod1. The G93A substitution was the first mutation that was well characterized in mouse models of ALS and has since been widely studied in both mouse and human cell line research of the disease (Mejzini et al., 2019). To study the behavior of aggregation-prone Sod1 in meiosis, we introduced this mutation (G92A in yeast) within the endogenous SOD1 gene. We performed IF on cells carrying either WT or G92A Sod1 in a variety of growth conditions, including exponential (unsat. BYTA [buffered yeast tryptone acetate]) and saturated (sat. BYTA) growth in pre-meiotic media. These conditions represent the set of nutrient states used to grow cells prior to synchronous induction of meiosis upon transfer to sporulation media. When cells expressing Sod1WT were incubated in pre-meiotic media (BYTA), which replaces glucose with acetate as a carbon source, discrete bright foci emerged as the cultures became saturated (Fig. 6 F). In contrast, cells expressing Sod1G92A showed clear, bright foci even in unsaturated BYTA, indicating a higher propensity to aggregate than WT protein.
ALS-associated mutant Sod1 is rapidly degraded in meiosis
By IF, Sod1G92A foci were readily observed in rich media and unsaturated growth in pre-meiotic media (Fig. 6 F). We noticed that these foci and almost all signal for Sod1G92A were dramatically reduced in saturated BYTA, a condition in which cells begin to express Ime1, the transcription factor responsible for initiating the meiotic program. Based on this observation, and the correlation between the timing of wild-type aggregate disappearance and degradation that we observed, we hypothesized that aggregation of Sod1 prior to meiosis leads to clearance of these aggregates during meiosis. Consistent with this hypothesis and IF data, Sod1G92A protein levels dropped markedly and prematurely relative to Sod1WT in the transition from rich media to sporulation media (Fig. 7 A and Fig. S5 A). Similar results were observed by analysis of a more common ALS-associated and aggregation prone Sod1 mutant, A4V (A3V in yeast). After 24 h in sporulation media, when wild-type protein levels have been restored, negligible amounts of Sod1G92A and Sod1A3V protein were present, indicating hyper-degradation, and decreased sporulation efficiency and poor colony growth were observed (Fig. S5 B).
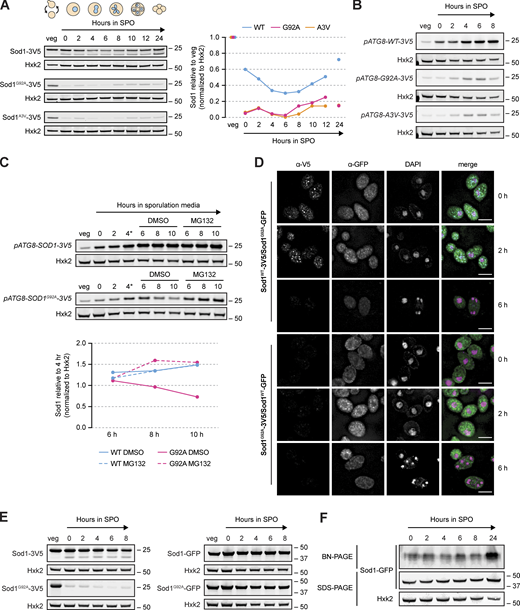
ALS-associated mutant Sod1 is rapidly degraded in meiosis. (A) SDS-PAGE and immunoblotting for Sod1WT, Sod1G92A, and Sod1A3V throughout a meiotic time course (quantification shown to the right). (B) SDS-PAGE and immunoblotting for Sod1 during meiosis in strains expressing pATG8-driven transgenes. (C) SDS-PAGE and immunoblotting for Sod1 during meiosis in strains expressing pATG8-SOD1WT-3V5 or pATG8-SOD1G92A-3V5 (*after 4 h in sporulation media, cultures were split and treated with either DMSO [vehicle control] or 100 μM MG132, quantification shown below). (D) IF staining for Sod1WT or Sod1G92A tagged with either 3V5 or GFP in trans-heterozygous strains after 0, 2, and 6 h in sporulation media. (E) SDS-PAGE and immunoblotting for Sod1WT or Sod1G92A tagged with either 3V5 or GFP in vegetative and meiotic media conditions. (F) Blue native PAGE (BN-PAGE) and immunoblotting for Sod1-GFP during a meiotic time course. All scale bars = 5 µm. Source data are available for this figure: SourceData F7.
ALS-associated mutant Sod1 is rapidly degraded in meiosis. (A) SDS-PAGE and immunoblotting for Sod1WT, Sod1G92A, and Sod1A3V throughout a meiotic time course (quantification shown to the right). (B) SDS-PAGE and immunoblotting for Sod1 during meiosis in strains expressing pATG8-driven transgenes. (C) SDS-PAGE and immunoblotting for Sod1 during meiosis in strains expressing pATG8-SOD1WT-3V5 or pATG8-SOD1G92A-3V5 (*after 4 h in sporulation media, cultures were split and treated with either DMSO [vehicle control] or 100 μM MG132, quantification shown below). (D) IF staining for Sod1WT or Sod1G92A tagged with either 3V5 or GFP in trans-heterozygous strains after 0, 2, and 6 h in sporulation media. (E) SDS-PAGE and immunoblotting for Sod1WT or Sod1G92A tagged with either 3V5 or GFP in vegetative and meiotic media conditions. (F) Blue native PAGE (BN-PAGE) and immunoblotting for Sod1-GFP during a meiotic time course. All scale bars = 5 µm. Source data are available for this figure: SourceData F7.
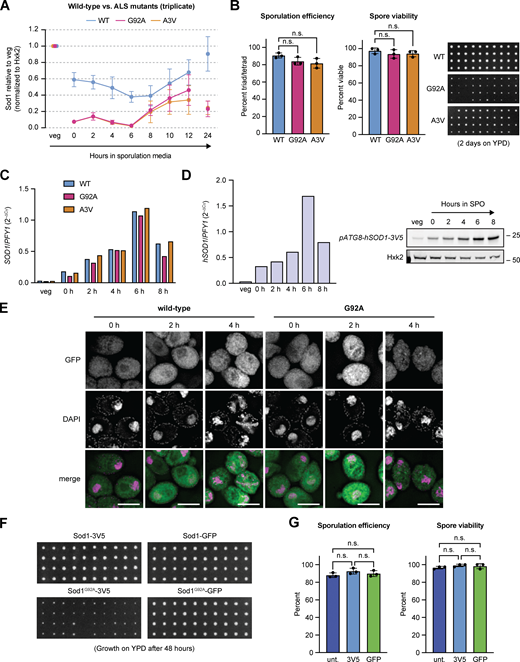
Expression and spore colony growth of aggregation-prone and GFP-stabilized Sod1. (A) Triplicate SDS-PAGE immunoblot quantification of the data presented in Fig. 7 A (error bars show standard deviation of biological triplicate experiments). (B) ALS-associated mutant Sod1 decreases sporulation efficiency and spore viability. To assess spore viability, 80 cells (20 tetrads) were dissected per genotype on YEP +2% dextrose and incubated at 30°C for 48 h. Statistical significance was assessed by Welch’s t test (not significant, WT vs. G92A sporulation efficiency two-tailed P = 0.1093; WT vs. A3V sporulation efficiency two-tailed P = 0.09; WT vs. G92A spore viability two-tailed P = 0.3481; WT vs. A3V spore viability two-tailed P = 0.304; error bars show standard deviation of biological triplicate experiments). Each column represents four spore colonies from the same tetrad. (C) Expression of pATG8-SOD1 transcripts. RT-qPCR analysis of wild-type, G92A, and A3V pATG8-SOD1 transcripts. For RT-qPCR, cDNA was prepared from total RNA samples matching SDS-PAGE samples shown in Fig. 7 B, and fold-change (2−∆CT) values were calculated using PFY1 mRNA as a control. To detect pATG8-SOD1 mRNA specifically, expression was assessed in sod1∆ strains. (D)pATG8-hSOD1 transcript and protein expression. Matched RT-qPCR (left) and SDS-PAGE immunoblot (right) showing expression from a pATG8-hSOD1 (yeast codon-optimized) transgene. For RT-qPCR, fold-change (2−∆CT) values were calculated using PFY1 mRNA as a control. Expression was assessed in a sod1∆ strain. (E) Sod1WT-GFP and Sod1G92A-GFP localization in fixed meiotic cells. Wild-type and G92A localization in cells fixed after 0, 2, and 4 h in sporulation media. Identical exposure conditions were used during image acquisition, but post-acquisition exposures are different for wild-type and G92A micrographs to improve the visibility of G92A protein (scale bars = 5 µm). (F) Wild-type and G92A spore viability with 3V5 and GFP tags. For each genotype, 80 cells (20 tetrads) were dissected on YEP +2% dextrose and incubated at 30°C for 48 h. Each column represents four spore colonies from the same tetrad. (G) Sporulation efficiency (n = 500 cells per replicate) and spore viability (n = 40 spore colonies per replicate) of untagged Sod1, Sod1-3V5, and Sod1-GFP strains. Statistical significance was assessed using Welch’s t tests (not significant; for sporulation efficiencies, untagged vs. 3V5 sporulation two-tailed P = 0.1335; untagged vs. GFP two-tailed P = 0.4943; 3V5 vs. GFP two-tailed P = 0.3716; for spore viability, untagged vs. 3V5 sporulation two-tailed P = 0.1012; untagged vs. GFP two-tailed P = 0.4382; 3V5 vs. GFP two-tailed P = 0.6856; error bars show standard deviation of biological triplicate experiments). Source data are available for this figure: SourceData FS5.
Expression and spore colony growth of aggregation-prone and GFP-stabilized Sod1. (A) Triplicate SDS-PAGE immunoblot quantification of the data presented in Fig. 7 A (error bars show standard deviation of biological triplicate experiments). (B) ALS-associated mutant Sod1 decreases sporulation efficiency and spore viability. To assess spore viability, 80 cells (20 tetrads) were dissected per genotype on YEP +2% dextrose and incubated at 30°C for 48 h. Statistical significance was assessed by Welch’s t test (not significant, WT vs. G92A sporulation efficiency two-tailed P = 0.1093; WT vs. A3V sporulation efficiency two-tailed P = 0.09; WT vs. G92A spore viability two-tailed P = 0.3481; WT vs. A3V spore viability two-tailed P = 0.304; error bars show standard deviation of biological triplicate experiments). Each column represents four spore colonies from the same tetrad. (C) Expression of pATG8-SOD1 transcripts. RT-qPCR analysis of wild-type, G92A, and A3V pATG8-SOD1 transcripts. For RT-qPCR, cDNA was prepared from total RNA samples matching SDS-PAGE samples shown in Fig. 7 B, and fold-change (2−∆CT) values were calculated using PFY1 mRNA as a control. To detect pATG8-SOD1 mRNA specifically, expression was assessed in sod1∆ strains. (D)pATG8-hSOD1 transcript and protein expression. Matched RT-qPCR (left) and SDS-PAGE immunoblot (right) showing expression from a pATG8-hSOD1 (yeast codon-optimized) transgene. For RT-qPCR, fold-change (2−∆CT) values were calculated using PFY1 mRNA as a control. Expression was assessed in a sod1∆ strain. (E) Sod1WT-GFP and Sod1G92A-GFP localization in fixed meiotic cells. Wild-type and G92A localization in cells fixed after 0, 2, and 4 h in sporulation media. Identical exposure conditions were used during image acquisition, but post-acquisition exposures are different for wild-type and G92A micrographs to improve the visibility of G92A protein (scale bars = 5 µm). (F) Wild-type and G92A spore viability with 3V5 and GFP tags. For each genotype, 80 cells (20 tetrads) were dissected on YEP +2% dextrose and incubated at 30°C for 48 h. Each column represents four spore colonies from the same tetrad. (G) Sporulation efficiency (n = 500 cells per replicate) and spore viability (n = 40 spore colonies per replicate) of untagged Sod1, Sod1-3V5, and Sod1-GFP strains. Statistical significance was assessed using Welch’s t tests (not significant; for sporulation efficiencies, untagged vs. 3V5 sporulation two-tailed P = 0.1335; untagged vs. GFP two-tailed P = 0.4943; 3V5 vs. GFP two-tailed P = 0.3716; for spore viability, untagged vs. 3V5 sporulation two-tailed P = 0.1012; untagged vs. GFP two-tailed P = 0.4382; 3V5 vs. GFP two-tailed P = 0.6856; error bars show standard deviation of biological triplicate experiments). Source data are available for this figure: SourceData FS5.
We next aimed to probe whether the increased degradation of aggregation-prone mutant versions of Sod1 occurred by the same proteasome-mediated route that we found to decrease wild-type Sod1 levels in meiosis, but inhibition of the proteasome prior to meiotic entry prevents cells from entering meiosis, when the bulk of degradation in these mutants was seen (Fig. 7 A and Fig. S5 A). Thus, we designed a strategy that would allow expression of Sod1G92A and Sod1A3V protein at high levels in meiosis, through placement of the gene for either wild-type or ALS mutant Sod1-3V5 from an ectopic locus under the control of a strong promoter (pATG8) that drives especially high expression in mid-to late-meiosis. SDS-PAGE analysis showed that Sod1G92A levels were substantially lower than wild-type protein expressed from the ATG8 promoter (Fig. 7 B), despite no appreciable differences in transcript abundance by RT-qPCR (Fig. S5 C). We observed similar results using cells carrying pATG8-SOD1A3V-3V5, but not those carrying human wild-type SOD1 (Fig. S5 D). Given the comparable mRNA levels between these strains and our previous finding that Sod1 is degraded by the proteasome during meiosis (Fig. 5 C and Fig. S3 D), we split cultures carrying pATG8-driven Sod1WT and Sod1G92A after 4 h in sporulation media and treated with either DMSO or MG132 to inhibit the proteasome. Monitoring protein expression revealed elevated, although not fully rescued, levels of meiotic expression of the overexpressed mutant protein with MG132 treatment (Fig. 7 C), indicating that the reduced expression levels of the ALS mutant Sod1 protein relative to wild-type protein are partially due to proteasome-mediated degradation.
To this point, our data support the model that pre-meiotic conditions in yeast drive aggregation of wild-type Sod1 protein, and the meiotic program drives removal of aggregates and degradation of Sod1. The timing of aggregate disappearance and the efficient degradation of aggregation prone ALS-associated mutant versions of Sod1 suggested that aggregates are targeted for degradation. This model would predict that a version of Sod1 that does not aggregate should not be degraded during the meiotic divisions. To test this, we analyzed cells with endogenously GFP-tagged Sod1. Previous work with Sod1-GFP has yielded confusing results, as it does not seem capable of forming aggregates, even when mutated at the sites representing aggregate-prone ALS mutations (Bastow et al., 2016). Consistent with published studies, we observed a relatively even distribution of endogenous Sod1WT-GFP and Sod1G92A-GFP in fixed cells in early meiosis (Fig. S5 E). Immunofluorescence also revealed no Sod1 foci for GFP-tagged protein, even when foci for Sod1-V5 were seen in the same diploid cells carrying one endogenous copy of Sod1 tagged with GFP and one with 3V5 (Fig. 7 D). Consistent with our microscopy data, SDS-PAGE analysis showed that both wild-type and G92A Sod1 were much more stable throughout meiosis when tagged with GFP, in contrast to the pattern seen for V5 or untagged Sod1 (Figs. 7 E, 4 A, and 1 A), as expected if preventing aggregation of Sod1 also prevents its meiotic degradation. Furthermore, BN-PAGE analysis of Sod1-GFP revealed soluble dimer throughout meiosis (Fig. 7 F) and Sod1G92A-GFP rescued the poor colony growth seen in cells expressing Sod1G92A-3V5 (Fig. S5 F). These data support the model that a failure of Sod1 to aggregate prevents its meiotic degradation.
What is the consequence of disrupting the normal cycle of meiotic degradation and resynthesis of Sod1? Neither disruption of LUTI production (+ CYC1t; Fig. 4 B) nor blocking Sod1 aggregation and degradation (Sod1-GFP; Fig. 7, D–F; and Fig. S5, E and F) reduced sporulation efficiency or viability on rich media, compared to wild-type controls (Fig. S2 C and Fig. S5 G). Further investigation of cells carrying Sod1-GFP revealed gamete fitness that slightly exceeded either untagged or 3V5-tagged controls, as assessed by spore colony size on rich media (Fig. 8 A). However, we reasoned that a failure to turnover preexisting Sod1 might result in a specific defect in gamete fitness under conditions of oxidative stress. To test this, we placed spores resulting from precursor cells carrying untagged Sod1, Sod1-3V5, and Sod1-GFP on rich media plates containing 0.25 mM paraquat, an oxidant that generates superoxide. This revealed a population of colonies that were small in the Sod1-GFP-derived spores specifically, reflecting significantly poorer growth than 3V5-tagged or untagged controls under these conditions (Fig. 8 B), and suggesting a physiological impact on gamete quality that results from failure of meiotic Sod1 turnover.

Model for the regulation of Sod1 protein during budding yeast meiosis. (A) Spore colony growth of tetrads derived from cells expressing untagged Sod1, Sod1-3V5, or Sod1-GFP on rich media after 48 h of growth at 30°C. For untagged control, n = 40 (single replicate), and for Sod1-3V5 and Sod1-GFP, n = 120 (biological triplicate, n = 40 per replicate). Differences between strains were analyzed by Welch’s t test (untagged vs. 3V5, not significant, two-tailed P = 0.3805; untagged vs. GFP, *, two-tailed P = 0.0178; 3V5 vs. GFP, **, two-tailed P = 0.0094). Each column represents four spore colonies from the same tetrad. (B) Spore colony growth of tetrads derived from cells expressing untagged Sod1, Sod1-3V5, or Sod1-GFP on rich media containing 0.25 mM paraquat (PQ) after 96 h of growth (in the dark) at 30°C. For untagged control, n = 40 (single replicate), and for Sod1-3V5 and Sod1-GFP, n = 120 (biological triplicate, n = 40 per replicate). Differences between strains were analyzed by Welch’s t test (untagged vs. 3V5, not significant, two-tailed P = 0.7259; untagged vs. GFP, **, two-tailed P = 0.009; 3V5 vs. GFP, **, two-tailed P = 0.002). The dotted line demarcates minimum colony area for the untagged control strain. Each column represents four spore colonies from the same tetrad. (C) Prior to entry into the meiotic program, a population of Sod1 is present in an aggregated form. When cells begin the meiotic differentiation program, upregulation of degradation factors, including the ubiquitin-proteasome system, leads to degradation of preexisting Sod protein. During the meiotic divisions, a gradual disappearance of these Sod1 aggregates occurs, which coincides with the expression of the UPRER-driven SOD1LUTI mRNA isoform that acts to antagonize SOD1canon. expression and therefore the synthesis of new Sod1 protein. LUTI expression ceases around the time that most cells no longer contain observable Sod1 aggregates, and restoration of canonical mRNA expression allows for the repopulation of cells with new Sod1 protein, which we hypothesize to be important for the generation of healthy, viable gametes.
Model for the regulation of Sod1 protein during budding yeast meiosis. (A) Spore colony growth of tetrads derived from cells expressing untagged Sod1, Sod1-3V5, or Sod1-GFP on rich media after 48 h of growth at 30°C. For untagged control, n = 40 (single replicate), and for Sod1-3V5 and Sod1-GFP, n = 120 (biological triplicate, n = 40 per replicate). Differences between strains were analyzed by Welch’s t test (untagged vs. 3V5, not significant, two-tailed P = 0.3805; untagged vs. GFP, *, two-tailed P = 0.0178; 3V5 vs. GFP, **, two-tailed P = 0.0094). Each column represents four spore colonies from the same tetrad. (B) Spore colony growth of tetrads derived from cells expressing untagged Sod1, Sod1-3V5, or Sod1-GFP on rich media containing 0.25 mM paraquat (PQ) after 96 h of growth (in the dark) at 30°C. For untagged control, n = 40 (single replicate), and for Sod1-3V5 and Sod1-GFP, n = 120 (biological triplicate, n = 40 per replicate). Differences between strains were analyzed by Welch’s t test (untagged vs. 3V5, not significant, two-tailed P = 0.7259; untagged vs. GFP, **, two-tailed P = 0.009; 3V5 vs. GFP, **, two-tailed P = 0.002). The dotted line demarcates minimum colony area for the untagged control strain. Each column represents four spore colonies from the same tetrad. (C) Prior to entry into the meiotic program, a population of Sod1 is present in an aggregated form. When cells begin the meiotic differentiation program, upregulation of degradation factors, including the ubiquitin-proteasome system, leads to degradation of preexisting Sod protein. During the meiotic divisions, a gradual disappearance of these Sod1 aggregates occurs, which coincides with the expression of the UPRER-driven SOD1LUTI mRNA isoform that acts to antagonize SOD1canon. expression and therefore the synthesis of new Sod1 protein. LUTI expression ceases around the time that most cells no longer contain observable Sod1 aggregates, and restoration of canonical mRNA expression allows for the repopulation of cells with new Sod1 protein, which we hypothesize to be important for the generation of healthy, viable gametes.
Together, our findings show that aggregation of existing wild-type Sod1 protein naturally occurs in pre-meiotic conditions, and that clearance of these aggregates is a programmed aspect of meiotic differentiation that begins early in the meiotic program. As clearance continues, Sod1 protein synthesis is halted during the meiotic divisions by the transient expression of a LUTI mRNA that is responsive to the UPRER. Loss of this repressive transcript allows Sod1 synthesis to resume, which we propose promotes the formation of robust gametes through repopulation of the Sod1 pool with new protein (Fig. 8 C).
Discussion
The goal of gametogenesis is to package the set of cellular materials required to produce a highly fit next generation. This includes creation of genetic diversity and segregation of critical cellular components. It also involves clearance of cellular damage, resulting in gametes that behave as “young” cells, regardless of progenitor cell age (Ünal et al., 2011). The factors that contribute to this natural rejuvenation are not yet known, but removal of preexisting nuclear, mitochondrial, and ER proteins has recently been shown to accompany the meiotic program (Sawyer et al., 2019; King et al., 2019; Otto et al., 2021). It is intriguing that, more broadly, many abundant “housekeeping” proteins are degraded during the meiotic program in budding yeast and resynthesized prior to gamete maturation (Eisenberg et al., 2018). These proteins, which include ribosomal subunits, nuclear pore complex components, and Sod1, are not typically degraded during mitotic division. However, their quality is critical to core cellular functions, and it is possible that ensuring this quality motivates the high energetic cost of their clearance and resynthesis. Here, we identify the complex set of regulatory events that enable resetting of Sod1 levels, an abundant and primarily cytosolic protein that is important for combatting oxidant-based cellular damage.
The appearance of aggregates of wild-type Sod1 in pre-meiotic cells was surprising and is, to our knowledge, the first time this has been observed to occur pervasively in healthy, wild-type cells. Why do aggregates form in pre-meiotic conditions? This remains an open question, but pre-meiotic media leads to increased respiration, which causes oxidative damage (Semchyshyn et al., 2011). In stationary-phase yeast, His71, His120, and Cys146 are oxidized, which results in the generation of enzymatically inactive, soluble protein aggregates (Martins and English, 2014). However, an in-gel activity assay showed that Sod1 remains enzymatically active throughout meiosis, even in an early meiotic time point when foci are most abundant by immunofluorescence (Fig. S4 F). Because Sod1 is only catalytically active as a dimer, we believe that the foci we observe represent clusters of dimeric and catalytically active Sod1 that are SDS-soluble. The nature of Sod1 aggregates observed upon mutation or in disease states has been controversial, with both SDS-soluble large aggregates and SDS-insoluble amyloids reported (Brotherton et al., 2013; Karch et al., 2009; Basso et al., 2009). It remains unclear the degree to which the foci that we observe resemble species seen in human pathogenic states, and defining their physical nature is an important future direction.
It is interesting to note that other protein aggregates have been shown to be cleared during gametogenesis in yeast. These include Hsp104-bound aggregates, which are thought to represent misfolded proteins, and which are prominent in aged cells (Ünal et al., 2011), as well as the natural Rim4 amyloid, which regulates translation of several key meiotic mRNAs (Berchowitz et al., 2015). The removal of Sod1 foci begins before clearance of both of these aggregate classes, indicating that multiple parallel routes to aggregate removal are part of the meiotic program.
What is the purpose of pre-meiotic Sod1 aggregation? It may simply be a side effect of the nutritional starvation that accompanies pre-meiotic conditions, or it may occur for the purpose of enabling meiotic degradation of preexisting Sod1 protein. Several lines of evidence suggest that, regardless of why aggregation occurs, it does facilitate Sod1 clearance. This evidence includes the timing of Sod1 foci disappearance which corresponds with the drop in total Sod1 protein levels, the hyper-degradation observed in Sod1 mutants that prematurely aggregate in pre-meiotic media, and the lack of degradation observed in cells expressing Sod1-GFP, which do not show evidence of aggregation. Although we were surprised to find such a striking difference between the aggregation and meiotic degradation of 3V5- vs. GFP-tagged Sod1, there is precedent for GFP-tagging of Sod1 altering its aggregation behavior in vitro (Stevens et al., 2010). Identifying the specific mechanism of Sod1 degradation in meiosis will clarify whether the aggregated and/or soluble Sod1 pools are targeted. At least a subset of meiotic Sod1 degradation is dependent on the proteasome, but the molecular adaptors involved remain unidentified, and it is possible that autophagy also acts parallel to remove meiotic Sod1. The failure of proteasome inhibition to fully rescue expression of Sod1G92A driven by the ATG8 promoter is consistent with this possibility (Fig. 7 C). Nevertheless, the active degradation of this key enzyme in meiosis contrasts with its regulation in nearly all other studied contexts.
GFP-tagged Sod1 represents a useful tool for probing the effects of meiotic Sod1 aggregation and clearance, given its resistance to both. We found that gametes derived from cells expressing Sod1-GFP are of high fitness under rich growth conditions but exhibit defects in generating robust colonies of cells in the presence of oxidative stress (Fig. 8, A and B; and Fig. S5, F and G). This result suggests physiological significance to the complex regulation for Sod1 during meiosis. Identifying the molecular basis for the defect is an exciting future direction of research. Gametes generated from Sod1-GFP cells would be expected to both have higher Sod1 levels than wild-type controls and to contain more preexisting Sod1 protein and it is currently unclear which of these contributes to their defect in oxidative stress tolerance. It is appealing to hypothesize that a subset of damaged preexisting protein is responsible for the poor fitness in oxidative stress conditions of Sod1-GFP-derived gametes, but further studies will determine whether this is indeed the case.
Sod1 is required for gamete viability in budding yeast (Fig. 1 C), but its specific critical function in gametogenesis is not known. Given the high degree of respiration required for meiosis, downregulation of Sod1 protein levels during this process may seem counterintuitive, but recent work argues that although it is best known for its antioxidant role, only a small fraction of this abundant enzyme is needed to protect cells from superoxide (Montllor-Albalate et al., 2019). This discrepancy was puzzling until Sod1 was found to play additional roles, including nutrient sensing and redox homeostasis (Reddi and Culotta, 2013; Montllor-Albalate et al., 2022). The specific roles that underlie its importance for meiosis remain unclear.
The cessation of Sod1 synthesis and its replenishment late in meiosis are driven by the activation and abatement, respectively, of SOD1LUTI expression. We found that this timing mirrors UPRER activation timing in meiosis, which we also found to be capable of SOD1LUTI production in a mitotic context. Our previous mRNA-seq study of cells treated with DTT did not identify SOD1LUTI as a Hac1 target (Van Dalfsen et al., 2018). However, this study used a highly stringent cut-off for UPRER-dependent LUTI production and the level of SOD1LUTI observed in this current study in response to mitotic UPRER activation is modest compared to the targets previously identified, although prominent in meiosis. This, together with the fact that SOD1LUTI production is dependent on the UPRER but not UPREs, suggests that either Hac1 is increasing the expression or activity of an unknown factor that is subsequently turning on SOD1LUTI or that Hac1 binds another sequence within the LUTI promoter. Given that the promoters of many validated Hac1 targets do not contain predicted UPREs (Travers et al., 2000; Patil et al., 2004), investigation of new modes of Hac1-induced transcription is warranted.
The LUTI isoform of SOD1 is nearly four times the length of SOD1canon., which is to our knowledge the most substantial size difference between LUTI and canonical isoforms observed to date, and is especially remarkable when considering the compact nature of the S. cerevisiae genome. The ability of LUTI-based regulation to temporarily pause production of housekeeping genes that are “on” by default is interesting. Such genes may be activated by multiple transcription factors and thus timed repression may be best achieved by simply silencing all transcription from the canonical transcription start site with a LUTI rather than use of specific transcriptional repressors. In the case of SOD1, timed toggling between two transcript isoforms of differential translatability, together with regulated aggregation and degradation, act in concert to remove a subset of preexisting Sod1 protein from eligibility for gamete inheritance and simultaneously replenish the Sod1 pool with new protein (Fig. 8 C). This elegant set of regulatory mechanisms achieves the regeneration of a housekeeping protein with established links to prevention of cellular aging. It is thus intriguing that it occurs during gametogenesis, a natural context of cellular rejuvenation. “Housekeeping” protein replenishment in gametes represents an exciting theme, and is also seen for the many other proteins, including other antioxidant enzymes and the proteins that make up ribosomes (Eisenberg et al., 2018).
Beyond its potential significance to gametogenesis, our findings also point to a new natural context in which to study important and unresolved aspects of Sod1’s role in human disease. Although hSOD1 abnormalities are most famously associated with ALS, its dysregulation is also seen in Down’s syndrome (Engidawork and Lubec, 2001), Parkinson’s (Trist et al., 2017), and cancer (Papa et al., 2014; Tsang et al., 2018; Liu et al., 2020; Wang et al., 2021). SOD1 aggregates have been proposed to lead to cellular toxicity, although it has also been argued that they serve a protective role in isolating populations of damaged hSOD1 to be targeted for degradation (Zhu et al., 2018; Gill et al., 2019). Discriminating between these hypotheses is not possible from studies of clinical samples and is challenging in complex mammalian model systems. The natural aggregation and clearance of Sod1 that we observe to occur as part of the meiotic program in budding yeast suggest that future studies of Sod1 in yeast meiosis have the potential to improve our understanding of how this protein's aggregation and degradation contribute to human disease states.
Materials and methods
Yeast strains and plasmids
All strains used in this study are derived from the SK1 strain of S. cerevisiae. Strain genotypes are listed in Table S1. The following alleles were constructed in previous studies: pGAL-NDT80 GAL4-ER (Carlile and Amon, 2008), lexA-B112-ER (Chia et al., 2017), hac1∆ (Van Dalfsen et al., 2018), pdr5∆ (Sawyer et al., 2019), and pCLB2-CDC20 (Lee and Amon, 2003).
To visualize Sod1 for immunoblotting and immunofluorescence, we C-terminally tagged endogenous Sod1 with 3V5 or yeast codon-optimized EGFP (yoEGFP). To induce SOD1LUTI mRNA overexpression, we engineered a strain expressing a chimeric lexA-B112 transcription factor with an estradiol-binding domain (lexA-B112-ER) and eight tandem lex operator sequences (8lexO) 1,680 bp upstream of the SOD1 ORF ATG. Positioning of the 8lexO array was informed by mRNA sequencing (Brar et al., 2012) and transcript leader sequencing (TL-seq) data (Chia et al., 2021). To overexpress either wild-type, G92A, A3V, or yeast codon-optimized human Sod1 in meiosis, we generated strains with pATG8-driven transgenes integrated at the HIS3 locus. To delete the SOD1 gene, the ORF was replaced with a KanMX6 marker in a wild-type, diploid strain. Transformant diploids were sporulated, then sod1∆ haploids were isolated and mated to generate a homozygous sod1∆ diploid strain.
LUTI disruption (CYC1t insertion), UPRE mutations, G92A and A3V mutations, and unmarked C-terminal 3V5 Sod1 tagging were performed using CRISPR-Cas9 (Jinek et al., 2012; Anand et al., 2017). To disrupt SOD1LUTI expression, the termination sequence from the CYC1 gene (CYC1t) was inserted between the LUTI and canonical TSSs. The 248 bp CYC1 terminator sequence was amplified from plasmid pÜB196 and inserted into the genome 278 bp upstream of the SOD1 ORF ATG. To mutate the unfolded protein response elements (UPREs) upstream of the LUTI TSS, the proximal UPRE (5′-ACACGT-3′) was deleted and the distal UPRE was scrambled (5′-TCGTGG-3′ to 5′-CCTAGG-3′). To target Cas9 to specific sites within the genome, Golden Gate cloning (Engler et al., 2008) was used to insert 20-nucleotide guide RNA (gRNA) sequences (found in Table S4) into a centromeric plasmid containing a URA3 marker and pPGK1-Cas9 (a gift from Gavin Schlissel, University of California, Berkeley, CA). Plasmids were then co-transformed into yeast cells with a repair template (see Table S2 for details). All repair templates used in this study were designed to simultaneously mutate the PAM sequence adjacent to the gRNA sequence. Once strains were sequence-validated, cells were cured of plasmid expression by streaking for singles on YPD and selecting colonies that no longer exhibited growth on –URA.
Yeast growth and sporulation conditions
To prepare cells for sporulation, diploid strains were patched out onto YPG (2% glycerol) plates and incubated at 30°C overnight. In the morning, strains were patched onto YPD 4% plates (1X YEP with 4% dextrose) and incubated at 30°C. Later that day, YPD (1X YEP with 2% dextrose, supplemented with Trp and Ura) cultures were inoculated with cells from YPD 4% plates and incubated at room temperature for 24 h. Once YPD culture volumes had reached a minimum OD600 of 10, cells were used to inoculate BYTA (buffered yeast tryptone acetate; 2% bacto tryptone, 1% yeast extract, 1% potassium acetate, 50 mM potassium phthalate) cultures at a starting OD600 of 0.25 and then incubated at 30°C overnight. Once cultures reached a minimum OD600 of 5, cells were pelleted at 1,900 rcf for 2 min, washed once with autoclaved MilliQ water, and resuspended to an OD600 of 1.85 in sporulation (SPO) media (2% [wt/vol] potassium acetate [pH 7], 0.02% [wt/vol] raffinose, supplemented with adenine, uracil, histidine, leucine, and tryptophan) and incubated at 30°C. To maintain proper aeration, all YPD, BYTA, and SPO culture volumes prepared for meiotic experiments did not exceed 1/10th of flask volumes.
For certain experiments, meiotic cultures were synchronized using the pGAL-NDT80 GAL4-ER system (Carlile and Amon 2008). After incubation at 30°C for 5 h, meiotic cultures were released from prophase I arrest by inducing NDT80 expression with the addition of β-estradiol (in 100% ethanol) to achieve a final concentration of 1 µM. For SOD1LUTI overexpression in mitosis or meiosis, expression was induced by adding β-estradiol to a final concentration of 30 nM. For vehicle control samples, an equal volume of 100% ethanol was added.
For vegetative experiments, strains were patched out onto YPG plates and incubated at 30°C overnight. The following morning, strains were patched onto YPD plates (1X YEP with 2% dextrose for haploids or 4% dextrose for diploids) and incubated at 30°C. Later that day, YPD cultures were inoculated with cells from YPD plates and incubated at 30°C overnight. The next day, YPD cultures were backdiluted to an OD600 of 0.05. For both LUTI overexpression and UPRER experiments, backdiluted YPDs were incubated at 30°C for 4 h, split into two cultures, treated with either a drug or vehicle control, and incubated at 30°C for 1–2 h. For matched vegetative samples accompanying meiosis experiments, backdilutions were prepared from the same saturated YPD cultures used to inoculate BYTAs and were incubated at 30°C for 4–5 h prior to sample collection.
UPRER induction
To activate the UPRER during vegetative exponential growth, cells were treated with stock solutions of dithiothreitol (DTT) or tunicamycin. For each experiment, a 1M stock solution of DTT (cat. no. 15508-013; Invitrogen) was prepared fresh, then added to cultures to achieve a final concentration of 5 mM. For tunicamycin (cat. no. 654380; Calbiochem) treatment, 25 mg/ml stocks (prepared in DMSO) were thawed from −80°C and added to cultures to achieve a final concentration of 2 µg/ml.
Proteasome inhibition
To inhibit the proteasome, cell cultures were treated with a 100 mM stock of MG132 (Z-Leu-Leu-Leu-al, C2211; Sigma-Aldrich) in DMSO to achieve a final concentration of 100 µM. All strains used in MG132 experiments have the PDR5 gene deleted, which encodes an ABC transporter, allowing for efficient uptake and retention of the drug (see strain genotypes listed in Table S1).
Sporulation efficiency
To assess sporulation efficiency, SPO cultures collected after 24 h at 30°C were examined using a light microscope to count unsporulated/mondads, dyads, triads, and tetrads. The reported sporulation efficiency percentages reflect the percentage of cells that formed either triads or tetrads. All sporulation efficiencies were counted without knowledge of the genotype prior to scoring.
Spore viability
To assess spore viability, 100 μl aliquots of SPO cultures collected after 24 h at 30°C were spun in 1.5 ml tubes at 1,900 rcf for 2 min at room temperature and SPO was removed from cell pellets by pipetting. To digest asci and allow for manual separation of individual spores on agar plates, cells were resuspended in 20 μl of (1 mg/ml) 100T zymolyase (cat. no. 08320932, MP Biomedicals or cat. no. 320932; VWR) and incubated at room temperature for 6–7 min. To stop digestion, 180 μl of MilliQ H2O was added to each sample, and 20 μl of digested cells were then pipetted down the midline of YPD agar plates (1X YEP with 2% dextrose). To assess spore growth in the presence of oxidative stress, YPD plates were prepared with 0.25 mM paraquat (from a 1 M liquid stock solution added after media had cooled to 55°C) and stored in the dark. Isolation of spores from the same tetrad was performed by microdissection using a fiberoptic needle attached to a Zeiss light microscope. For each experiment, 10–20 tetrads were dissected per genotype.
Spore colony size
To measure spore colony size, bright field images of agar dissection plates were analyzed in Fiji. Cropped images of dissected tetrads were converted to 8-bit, then the threshold was adjusted using the default “Huang” setting to define the colony boundary. Next, spore colony area was measured using the “Analyze Particles” function. Area values were then converted from arbitrary units to mm2 measurements based on the dimensions of the petri dishes used.
RNA extraction
To extract total RNA, 3.7–18.5 OD600 units of cells were spun at room temperature (1,900 rcf for vegetative samples and maximum speed for meiotic samples) for 1 min. After removing the supernatant, cell pellets were frozen in liquid nitrogen and stored at −80°C. Pellets were thawed on ice and resuspended in 600 μl each of TES (10 mM Tris, pH 7.5, 10 mM EDTA, 0.5% SDS) buffer and acid phenol (P4682; Sigma-Aldrich) and shaken at 1,400 rpm in a Thermomixer R (Eppendorf) for 1 h at 65°C. Samples were incubated on ice for 5 min, then spun at maximum speed for 10 min at 4°C. The aqueous phase was transferred to pre-chilled tubes containing 600 μl fresh acid phenol, samples were vortexed briefly to mix, then spun again at maximum speed for 10 min at 4°C. The aqueous phase was transferred to pre-chilled tubes containing 600 μl chloroform, vortexed briefly to mix, and spun at maximum speed for 5 min at 4°C. The aqueous phase was then transferred to pre-chilled 1.5 ml low-adhesion tubes containing 700 μl 100% isopropanol and 60 μl 3M NaOAc, pH 5.2. Tubes were inverted to mix, then stored at −20°C for a minimum of 2 h before pelleting at 13,000 rpm at 4°C for 5 min. After aspirating off the supernatant, RNA pellets were dried in a fume hood for 30–60 min until clear. Once dried, pellets were resuspended in DEPC treated water (volume varied depending on pellet size, but usually ranged from 25 to 100 μl). RNA samples were stored at −80°C and were thawed on ice and quantified on a NanoDrop 2000 (Thermo Fisher Scientific) prior to northern blotting or cDNA synthesis.
Northern blotting
RNA samples were thawed from −80°C on ice. Once thawed and quantified, 10 µg aliquots of RNA were speed-vacuumed (Savant Speed Vac SPD111V), resuspended in 20 μl 1X NorthernMAX dye (REF AM8552; Invitrogen), and denatured at 65°C for 15 min. Samples were then cooled on ice before being loaded into formaldehyde gels (6.66% formaldehyde, 1.2% agarose) and separated by electrophoresis in 1X MOPS buffer (1X MOPS, 2 mM NaOAc, 1 mM EDTA, pH 7). RNA was then transferred to Hybond N+ membranes (cat. no. RPN203B; GE Healthcare) by capillary action using 10X SSC (1.5 M NaCl, 150 mM Na3Citrat-2H2O) overnight. After transferring, RNA was UV-crosslinked to membranes using a crosslinker and rRNA was visualized by staining with methylene blue (0.3 M NaOAc, 0.02% methylene blue, pH 5.5) for 5 min at room temperature. Excess methylene blue was removed by washing membranes with source MilliQ (5X quick washes followed by 3X 2-min washes), then membranes were imaged on a Gel Doc XR+ (Bio-Rad). Membranes were then incubated with 22 ml ULTRAhyb hybridization buffer (cat. no. AM8669; Invitrogen) and 500 μl boiled sonicated salmon sperm DNA (cat. no. 201190-81; Agilent) for a minimum of 30 min at 68°C. Probe synthesis was performed as directed using the MaxiScript kit (cat. no. AM1314; Invitrogen). The SOD1 ORF probe template was synthesized by amplifying wild-type SK1 genomic DNA using primers with the sequences 5′-CAACCACTGTCTCTTACGAGATCGC-3′ and 5′-taatacgactcactataggCACCATTTTCGTCCGTCTTTACG-3′ (lowercase letters denote T7 promoter), which amplifies 201 bp of the SOD1 ORF. Upon addition of 2 μl T7 enzyme mix (REF 2719G; Invitrogen) and 5 μl 32α-UTP, probe mix was incubated at 37°C for 15 min. After synthesis, 1 μl of TURBO DNAse (REF 2238G2; Invitrogen) was added and probes were incubated at 37°C for 10 min. Before spinning the probe mix through a hydrated NucAway column (REF AM10070; Invitrogen), 1 μl of 0.5M EDTA, pH 8, was added. Probes were eluted through the columns by spinning at 3,000 rpm for 3 min at room temperature, then added to hybridization tubes and incubated at 68°C overnight. Low stringency (2X SSC, 0.1% SDS) and high stringency (0.1X SSC, 0.1% SDS) wash buffers were heated to 68°C prior to use. After overnight hybridization, excess probe mix was poured off, and membranes were washed 2X with low stringency buffer (10 min per wash) and 3X with high stringency buffer (15 min per wash) to remove any unbound probe. Phosphor imaging screens (Molecular Dynamics) were then exposed to membranes overnight and RNA was visualized using a Typhoon scanner (Typhoon 9400; Molecular Dynamics).
Single-molecule RNA fluorescence in situ hybridization (smRNA-FISH)
Single-molecule RNA FISH was performed as described in Chen et al. (2017) and Chen et al. (2018) (an adaptation of Raj et al., 2008 for budding yeast). Briefly, cells were fixed in 3% formaldehyde, incubated at room temperature for 20 min, then incubated at 4°C overnight. For meiotic experiments, cells were fixed after 6 h in sporulation media. For mitotic experiments involving UPRER induction, cells were fixed 1 h after drug treatment. The next day, cells were washed, digested, and hybridized with fluorescent probe sets in a formamide-based solution in the dark overnight. The probe sets hybridizing to the LUTI-specific sequences and sequences within the SOD1 ORF were conjugated to fluorophores Quasar 670 and CAL Fluor 590, respectively (Stellaris), and probe sequences are listed in Table S3. The following day, cells were washed and incubated with DAPI and anti-bleach reagents prior to imaging on a DeltaVision Elite Microscope (GE Healthcare). For all experiments, DAPI was visualized by UV excitation (exposure and transmission varied between experiments depending on staining intensity), LUTI probes were visualized by CY-5 excitation (1.3-s exposure, 100% transmission), ORF probes were visualized by TRITC excitation (1.3-s exposure, 100% transmission), and reference images were taken mid-stack using polarized light (0.1-s exposure, 32% transmission). Quantification of deconvolved smRNA-FISH images was performed using StarSearch (Raj et al., 2008) and cell boundaries were defined manually by tracing cells within a REF image using a drawing tablet (Wacom).
RT-qPCR
cDNA was prepared by first strand synthesis using the TURBO DNA-free Kit (REF AM1907; Invitrogen) and Superscript III (REF 5675; Invitrogen). First, 2.5 µg of total RNA was treated with DNase I and incubated at 37°C for 30 min. After inactivation with DNase Inactivation Reagent, 2 μl of DNase-treated RNA was combined with 4.5 μl of a master mix containing random hexamers Roche and dNTPs. Samples were incubated at 65°C for 5 min, then placed on ice. While on ice, 3.5 μl of RT master mix (1X first-strand buffer, DTT, RNaseOUT, SSIII [REF 56575; Invitrogen]) was added to each tube, then samples were incubated at 25°C for 5 min, 50°C for 1 h, and 70°C for 15 min. For RT-qPCR, 5.2 μl Absolute Blue SYBR Green ROX (REF AB-4162; Thermo Fisher Scientific) and 4.8 μl cDNA (diluted 1:20 prior to use) was added to each well of qPCR plates (REF 4346906; Life Technologies). Samples were run on a StepOnePlus RT-qPCR machine (Applied Biosystems). Average CT values of triplicate reactions were used to calculate expression changes. RT-qPCR data was normalized to ACT1 for mitotic experiments and PFY1 for meiotic experiments (primers listed in Table S3).
SDS-PAGE immunoblotting
To prepare lysates for SDS-PAGE, 3.7–9.25 OD600 units were pelleted at 1,900 rcf for 2 min at 4°C, resuspended in 2 ml of 5% trichloroacetic acid (SA433; Thermo Fisher Scientific) and incubated at 4°C for a minimum of 20 min. Samples were then spun at 1,900 rcf for 2 min at room temperature and cell pellets were washed by vortexing with 1 ml of 100% acetone. Samples were spun at maximum speed at room temperature for 5 min, acetone was pipetted off, and pellets were dried in a fume hood overnight. Once dried, pellets were resuspended in 100 μl of lysis buffer (50 mM Tris, pH 7.5, 1 mM EDTA, 3 mM DTT, 1X cOmplete protease inhibitor cocktail [SKU, 11836145001; Roche], 1.1 mM PMSF, and 1X Pepstatin A) and beaten on a bead-beater for 5 min at room temperature with 100 μl of acid-washed glass beads (cat. no. G8772; Sigma-Aldrich). Next, 50 μl of 3X SDS buffer (18.75 mM Tris, pH 6.8, 6% β-mercaptoethanol, 30% glycerol, 9% SDS, 0.05% bromophenol blue) was added, and samples were boiled at 95°C for 5 min. After boiling, samples were cooled at room temperature for at least 5 min before storing at −20°C.
Prior to loading, frozen SDS-PAGE samples were incubated at 37°C for 5 min, then spun at max speed for 5 min at room temperature. 4–8 μl of samples and 3 μl of Precision Plus Protein Dual Color Standard (cat. no. 1610374; Bio-Rad) were loaded into 4–12% Bis-Tris Bolt gels (Thermo Fisher Scientific) and run at 150 V for 45 min. Protein was then transferred to 0.45 µm nitrocellulose membranes (Bio-Rad) with cold 1X Trans-Blot Turbo buffer in a semi-dry transfer apparatus (Trans-Blot Turbo Transfer System, Bio-Rad). Membranes were incubated at room temperature for 90 min in a 1:1 blocking solution of 1X PBS and PBS Odyssey Blocking Buffer (cat. no. 927-4000, LI-COR) or PBS Intercept Blocking Buffer (cat. no. 927-70001, LI-COR) and incubated in primary antibody solutions at 4°C overnight. Membranes were then washed 4X with 1X PBS-(0.01%)T (5 min per wash) at room temperature before incubating in secondary antibody solutions at room temperature for 150 min. Membranes were washed 3X with PBS-(0.01%)T and once with 1X PBS (5 min per wash) at room temperature prior to imaging with the Odyssey system (LI-COR Biosciences).
All primary and secondary antibodies were diluted in PBS Odyssey Buffer or PBS Intercept Buffer with 0.01% Tween-20. Primary antibodies: mouse α-V5 antibody (R960-25; Thermo Fisher Scientific) used at a concentration of 1:2,000; rabbit α-hexokinase antibody (H2035; US Biological) used at a concentration of 1:5,000–1:10,000; mouse α-GFP JL-8 (cat. no. 632381; Takara) used at a concentration of 1:2,000. Secondary antibodies: goat α-mouse or α-rabbit secondary antibody conjugated to IRDye 800CW used at a concentration of 1:15,000 (926-32213; LI-COR); α-rabbit secondary conjugated to IRDye 680RD at a concentration of 1:15,000 (926-68071; LI-COR). Immunoblot quantification was performed by quantifying bands in Image Studio (LI-COR). For all blots quantified in this study, Hxk2 loading was normalized to vegetative expression (unless otherwise noted) and raw Sod1-3V5 signal was adjusted based on the corresponding normalized Hxk2 signal. The kD weight of relevant ladder bands is indicated on all SDS-PAGE images.
Urea denaturation
For the preparation of urea-denatured samples, 3.7–9.25 ODs of cells were pelleted at 1,900 rcf for 2 min at 4°C, cells were washed with 1 ml of 10 mM Tris, pH 7.5, spun at maximum speed for 1 min at 4°C, then flash-frozen in liquid nitrogen and stored at −80°C. Thawed pellets were resuspended with 200 μl urea buffer (8 M urea in 50 mM ammonium bicarbonate) and 200 μl 0.5 mm zirconia/silica beads (cat. no. 11079105z; BioSpec Products). Cells were lysed by bead-beating 4X (5 min per cycle) in pre-chilled metal blocks (samples were rested on ice for 2 min between cycles), then spun at 20,000 rcf for 10 min at 4°C. Supernatant was then transferred to pre-chilled low-adhesion 1.5 ml tubes and samples were spun at 20,000 rcf for 5 min at 4°C. After the second spin, supernatants were transferred to pre-chilled low-adhesion 1.5 ml tubes and quantified by Bradford (cat. no. 5000006; Bio-Rad). After quantification, 45 µg of total protein was brought to 60 μl in urea buffer and combined with 30 μl of 3X SDS buffer (18.75 mM Tris, pH 6.8, 6% β-mercaptoethanol, 30% glycerol, 9% SDS, 0.05% bromophenol blue). Samples were heated for 5 min at 37°C, then stored at −20°C. Urea-denatured samples were run using the same electrophoresis and immunoblot protocol as described for SDS-PAGE.
Blue native PAGE immunoblotting
Blue native PAGE (BN-PAGE) was performed as outlined by the NativePAGE Novex Bis-Tris Gel System manual (MAN0000557; Life Technologies). 3.7–9.25 ODs of cells were pelleted at 1,900 rcf for 2 min at 4°C, cells were washed with 1 ml of 10 mM Tris, pH 7.5, spun at maximum speed for 1 min at 4°C, then flash-frozen in liquid nitrogen and stored at −80°C. To prepare native lysates for BN-PAGE, cell pellets were thawed from −80°C on ice. Thawed pellets were resuspended with 200–300 μl native lysate buffer (1% NP-40 with 1X cOmplete protease inhibitor cocktail [SKU, 11836145001; Roche], 0.5 mM PMSF, and 1% digitonin [SKU D141; Millipore Sigma]) and 200 μl 0.5 mm zirconia/silica beads (cat. no. 11079105z; BioSpec Products). Cell lysis was performed by mechanical disruption using either a FastPrep (MP Biomedicals) or standard bead-beater fitted with pre-chilled metal blocks (samples were rested on ice for 2 min between cycles). Following FastPrep lysis, tubes were punctured using 20.5-G needles, then nested in 15 ml conical tubes containing p1000 tips. Samples were spun at 3,000 rpm for 20 s at 4°C, then the p1000 tip was used to transfer the flow-through to pre-chilled 1.5 ml low-adhesion tubes. Samples were then spun at 20,000 rcf for 10 min at 4°C, then supernatant was transferred to pre-chilled 1.5 ml low-adhesion tubes. An additional spin was performed at 20,000 rcf for 5 min at 4°C, then supernatant was transferred to pre-chilled low-adhesion tubes and quantified by Bradford (cat. no. 5000006; Bio-Rad).
Prior to loading, 10–20 µg of total protein of each sample was brought to an equal volume (in native lysis buffer) and 1–2.5 μl of G-250 additive was added to each sample. NativePAGE 4–16% Bis-Tris gels (cat. no. BN1004BOX; Invitrogen) were prepared by washing wells 3X with dH2O, then 3X with 1X dark blue cathode buffer. After sample loading, gels were run at 150 V for 90–120 min at 4°C using the anode and cathode buffers outlined in the NativePAGE manual. Transfer to methanol-activated 0.2 µm Immun-Blot PVDF membranes (cat. no. 1620177; Bio-Rad) was performed at 30 V for 1 h at 4°C in 1X NuPAGE buffer (REF NP0006-1; Life Technologies). After transfer, PVDF membranes were incubated in 8% actetic acid for 15 min at room temperature. A 5-min methanol wash was performed to remove excess Coomassie, then membranes were washed 3X in dH2O. After this point, blocking, 1° and 2° incubations, and washes were performed as described above for SDS-PAGE immunoblotting.
Sod in-gel activity assay
Native lysates were prepared following a protocol from Valeria Culotta (Johns Hopkins). 3.7–9.25 ODs of cells were pelleted at 1,900 rcf for 2 min at 4°C, washed with 1 ml of 10 mM Tris, pH 7.5, spun at maximum speed for 1 min at 4°C, then flash-frozen in liquid nitrogen and stored at −80°C. To prepare native lysates for activity assays, cells were thawed on ice and resuspended in 200–300 μl native lysis buffer (10 mM NaPi, pH 7.8, 0.1% Triton X-100, 5 mM EDTA, 5 mM EGTA, 50 mM NaCl, and 10% glycerol with 1X cOmplete protease inhibitor cocktail [SKU, 11836145001; Roche] and 1 mM PMSF) and 200 μl 0.5 mm zirconia/silica beads (cat. no. 11079105z; BioSpec Products). Cells were lysed by bead-beating 4X (5 min per cycle) in pre-chilled metal blocks (samples were rested on ice for 2 min between cycles), then spun at 20,000 rcf for 10 min at 4°C. Supernatant was then transferred to pre-chilled low-adhesion 1.5 ml tubes and samples were spun at 20,000 rcf for 5 min at 4°C. After the second spin, supernatants were transferred to pre-chilled low-adhesion 1.5 ml tubes and quantified by Bradford (cat. no. 5000006; Bio-Rad). Prior to loading, 10–20 µg of total protein of each sample was brought to an equal volume (in native lysis buffer), combined with 5X sample buffer (50% glycerol, 310 mM Tris, pH 6.8, 0.5% bromophenol blue; diluted to 1X), then loaded into 4–12% Novex Tris-glycine gels (Invitrogen; wells were washed thoroughly with dH2O prior to loading to avoid inhibition of Sod1 activity by sodium azide). Gels were run at 50 mA for 80–90 min at 4°C in 1X native gel running buffer (25 mM Tris base, 10 mM EDTA, 192 mM glycine). After running, gels were incubated in 35 ml of Sod staining solution (175 µM nitroblue tetrazolium and 280 µM riboflavin in 0.05M KPi, pH 7.8), 35 μl of TEMED (cat. no. 161–0800; Bio-Rad) was added to the staining solution, and gels were incubated in the dark at 4°C for 1 h. Sod staining solution was then removed, gels were washed 3X in dH2O, then incubated in dH2O at room temperature in the light to expose bands of Sod enzyme activity. Once sufficiently exposed, gels were placed in plastic sleeve protectors and scanned on a standard color scanner.
Immunofluorescence staining
To harvest meiotic cells for immunofluorescence, 450 μl aliquots of SPO cultures were added to tubes containing 50 μl of 37% formaldehyde (3.7% final; F79-500; Thermo Fisher Scientific) and incubated at 4°C overnight. The following day, samples were spun at 1,900 rcf for 2 min at room temperature, washed with 1 ml 0.1M KPi, pH 6.4, resuspended in 1 ml 1.2M sorbitol-citrate (100 µM K2HPO4, 36 µM citric acid, 1.2M D-sorbitol), and stored at −20°C. To permeabilize cells, samples were thawed at room temperature, then spheroplasted in digestion mix (8.9% glusulase [part no. NEE154001EA, PerkinElmer] and 1 mg/ml 100T zymolyase [cat. no. 08320932; MP Biomedicals or cat. no. 320932; VWR] in 1.2M sorbitol-citrate) by rotating at 30°C for 4–5 h (digestion was assessed by looking at cells on a light microscope). After spheroplasting, cells were spun at 900 rcf for 2 min, resuspended in 1 ml 1.2M sorbitol-citrate, spun at 1,900 rcf for 2 min, then resuspended in a variable volume (typically 25–100 μl) of 1.2M sorbitol-citrate to achieve satisfactory cell density for immunofluorescence. Prior to the addition of cells, wells of frosted microscope slides (design 161-041-122; TEKDON, Inc.) were treated with 0.1% (wt/vol) poly-L-lysine solution (cat. no. P8920; Sigma-Aldrich) for 5 min at room temperature, excess poly-L-lysine was aspirated off, and wells were allowed to air dry. To prepare cells for immunofluorescence, 5 μl of digested cell solutions were pipetted onto poly-L-lysine-treated wells and incubated at room temperature for 10 min. Excess cell solution was then aspirated off, and cell density was checked under a light microscope. Slides were incubated in cold methanol for 3 min, then placed directly in cold acetone for 10 s. After acetone incubation, slides were allowed to dry completely prior to addition of primary antibody solution.
For Sod1-3V5 immunofluorescence staining, 1:6 pre-absorbed mouse α-V5 primary antibody (R960-25; Thermo Fisher Scientific) was diluted to 1:800 in 1X PBS-BSA, 5 μl of primary dilution was added to each well, and slides were incubated at 4°C overnight. The next day, wells were washed 3X with 5 μl 1X PBS-BSA, 5 μl of secondary antibody solution (1:6 pre-absorbed α-mouse Cy3, diluted to 1:200 in 1X PBS-BSA; 115-165-003; Jackson ImmunoResearch Laboratories) was added to each well, and samples were incubated in the dark for 2.5 h at room temperature.
For tubulin immunofluorescence staining, rat α-tubulin primary antibody (RID AB_325005, MCA78G; Bio-Rad) was diluted 1:200 in 1X PBS-BSA, 5 μl of primary dilution was added to each well, and slides were incubated at 4°C overnight. The next day, wells were washed 2X with 1X-PBS-BSA, 5 μl of secondary antibody solution (1:6 pre-absorbed α-rat FITC, diluted to 1:200 in PBS-BSA; 712-095-153; Jackson ImmunoResearch Laboratories) was added to each well, and samples were incubated in the dark for 1 h at room temperature.
After 2-3X washes with 5 μl 1X PBS-BSA (3X for Sod1-3V5 staining and 2X for tubulin staining), a drop of VECTASHIELD with DAPI (REF H-1200; Vector Laboratories, Inc.) mounting media was added to each well before coverslip addition. Slides were sealed with clear nail polish and dried for at least 10 min prior to imaging or storage at −20°C.
Sod1-3V5 IF images were analyzed in Fiji. To quantify the number of foci within individual cells, the “Find Maxima” function was applied to all images with a prominence of either 5,000 or 10,000, depending on the experiment (value used was consistent within experimental replicates). To measure the maximum intensity of IF signal in this same population of cells, cell outlines were traced using a Wacom tablet and measurements were acquired from maximum intensity Z-stacks. Staging of cells was assessed by DAPI staining.
Fluorescence microscopy
All fluorescence microscopy in this study was performed using a DeltaVision Elite microscope (GE Healthcare) using either a 60X/1.42 NA oil-immersion objective (for tubulin and DAPI staining) or 100X/1.40 NA oil-immersion objective (for Sod1 immunofluorescence) objective. All images were taken at room temperature (∼25°C). After acquisition, images were deconvolved using softWoRx imaging software (GE Healthcare).
Statistical methods
The statistical methods used are described in each figure legend. Welch’s t tests were used to analyze the data in Figs. 1 C, 8 A, and B, S2 C, and S5, B and G. Data distribution for t test analyses were assumed to be normal, but this was not formally tested. Mann–Whitney U tests were used to analyze the data in Fig. 1 E and Fig. 3 C.
Online supplemental material
Fig. S1 shows material related to Figs. 1, 2, and 3 (vegetative growth of wild-type and sod1∆ cells on rich media, SOD1LUTI expression by RT-qPCR, an additional replicate of SOD1canon. expression by northern blotting, a northern blot for both SOD1 mRNAs showing DTT-specific induction of SOD1LUTI, and RT-qPCR for SOD1LUTI and HNT1LUTI after DTT treatment. Fig. S2 shows material related to Fig. 4 (Sod1 expression in urea-denatured samples, replicates of the experiments shown in Fig. 4, B and C, and spore phenotypes for wild-type and CYC1t strains). Fig. S3 shows material related to Fig. 5 (replicate data for all experiments shown in Fig. 5 and DAPI staging of DMSO- vs. MG132-treated cells and wild-type vs. pCLB2-CDC20 cells). Fig. S4 shows material related to Fig. 5 (Maximum intensity measurements of IF data for wild-type and ime1∆ cells, a pGAL-NDT80-synchronized BN-PAGE replicate, BN-PAGE control experiments, and in-gel activity assay showing Sod1 enzymatic activity). Fig. S5 shows material related to Figs. 7 and 8 (replicate data for Fig. 7 A along with spore phenotypes for wild-type and ALS mutants, RT-qPCR data for pATG8 constructs, RT-qPCR and SDS-PAGE for pATG8-hSOD1-3V5, fluorescence microscopy of Sod1WT-GFP and Sod1G92A-GFP, and spore phenotypes for 3V5- and GFP-tagged WT and G92A Sod1 strains). Table S1 shows strains. Table S2 lists primers used for strain construction. Table S3 lists primers for northern blotting, RT-qPCR, and smRNA-FISH. Table S4 lists plasmids used for strain construction.
Data availability
All reagents (strains or plasmids) used in this study are available upon request.
Acknowledgments
We thank members of the Brar and Ünal labs for their feedback on the manuscript, as well as for help with experimental design and technical support. We also thank Valeria Culotta for sharing protocols and reagents, and Amit Reddi for manuscript feedback.
This work was supported by National Institutes of Health (1R01AG071869 and 1R35GM134886) funding to G.A. Brar, and Astera Fund funding to G.A. Brar (and Elçin Ünal). H.M. Vander Wende, C. Medrano, and M. Onyundo were funded in part by National Institutes of Health training grants to the MCB department (T32GM07127 and T32GM007232).
Author contributions: H.M. Vander Wende contributed conceptualization, data curation, formal analysis, investigation, methodology, project administration, software, supervision, validation, and visualization. G.A. Brar contributed conceptualization, funding acquisition, methodology, project administration, resources, and supervision. M. Gopi contributed to investigation and formal analysis. M. Onyundo, C. Medrano, and T. Adanlawo contributed to investigation. H.M. Vander Wende and G.A. Brar wrote the original draft and revised manuscript.

