


Voltage-gated sodium channels (VGSCs) in the peripheral nervous system shape action potentials (APs) and thereby support the detection of sensory stimuli. Most of the nine mammalian VGSC subtypes are expressed in nociceptors, but predominantly, three are linked to several human pain syndromes: while Nav1.7 is suggested to be a (sub-)threshold channel, Nav1.8 is thought to support the fast AP upstroke. Nav1.9, as it produces large persistent currents, is attributed a role in determining the resting membrane potential. We characterized the gating of Nav1.1–Nav1.3 and Nav1.5–Nav1.9 in manual patch clamp with a focus on the AP subthreshold depolarization phase. Nav1.9 exhibited the most hyperpolarized activation, while its fast inactivation resembled the depolarized inactivation of Nav1.8. For some VGSCs (e.g., Nav1.1 and Nav1.2), a positive correlation between ramp current and window current was detected. Using a modified Hodgkin–Huxley model that accounts for the time needed for inactivation to occur, we used the acquired data to simulate two nociceptive nerve fiber types (an Aδ- and a mechano-insensitive C-nociceptor) containing VGSC conductances according to published human RNAseq data. Our simulations suggest that Nav1.9 is supporting both the AP upstroke and its shoulder. A reduced threshold for AP generation was induced by enhancing Nav1.7 conductivity or shifting its activation to more hyperpolarized potentials, as observed in Nav1.7-related pain disorders. Here, we provide a comprehensive, comparative functional characterization of VGSCs relevant in nociception and describe their gating with Hodgkin–Huxley–like models, which can serve as a tool to study their specific contributions to AP shape and sodium channel–related diseases.
Introduction
Next to their well-known role to initiate the upstroke of the action potential (AP), voltage-gated sodium channels (VGSCs) fine-tune cellular excitability by contributing to subthreshold depolarizations and fluctuations of the membrane potential. Thus, they are involved in the detection and amplification of sensory stimuli, e.g., in peripheral sensory neurons such as nociceptors (Bhattacharjee et al., 2018; Bennett et al., 2019; Goodwin and McMahon, 2021; Tian et al., 2023). Nociceptive stimuli depolarize the cell membrane of the nerve fiber ending, but if they are small, they do not initiate an AP, leading to subthreshold depolarizations. Subthreshold depolarizations directly preceding an AP are described in rats to be supported by VGSC currents sensitive to the pufferfish neurotoxin tetrodotoxin (TTX) (Enomoto et al., 2006; Vasylyev and Waxman, 2012), but the specific contribution of each channel isoform is yet to be fully understood.
To date, nine isoforms of mammalian VGSC α subunits have been described (Nav1.1–Nav1.9), which are encoded by the genes SCN1A–SCN5A and SCN8A–SCN11A (Yu and Catterall, 2003; Catterall et al., 2005; Dib-Hajj et al., 2010). They differ in their biophysical properties, such as the kinetics and voltage dependence of activation, inactivation, and deactivation (Ahern et al., 2016; Körner and Lampert, 2020; Catterall, 2023) and are classified according to their sensitivity to TTX as either TTX-resistant (TTXr; Nav1.5, Nav1.8, and Nav1.9) or TTX-sensitive (TTXs; all remaining isoforms) (de Lera Ruiz and Kraus, 2015).
Depending on their type and physiological function, excitable human cells express different VGSC isoforms (Catterall et al., 2005; Ahern et al., 2016). For example, Nav1.1–Nav1.3 and Nav1.6 are widely expressed in neurons of the central nervous system (CNS) and peripheral nervous system (PNS) (Whitaker et al., 2000; Vacher et al., 2008; Liang et al., 2021), while Nav1.7–Nav1.9 are expressed in PNS neurons, including dorsal root ganglion (DRG) neurons, sympathetic ganglion neurons, or olfactory sensory neurons (Fukuoka et al., 2008; Wang et al., 2017). The skeletal and cardiac muscles express their own specific subtypes: Nav1.4 and Nav1.5, respectively (Sheets and Hanck, 1999). Nav1.5 can also be detected in PNS neurons during development or injury (Renganathan et al., 2002) and at low levels in adults as revealed by recent transcriptomics studies of human sensory neurons (Tavares-Ferreira et al., 2022).
The VGSC expression patterns of different excitable cell populations can overlap and are subject to dynamic changes during development or in response to injury or sensitization. Expression of Nav1.3, for example, was described in embryonic, but not in healthy adult rat DRG neurons. However, expression of Nav1.3 and associated currents has been found to be upregulated in rodent DRG neurons after spinal cord injury (Felts et al., 1997; Hains et al., 2003; Lampert et al., 2006).
The sensation of pain via DRG neurons is associated with the activation of their afferent C- or Aδ-nerve fibers. Among them, the subclass of C-fibers known as “silent,” “sleeping,” or mechano-insensitive C-fibers (CMis) is assumed to be involved in the generation of neuropathic pain by exhibiting abnormal spontaneous activity (Namer and Handwerker, 2009; Kleggetveit et al., 2012). Cell excitability of different fiber types and therefore their function in pain signaling are subject to various factors of influence. Recent transcriptomic studies including human tissue revealed distinct VGSC expression patterns in each sensory nerve fiber type (Usoskin et al., 2015; Kupari et al., 2021; Nguyen et al., 2021; Tavares-Ferreira et al., 2022; Jung et al., 2023; Bhuiyan et al., 2024). To date, the influence of these expression patterns on nerve fiber excitability is yet to be fully understood. It is therefore beneficial to first investigate the contribution of each VGSC isoform to nerve fiber excitability in isolation.
Gain-of-function variants of Nav1.7 are linked to inherited pain syndromes such as erythromelalgia (Yang et al., 2004; Lampert et al., 2010; Bennett and Woods, 2014; Brouwer et al., 2014; Tang et al., 2015; Dib-Hajj et al., 2017) or paroxysmal extreme pain disorder (Fertleman et al., 2006, 2007; Jarecki et al., 2008; Stępień et al., 2020). Studies of these mutations in heterologous expression systems show a prominent shift of voltage dependence of activation to more hyperpolarized potentials and suggest that Nav1.7 plays an important role in the initiation of APs. Recently, however, in recordings of human sensory neurons derived from induced pluripotent stem cells (iPSC), the contribution of Nav1.7 to subthreshold depolarizations was observed to be limited, and the channel was considered a threshold channel rather than a subthreshold channel (Meents et al., 2019).
Functional studies in rodents and heterologous expression systems so far suggest that Nav1.8 is the main contributor to the upstroke of the AP and determines its duration by shaping the AP’s shoulder (Renganathan et al., 2001; Blair and Bean, 2002; Matsutomi et al., 2006; Han et al., 2015a). Nav1.9, on the other hand, is thought to modulate the resting membrane potential by eliciting large persistent currents (Herzog et al., 2001; Maingret et al., 2008; Tian et al., 2023). A contribution of Nav1.9 to the AP shoulder was nicely demonstrated in enteric neurons of Nav1.9 knockout mice (Osorio et al., 2014) and observed in DRG neurons of mice carrying a Nav1.9 missense mutation (Leipold et al., 2013), while another study failed to see an influence of Nav1.9 on AP shape (Priest et al., 2005). Thus, the question of the role of Nav1.9 in shaping AP properties is left unresolved.
Nav1.9 is long known to show poor heterologous expression (Vanoye et al., 2013; Goral et al., 2015; Sizova et al., 2020). Various attempts to express Nav1.9 in heterologous expression systems yielded limited success with very few exceptions (Tate et al., 1998; Leipold et al., 2013, 2015; Vanoye et al., 2013). Although chimeric Nav1.9 channels containing the C terminus from Nav1.4 show improved expression, they exhibit altered voltage dependence of channel activation and inactivation (Goral et al., 2015; Bothe and Lampert, 2021) and are therefore unsuitable for studying Nav1.9 gating and its contribution to AP genesis.
Once the gating parameters of each channel subtype have been analyzed, their contribution to cellular excitability can be reconstructed and investigated using mathematical and in silico models. In 1952, Hodgkin and Huxley provided a mathematical description of VGSC gating and APs, which still today is often used to model electrophysiological data and cellular excitability (Hodgkin and Huxley, 1952; Stiles and Gray, 2021; Wang et al., 2022). However, classic Hodgkin–Huxley models implement VGSC inactivation right at the beginning of a voltage step stimulus and therefore do not account for the duration of protein-level conformational changes that are assumed to occur within the channel for the so-called inactivation particle to bind to its receptor and thereby stop the associated sodium influx.
C-fiber excitability in particular has been modelled and used successfully to describe the biophysical properties of this fiber type (Petersson et al., 2014; Tigerholm et al., 2014, 2015; Maxion et al., 2023). In most cases, only select VGSC isoforms are included in models of excitable cells, often because of a lack of a standardized comprehensive data set, which is needed as a basis for model generation. Larger studies comparing VGSC gating in vitro in a comparable experimental setting have focused on suprathreshold gating of a subset of VGSCs expressed in the CNS and related mutations leading, e.g., to epilepsy (Thompson et al., 2023), or on sensory neuron VGSCs with a focus on their temperature dependence (Kriegeskorte et al., 2023).
As conclusive and complete data on the sub- and suprathreshold activity of all VGSC isoforms are not yet available, we here conducted a standardized and comparative examination of VGSC isoforms involved in nociception (Nav1.1–1.3 and Nav1.5–1.8) with consistent experimental conditions using patch-clamp experiments in heterologous expression systems (HEK293(T) and ND7/23 cells).
With these data, we developed a computational model which is based on the Hodgkin–Huxley framework and parameterized using our patch-clamp data. We added Nav1.9 to this model using previously published data obtained under similar experimental conditions using transfected ND7/23 cells (Leipold et al., 2013, 2015). We implemented the VGSC isoform proportions as reported for human CMis and Aδ-fibers (Tavares-Ferreira et al., 2022) to investigate the contributions of individual VGSC isoforms to excitability and AP generation in two sensory fiber types.
Materials and methods
Cell culture and cell preparation
Cell lines
Plasmids of VGSC isoforms used in this study were either stably transfected in the human embryonic kidney cell line HEK293 (rat Nav1.3 = rNav1.3, human Nav1.5 = hNav1.5, and mouse Nav1.6 = mNav1.6, hNav1.7) or transiently in the human embryonic kidney cell line HEK293T (hNav1.1, hNav1.2) or mouse/rat hybridoma nerve cell line ND7/23 (hNav1.8).
All used cell lines were cultivated adherently under standard cell culture conditions (i.e., 37°C and 5% CO2) in their respective cell culture media and supplements (Table S1). Passaging for all cell lines was performed twice per week at ∼80% confluency using Accutase (Sigma-Aldrich) with a 1:5–1:10 passaging rate onto cultureware coated with Geltrex (LDEV-Free, hESC-Qualified; Gibco, Thermo Fisher Scientific). Only cells with passage numbers below 30 were used for electrophysiological experiments. All cell lines were regularly tested negative for mycoplasma contamination.
Plasmids
Plasmid constructs used for transient transfection were amplified using XL10-gold ultracompetent cells (Agilent Technologies, Inc.) and verified by restriction pattern analysis and commercial DNA sequencing (Eurofins Genomics GmbH). The plasmids for hNav1.1 (pCMV6-AC-hNav1.1 WT RRSSV 3′ UTR, Myc-DDK) and hNav1.2 (pCMV6-XL5-hNav1.2 WT RRSSV 3′ UTR) were kindly gifted by Frank Bosmans, Ghent University, Belgium. hNav1.1 contained the common natural variation A1067T (allele frequency for T: 0.728). The hNav1.8 plasmid (pIRES puro3-hNav1.8 WT) contained the V1073A variant (allele frequency for A: 0.58).
Transient transfection
HEK293T and ND7/23 cells were seeded in 35-mm petri dishes 20–24 h prior to transient transfection to reach a 70–90% confluency. Transfection was then performed using 3 μl jetPEI (Polyplus-transfection), 0.25 µg reporter plasmid pMax-GFP (Lonza), and 1.25 µg plasmid encoding the VGSC to be examined. Cells were incubated for another 18–24 h before being split onto fresh 35-mm petri dishes. About 2 h later, after the seeded cells attached to the cultureware, cells with a bright green fluorescence were used for patch-clamp experiments.
Electrophysiology
General patch-clamp framework
Electrophysiological experiments were performed in whole-cell voltage-clamp mode using an EPC10-USB amplifier (HEKA Elektronik GmbH). Cells were covered in extracellular solution (ECS) containing 140 mM NaCl, 3 mM KCl, 1 mM MgCl2, 1 mM CaCl2, 10 mM HEPES, and 20 mM glucose. ECS was adjusted to pH 7.4 using NaOH, while osmolarity was between 305 and 312 mosm/liter. Since ND7/23 cells display endogenous VGSC-mediated TTXs currents (Rogers et al., 2016; Lee et al., 2019), 500 nM TTX (Tocris) was added to the ECS for measurements of the TTXr channel hNav1.8.
Glass pipettes from borosilicate glass tubes (Biomedical Instruments) were manufactured and fire-polished using a DMZ pipette puller (Zeitz Instruments GmbH). Pipette tip resistance was between 0.8 and 2 MΩ for all measurements. The pipette was filled with intracellular solution (ICS) containing 10 mM NaCl, 140 mM cesium fluoride (CsF), 1 mM EGTA, 10 mM HEPES, and 18 mM sucrose. ICS was adjusted to pH 7.31 with CsOH, while osmolarity was 313 mosm/liter.
Experiments were conducted at room temperature (22 ± 1°C). Cells were kept in ECS for a maximum of 90 min before being discarded. Cell membrane capacitance was between 5 and 33 pF. For all measurements, seal resistance was above 0.8 GΩ. Only cells with an initial series resistance (Rs) below 5 MΩ and a peak current amplitude above 500 pA during the voltage dependence of the activation protocol were accepted. At all times, voltage error (Rs * I) was below 5 mV.
Data were gathered using Patchmaster Next version 1.2 (HEKA Elektronik GmbH). Analog signals were digitized at a sampling rate of 100 kHz (except for AP clamping measurements, which were sampled at 20 kHz) with a 10-kHz Bessel low-pass filter. Leak currents were measured and subtracted online (for activation, steady-state fast inactivation [SSFI], and ramp current measurements) or offline (for AP clamping due to technical limitations) with a P/n procedure (n = 4) preceding the respective test pulse. Capacitive currents were cancelled, and Rs was compensated for by 77–83% for all cells. All measurements were corrected online for a liquid junction potential of 8.2 mV.
Patch-clamp protocols
For each cell, stimulation protocols were only recorded once (no technical replicates). Protocols are indicated in the respective figures. For all protocols, the holding potential in between test pulses (Vhold) was set to −120 mV.
After establishing whole-cell configuration, a current stabilization protocol was conducted for 5 min to ensure complete recovery, in which cells were held at holding potential and repeatedly stimulated with test pulses to 0 mV every 10 s.
During the voltage dependence of the SSFI protocol, after being held at holding potential, cells were initially stimulated with a 500-ms prepulse before being exposed to a 40-ms test pulse at 0 mV. From sweep to sweep, the prepulse voltage increased stepwise from −140 to −30 mV in 10-mV increments (−110 to 0 mV for most Nav1.8 measurements). The interpulse interval was 10 s. For investigation of the voltage dependence of SSFI (i.e., the fraction of non-inactivated channels available for activation depending on the preceding membrane potential), the peak inward current for each test pulse (INa) was normalized to the maximum inward current during inactivation measurement (INa,max). Normalized current values were plotted against the respective prepulse potential.
We equated the window current for each cell as the area under the curve (AUC) of the superimposed activation and SSFI Boltzmann fit curves. Because SSFI Boltzmann fits do not reach 0 values when approaching infinity voltages, the AUC was calculated with an upper limit set 20 mV above the intersection of activation and SSFI Boltzmann fits for each cell.
For ramp current measurements, cells were stimulated with depolarizing voltage ramps from holding potential to +20 mV at different ramp rates, namely 0.1, 0.2, 0.4, 0.6, 1.2, 2, 4, and 6 mV/ms (for ramp durations see Table S2). For each ramp rate, the measured current response was averaged from three consecutive sweeps. The maximum inward current and the voltage at which it occurs were measured, as well as the AUC of the current response. Because especially for Nav1.8, the ramp current bell curve did not return to 0 pA at the end of the ramp, the AUC was calculated only up to the maximum inward current. Maximum inward current and AUC were normalized to the respective maximum inward current from the activation protocol for each cell (INa,max).
To measure the VGSC current response to APs, three different pre-recorded APs (AP1–AP3) measured in iPSC-derived nociceptors were used as a voltage command (Blair and Bean, 2002). The AP commands differ in their characteristics (Table 1) with, e.g., subthreshold voltage slope being between 0.2 and 2 mV/ms. These voltage stimuli included 50 ms of the respective resting membrane potential preceding each recorded AP (Table 1) to prevent transient currents caused by step depolarization from holding potential to initial AP voltage from interfering with the examined AP current responses. The respective AP current response was averaged out of three consecutive sweeps. For each stimulation, we calculated the maximum inward current and AUC of both the total AP and of the subthreshold phase of the AP. For the latter, the slope of the elicited current was calculated as well. Current responses for AP clamping were normalized to the maximum inward current during activation measurement (INa,max).
Properties of the pre-recorded APs used as voltage commands
| AP1 | AP2 | AP3 | |
|---|---|---|---|
| Average resting membrane potential (mV) | −76.5 | −71.9 | −67.4 |
| AP threshold voltage (mV) | −60.1 | −61.2 | −41 |
| Maximum AP voltage (mV) | 10 | 11.2 | 59.3 |
| Voltage amplitude of AP (mV) | 86.5 | 83.1 | 126.7 |
| Minimum voltage of after hyperpolarization (mV) | −71.6 | −67.7 | −59.7 |
| AP half width (ms) | 3.6 | 2.4 | 3.8 |
| Time to AP peak (ms) | 99.6 | 14.6 | 18 |
| Subthreshold slope (mV/ms) | 0.21 | 1.39 | 1.84 |
| Upstroke slope (mV/ms) | 3.31 | 10.64 | 27.1 |
Data were gathered from current-clamp measurements of iPSC-derived nociceptors using the Igor Pro software.
Sample sizes and data exclusion
We performed an a priori analysis to estimate the number of cells needed for each experiment. In a small pre-study with Nav1.3 and Nav1.7, the voltage at which the maximum inward ramp current appeared was compared, assuming normal distribution. Using the software G*Power version 3.1.9.7 (Heinrich-Heine-Universität), we calculated the sample size for each VGSC to be n = 27 (hedge’s g* = 1.23 as a measure of the effect size d, two-tailed α = 0.05 and power [1−β] = 0.95).
We designed the study to have groups of equal size. Group size variation might occur due to cells being excluded from analysis a posteriori, e.g., because of measurement artifacts impeding data analysis. Since the ramp current responses often showed a considerable drift, which made it difficult to calculate the AUC, the following exclusion criteria were defined for ramp current AUC measurements: cells with a drift larger than +100 or −500 pA as well as cells with a drift >10% of the maximum inward current during activation measurement were excluded from analysis. For AP clamping measurements, we identified outliers using the ROUT method with Q = 0.1% (Motulsky and Brown, 2006). Outliers were excluded from further analysis. Beyond that, we performed no outlier analysis or elimination.
Data analysis
Data analysis for electrophysiological experiments was blinded except for Nav1.5. Data gathered by electrophysiological experiments were analyzed using FitMaster version 2 × 90.5 (HEKA Electronik GmbH) and IgorPro version 6.37 (WaveMetrics, Inc.). IgorPro analysis procedures are available upon reasonable request. GraphPad Prism version 9.5.1 (GraphPad Software) was used for Boltzmann fits and statistical testing. Graphing of data was performed with IgorPro, GraphPad Prism, and CorelDRAW 2017 version 19.0.0.328 (Alludo).
Statistics
Data are presented as mean ± SD unless stated otherwise. Error bars denote the SD, while box plot whiskers show the 10th and 90th percentiles. The threshold for statistical significance was set to P < 0.05. Given P values are shown with four decimal places and summarized as follows: ns = not significant, * = P < 0.05, ** = P < 0.01, and *** = P < 0.001.
Data were tested for normal distribution using the D’Agostino & Pearson omnibus K2 test. Normal distribution for an experiment was only assumed if each group passed the test individually. For statistical testing, groups were compared by ordinary one-way ANOVA with Tukey–Kramer’s multiple comparisons test and a single-pooled variance for parametric testing or Kruskal–Wallis’s test with Dunn’s multiple comparison test for nonparametric testing. Values derived from ramp current measurements (Imax, Ulocation of Imax, and AUC) were compared by ordinary two-way ANOVA with Tukey–Kramer’s multiple comparisons test, and individual variances were computed for each comparison to compare between both VGSC isoforms and an additional factor of influence, i.e., the ramp rate. For correlations, we computed the nonparametric Spearman correlation with a two-tailed P value (data are given as Spearman’s r with 95% CI) and graphed it with simple linear regression. Data were neither matched nor paired.
The exact group n values are not shown in the figures for readability purposes but are indicated in the respective tables and supplementary tables.
Computational modelling
To simulate the AP of a CMi and an Aδ-fiber, we use a modified version of the Hodgkin–Huxley model. Compared with the original Hodgkin–Huxley model (Hodgkin and Huxley, 1952), we introduced a delay for current decay (fast inactivation kinetics). This modification prevents premature inactivation of sodium channels and improves the fit of the model to sodium currents of Nav1.1–Nav1.3 and Nav1.5–Nav1.8 for activation voltages above 10 mV. The gating variables and the delay of inactivation were fitted using voltage-clamp data for Nav1.1–Nav1.3 and Nav1.5–Nav1.8 acquired at room temperature (22 ± 1°C) as well as previously published voltage-clamp data for Nav1.9 (Leipold et al., 2013, 2015). To fit Nav1.9 kinetics, the original Hodgkin–Huxley equations were used because they accurately captured the data. The fits were performed with fmincon from the MATLAB software R2021b (The MathWorks, Inc.) using a multistart approach with Latin hypercube sampling and a weighted least squares cost functional. To simulate APs in a CMi and an Aδ-fiber, the ratios between the maximal conductances for the considered VGSC isoforms were chosen to match recently published putative gene expressions quantified in human DRGs by spatial transcriptomics (Tavares-Ferreira et al., 2022). The simulations are based on the quantifications of gating variables at room temperature. The resting potential is −71 mV, and the model is at rest before different stimulation currents are applied. Details, model equations, and parameters are provided in the supplementary information.
Online supplemental material
Fig. S1 shows an example trace of a Nav1.3 ramp current elicited by a 0.1 mV/ms voltage ramp exhibiting two peaks. Fig. S2 shows AUC values obtained from full ramp current measurements, normalized to the maximum inward current from activation measurements for each cell. Fig. S3 shows the time points at which the maximum inward current during AP3 after exclusion of measurements impeded by transient current artifacts. Fig. S4 shows computer simulations of APs in a CMi. Fig. S5 shows computer simulations of AP in an Aδ-fiber. Fig. S6 shows an overlay of simulated APs in a CMi and in an Aδ-fiber. Fig. S7 shows the simulated contribution of Nav1.9 to APs in a CMi. Fig. S8 shows simulated sodium currents and conductances in a CMi and Aδ-fiber. Table S1 shows an overview of all used cell lines and their culture media and supplements. Table S2 shows the duration of command voltage ramps. Table S3 shows multiple comparisons of V50 values of voltage dependency of activation and fast inactivation measurements. Table S4 shows multiple comparisons of slope values (k) of voltage dependency of activation and fast inactivation measurements. Table S5 shows multiple comparisons of window current AUC and intersection voltage of activation and SSFI Boltzmann fit curve. Table S6 shows multiple comparisons of fraction of channels remaining open after SSFI. Table S7 shows descriptive statistics of parameters gathered from ramp current measurements. Table S8 shows multiple comparisons of normalized maximum inward current values from ramp current measurements. Table S9 shows multiple comparisons of the voltage dependence of maximum inward current from ramp current measurements. Table S10 shows multiple comparisons of normalized AUC before maximum inward current values from ramp current measurements. Table S11 shows multiple comparisons of normalized AUC before maximum inward current values from ramp current measurements. Table S12 shows the correlation of window current values and AUC values from ramp current measurements. Table S13 shows descriptive statistics of parameters gathered from AP clamping measurements. Table S14 shows multiple comparisons of parameters calculated from AP clamping measurements. Appendix S1 provides data on the in silico models.
Results
Nav1.5 and Nav1.8 activate and fast inactivate at more hyper- and depolarized potentials than other subtypes, respectively
To gain a comparable oversight of the biophysics of VGSC isoforms involved in nociception, we examined Nav1.1, Nav1.2, Nav1.3, Nav1.5, Nav1.6, Nav1.7, and Nav1.8 for their voltage dependence of activation and SSFI (Fig. 1 and Fig. 2). Of all the channels examined two stood out: Nav1.5 activated and fast inactivated at more hyperpolarized potentials than all other VGSC isoforms (Fig. 1 G; and Fig. 2, A and B; and Tables 2 and S3), whereas Nav1.8 was set apart by its more depolarized activation and SSFI (Fig. 1 J; and Fig. 2, A and B; and Tables 2 and S3). The TTXs VGSCs examined activated at intermediate voltages, with Nav1.6 and Nav1.7 being grouped at slightly more hyperpolarized voltages than Nav1.1, Nav1.2, and Nav1.3 (Fig. 1; and Fig. 2, A and B; and Tables 2 and S3). Data obtained from fitting conductance-voltage or current-voltage curves to the Boltzmann equation are summarized in Fig. 2 and Tables 2, S3, S4, S5, and S6. Comparison of the Boltzmann equation fitting results showed differences between the VGSC isoforms in all obtained parameters (P < 0.0001 for all ANOVA or Kruskal–Wallis tests).

Conductance-voltage or current-voltage relationship of activation and SSFI protocols. (A) Overview of all conductance-voltage curves derived from activation measurements. (B) Overview of all current-voltage curves derived from SSFI measurements (voltage protocol of SSFI depicted in inlet. Note that for Nav1.8 measurements, most cells were stimulated with a −110 to 0 mV voltage range). (C) Example current traces of Nav1.7 elicited by the activation protocol (voltage protocol depicted in inlet. Note that for Nav1.8 measurements, most cells were stimulated with a −60 to +70 mV voltage range). (D–J) Overlay of activation and inactivation curves for Nav1.1 (D), Nav1.2 (E), Nav1.3 (F), Nav1.5 (G), Nav1.6 (H), Nav1.7 (I), and Nav1.8 (J). Data are shown as mean ± SD and superimposed Boltzmann fit curve.
Conductance-voltage or current-voltage relationship of activation and SSFI protocols. (A) Overview of all conductance-voltage curves derived from activation measurements. (B) Overview of all current-voltage curves derived from SSFI measurements (voltage protocol of SSFI depicted in inlet. Note that for Nav1.8 measurements, most cells were stimulated with a −110 to 0 mV voltage range). (C) Example current traces of Nav1.7 elicited by the activation protocol (voltage protocol depicted in inlet. Note that for Nav1.8 measurements, most cells were stimulated with a −60 to +70 mV voltage range). (D–J) Overlay of activation and inactivation curves for Nav1.1 (D), Nav1.2 (E), Nav1.3 (F), Nav1.5 (G), Nav1.6 (H), Nav1.7 (I), and Nav1.8 (J). Data are shown as mean ± SD and superimposed Boltzmann fit curve.
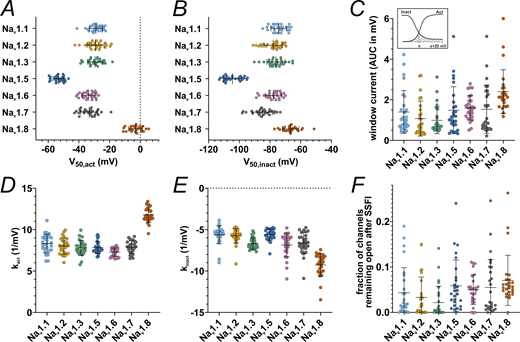
Activation and SSFI parameters and window current. (A)V50 values obtained from activation Boltzmann fits. (B)V50 values obtained from SSFI Boltzmann fits. (C) AUC values underneath the superimposed activation and SSFI Boltzmann fit curves, i.e., the window current. Inlet: Schematic depiction of AUC calculation, x being the membrane voltage of the activation and SSFI Boltzmann fit curve intersection. (D) Slope values k obtained from activation Boltzmann fits. (E) Slope values k gathered from SSFI Boltzmann fits. (F) Bottom values gathered from SSFI Boltzmann fits, indicating the fraction of channels remaining open after complete SSFI. Data are shown as mean ± SD. Statistical significance from multiple comparisons has not been indicated in the figure panels for readability purposes but can be consulted in Tables S3, S4, S5, and S6.
Activation and SSFI parameters and window current. (A)V50 values obtained from activation Boltzmann fits. (B)V50 values obtained from SSFI Boltzmann fits. (C) AUC values underneath the superimposed activation and SSFI Boltzmann fit curves, i.e., the window current. Inlet: Schematic depiction of AUC calculation, x being the membrane voltage of the activation and SSFI Boltzmann fit curve intersection. (D) Slope values k obtained from activation Boltzmann fits. (E) Slope values k gathered from SSFI Boltzmann fits. (F) Bottom values gathered from SSFI Boltzmann fits, indicating the fraction of channels remaining open after complete SSFI. Data are shown as mean ± SD. Statistical significance from multiple comparisons has not been indicated in the figure panels for readability purposes but can be consulted in Tables S3, S4, S5, and S6.
Descriptive statistics of parameters obtained from fitting voltage dependence of activation and SSFI with the Boltzmann equation
| Voltage dependence of activation | Voltage dependence of SSFI | Intersection of activation and SSFI Boltzmann fit curves (mV) | Window current (AUC in mV) | n | ||||||
|---|---|---|---|---|---|---|---|---|---|---|
| V50act (mV) | kact (1/mv) | n | V50inact (mV) | kinact (1/mV) | Fraction of channels remaining open after SSFI (%) | n | ||||
| Nav1.1 | −28.9 ± 4.3 | 8.3 ± 1.1 | 27 | −74.3 ± 5.0 | −5.6 ± 1.1 | 4.3 ± 5.5 | 27 | −56.1 ± 4.6 | 1.398 ± 1.054 | 27 |
| Nav1.2 | −29.2 ± 5.6 | 8.0 ± 1.0 | 27 | −77.9 ± 6.0 | −5.8 ± 0.9 | 3.3 ± 4.5 | 27 | −57.7 ± 5.6 | 1.073 ± 0.861 | 27 |
| Nav1.3 | −29.5 ± 4.9 | 7.8 ± 0.9 | 27 | −76.2 ± 5.9 | −6.7 ± 0.7 | 2.1 ± 3.5 | 27 | −54.7 ± 4.3 | 0.989 ± 0.661 | 27 |
| Nav1.5 | −53.3 ± 3.5 | 7.8 ± 0.7 | 27 | −104.5 ± 5.7 | −5.6 ± 0.7 | 5.9 ± 5.7 | 27 | −83.1 ± 4.6 | 1.484 ± 1.156 | 27 |
| Nav1.6 | −33.8 ± 4.2 | 7.3 ± 0.5 | 27 | −77.9 ± 5.2 | −6.9 ± 1.4 | 5.0 ± 3.3 | 27 | −56.6 ± 4.7 | 1.598 ± 0.608 | 27 |
| Nav1.7 | −33.3 ± 5.6 | 7.9 ± 0.8 | 27 | −84.9 ± 6.3 | −6.6 ± 1.3 | 5.5 ± 6.2 | 27 | −61.6 ± 5.6 | 1.533 ± 1.195 | 27 |
| Nav1.8 | −3.1 ± 4.5 | 11.8 ± 0.9 | 25 | −66.6 ± 5.4 | −9.3 ± 1.4 | 7.1 ± 5.5 | 26 | −38.9 ± 5.1 | 2.401 ± 1.079 | 25 |
| Nav1.9a | −52.3 ± 9.8 | 11.0 ± 3.2 | 24 | −68.9 ± 10.3 | −12.2 ± 4.9 | 22.4 ± 9.8 | 17 | −61.0 ± 6.3 | 12.952 ± 4.114 | 15 |
Data are shown as mean ± SD.
Nav1.9 Boltzmann values were derived from pooled previously published data from Leipold et al. (2013) and Leipold et al. (2015).
The overlap between activation and SSFI curves is often referred to as window current (Wang et al., 1996; Magistretti and Alonso, 1999; Abriel et al., 2001; Osteen et al., 2017). The intersection of activation and SSFI curves (i.e., the peak of the window current) of Nav1.7 was ∼5 mV more hyperpolarized than that for all other TTXs channels tested except for Nav1.2 (Fig. 1 and Tables 2 and S5). This indicates that in this heterologous expression system, a higher fraction of Nav1.7 channels are in an open state (i.e., activated and not yet fast inactivated) at more hyperpolarized voltages than the other assumed subthreshold channels, Nav1.1, Nav1.3, and Nav1.6, and thus could contribute to cell depolarization at subthreshold voltages.
Window current size was larger for Nav1.8 than for every other VGSC examined except for Nav1.6. Among TTXs channel isoforms, Nav1.6 elicited slightly higher window currents than Nav1.2 and Nav1.3 but did not differ from Nav1.1 and Nav1.7 (Fig. 2 C and Tables 2 and S5), underlining their equal potential to support subthreshold depolarization. Concerning the fraction of channels remaining open after SSFI, we observed a trend for Nav1.2/3 and Nav1.8 to smaller or larger currents, respectively (Fig. 2 F and Tables 2 and S6).
To complete our data set with the last remaining VGSC essential for nociceptors, we analyzed pooled Nav1.9 data from previously published recordings (Leipold et al., 2013, 2015) (Fig. 3 and Table 2). While activation of Nav1.9 occurred at hyperpolarized voltages comparable with Nav1.5, SSFI voltage dependence resembled the depolarized inactivation of Nav1.8 (Fig. 3, B and C; and Table 2). Nav1.9 displayed pronounced persistent currents (Fig. 3 A) as described previously (Herzog et al., 2001; Maingret et al., 2008). These properties enable the formation of major window currents exceeding those of all other VGSC isoforms measured in this study (Fig. 3 E and Table 2).

Summary of Na v 1.9 activation and SSFI data. Data from Leipold et al. (2013), Leipold et al. (2015) were pooled and analyzed concerning Nav1.9 gating and window currents. (A) Example current traces of Nav1.9 elicited by the activation protocol. Note that cells were stimulated with a −127 to + 63 mV voltage range. (B) Overlay of activation conductance-voltage and SSFI current-voltage curves. (C)V50 values obtained from activation and SSFI Boltzmann fits. (D) Slope values k obtained from activation and SSFI Boltzmann fits. (E) AUC values underneath the superimposed activation and SSFI Boltzmann fit curves, i.e., the window current. Data are shown as mean ± SD.
Summary of Na v 1.9 activation and SSFI data. Data from Leipold et al. (2013), Leipold et al. (2015) were pooled and analyzed concerning Nav1.9 gating and window currents. (A) Example current traces of Nav1.9 elicited by the activation protocol. Note that cells were stimulated with a −127 to + 63 mV voltage range. (B) Overlay of activation conductance-voltage and SSFI current-voltage curves. (C)V50 values obtained from activation and SSFI Boltzmann fits. (D) Slope values k obtained from activation and SSFI Boltzmann fits. (E) AUC values underneath the superimposed activation and SSFI Boltzmann fit curves, i.e., the window current. Data are shown as mean ± SD.
Ramp and window currents of only some VGSC isoforms may arise from a similar mechanism
Ramp stimuli evoked a bell-shaped inward current response for all tested VGSC isoforms (Fig. 4), as reported previously (Cummins et al., 1998; Abriel et al., 2001; Herzog et al., 2003; Power et al., 2012; Estacion and Waxman, 2013; DeCaen et al., 2014; Han et al., 2015a; Zhang et al., 2017). For cells expressing Nav1.3, we observed two-peaked ramp currents for slowly depolarizing ramps (i.e., 0.1 mV/ms and partly 0.2 mV/ms) in six out of a total of 27 recordings, similar to what was reported previously (Estacion and Waxman, 2013) (see Fig. S1). For the remaining cells and higher ramp rates, a delayed current decay was observed, potentially corresponding to Nav1.3 persistent current.

Example traces of Na v 1.7 ramp currents elicited by slowly depolarizing ramp stimuli. Voltage protocol depicted in inlet. Scale bars apply to current traces only.
Example traces of Na v 1.7 ramp currents elicited by slowly depolarizing ramp stimuli. Voltage protocol depicted in inlet. Scale bars apply to current traces only.

Example trace of a Na v 1.3 ramp current elicited by a 0.1 mV/ms voltage ramp exhibiting two peaks.
Example trace of a Na v 1.3 ramp current elicited by a 0.1 mV/ms voltage ramp exhibiting two peaks.
Ramp currents for all tested isoforms increased with steeper ramp stimuli, most likely due to more channels activating before the onset of fast inactivation. As determined in post hoc testing, for the lowest ramp rates (i.e., ≤0.4 mV/ms), most VGSC isoforms did not differ in maximum inward ramp current; only Nav1.8 elicited higher maximum ramp currents than the other VGSC isoforms (Table S7). For medium ramp rates (0.6–1.2 mV/ms), Nav1.3 and Nav1.8 exceed the other VGSC isoforms, whereas for the highest ramp rates (2–6 mV/ms), Nav1.6 and Nav1.7 gradually catch up, leaving Nav1.1, Nav1.2, and Nav1.5 grouped at lower values (Fig. 5 A and Tables S7 and S8).

Current-voltage parameters obtained from ramp current measurements. (A) Maximum inward current from ramp current measurement normalized to maximum inward current from activation measurements. (B) Voltage at which the maximum inward current occurred during ramp current measurement. Data are shown as box plots with whiskers indicating the 10th and 90th percentile and dots for measurements below the 10th and above the 90th percentile.
Current-voltage parameters obtained from ramp current measurements. (A) Maximum inward current from ramp current measurement normalized to maximum inward current from activation measurements. (B) Voltage at which the maximum inward current occurred during ramp current measurement. Data are shown as box plots with whiskers indicating the 10th and 90th percentile and dots for measurements below the 10th and above the 90th percentile.
We observed that the maximum inward current evoked by ramp stimulation was affected more by the ramp rate than by the VGSC isoform: the difference between VGSC isoforms (F[6, 1429] = 153.0, P < 0.0001) and ramp rate (F[7, 1,429] = 974.8, P < 0.0001) made up for 9.7% and 71.8% of total variation, respectively (Fig. 5 A and Table S7). Interaction between these terms accounted for 3.3% of total variation (F[42, 1,429] = 7.528, P < 0.0001).
Ancillary to the size of the maximum inward ramp current, we saw differences in its voltage dependence (Fig. 5 B and Table S7) between VGSC subtypes (F[6, 1,429] = 1,748, P < 0.0001; 82.5% of total variation), ramp rates (F[7, 1,429] = 90.15, P < 0.0001; 5% of total variation), and their interaction (F[42, 1,429] = 5.17, P < 0.0001; 1.7% of total variation). Using multiple comparison testing, VGSC isoforms showed a distribution matching the results of activation/SSFI V50 results and Boltzmann fit intersections for the vast majority, with Nav1.5 and Nav1.8 ramp currents occurring at more hyperpolarized and depolarized voltages, respectively, than all other TTXs ramp currents tested (Tables S7 and S9). TTXs channels are grouped at intermediate values, with Nav1.6 and Nav1.7 shifted toward more hyperpolarized values than Nav1.1, Nav1.2, and Nav1.3. For steeper ramps, this effect intensified, especially for Nav1.7 and Nav1.3.
As a measure of charge added to a cell during slow depolarizations such as the subthreshold phase, we investigated the AUC underneath ramp currents up to the ramp current peak (Fig. 6 A and Table S7). Post hoc testing evidenced that Nav1.8 had larger AUC values than the other VGSC isoforms for all ramp rates (Table S10). No distinct differences in the AUC between the remaining channel isoforms were observed for lower ramp rates (≤0.6 mV/ms). With rising ramp rates, the AUC of Nav1.3, Nav1.5, Nav1.6, and Nav1.7 gradually surpasses the AUC of Nav1.1 and Nav1.2. The AUC is affected by the VGSC isoform (F[6, 1180] = 95.75, P < 0.0001; 15% of total variation), ramp rate (F[7, 1180] = 281.6, P < 0.0001; 51.4% of total variation), and their interaction (F[42, 1180] = 1.984, P = 0.0002; 2.2% of total variation).

AUC values from ramp current measurements correlate with window current measurements for some VGSC isoforms. (A) AUC values obtained from ramp current measurements, normalized to the maximum inward current from activation measurements for each cell (inlet depicts a schematic example of an AUC underneath a ramp current curve. Note that the AUC was calculated only up to the point of maximum inward current to make up for Nav1.8 ramp currents being cut off at +20 mV). Data are shown as box plots with whiskers indicating the 10th and 90th percentile. (B–H) Correlation between AUC values from ramp current measurements and window current values from activation/SSFI measurements. Data are shown as AUC values plotted against the window current values of the respective cell with a linear regression line for each ramp rate.
AUC values from ramp current measurements correlate with window current measurements for some VGSC isoforms. (A) AUC values obtained from ramp current measurements, normalized to the maximum inward current from activation measurements for each cell (inlet depicts a schematic example of an AUC underneath a ramp current curve. Note that the AUC was calculated only up to the point of maximum inward current to make up for Nav1.8 ramp currents being cut off at +20 mV). Data are shown as box plots with whiskers indicating the 10th and 90th percentile. (B–H) Correlation between AUC values from ramp current measurements and window current values from activation/SSFI measurements. Data are shown as AUC values plotted against the window current values of the respective cell with a linear regression line for each ramp rate.
When analyzing the AUC under the entire ramp current curve for all VGSC examined except for Nav1.8, AUC size distribution among the channels was similar (Fig. S2 and Table S11). The influence of the ramp rate on the AUC results was more pronounced when analyzing the full ramp current curve (F[7, 978] = 449.5, P < 0.0001; 68.1% of total variation), while the impact of the VGSC isoform was decreased (F[5, 978] = 49.56, P < 0.0001; 5.4% of total variation) as was their interaction (F[35, 978] = 5.485, P < 0.0001; 4.2% of total variation).

AUC values obtained from full ramp current measurements, normalized to the maximum inward current from activation measurements for each cell. Nav1.8 was left out since its bell-shaped ramp current response curves are cut at +20 mV. Data are shown as box plots with whiskers indicating the 10th and 90th percentile.
AUC values obtained from full ramp current measurements, normalized to the maximum inward current from activation measurements for each cell. Nav1.8 was left out since its bell-shaped ramp current response curves are cut at +20 mV. Data are shown as box plots with whiskers indicating the 10th and 90th percentile.
Some authors refer to window current as corresponding to persistent or ramp current (Blair and Bean, 2002; Enomoto et al., 2006; Matsutomi et al., 2006; Vasylyev and Waxman, 2012; Estacion and Waxman, 2013), although so far we are unaware of a study investigating this potential link. We used Spearman’s rank correlation to test for a relationship between window current and ramp current AUC (Fig. 6, B–H, and Table S12). For Nav1.1 and Nav1.2, a positive correlation was identified for all ramp rates. While Nav1.5, Nav1.7, and Nav1.8 exhibited a positive correlation for most, but not all, ramp rates, for Nav1.3 and Nav1.6, a positive correlation was detected for only one ramp rate. Note that smaller Nav1.5 sample sizes due to the established exclusion criteria might limit its correlation accuracy. Our results indicate that ramp and window currents correlate only in specific cases and are thus likely to be generated by distinct mechanisms.
All tested VGSCs activate during the AP subthreshold phase except for Nav1.8
We used single AP recordings from human iPSC-derived nociceptors (control cells from Meents et al. [2019]) as a voltage command to determine the contribution of each VGSC to the phases of the AP. The three pre-recorded APs (AP1, AP2, and AP3) differ in their subthreshold properties, their width, and size of the overshoot (Fig. 7, A, C, and E; and Table 1).
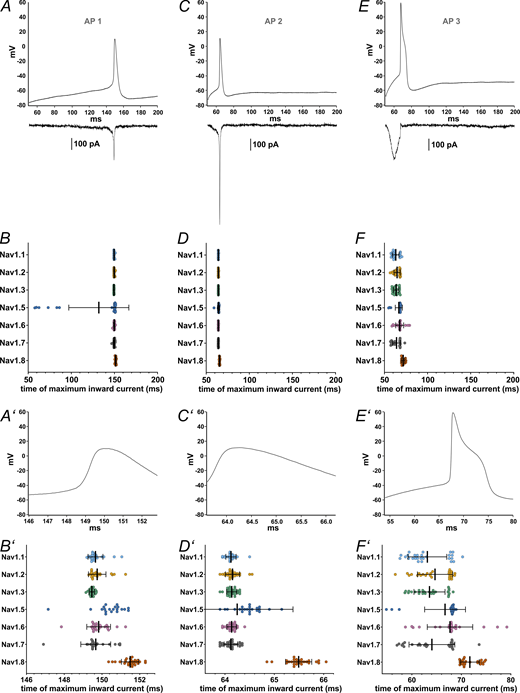
Maximum inward current occurs at different time points during AP clamping for each VGSC isoform. (A, C, and E) AP waveforms (AP1–AP3, respectively) recorded from iPSC-derived nociceptors used as voltage commands in AP clamping, with representative current traces, all from the same Nav1.7 cell, charted underneath. (B, D, and F) Time point at which the maximum inward current during the AP (AP1–AP3, respectively) occured. (A′–F′) Zoomed in depictions of figures A–F (excluding the current example traces). Data are shown as mean ± SD. Statistical significance from multiple comparisons has not been indicated in the figure panels for readability purposes but can be consulted in Table S14.
Maximum inward current occurs at different time points during AP clamping for each VGSC isoform. (A, C, and E) AP waveforms (AP1–AP3, respectively) recorded from iPSC-derived nociceptors used as voltage commands in AP clamping, with representative current traces, all from the same Nav1.7 cell, charted underneath. (B, D, and F) Time point at which the maximum inward current during the AP (AP1–AP3, respectively) occured. (A′–F′) Zoomed in depictions of figures A–F (excluding the current example traces). Data are shown as mean ± SD. Statistical significance from multiple comparisons has not been indicated in the figure panels for readability purposes but can be consulted in Table S14.
The time point during the AP at which the maximum inward current is elicited differed between certain VGSC isoforms for all AP commands (Fig. 7, B, D, and F; and Tables S13 and S14; P < 0.0001 for all Kruskal–Wallis tests), as did the maximum inward current sizes (Fig. 8, A–C and Table S13, P < 0.0001 for all Kruskal–Wallis tests) and the area under the current response curve (Fig. 8, D–F and Table S13; P < 0.0001 for all Kruskal–Wallis tests).
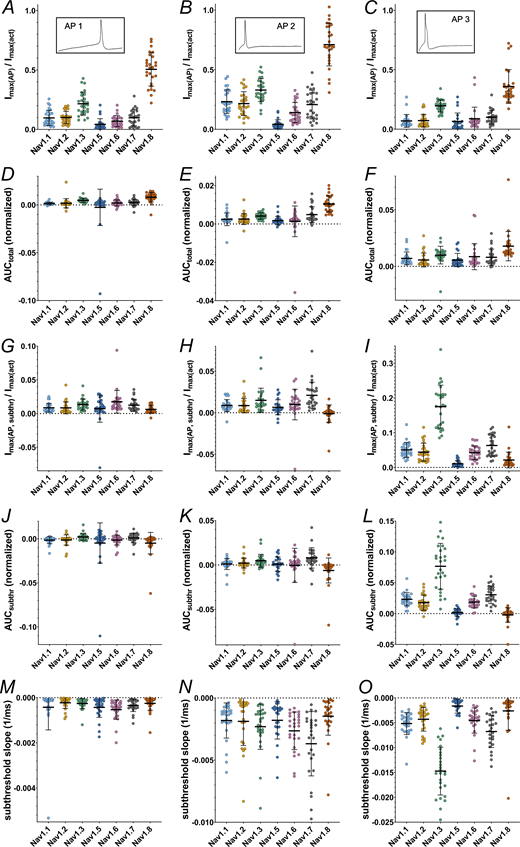
Current and AUC parameters obtained from AP clamping. (A–C) Maximum inward current during the total command AP (AP1–AP3, respectively) (inlets indicate the AP command). (D–F) Area under the current response curve to the total command AP (AP1–AP3, respectively). (G–I) Maximum inward current during the subthreshold phase of the command AP (AP1–AP3, respectively). (J–L) Area under the current response curve to the subthreshold phase of the command AP (AP1–AP3, respectively). (M–O) Slope of the inward current measured during the subthreshold phase of the command AP (AP1–AP3, respectively). Data are normalized to the maximum inward current of activation measurement of the correspondent cell and shown as mean ± SD. Statistical significance from multiple comparisons has not been indicated in the figure panels for readability purposes but can be consulted in Table S14.
Current and AUC parameters obtained from AP clamping. (A–C) Maximum inward current during the total command AP (AP1–AP3, respectively) (inlets indicate the AP command). (D–F) Area under the current response curve to the total command AP (AP1–AP3, respectively). (G–I) Maximum inward current during the subthreshold phase of the command AP (AP1–AP3, respectively). (J–L) Area under the current response curve to the subthreshold phase of the command AP (AP1–AP3, respectively). (M–O) Slope of the inward current measured during the subthreshold phase of the command AP (AP1–AP3, respectively). Data are normalized to the maximum inward current of activation measurement of the correspondent cell and shown as mean ± SD. Statistical significance from multiple comparisons has not been indicated in the figure panels for readability purposes but can be consulted in Table S14.
Multiple comparisons revealed that Nav1.8 currents were elicited at later time points than all other tested VGSC isoforms except for Nav1.5, namely, after the AP peak (Table S14). Nav1.5 currents occurred slightly later within the AP time course as well, whereas Nav1.3 leaned toward earlier time points in the subthreshold phase (Fig. 7, B′, D′, and F′; and Tables S13 and S14). Current sizes and AUC sizes were similarly distributed between the AP commands, with Nav1.8 and Nav1.3 exhibiting larger and Nav1.5 exhibiting slightly lower values for maximum inward current (Fig. 8, A–F, and Tables S13 and S14).
The examination of the time point of maximum inward current during AP3 stood out since some VGSC isoforms displayed results with a bimodal distribution (Fig. 7 F′). Post hoc data revision revealed a transient current peak during the upstroke of the AP command in varying degrees for Nav1.1–1.3 and Nav1.7, most likely caused by insufficient pipette capacitance compensation. When this transient current exceeded the more or less evenly pronounced subthreshold influx, the measured time point was shifted, forming the second cluster depicted in Fig. 7 F′. For Nav1.8, which also displayed a slightly clustered distribution, no similar effect could be observed. By excluding the measurements impeded by above-mentioned transients, channel distribution became even more distinct: Nav1.1–1.3 and Nav1.7 had their maximum influx during the subthreshold phase of the AP command, considerably before Nav1.5, Nav1.6, and Nav1.8 (Fig. S3 and Table S14).

Time point at which the maximum inward current during AP3 after exclusion of measurements impeded by transient current artifacts.
Time point at which the maximum inward current during AP3 after exclusion of measurements impeded by transient current artifacts.
During the subthreshold phase of the APs maximum inward current, AUC and inward current slope differed between the VGSC isoforms (P < 0.0001 for all Kruskal–Wallis tests except for AP1 subthreshold AUC [P = 0.0008]). On average, maximum inward currents increased with increasing subthreshold slope of the AP commands (Fig. 8, G–I and Table S13). Post-hoc testing indicates that Nav1.8 and Nav1.5 elicited little to no current during the subthreshold phase, while maximum inward current was higher for Nav1.3 (AP1 and AP3), Nav1.7 (AP2 and AP3), and, for AP1, Nav1.6 (Fig. 8, G–I and Table S14). Especially for AP3 with the steepest subthreshold slope, Nav1.3 currents increased drastically (Fig. 8 I and Tables S13 and S14). The remaining TTXs isoforms had intermediate maximum inward current responses.
A similar pattern was observed for the subthreshold phase AUC (Fig. 8, J–L, and Tables S13 and S14). Nav1.5 and Nav1.8 AUC values remained close to zero for all AP commands (note that negative AUC values occur due to undulation of the current base rate and/or drift). Nav1.7 and Nav1.3 displayed larger subthreshold AUC values (the latter particularly for AP3), thereby adding a larger charge to a cell during subthreshold depolarization and potentially alleviating initiation of an AP.
As another measure of channel contribution to subthreshold depolarization, we determined the slope of currents elicited during the subthreshold phase of AP clamping by each VGSC isoform (Fig. 8, M–O, and Tables S13 and S14). Steeper subthreshold slopes were documented for Nav1.7 (AP2 and AP3), Nav1.6 (AP1 and AP2), and, with emphasis on AP3, Nav1.3 compared with the other tested channels. In contrast, Nav1.5 and Nav1.8 subthreshold slopes were minor. The data are in line with the assumption that Nav1.8 is mainly activated during the upstroke of a nociceptor AP, while TTXs channels (predominantly Nav1.7, Nav1.6, and—especially for steeper subthreshold depolarizations—Nav1.3) contribute in earlier, subthreshold phases.
In silico simulation suggests significant contribution of Nav1.9 to the fast upstroke of the AP and its shoulder
With the large data set in hand, which contains patch-clamp recordings of all VGSCs relevant in nociceptors, we now aimed to obtain insights into the contribution of each isoform to the AP by in silico experiments. Our computational model comprises the sodium currents of Nav1.1–Nav1.3, Nav1.5–Nav1.8 (derived from the current trace measurements of this study), and Nav1.9 (derived from current trace measurements of Leipold et al. [2013] and Leipold et al. [2015]), and a generic potassium and leak current (see Materials and methods and Online supplemental material).
To generate an adequate fit of the recorded current traces of the different VGSCs, we implemented a modification to the original Hodgkin–Huxley model: we introduced a waiting state after pulse onset due to which the fast inactivation gate (denoted as h in the Hodgkin–Huxley framework) is delayed (see Materials and methods and Online supplemental material). This waiting state could mimic the time during which VGSC may open and are not ready to inactivate yet. This modification led to improved trace fitting for Nav1.1–1.3 and Nav1.5–1.8, as can be seen in the reduced deviation from the original trace (see Online supplemental material). The Hodgkin–Huxley–like models of each sodium channel subtype were integrated into a nonspatial model of an Aδ-fiber and a CMi, which were used to simulate APs in response to current injections (see Materials and methods and Online supplemental material).
To model CMi (Fig. 9 and Fig. S4) and Aδ-fibers (Fig. 10 and Fig. S5), we accounted for the fiber-specific expression patterns of VGSCs quantified in Tavares-Ferreira et al. (2022), as these sequencing results provide well-accessible, reliable human expression data of all VGSCs in sensory neurons.

Computer simulations of APs in a CMi. The pie charts indicate the abundance of different VGSC isoforms. APs are triggered by an injection of 30 μA/cm2, which persists until the end of the simulation. (A) The upper left panel shows the AP for the relative abundance of VGSC isoforms quantified in spatial gene expression. The initial condition of the simulation is the resting state of the fiber. The other panels show changes of the AP resulting from removal of Nav1.9 (upper right), Nav1.8 (middle left), Nav1.7 (middle right), and Nav1.1–1.3, 1.5, and 1.6 (bottom left). The VGSC isoforms are coded by the colors specified in the bottom right panel. (B and C) VGSC isoform contributions to the simulated AP depicted in the upper left panel of A. The upper panels of B and C show the membrane potential during the initial 3 ms (B) and 1.5 ms (C) of the simulated AP. The middle panels show the relative contribution of the different sodium currents, the potassium current, and the leak current over the course of the AP, plotted as stacked individual currents normalized to total current at each time point. The bottom panels show VGSC isoform contributions to the total sodium current, plotted as stacked individual VGSC isoform currents normalized to the total sodium current at each time point. The black line visualizes the shape of the AP. The color coding is identical to that in A.
Computer simulations of APs in a CMi. The pie charts indicate the abundance of different VGSC isoforms. APs are triggered by an injection of 30 μA/cm2, which persists until the end of the simulation. (A) The upper left panel shows the AP for the relative abundance of VGSC isoforms quantified in spatial gene expression. The initial condition of the simulation is the resting state of the fiber. The other panels show changes of the AP resulting from removal of Nav1.9 (upper right), Nav1.8 (middle left), Nav1.7 (middle right), and Nav1.1–1.3, 1.5, and 1.6 (bottom left). The VGSC isoforms are coded by the colors specified in the bottom right panel. (B and C) VGSC isoform contributions to the simulated AP depicted in the upper left panel of A. The upper panels of B and C show the membrane potential during the initial 3 ms (B) and 1.5 ms (C) of the simulated AP. The middle panels show the relative contribution of the different sodium currents, the potassium current, and the leak current over the course of the AP, plotted as stacked individual currents normalized to total current at each time point. The bottom panels show VGSC isoform contributions to the total sodium current, plotted as stacked individual VGSC isoform currents normalized to the total sodium current at each time point. The black line visualizes the shape of the AP. The color coding is identical to that in A.

Computer simulations of APs in a CMi. The pie charts indicate the abundance of different VGSC isoforms. APs are triggered by an injection of 40 μA/cm2, which persists until the end of the simulation. (A) The upper left panel shows the APs for the relative abundance of VGSC isoforms quantified in spatial gene expression. The initial condition of the simulation is the resting state of the CMi. The other panels show changes of the AP resulting from removal of Nav1.9 (upper right), Nav1.8 (middle left), Nav1.7 (middle right), and Nav1.1–1.3, 1.5, and 1.6 (bottom left). The VGSC isoforms are coded by the colors specified in the bottom right panel. (B and C) VGSC isoform contributions to the simulated AP depicted in the upper left panel of A. The upper panels of B and C show the membrane potential during the initial 3 ms (B) and 1.5 ms (C) of the simulated AP. The middle panels show the relative contribution of the different sodium currents, the potassium current, and the leak current over the course of the AP, plotted as stacked individual currents normalized to total current at each time point. The bottom panels show VGSC isoform contributions to the total sodium current, plotted as stacked individual VGSC isoform currents normalized to the total sodium current at each time point. The black line visualizes the shape of the AP. The color coding is identical to that in A.
Computer simulations of APs in a CMi. The pie charts indicate the abundance of different VGSC isoforms. APs are triggered by an injection of 40 μA/cm2, which persists until the end of the simulation. (A) The upper left panel shows the APs for the relative abundance of VGSC isoforms quantified in spatial gene expression. The initial condition of the simulation is the resting state of the CMi. The other panels show changes of the AP resulting from removal of Nav1.9 (upper right), Nav1.8 (middle left), Nav1.7 (middle right), and Nav1.1–1.3, 1.5, and 1.6 (bottom left). The VGSC isoforms are coded by the colors specified in the bottom right panel. (B and C) VGSC isoform contributions to the simulated AP depicted in the upper left panel of A. The upper panels of B and C show the membrane potential during the initial 3 ms (B) and 1.5 ms (C) of the simulated AP. The middle panels show the relative contribution of the different sodium currents, the potassium current, and the leak current over the course of the AP, plotted as stacked individual currents normalized to total current at each time point. The bottom panels show VGSC isoform contributions to the total sodium current, plotted as stacked individual VGSC isoform currents normalized to the total sodium current at each time point. The black line visualizes the shape of the AP. The color coding is identical to that in A.

Computer simulations of APs in an Aδ-fiber. The pie charts indicate the abundance of different VGSC isoforms. APs are triggered by an injection of 30 μA/cm2 which persists until the end of the simulation. (A) The upper left panel shows the AP for the relative abundance of VGSC isoforms quantified in spatial gene expression. The initial condition of the simulation is the resting state of the fiber. The other panels show changes of the AP resulting from removal of Nav1.9 (upper right), Nav1.8 (middle left), Nav1.7 (middle right), and Nav1.1–1.3, 1.5, and 1.6 (bottom left). The VGSC isoforms are coded by the colors specified in the bottom right panel. (B and C) VGSC isoform contributions to the simulated AP depicted in the upper left panel of A. The upper panels of B and C show the membrane potential during the initial 3 ms (B) and 1.5 ms (C) of the simulated AP. The middle panels show the relative contribution of the different sodium currents, the potassium current, and the leak current over the course of the AP, plotted as stacked individual currents normalized to total current at each time point. The bottom panels show VGSC isoform contributions to the total sodium current, plotted as stacked individual VGSC isoform currents normalized to the total sodium current at each time point. The black line visualizes the shape of the AP. The color coding is identical to that in A.
Computer simulations of APs in an Aδ-fiber. The pie charts indicate the abundance of different VGSC isoforms. APs are triggered by an injection of 30 μA/cm2 which persists until the end of the simulation. (A) The upper left panel shows the AP for the relative abundance of VGSC isoforms quantified in spatial gene expression. The initial condition of the simulation is the resting state of the fiber. The other panels show changes of the AP resulting from removal of Nav1.9 (upper right), Nav1.8 (middle left), Nav1.7 (middle right), and Nav1.1–1.3, 1.5, and 1.6 (bottom left). The VGSC isoforms are coded by the colors specified in the bottom right panel. (B and C) VGSC isoform contributions to the simulated AP depicted in the upper left panel of A. The upper panels of B and C show the membrane potential during the initial 3 ms (B) and 1.5 ms (C) of the simulated AP. The middle panels show the relative contribution of the different sodium currents, the potassium current, and the leak current over the course of the AP, plotted as stacked individual currents normalized to total current at each time point. The bottom panels show VGSC isoform contributions to the total sodium current, plotted as stacked individual VGSC isoform currents normalized to the total sodium current at each time point. The black line visualizes the shape of the AP. The color coding is identical to that in A.

Computer simulations of AP in an Aδ-fiber. The pie charts indicate the abundance of different VGSC isoforms. APs are triggered by an injection of 40 μA/cm2, which persists until the end of the simulation. (A) The upper left panel shows the APs for the relative abundance of VGSC isoforms quantified in spatial gene expression. The initial condition of the simulation is the resting state of the Aδ-fiber. The other panels show changes of the AP resulting from removal of Nav1.9 (upper right), Nav1.8 (middle left), Nav1.7 (middle right), and Nav1.1–1.3, 1.5, and 1.6 (bottom left). The VGSC isoforms are coded by the colors specified in the bottom right panel. (B and C) VGSC isoform contributions to the simulated AP depicted in the upper left panel of A. The upper panels of B and C show the membrane potential during the initial 3 ms (B) and 1.5 ms (C) of the simulated AP. The middle panels show the relative contribution of the different sodium currents, the potassium current, and the leak current over the course of the AP, plotted as stacked individual currents normalized to total current at each time point. The bottom panels show VGSC isoform contributions to the total sodium current, plotted as stacked individual VGSC isoform currents normalized to the total sodium current at each time point. The black line visualizes the shape of the AP. The color coding is identical to that in A.
Computer simulations of AP in an Aδ-fiber. The pie charts indicate the abundance of different VGSC isoforms. APs are triggered by an injection of 40 μA/cm2, which persists until the end of the simulation. (A) The upper left panel shows the APs for the relative abundance of VGSC isoforms quantified in spatial gene expression. The initial condition of the simulation is the resting state of the Aδ-fiber. The other panels show changes of the AP resulting from removal of Nav1.9 (upper right), Nav1.8 (middle left), Nav1.7 (middle right), and Nav1.1–1.3, 1.5, and 1.6 (bottom left). The VGSC isoforms are coded by the colors specified in the bottom right panel. (B and C) VGSC isoform contributions to the simulated AP depicted in the upper left panel of A. The upper panels of B and C show the membrane potential during the initial 3 ms (B) and 1.5 ms (C) of the simulated AP. The middle panels show the relative contribution of the different sodium currents, the potassium current, and the leak current over the course of the AP, plotted as stacked individual currents normalized to total current at each time point. The bottom panels show VGSC isoform contributions to the total sodium current, plotted as stacked individual VGSC isoform currents normalized to the total sodium current at each time point. The black line visualizes the shape of the AP. The color coding is identical to that in A.
The maximal total voltage-gated sodium, potassium, and leak conductivities were chosen to recapitulate the experimentally observed AP morphology. In the simulations, the APs were triggered by current injection of 30 µA/cm2 (Fig. 9 and Fig. 10) or 40 µA/cm2 (Fig. S4 and Fig. S5) throughout the experiment. Both fiber types revealed an AP with an overshoot and a shoulder (stronger for CMi) upon stimulation with 30 µA/cm2 (Fig. 9 A and Fig. 10 A) and 40 µA/cm2 (Fig. S4 A and Fig. S5 A).
To assess the role of a specific VGSC isoform, we removed it from the model and observed the resulting AP changes (Fig. 9 A, Fig. 10 A, Fig. S4 A, Fig. S5 A, and Fig. S6). Notably, the removal of an isoform resulted in a reduction of the total GNa.

Overlay of simulated APs in a CMi and in an Aδ-fiber. (A and B) AP for the CMi with the relative abundance of VGSC isoforms quantified in spatial gene expression (black, isoform abundances as in Fig. 9 A, upper left panel) and changes of the AP resulting from removal of Nav1.9 (yellow), Nav1.8 (orange), Nav1.7 (gray), and Nav1.1–1.3, 1.5, and 1.6 (brown). The current injections of 30 μA/cm2 (A) and 40 μA/cm2 (B) persist until the end of the simulation. (C and D) AP for the Aδ-fiber with the relative abundance of VGSC isoforms quantified in spatial gene expression (black, isoform abundances as in Fig. 10 A, upper left panel) and changes of the AP resulting from removal of Nav1.9 (yellow), Nav1.8 (orange), Nav1.7 (gray), and Nav1.1–1.3, 1.5, and 1.6 (brown). The current injections of 30 μA/cm2 (C) and 40 μA/cm2 (D) persist until the end of the simulation.
Overlay of simulated APs in a CMi and in an Aδ-fiber. (A and B) AP for the CMi with the relative abundance of VGSC isoforms quantified in spatial gene expression (black, isoform abundances as in Fig. 9 A, upper left panel) and changes of the AP resulting from removal of Nav1.9 (yellow), Nav1.8 (orange), Nav1.7 (gray), and Nav1.1–1.3, 1.5, and 1.6 (brown). The current injections of 30 μA/cm2 (A) and 40 μA/cm2 (B) persist until the end of the simulation. (C and D) AP for the Aδ-fiber with the relative abundance of VGSC isoforms quantified in spatial gene expression (black, isoform abundances as in Fig. 10 A, upper left panel) and changes of the AP resulting from removal of Nav1.9 (yellow), Nav1.8 (orange), Nav1.7 (gray), and Nav1.1–1.3, 1.5, and 1.6 (brown). The current injections of 30 μA/cm2 (C) and 40 μA/cm2 (D) persist until the end of the simulation.
The most striking finding of our simulations is the strong contribution of Nav1.9 to the fast upstroke of the AP as well as to the formation of a shoulder in both fiber types (Fig. 9, B and C; Fig. 10, B and C; Fig. S4, B and C; Fig. S5, B and C; Fig. S6; and Fig. S7). Omission of Nav1.9 at low stimulation intensities aborted AP generation, very similar to omission of Nav1.7 (Fig. 9 A and Fig. 10 A). The latter simulates loss-of-function as it may occur for Nav1.7 in patients suffering from chronic insensitivity to pain (Lampert et al., 2014). While removal of Nav1.8 from the model resulted in AP waveforms that failed to overshoot, this intervention did not affect formation of the AP shoulder, suggesting that other subtypes such as Nav1.9 may contribute to shoulder formation (Fig. 9 A and Fig. 10 A).

Simulated contribution of Na v 1.9 to APs in a CMi. The black line (control) shows the AP in a CMi with the relative abundance of VGSC isoforms quantified in spatial gene expression (isoform abundances as in Fig. 9 A, upper left panel). The maximal conductance of Nav1.9 is stepwise reduced to 50% (red line), 25% (green line), and 0% (blue line) compared with the control scenario. The maximal conductances of the other isoforms are increased proportionally to their expression, such that the total maximal GNa remains unchanged. This is different to Fig. 9 A, where the total maximal GNa decreased upon removal of a VGSC isoform. The current injections of 30 μA/cm2 persist until the end of the simulation.
Simulated contribution of Na v 1.9 to APs in a CMi. The black line (control) shows the AP in a CMi with the relative abundance of VGSC isoforms quantified in spatial gene expression (isoform abundances as in Fig. 9 A, upper left panel). The maximal conductance of Nav1.9 is stepwise reduced to 50% (red line), 25% (green line), and 0% (blue line) compared with the control scenario. The maximal conductances of the other isoforms are increased proportionally to their expression, such that the total maximal GNa remains unchanged. This is different to Fig. 9 A, where the total maximal GNa decreased upon removal of a VGSC isoform. The current injections of 30 μA/cm2 persist until the end of the simulation.
To investigate this further, we reduced the conductance of Nav1.9 gradually in our CMi-model while increasing that of the other sodium channels to keep the overall VGSC conductance constant (Fig. S7). Reducing Nav1.9 gradually flattened the shoulder; the fast upstroke of the AP turned less steep, and subthreshold depolarizations following the AP disappeared. Additionally, the after hyperpolarization was reduced, which may reflect a weaker activation of voltage-gated potassium channels due to the vanishing of the shoulder. Removal of Nav1.1–1.3, Nav1.5, and Nav1.6 (at the same time) had no significant impact on the AP of the CMi but reduced the overshoot in the Aδ-fiber (Fig. 9 A, Fig. 10 A, Fig. S4 A, Fig. S5 A, and Fig. S6).
Fig. 9, B and C; and Fig. 10, B and C, show the relative contributions of the different VGSC isoforms to the simulated APs of the CMi and the Aδ-fiber, respectively. In both fiber types, the relative contribution of Nav1.7 is maximal right before or at the beginning of the fast upstroke of the AP (Fig. 9 C, Fig. 10 C, Fig. S4 C, and Fig. S5 C), in line with reports on Nav1.7 as a subthreshold or threshold channel (Rush et al., 2007; Vasylyev and Waxman, 2012; Meents et al., 2019). The largest relative (Fig. 9, B and C; and Fig. 10, B and C), but also absolute (Fig. S8), conduction by far in our two models is mediated by Nav1.9. Most of its relative contribution occurs during subthreshold depolarizations, then during the fast upstroke of the AP (relative and absolute), and, with a prominent second peak (relative and absolute), during the falling phase of the AP coinciding with the shoulder.

Simulated sodium currents and conductances in a CMi and Aδ-fiber. (A) Absolute sodium currents over the course of the simulated AP of the CMi depicted in Fig. 9 A, upper left panel. (B) Conductances of the different VGSC isoforms over the course of the simulated AP of the CMi depicted in Fig. 9 A, upper left panel. (C) Absolute sodium currents over the course of the simulated AP of the Aδ-fiber depicted in Fig. 10 A, upper left panel. (D) Conductances of the different VGSC isoforms over the course of the simulated AP of the Aδ-fiber depicted in Fig. 10 A, upper left panel. The current injections of 30 μA/cm2 persist until the end of the simulation. The dotted black line visualizes the time course of the membrane potential during the AP.
Simulated sodium currents and conductances in a CMi and Aδ-fiber. (A) Absolute sodium currents over the course of the simulated AP of the CMi depicted in Fig. 9 A, upper left panel. (B) Conductances of the different VGSC isoforms over the course of the simulated AP of the CMi depicted in Fig. 9 A, upper left panel. (C) Absolute sodium currents over the course of the simulated AP of the Aδ-fiber depicted in Fig. 10 A, upper left panel. (D) Conductances of the different VGSC isoforms over the course of the simulated AP of the Aδ-fiber depicted in Fig. 10 A, upper left panel. The current injections of 30 μA/cm2 persist until the end of the simulation. The dotted black line visualizes the time course of the membrane potential during the AP.
Nav1.8, on the other hand, shows the largest conductivity during the upstroke, the peak, and the falling phase of the AP (Fig. 9, B and C; Fig. 10, B and C; Fig. S4, B and C; Fig. S5, B and C; and Fig. S8), but when the AP shoulder occurs, it seems to be already partially inactivated. The relative and absolute contribution of Nav1.8 and Nav1.7 to the AP, especially during the peak, seems to be flipped between the two fiber models investigated here: while in the CMi model, Nav1.7 contributes more, it is Nav1.8 in the Aδ-fiber model. The other channels show only minor contributions during the course of the AP: Nav1.5 shows some activity during subthreshold depolarizations and a small peak during the shoulder in the Aδ-fiber model, while Nav1.6 is active at the AP threshold in both models. Nav1.6 is continuously active throughout the AP in the Aδ model (Fig. 9, B and C; Fig. 10, B and C; Fig. S4, B and C; Fig. S5, B and C; and Fig. S8).
Gain-of-function mutations of Nav1.7 linked to inherited pain syndromes often modify channel gating such that during an AP more channels are activated. Erythromelalgia mutations in Nav1.7 lead to hyperpolarized activation of the channel, inducing hyperexcitability when overexpressed in rodent sensory neurons (Körner and Lampert, 2020) and enhancing spontaneous activity in human stem cell–derived nociceptors (Mis et al., 2019). We used our computational model to simulate gain-of-function in two ways: (1) by increasing the maximal conductance of Nav1.7 and comparing it to an increased Nav1.8 conductance and (2) by shifting activation of Nav1.7 to more hyperpolarized potentials.
When we increased Nav1.7 conduction by five times in our computer model, both the CMi model and the Aδ-fiber model showed persistent firing in response to an ongoing current injection of 1 and 1.75 µA/cm2, respectively (Fig. 11 A and Fig. 12 A). Interestingly, enhancing Nav1.8 conduction by 11 times in the CMi and by 8 times in the Aδ-fiber (revealing similar overall conductance as for a fivefold increased Nav1.7 conductance) was unable to induce ongoing AP firing (Fig. 11 B and Fig. 12 B). This finding supports the concept that the specific properties of Nav1.7 and not the increase of the total GNa trigger the repetitive activity observed in Fig. 11 A and Fig. 12 A.

Computational disease modelling in a CMi. (A) Repetitive depolarizations resulting from increasing the maximal conductance for Nav1.7 to 500% of the WT value. The current injection of 1 μA/cm2 persists until the end of the simulation. (B) An increase of the maximal conductance for Nav1.8 to 1,100% of the WT value results in an isolated AP. The total GNa in A and B are approximately the same. The current injections of 30 and 40 μA/cm2 persist until the end of the simulations. The pie charts indicate the abundance of different VGSC isoforms. (C) Current injections of 10 and 15 μA/cm2 trigger no APs in the simulated WT CMi (isoform abundances as in Fig. 9 A, upper left panel). (D) If the activation of Nav1.7 is shifted by 5 mV to hyperpolarized potentials, a current injection of 15 μA/cm2 but not of 10 μA/cm2 triggers an AP. (E) If the activation of Nav1.7 is shifted by 8 mV to hyperpolarized potentials, current injections of 10 and 15 μA/cm2 trigger an AP. The current injections in C–E persist until the end of the simulation.
Computational disease modelling in a CMi. (A) Repetitive depolarizations resulting from increasing the maximal conductance for Nav1.7 to 500% of the WT value. The current injection of 1 μA/cm2 persists until the end of the simulation. (B) An increase of the maximal conductance for Nav1.8 to 1,100% of the WT value results in an isolated AP. The total GNa in A and B are approximately the same. The current injections of 30 and 40 μA/cm2 persist until the end of the simulations. The pie charts indicate the abundance of different VGSC isoforms. (C) Current injections of 10 and 15 μA/cm2 trigger no APs in the simulated WT CMi (isoform abundances as in Fig. 9 A, upper left panel). (D) If the activation of Nav1.7 is shifted by 5 mV to hyperpolarized potentials, a current injection of 15 μA/cm2 but not of 10 μA/cm2 triggers an AP. (E) If the activation of Nav1.7 is shifted by 8 mV to hyperpolarized potentials, current injections of 10 and 15 μA/cm2 trigger an AP. The current injections in C–E persist until the end of the simulation.

Computational disease modelling in an Aδ fiber. (A) Repetitive depolarizations resulting from increasing the maximal conductance for Nav1.7 to 500% of the WT value. The current injection of 1.75 μA/cm2 persists until the end of the simulation. (B) An increase of the maximal conductance for Nav1.8 to 800% of the WT value results in an isolated AP. The total GNa in A and B are approximately the same. The current injections of 30 and 40 μA/cm2 persist until the end of the simulations. The pie charts indicate the abundance of different VGSC isoforms. (C) Current injections of 8 and 10 μA/cm2 trigger no APs in the simulated WT CMi (isoform abundances as in Fig. 10 A, upper left panel). (D) If the activation of Nav1.7 is shifted by 5 mV to hyperpolarized potentials, a current injection of 10 μA/cm2 but not of 8 μA/cm2 triggers an AP. (E) If the activation of Nav1.7 is shifted by 8 mV to hyperpolarized potentials, current injections of 8 and 10 μA/cm2 trigger an AP. The current injections in C–E persist until the end of the simulation.
Computational disease modelling in an Aδ fiber. (A) Repetitive depolarizations resulting from increasing the maximal conductance for Nav1.7 to 500% of the WT value. The current injection of 1.75 μA/cm2 persists until the end of the simulation. (B) An increase of the maximal conductance for Nav1.8 to 800% of the WT value results in an isolated AP. The total GNa in A and B are approximately the same. The current injections of 30 and 40 μA/cm2 persist until the end of the simulations. The pie charts indicate the abundance of different VGSC isoforms. (C) Current injections of 8 and 10 μA/cm2 trigger no APs in the simulated WT CMi (isoform abundances as in Fig. 10 A, upper left panel). (D) If the activation of Nav1.7 is shifted by 5 mV to hyperpolarized potentials, a current injection of 10 μA/cm2 but not of 8 μA/cm2 triggers an AP. (E) If the activation of Nav1.7 is shifted by 8 mV to hyperpolarized potentials, current injections of 8 and 10 μA/cm2 trigger an AP. The current injections in C–E persist until the end of the simulation.
With unshifted Nav1.7 activation, subthreshold stimulations of 10 or 15 µA/cm2 did not evoke an AP in the CMi model (Fig. 11 C), and neither did subthreshold stimulations of 8 or 10 µA/cm2 in the Aδ-fiber model (Fig. 12 C). When Nav1.7 activation was shifted to hyperpolarized potentials by only 5 mV—which is often observed in erythromelalgia mutations (e.g., Lampert et al., 2009)—an AP was initiated by small stimulations, showing a reduced firing threshold (Fig. 11 D and Fig. 12 D). When shifted by 8 mV, weak stimulations even induced an AP followed by several dampened, repetitive depolarizations (Fig. 11 E and Fig. 12 E).
Taken together, our simulations, including Hodgkin–Huxley–like models of all nociceptive sodium channels, suggest a contribution of Nav1.9 to the fast upstroke of the AP and its shoulder formation and proved useful in modelling excitability changes associated with Nav1.7-linked chronic pain syndromes such as erythromelalgia.
Discussion
In this study, we provide a detailed, comparative investigation of the gating properties of all VGSCs relevant in nociceptors with a focus on subthreshold depolarizations and propose computational models to predict their contributions to AP electrogenesis in two types of sensory neurons: CMi and Aδ-fibers. The models suggest that Nav1.9 may actively contribute to AP generation and formation of its shoulder in these neurons.
VGSC isoforms are characterized by their distinct gating behavior in vitro and in silico
The TTXr channels measured in this study, i.e., Nav1.5 and Nav1.8, showed divergent gating properties with shifted voltage dependence of activation, SSFI, and ramp currents toward hyperpolarized and depolarized voltages, respectively. While Nav1.9 activation occurred at very hyperpolarized voltages, voltage dependence of Nav1.9 SSFI resembled the depolarized inactivation of Nav1.8. Out of the remaining TTXs channels, which all had their voltage dependence of activation, SSFI and ramp currents at subthreshold voltages, especially Nav1.3 and Nav1.7, elicited prominent currents in ramp and AP clamping. During the subthreshold phases of AP clamping, both displayed large AUC values and steeper current slopes compared with the other VGSCs tested. For Nav1.7, we observed slightly more hyperpolarized voltage dependences for both SSFI and ramp currents than for other TTXs channel isoforms, potentially enabling Nav1.7 to charge a cell at subthreshold or threshold voltages.
Our experiments emphasized the importance of Nav1.7 as an AP initiator, also since knocking out or enhancing Nav1.7 in silico led to omitted or multiple APs, respectively. This resembles putative loss- and gain-of-function pathophysiology that is attributed to Nav1.7 channelopathies (Dib-Hajj et al., 2005; Cox et al., 2006; Faber et al., 2012; Bennett et al., 2019; McDermott et al., 2019). Shifting activation of Nav1.7 to more hyperpolarized potentials in models for CMi or Aδ-fibers revealed the experimentally observed threshold reduction, suggesting the high potential of our simulations for disease modelling.
Our findings confirmed Nav1.8 contribution to the AP upstroke (Renganathan et al., 2001; Matsutomi et al., 2006; Rush et al., 2007; Vasylyev and Waxman, 2012), as it activates and fast-inactivates at more depolarized potentials, elicits large ramp currents at more depolarized potentials and shows little to no subthreshold activity in AP clamping compared with the other VGSCs tested. Interestingly, in our simulations including Nav1.9, the contribution of Nav1.8 to the shoulder was minor: knocking out Nav1.8 in the in silico experiments left APs in the CMi-model almost unchanged, while in the Aδ-model the overshoot was reduced. This is in line with findings from Nav1.8 knockout DRGs, where maximum AP voltages were lower compared with WT DRGs (Renganathan et al., 2001; Harty and Waxman, 2007). Yet, the initiation of the AP was not impeded when Nav1.8 was omitted from the established model.
The strongest difference between the two fibers modelled in this study is the inverse relative contribution of Nav1.7 compared with Nav1.8 during the AP: for the CMi model, Nav1.7 has the larger current and conductivity, whereas for the Aδ-fiber model it is Nav1.8. In an earlier modelling study, we investigated the contribution of Nav1.7, Nav1.8, and Nav1.9 to the excitability of a peripheral C-fiber to reproduce axonal spike propagation speed and activity-dependent slowing as recorded in microneurography experiments (Tigerholm et al., 2014; Tigerholm et al., 2015). We showed that the speed of two APs following each other depends on the influx of sodium through Nav1.7 relative to Nav1.8 current. Thus, fiber-specific biophysical properties may result from the specific contribution of the sodium channels expressed in their membrane.
Our simulations suggest that Nav1.9, in addition to its activation during rest, strongly contributes to the fast upstroke and is a major determinant of the shoulder of the AP. It represents by far the largest current and conductivity in our model of all integrated channels, and Nav1.9 currents were recorded in >80% of human DRG in a recent patch-clamp study (Zhang et al., 2024). Our findings are in line with current-clamp recordings on enteric neurons from Nav1.9 knockout mice, which show no shoulder in APs from mice lacking Nav1.9 (Osorio et al., 2014). An early report on the sensory neuron AP properties of those knockout mice revealed no differences in their AP width (Priest et al., 2005). The latter study did not differentiate between sensory neuron subtypes, yet in the realm of recent transcriptomic advances, we know that Nav1.9 expression differs strongly between subgroups (Tavares-Ferreira et al., 2022). It is also known that not all sensory neuron subtypes display a shoulder in their AP (Körner and Lampert, 2022). Thus, pooling the groups may have hidden the effect of Nav1.9 on the AP shoulder in this study. As Nav1.9 channelopathies are linked to both gain- and loss-of-pain syndromes (Leipold et al., 2013; Huang et al., 2017), clarification of the fiber type-specific role of Nav1.9 during AP generation could help to understand their complex pathophysiology.
We documented large Nav1.3 currents during clamping of an AP with a steep subthreshold voltage slope (AP3), and—consistent with literature—during steeper voltage ramps (Cummins et al., 2001). This might play a role in neuropathic pain, as—though only marginally expressed in C- and Aδ-fibers—some studies suggest that Nav1.3 is upregulated in spinal cord injuries or peripheral nerve injuries in rodents and therefore increases excitability (Hains et al., 2003; Hains et al., 2004; Lampert et al., 2006). Other studies present more ambiguous or even contradictory results, e.g., Nav1.3 knockout mice did not show lowered pain thresholds after nerve injury than WT mice (Lindia et al., 2005; Nassar et al., 2006).
Nav1.6 stood out to some extent, as it showed higher maximum inward currents and steeper current slopes during the subthreshold phase of AP clamping than other TTXs VGSC isoforms. Furthermore, Nav1.6 current was larger in the Aδ-fiber than in the CMi during the course of the AP. Yet, omitting Nav1.1, Nav1.2, and Nav1.6 during the in silico testing had no noticeable effect on AP morphology, likely because of their minor share in the spatial transcriptomics-derived expression patterns used in our model (Tavares-Ferreira et al., 2022). Nav1.6 has been linked to resurgent currents (O’Brien and Meisler, 2013), and these currents seem to be enhanced in A-fibers compared with C-fibers (Klinger et al., 2012). This is suggested as a reason why sea anemone toxin ATX-II led to painful sensations by enhancing resurgent currents in A-fibers, but not in C-fibers (Klinger et al., 2012).
Nav1.5 played no major role during subthreshold AP clamping and in contributing to the simulated AP, while it is also only marginally detected in C- and Aδ-fibers (Tavares-Ferreira et al., 2022). Due to its hyperpolarized activation and SSFI, it may be responding in cells with more hyperpolarized membrane potential. During development, Nav1.5 is the third TTXr conductance present and may have a more prominent role than observed in the two fiber types described here (reflecting the transcriptomic expression pattern of adult DRG donors). The role of Nav1.5 during development, injury, and regeneration needs to be investigated in more detail in follow-up studies (Renganathan et al., 2002; Tseng et al., 2010; Sousounis et al., 2020).
Correlation between ramp current and window current is channel subtype specific
Slowly depolarizing voltage ramps induce ramp currents, mimicking the subthreshold phase of an AP. Ramp currents of WT channels have been examined for all VGSC isoforms individually (Cummins et al., 1998; Abriel et al., 2001; Herzog et al., 2003; El-Bizri et al., 2011; Power et al., 2012; Estacion and Waxman, 2013; DeCaen et al., 2014; Han et al., 2015a, 2015b; Zhang et al., 2017), but not yet in direct comparison, establishing experimenter-to-experimenter or lab-to-lab variations. Hereby, we provide an extensive and highly comparable data set of VGSC ramp currents.
While maximum ramp current size and AUC are predominantly influenced by the steepness of the inducing voltage ramp stimulus, VGSC subtypes rather influence the voltage dependence of ramp current responses and hence co-determine in which AP phase they contribute to its formation.
All tested TTXs channel isoforms elicited their peak ramp current at subthreshold voltages, enabling them to contribute to cell discharge prior to the AP threshold being exceeded. Of these subtypes, Nav1.3, Nav1.6, and Nav1.7 elicited the highest maximum ramp currents, corroborating their role as key players in subthreshold depolarization.
In VGSC literature, ramp and window currents were often assumed to describe a similar gating mechanism and were sometimes even used interchangeably (Wang et al., 1996; Magistretti and Alonso, 1999; Abriel et al., 2001; Blair and Bean, 2002; Enomoto et al., 2006; Matsutomi et al., 2006; Vasylyev and Waxman, 2012; Estacion and Waxman, 2013; Osteen et al., 2017). We here tested this hypothesis and showed that Nav1.1 and Nav1.2 (partly also Nav1.5, Nav1.7, and Nav1.8) showed a positive correlation between ramp current and window currents, suggesting a common underlying mechanism. Yet, because for Nav1.3 and Nav1.6 correlation was mostly nonexistent, we suppose that additional factors such as persistent current play into ramp current formation, as suggested previously (Estacion and Waxman, 2013).
Expression systems affect in vitro VGSC measurements
Heterologous expression systems bear their own interpretation pitfalls, as they do not resemble the complex environment of primary neurons, e.g., regarding cell morphology, intercellular contacts, or membrane protein interactions. VGSC isoforms were shown to have different gating properties when expressed in different expression systems (Cummins et al., 2001; Rush et al., 2006a; Tan and Soderlund, 2009; Zhang et al., 2017).
In this study, we used both HEK and ND7/23 cells for electrophysiological VGSC examination. Multiple differences in their respective cell characteristics lead to subtype gating differences among each other having to be analyzed carefully. While endogenous Nav1.6 and Nav1.7 currents in ND7/23 can easily be suppressed by adding TTX to the ECS while measuring TTXr isoforms (Rogers et al., 2016; Lee et al., 2019), altered VGSC gating properties by endogenous expression of β1 and β3 subunits in ND7/23 cells cannot be eliminated (John et al., 2004; Lee et al., 2019). However, HEK cells themselves express β1A subunits endogenously (Moran et al., 2000). Therefore, comparisons between VGSC α subunit measurements have to be treated carefully, nonetheless and additional examination of α subunits in the presence of varying β subunits is encouraged. Furthermore, other cellular proteins such as fibroblast growth factor homologous factors, microtubule-associated proteins, or aquaporins have been shown to modify VGSC gating and/or current density (Wittmack et al., 2004; Rush et al., 2006b; Zhang and Verkman, 2010; O’Brien et al., 2012; Vanoye et al., 2013). Recent comparative studies of Nav1.2 and Nav1.6 variants also highlight the influence of alternative splicing on channel gating (Thompson et al., 2020; Vanoye et al., 2024).
Nav1.8 expression in HEK is challenging, and resulting currents are low (Gladwell et al., 1998; John et al., 2004). As in our hands, the expression of Nav1.8 in HEK293T cells yielded little to no current; we used ND7/23 cells, equivalent to the Nav1.9 measurements integrated into this study (Leipold et al., 2013; Leipold et al., 2015). Biophysical characteristics of Nav1.8 currents were shown to be similar between when expressed in ND7/23 cells or recorded from native DRG TTXr currents (John et al., 2004).
Even non-native neuronal cell lines such as ND7/23 do not resemble a comprehensive primary neuronal environment (Yin et al., 2016). Studies in expression systems closer to human peripheral sensory neurons, such as rodent or human DRG neurons, could give an even better insight into the channels of biophysics in vivo. Moreover, nociceptors derived from human iPSCs offer the possibility to investigate ion channels in an adaption of their native environment (Meents et al., 2019; Mis et al., 2019; Namer et al., 2019). This could also make up for the fact that we included neither co-expression of β-subunits into our measurements nor did we check for channel dimerization, both of which have been shown to alter biophysical properties of VGSCs (Brackenbury and Isom, 2011; Chahine and O’Leary, 2011; Clatot et al., 2017; Rühlmann et al., 2020).
Albeit our observations allow unprecedented comparison between isoforms as the experiments were conducted under the so-far best possible comparable conditions, it may be that differing expression systems do not model certain isoform specificities.
Biophysical differences, such as larger persistent or ramp currents, can occur between VGSC isoforms from different mammalian species (Browne et al., 2009; Tan and Soderlund, 2009; Han et al., 2015a). For Nav1.3 and Nav1.6 measurements in this study, we used rodent channel isoforms. Hence, complementary measurements with human channel isoforms are desirable.
In this study, as well as the studies providing the implemented Nav1.9 data, ICS contained CsF, which is widely used in patch-clamp experiments to enhance high-seal resistances for stable and long-lasting patch-clamp configurations (Kostyuk et al., 1975; Fernandez et al., 1984). Yet, usage of CsF has been shown to affect the gating of VGSCs in a subtype-specific manner. For example, the voltage dependence of activation and inactivation of Nav1.9 is shifted by about 15–20 mV to more hyperpolarized potentials in the presence of CsF (Rugiero et al., 2003; Coste et al., 2004). The gating of Nav1.3 and Nav1.7 is also affected by intracellular fluoride, albeit to a lesser extent (Chen et al., 2000; Meadows et al., 2002; Jarecki et al., 2008). While this does not necessarily limit subtype comparability within our in vitro measurements, which all included CsF, comparison to CsF-free experiments, such as measurements in primary neurons, has to be performed cautiously. Even minor shifts in channel biophysics can profoundly impact complex and therefore vulnerable computational models. Although the model established in this study provides valuable insights into the AP contribution of each channel, reissuing the model with data from CsF-free measurements would be desirable to increase its predictive power.
Limitations of in silico modelling
Computational models are simplifications of the real world and therefore must be handled cautiously, especially when model complexity suggests the opposite. We estimated the distribution of the maximal GNa per VGSC subunit by using mRNA expression data from a human DRG spatial transcriptomics study (Tavares-Ferreira et al., 2022). While this approach is closest to a quantitative measure currently accessible from human DRGs, mRNA expression levels do not always indicate that the respective channel is also translated to protein, trafficked to the cell surface, and fully functional. Even though correlation between mRNA expression, presence of VGSCs in the cell membrane, and biophysical properties has been suggested (Thériault and Chahine, 2014), alternative splicing, correct folding, and association with additional proteins or membrane turnover are just some factors that may impact channel translation from RNA to functional protein in the membrane (Buccitelli and Selbach, 2020). It is possible that mRNA levels do not directly relate to the amount of protein produced in the cells (Lindhout et al., 2020) and that we are overestimating or underestimating the conductance of the VGSCs modelled in this study. As proteomics of human DRGs, especially for VGSCs, is not yet available as a basis for our modelling, we used the published transcriptomics data to estimate the conductivity of the VGSC subtypes integrated into our simulations.
A promising solution to these problems is single-cell transcriptomics combined with functional analysis, such as Patch-seq, which offer the ability to link expression data directly to cell physiology (Lipovsek et al., 2021; Körner et al., 2022, 2024, Preprint) or single-cell proteomics, which are also currently developed for human nociceptors. Furthermore, since expression data are gathered at the cell soma, only limited assumptions can be made for small nerve fibers, e.g., in the human skin.
Several studies suggested the possibility of neuronal channel composition changing in compensation for loss- or gain-of-function mutations in VGSC isoforms, e.g., TTXs currents being upregulated in DRG neurons of Nav1.8 knockout mice (Akopian et al., 1999; Renganathan et al., 2000). Compensatory changes could also involve the expression of other ion channel types, e.g., calcium channels, or pathways indirectly affecting excitability. When modelling the effect of VGSC loss- or gain-of-function mutations in silico, these compensatory changes should be considered as soon as their extent is determined in precedent studies.
VGSC data are usually gathered at room temperature, as it was done in this study. However, the temperature dependence of VGSCs varies for each channel isoform and recorded voltages (Kriegeskorte et al., 2023). Thus, most computational models published in the recent years, including the one established in this study, do not accurately account for temperature, since this would require additional experimental data and re-parametrization of the models (Almog and Korngreen, 2016).
For fitting the gating variables of each channel subtype, we used current traces recorded at several potentials. At voltages below −40 mV, it often occurred that multiple parameter combinations described the currents successfully, creating some uncertainty (unidentifiability). Particularly in the case of Nav1.9, this may impact on simulation results.
Our computational model describes ion channels based on modified Hodgkin–Huxley dynamics and neglects spatial aspects. To further study the VGSC influence on AP generation, the VGSC isoforms should be implemented in a morphologically detailed C-fiber or Aδ-fiber model (Tigerholm et al., 2014; Tigerholm et al., 2019).
VGSC isoform characterization can be the basis for assessing potential drug targets
In this study, we provide a broadly based groundwork for future comparative studies of VGSC isoforms, their biophysics, and interaction with each other. By feeding our measurements into a computational model, we generated an in silico tool to test hypotheses, investigate the contribution of each nociceptive sodium channel to AP genesis, and model pharmacology and the effect of disease-related mutations. This may also prove useful when developing new potential analgesics, such as specific channel blockers, or optimizing therapy schemes for chronic pain.
Data availability
The code used for computational modelling is available at https://github.com/tstiehl/sodium-channels with commentary. All further data gathered in this study (including manual patch-clamp measurements and their analysis procedures) are available from the corresponding authors upon request.
Acknowledgments
Jeanne M. Nerbonne served as editor.
We thank Brigitte Hoch, Petra Hautvast, and Raya A. Bott for their excellent technical support (cell culture, molecular biology, and electrophysiology). We thank Jannis Körner, Sophia Kriegeskorte, and Jannis E. Meents for their thoughtful discussions, as well as Jannis E. Meents for providing the AP stimuli used in this study.
This work was funded by the Deutsche Forschungsgemeinschaft (German Research Foundation 363055819/GRK2415 Mechanobiology of 3D epithelial tissues to A. Lampert; 368482240/GRK2416, MultiSenses-MultiScales to A. Lampert; LA2740/6-1 to A. Lampert; and NA 970/5-1 to B. Namer). A. Lampert (IZKF TN1-1/IA 532001) and B. Namer were supported by a grant from the Interdisciplinary Center for Clinical Research within the Faculty of Medicine at the RWTH Aachen University.
Author contributions: P.A. Köster: conceptualization, data curation, formal analysis, investigation, methodology, software, validation, visualization, and writing—original draft. E. Leipold: data curation, investigation, validation, and writing—review and editing. J. Tigerholm: formal analysis and writing—review and editing. A. Maxion: software and writing—review and editing. B. Namer: writing—review and editing. T. Stiehl: data curation, formal analysis, investigation, methodology, resources, software, validation, visualization, and writing—review and editing. A. Lampert: conceptualization, data curation, funding acquisition, project administration, resources, supervision, and writing—review and editing.
References
This work is part of a special issue on Mapping the Pain Landscape—From Molecules to Medicine.
A preprint of this paper was posted on bioRxiv on September 6, 2023.


