


A critical part of ion channel function is the ability to open and close in response to stimuli and thus conduct ions in a regulated fashion. While x-ray diffraction studies of ion channels suggested a general steric gating mechanism located at the helix bundle crossing (HBC), recent functional studies on several channels indicate that the helix bundle crossing is wide-open even in functionally nonconductive channels. Two NaK channel variants were crystallized in very different open and closed conformations, which served as important models of the HBC gating hypothesis. However, neither of these NaK variants is conductive in liposomes unless phenylalanine 92 is mutated to alanine (F92A). Here, we use NMR to probe distances at near-atomic resolution of the two NaK variants in lipid bicelles. We demonstrate that in contrast to the crystal structures, both NaK variants are in a fully open conformation, akin to Ca2+-bound MthK channel structure where the HBC is widely open. While we were not able to determine what a conductive NaK structure is like, our further inquiry into the gating mechanism suggests that the selectivity filter and pore helix are coupled to the M2 helix below and undergo changes in the structure when F92 is mutated. Overall, our data show that NaK exhibits coupling between the selectivity filter and HBC, similar to K+ channels, and has a more complex gating mechanism than previously thought, where the full opening of HBC does not lead to channel activation.
Introduction
Ion-channel function is defined by the selectivity of the channel and the gating mechanism. Central to understanding the function is the knowledge of ion channel structure. The first x-ray crystal structures of potassium channels were pivotal in cementing the image of widening of the helix bundle crossing (HBC) from a sterically occluded state to a more open state as the principal determinant that initiates ionic current. For example, the initial structure of KcsA has a bundle crossing too narrow for K+ ions to pass (Doyle et al., 1998), which was suggested to be a deactivated nonconductive conformation, while the subsequent structure of MthK has a wide open bundle (Jiang et al., 2002) that was interpreted as an open conductive channel. Over the years, x-ray and EM structures of dozens of different channels have appeared bound to various activators and inhibitors, but almost none of the channels clearly displayed both of the HBC conformations expected for open and closed states (Black et al., 2021). Out of the small handful of examples where mutagenesis was used to obtain atomic resolution structures of both conformations (Cuello et al., 2017; Zubcevic et al., 2014; Cuello et al., 2010b), the structures of NaK channel from Bacillus cereus appear to be the clearest example of gating at the HBC. The full-length NaK x-ray structure displays a narrowly constricted bundle crossing (Shi et al., 2006; hereafter referred to as the “closed” NaK conformation to reflect the narrow HBC constriction), while the removal of an amphipathic helix (M0 removed, NaKΔ19) renders this channel widely open (Alam and Jiang, 2008; hereafter referred to as the “open” NaK conformation to wide open HBC irrespective of whether the channel is conductive)—nicely fitting into the narrative of steric gating at the HBC.
Such a model of gating at the HBC, as derived from observations in NaK and other model channels, has strongly affected how structure–function experiments of ion channels were designed and interpreted. Putative elusive conformations of KcsA were sought out by crosslinking M2 helices with disulfide bonds (Tilegenova et al., 2017) or mutating residues to stabilize the closed HBC conformation (Cuello et al., 2010b). Meanwhile, solid- and solution-state NMR studies on KcsA and KirBac1.1 have interpreted chemical shift perturbation data as supporting the two-state HBC gating model (Xu et al., 2017; Takeuchi et al., 2007; Imai et al., 2010; Imai et al., 2012; van der Cruijsen et al., 2017; Amani et al., 2020). However, in the case of KirBac3.1, it was later demonstrated that the inner helix bundle stabilized with disulfide bonds in a closed conformation still allows K+ ion conduction (Black et al., 2020), and NMR chemical shift-guided structural investigation of the conductive conformation of KcsA suggested a much narrower HBC opening than what was initially believed from the x-ray structures (Pérez-Conesa et al., 2021). The struggle of assigning structures with different HBC conformations to functional states continues with more recent cryo-EM structures, as exemplified by the TASK channel (Rödström et al., 2020; Li et al., 2020), where structural interpretations do not necessarily agree with the functional data and a residue far away from HBC appears to be critical for gating (Ben Soussia et al., 2019).
Even in the case of NaK, certain discrepancies remain regarding the connection between the putative open and closed x-ray structures of NaK and channel function. For example, Rb+ flux assays demonstrate only a marginal increase in flux for an open NaKΔ19 (Alam and Jiang, 2008) construct over the closed full-length channel, and an additional mutation, F92A, is necessary (Derebe et al., 2011) to obtain fluxes observable by single-channel electrophysiology measurements. This observation made the authors themselves question whether the open conformation of NaK is an artifact of crystal packing (Alam and Jiang, 2008). In the case of KcsA, the HBC is still fully open when the channel becomes nonconductive (Cuello et al., 2010a), and this inactivation is now believed to occur at the selectivity filter (SF). As the degree of HBC opening correlates with this C-type inactivation, reconciling such confounding observations is necessary to understand ion channel function in general.
There are now examples in nearly all K+ channel families that are suggested to gate somewhere other than the classical HBC. Among them are MthK (Posson et al., 2013; Posson et al., 2015; Fan et al., 2020) and related eukaryotic BK channels (Chen and Aldrich, 2011; Giese et al., 2017); K2P channels, such as TREK (Ben Soussia et al., 2019; Dong et al., 2015); CNG channels MloK1 (Kowal et al., 2014) and TAX-4 (Zheng et al., 2020); and Kir channel KirBac3.1 (Black et al., 2020). Even the seemingly strongly established model of KcsA opening at the HBC has been questioned (Black et al., 2021; Heer et al., 2017; Blunck et al., 2006). That many channels might not be principally gated at the HBC is further strengthened by the fact that a common class of activators can enter closed channels from the cytoplasmic side, including the Kv channel HERG, and activate them (Schewe et al., 2019). In all of these cases, the main activation gate was instead proposed to be in the SF, while the HBC was reduced to a secondary role in gating where a change in the opening angle of the HBC helices transmits an allosteric activation signal (Kopec et al., 2019; Boiteux et al., 2020) to the SF.
Investigation of how KcsA channels are gated at the SF illuminated the critical importance of an aromatic residue located in the middle of the pore lining M2 helix near the base of the SF, F103. It has been established that F103A attenuates allosteric coupling between the SF and C-terminal glutamates (Xu et al., 2017) in KcsA, and removal of this residue suppresses C-type inactivation (Cuello et al., 2010a). Interestingly, many K+ channels appear to be affected by substitutions in this region. Mutations in the analogous position (TM2.6) to polar residues greatly increase open probability in all vertebrate K2P channels (Ben Soussia et al., 2019). Human Slo1 becomes active in the absence of Ca2+ after F380Y substitution (Lippiat et al., 2000) and A388C-MTSEA modification render bovine CNGA1 conductive in the absence of ligand (Flynn and Zagotta, 2003). Moreover, a substitution in one residue downstream has been reported to alter K+ channel gating as well. Kv channel HERG harboring A653 substitutions no longer closes at physiologically relevant potentials and displays changes in the rate of C-type inactivation (Stepanovic et al., 2009), and polar mutations at this site make MthK (Shi et al., 2011) constitutively active. In other cases, such as KCNQ3 (Kv7.3), this substitution (F344A/C/W) results in reduced flux (Choveau et al., 2012). Therefore, residues just below the SF, especially residues corresponding to F103 and A104 in KcsA, appear to be important in the gating of a broad range of K+ channels.
To address the discrepancy between the NaK x-ray structures and its functional behavior, we investigated whether NaK is primarily gated at the HBC using solution NMR spectroscopy and solid-supported membrane electrophysiology (SSME) measurements. Unlike solid-state NMR spectra of NaK in liposomes (Shi et al., 2018), solution-state NMR spectra of NaK samples in lipid bicelles display clear resonances for residues throughout the M2 helix, including those near the HBC (Brettmann et al., 2015). Additionally, while substantial attention has been paid to investigating KcsA by both solution and solid-state NMR, these studies largely excluded detailed investigation of the HBC, only indirectly correlating chemical shift perturbation data with hypothesized changes in the structure (Imai et al., 2010; van der Cruijsen et al., 2017; Pérez-Conesa et al., 2021): in part due to the ambiguity of the detailed atomic structures of different states (Pérez-Conesa et al., 2021). While NMR is a powerful technique for unraveling structure and dynamics in smaller proteins, for large molecular systems such as ion channels, obtaining high-quality NMR data necessary for meaningful interpretation can be a challenge. Here, we use a combination of backbone and methyl resonances and the resolution provided by solution NMR to measure both chemical shift perturbation and site-specific distance restraints for NaK constructs in bicelles. As NaK presents two putative open and closed structures at atomic resolution, which can be easily obtained by truncation of the M0 helix, this represents an ideal system for testing the competing hypotheses for the location of the ion channel gate by NMR.
Materials and methods
Protein expression, purification, and reconstitution
All NaK variants used for this study were cloned into a pET15b vector as described previously (Brettmann et al., 2015). The sequence of the NaK∆18 construct, including the T7 promoter and terminator, was 5′-AAAAAACCCCTCAAGACCCGTTTAGAGGCCCCAAGGGGTTATGCTAGTTATTGCTCAGCGGTGGCAGCAGCCAACTCAGCTTCCTTTCGGGCTTTGTTATTCTTTTTTACGATTCGATAATATACTTGGCAATTGTACATTAACTGCTAACTTATGAATAAATCCAAACACTAGTCCAATCCCAATAAATATGTATAAAATTGTAAATATCTTTCCGAAATCAGTTTGCGGACTAAAATTCCCATCACCGACAGTCGTCAACGTGACCACACTAAAATATAAAGCGTCAATAGGACGTAATCCTTCAACTGTACTATAAAAAATCGTACCCGATATTAAAGTCAAAATTGTTAATACAAATAATACTTGAAATTCTTTATCTTTCCACATATGGCTGCCGCGCGGCACCAGGCCGCTGCTGTGATGATGATGATGATGGCTGCTGCCCATGGTATATCTCCTTCTTAAAGTTAAACAAAATTATTTCTAGAGGGGAATTGTTATCCGCTCACAATTCCCCTATAGTGAGTCGTATTA-3′.
All mutations, except NaK2K, were introduced into this plasmid.
The NaK FL sequence used was 5′-AAAAAACCCCTCAAGACCCGTTTAGAGGCCCCAAGGGGTTATGCTAGTTATTGCTCAGCGGTGGCAGCAGCCAACTCAGCTTCCTTTCGGGCTTTGTTAATTCGATAATATACTTGGCAATTGTACATTAACTGCTAACTTATGAATAAATCCAAACACTAGTCCAATCCCAATAAATATGTATAAAATTGTAAATATCTTTCCGAAATCAGTTTGCGGACTAAAATTCCCATCACCGACAGTCGTCAACGTGACCACACTAAAATATAAAGCGTCAATAGGACGTAATCCTTCAACTGTACTATAAAAAATCGTACCCGATATTAAAGTCAAAATTGTTAATACAAATAATACTTGAAATTCTTTATCTTTCCACGCTCGTAAACAGGCTCTTAACATTCGCTTTAAAGTTAACAAAAATGAAAGGGCCATATGGCTGCCGCGCGGCACCAGGCCGCTGCTGTGATGATGATGATGATGGCTGCTGCCCATGGTATATCTCCTTCTTAAAGTTAAACAAAATTATTTCTAGAGGGGAATTGTTATCCGCTCACAATTCCCCTATAGTGAGTCGTATTA-3′.
NaK2K ∆18 sequence used was 5′-AAAAAACCCCTCAAGACCCGTTTAGAGGCCCCAAGGGGTTATGCTAGTTATTGCTCAGCGGTGGCAGCAGCCAACTCAGCTTCCTTTCGGGCTTTGTTAATTCGATAATATACTTGGCAATTGTACATTAACTGCTAACTTATGAATAAATCCAAACACTAGTCCAATCCCAATAAATATGTATAAAATTGTAAATATCTTTCCGAAATCAGTTTGCGGACTAAAATCTCCATAACCGACAGTCGTCAACGTGACCACACTAAAATATAAAGCGTCAATAGGACGTAATCCTTCAACTGTACTATAAAAAATCGTACCCGATATTAAAGTCAAAATTGTTAATACAAATAATACTTGAAATTCTTTATCTTTCCACATATGGCTGCCGCGCGGCACCAGGCCGCTGCTGTGATGATGATGATGATGGCTGCTGCCCATGGTATATCTCCTTCTTAAAGTTAAACAAAATTATTTCTAGAGGGGAATTGTTATCCGCTCACAATTCCCCTATAGTGAGTCGTATTA-3′.
Mutations were introduced into the aforementioned plasmids with a modified QuikChange method using Phusion polymerase (Xia et al., 2015). The following primers, synthesized by Integrated DNA Technologies, were used: F92A: 5′-GAATAAATCCCGCCACTAGTCCAATCCCAAT-3′, 5′-GGACTAGTGGCGGGATTTATTCATAAGTTAG-3′; F92D: 5′-GAATAAATCCATCCACTAGTCCAATCCCAAT-3′, 5′-GGACTAGTGGATGGATTTATTCATAAGTTAG-3′; F92N: 5′-GAATAAATCCATTCACTAGTCCAATCCCAAT-3′, 5′-GGACTAGTGAATGGATTTATTCATAAGTTAG-3′; L61A: 5′-GACAGTCGTAGCCGTGACCACACTAAAATA-3′, 5′-TGGTCACGGCTACGACTGTCGGTGATGG-3′; L35A: 5′-ACCCGATATAGCAGTCAAAATTGTTAATAC-3′, 5′-CAATTTTGACTGCTATATCGGGTACGATTTTTT-3′; L61T: 5′-GACAGTCGTTGTCGTGACCACACTAAAATA, TGGTCACGACAACGACTGTCGGTGATGG-3′.
The resulting plasmids were confirmed by sequencing using the Functional Biosciences service.
Protein with natural isotopic composition was expressed as described before (Brettman et al., 2015). For the expression of isotopically labeled protein, a plate containing fresh NaK BL21 (DE3) transformants was washed with LB media and 5 ml preculture was inoculated with an OD600 of 0.3 with 100 μg/liter of carbenicillin. After 1 h, the resulting LB culture with an OD600 of 0.9–1 was transferred to 30 ml M9 media supplemented with BME vitamins (Sigma-Aldrich), 5 μg/liter thiamine (Research Products International), 1 g/l15NH4Cl (Cambridge Isotope Laboratories), and 100 μg/liter of carbenicillin. When the OD600 reached 0.9, the cells were pelleted and resuspended in 60 ml M9 media in D2O (Sigma-Aldrich) containing 12C, 2H glucose (Cambridge Isotope Laboratories) at 4 g/liter concentration, 0.25–0.5 g/liter 12C, 2H, 15N Isogro (Sigma-Aldrich), and 100 μg/liter carbenicillin. After this preculture reached OD600 of 0.9, it was transferred to 240 ml M9 D2O containing all the constituents as above in a 3-liter baffled flask. This small modification of the original protocol (Brettman et al., 2015) allowed us to obtain threefold higher yield of protein from the same expression volume. All the growth steps were performed at 37°C with 200–250 rpm shaking.
After the culture reached OD600 of 0.8, 140 mg/liter of 2-keto-3-(methyl-d3)-butyric acid-4-13C, 3-d and ∼70 mg/liter of 2-ketobutyric acid-4-13C,3,3-d2 were added and incubated for an additional 0.5–1 h. Cold shock (4°C ice slurry) was performed for 10 min prior to addition of 0.4 mM IPTG. The culture was incubated overnight at 25°C.
Purification and reconstitution of the protein in d54-DMPC and d22-DHPC (Avanti Polar Lipids) q = 0.33 bicelles was performed exactly as described previously (Lewis et al., 2021).
Briefly, the cells were sonicated in 20× pellet mass (w/v) ml of 100 mM NaCl, 200 mM KCl, 2.5 mM MgSO4, 20 mM Tris-NaOH pH 7.5, DNase, 1 μg/ml pepstatin, 10 μM leupeptin, 100 μM PMSF, 250 mM sucrose, and 1 mg/ml lysozyme. The insoluble pellet was collected after centrifuging at 30,000 g in JA-20 rotor (Beckman Coulter) for 1 h at 4°C. The pellet was ground in a homogenizer with 10× (w/v) mass of 100 mM NaCl, 200 mM KCl 2.5 mM MgSO4, 20 mM Tris-NaOH pH 7.5, and 20 mM DM, and agitated for 4–15 h at room temperature. The insoluble residue was removed by centrifugation at 30,000 g for 15 min at room temperature. The soluble fraction was purified using Talon affinity resin (Takara). The resin was equilibrated with buffer A (20 mM Tris-HCl pH 8, 100 mM NaCl, 200 mM KCl, and 5 mM DM) and the solubilized protein-containing lysate was incubated with the resin for 20 min at room temperature. Afterward, the resin was washed with 20 resin volumes of Buffer A and 10 resin volumes of Buffer A + 15 mM imidazole and then eluted with Buffer A + 500 mM imidazole. Elution was concentrated with centricons (Millipore or Sartorius Biolabs) as per manufacturer instructions and loaded on Superdex 200 Increase 10/300 GL size exclusion chromatography columns and purified with a flow rate of 0.5 ml/min. Eluted fractions containing NaK were reconstituted for NMR or solid-supported membrane measurements.
SSME
NaK samples for SSME measurements were reconstituted into 3:1 POPC:POPG liposomes largely as described before (Lewis et al., 2021). 25 mg/ml POPC and POPG (Avanti Polar Lipids) chloroform solutions were mixed with a ratio of 3:1, respectively, and chloroform was evaporated under a nitrogen or argon (Airgas) stream. The lipid film was further washed three times with n-pentane (Sigma-Aldrich) and lyophilized overnight. Before reconstitution, the lipid film was hydrated in NMR buffer (100 mM MOPS-NaOH, pH 7, and 100 mM KCl) for 1 h at room temperature. 40–70 μM protein in DM purified with FPLC was mixed with lipid to achieve 1:200—1:50 monomer:lipid molar ratio and incubated for 30 min. The first aliquot of Amberlite XAD-2 (Sigma-Aldrich) was then added and the sample was further incubated for 1 h. After addition of the second aliquot, the sample was incubated overnight. The last aliquot was added the next morning and the sample was incubated for 1 more hour. All the incubation steps were done at room temperature. Biobeads were strained and the resulting sample was extruded through a 200-nm membrane (Avanti Polar Lipids extruder, Whatman Polycarbonate membranes). Nanion measurements were performed immediately after sample preparation. All the proteoliposomes contained a similar amount of protein, as confirmed by SDS-PAGE.
All electrophysiology measurements were acquired on a Surfe2r N1 instrument (Nanion Technologies GmbH). 5-mm Nanion sensors were prepared as recommended by the manufacturer. NaK proteoliposomes were loaded directly from the reconstitution mixture, without diluting them. We have only used sensors that displayed capacitance values of <30 nF and conductance values of ∼1.5 nS, as otherwise, the results looked inconsistent for some of the variants, such as L35A.
The buffers were prepared in the following way: 100 mM MOPS buffer was prepared first and adjusted to pH 7.0 using a 3 M Tris base solution. We then mixed this solution 1:1 (vol/vol) with 200 mM NMDG-Cl or KCl. The final solutions for SSME measurements were prepared by mixing the 50 mM MOPS-Tris and 100 mM XCl (X = NMDG, K) solutions together to obtain Buffers A (5 mM KCl, 95 mM NMDG, and 50 mM MOPS-Tris, pH 7) and B (0.5 mM KCl, 99.5 mM NMDG, and 50 mM MOPS-Tris, pH 7).
The sensor was washed for 1 s with Buffer B, then Buffer A, and then Buffer B in sequential fashion. At each step, the buffer perfusion rate was 200 μl/s Three recordings were obtained for each sensor or until the traces would overlap completely.
NMR measurements
All NMR assignments have been deposited in the Biological Magnetic Resonance Bank (BMRB; https://bmrb.io/). NaK∆18 backbone amide and ILV methyl assignments are available under accession number 51646, full-length NaK backbone amide and ILV methyl assignments are available under accession number 51645, and NaK2K ∆18 ILV methyl assignments are available under accession number 51644. Raw NMR data have been deposited in BMRbig under accession number bmrbig74.
0.7–0.9 mM 15N, 2H, 13CH3-ILV NaK in 100 mM MOPS-NaOH pH 7, 100 mM KCl, 7% D2O, ∼50 mM d-54 DMPC,∼150 mM d22-DHPC (q ∼ 0.33), and 0.5 mM DSS samples were measured at 40°C in 5 mM Shigemi (Shigemi) tubes. All 3-D CCH HMQC-NOESY-HMQC spectra (Schanda et al., 2005) were collected on a 900 MHz Bruker Avance III spectrometer equipped with cryogenic probes and controlled by Topspin 3.5p7 software. 250 ms NOESY mixing time and 1 s recycling delay were employed. The number of complex points acquired for all experiments was 1,024 (71 ms) × 50 (11 ms) × 90 (20 ms). NaKΔ18 and NaK FL were acquired with 16 scans using uniform sampling, while NaK2KΔ18 and F92A NaKΔ18 were acquired using 32 scans with 40% nonuniform Poisson-gap T2-weighted sampling.
CPMG experiments on NaKΔ18 and NaK FL were recorded on an 800-MHz Varian spectrometer controlled by vnmrj 4.2 software with the same sample conditions as described above. 13C MQ experiments employed the pulse program by Kay and colleagues (Korzhnev et al., 2004). For both experiments, Trelax was 20 ms. For NaK FL, νCPMG were 100, 200 (×2), 300, 400, 500, 600, 700, 900, and 1,000 Hz. For NaKΔ18, the frequencies were 50, 100, 200 (×2), 300, 450, 600, 800, and 900 Hz.
All NMR data were processed using nmrPipe 9.0 (Delaglio et al., 1995) and visualized with ccpNMR 2.4.2 (Vranken et al., 2005). Nonuniformly sampled spectra were processed with SMILE 1.1 (Ying et al., 2017). Noise for NOESY error analysis was extracted with NMRView J 9.2.0 (One Moon Scientific). Assignment of methyl groups was detailed previously (Lewis et al., 2021).
Chemical shift perturbations from 13C SOFAST HMQC (Schanda et al., 2005) and 15N TROSY HSQC (Nietlispach, 2005) spectra were calculated as ΔδCombined = (ΔδH2 + WN/C2 * ΔδN/C2)0.5, where WN = 0.101, WC = 0.251. Error bars for chemical shift perturbations in Fig. 2 a were calculated by extracting standard deviations of each crosspeak from 13C HMQC recorded on three individual NaKΔ18 samples and two NaK FL samples and propagated using standard error propagation. As this demonstrates that errors on these spectra are very small, we do not provide error bars for F92A NaK (Fig. S15 a) and NaK2K (Fig. S19 a) since they would not be visible.
Chemical shift perturbation data was analyzed using Python 2.7.11 scripts and plotted with Matplotlib package (Barrett et al., 2005). 3-D structures were generated using molecular visualization package Pymol 1.8.6.0 (Schrödinger, LLC).
Off-diagonal NOESY crosspeaks were assigned manually and peak intensities were extracted using ccpNMR software. Peak intensity comparison was performed using in-house Python scripts and the errors were propagated using standard error propagation.
Multiple sequence alignment in Fig. 1 c was generated using Clustal Omega with default presets (Sievers et al., 2011) and visualized with Jalview 2.11.
Online supplemental material
The supplementary information includes 25 figures that provide additional raw data, including NMR spectra, SSME replicates, and size exclusion data. The figures also include data in other formats that emphasize other aspects of the data, such as graphs of data that are plotted on the structure in the main text. Table S1 shows numbering of key positions in NaK and several other channels.
Results
Comparison of NaKΔ18 and NaK FL NMR “fingerprints”
In this work, we use NaKΔ18, which is similar to the NaK∆19 construct (Alam and Jiang, 2008) used to characterize the structural and functional impact of removing the M0 helix, but leaves in place residue W19 (Fig. 1 a). This aromatic residue may help stabilize the channel in the membrane and improves the stability of the construct during purification (Fig. S1). We began by comparing the backbone amide chemical shifts of the putative open and closed channel constructs (Fig. 1 b), NaKΔ18 (Brettmann et al., 2015), and full-length NaK (NaK FL) in lipid bicelles. Although we did not assign the backbone resonances in NaK FL spectra, assignments of more dispersed peaks can be easily transferred between the 1H15N-TROSY-HSQC spectra of the two variants (Fig. S2). Therefore, unlike KcsA where the atomic structure of only one state is known, the two NaK constructs are expected to yield chemical shift patterns representative of the two distinct x-ray structures. While the overall pattern between NaKΔ18 and FL remains very similar, we observe a chemical shift perturbation (CSP) of 0.25 ppm for the W19 indole nitrogen, which is of a similar magnitude as reported for W26 in KcsA (Takeuchi et al., 2007) and 0.05–0.1 ppm CSP for the residues on the M2 helix near the HBC. In general, the pattern of CSPs appears to be qualitatively consistent with the hypothesis of conformational change in the hinge region correlated to gating at the inner bundle crossing, although the magnitude of CSPs appears small for such a large conformational change.

NaK structure and sequence alignment with related channels. (a) Crystal structure of NaKΔ18 (PDB accession no. 3E8H) with only two opposing monomers displayed for clarity. The SF is colored orange. Residues W19, F92, D66, and N68 are highlighted by light blue sticks. (b) Adjacent monomers of NaK tetramer in open and closed conformations, as revealed by x-ray crystallography. (c) Sequence alignment of ion channels with similar pore structure to KcsA. Black cartoon at the top indicates the secondary structure elements. Residues V91–F92 are highlighted in red.
NaK structure and sequence alignment with related channels. (a) Crystal structure of NaKΔ18 (PDB accession no. 3E8H) with only two opposing monomers displayed for clarity. The SF is colored orange. Residues W19, F92, D66, and N68 are highlighted by light blue sticks. (b) Adjacent monomers of NaK tetramer in open and closed conformations, as revealed by x-ray crystallography. (c) Sequence alignment of ion channels with similar pore structure to KcsA. Black cartoon at the top indicates the secondary structure elements. Residues V91–F92 are highlighted in red.

Size exclusion chromatography profiles of variants used in this study. Top two panels: NaKΔ18 and NaKΔ19 incubated in n-Decyl-β-D-Maltopyranoside for 72 h incubation at 4°C. The other traces represent samples for which gel filtration was done right after elution from NiNTA. Superdex 200 increase 10/300 GL columns were used to analyze the samples.
Size exclusion chromatography profiles of variants used in this study. Top two panels: NaKΔ18 and NaKΔ19 incubated in n-Decyl-β-D-Maltopyranoside for 72 h incubation at 4°C. The other traces represent samples for which gel filtration was done right after elution from NiNTA. Superdex 200 increase 10/300 GL columns were used to analyze the samples.

Overlay of NaKΔ18 and NaK FL 1 H, 15 N-HSQC spectra. Assignments of non-overlapping residues with more pronounced chemical shift differences are shown.
Overlay of NaKΔ18 and NaK FL 1 H, 15 N-HSQC spectra. Assignments of non-overlapping residues with more pronounced chemical shift differences are shown.
U-[15N12C2H] labeled NaKΔ18 in 100 mM K+ displays good quality 15N-1H spectra at 40°C (Brettmann et al., 2015), but the correlation time in bicelle is ∼45 ns for NaK∆18 and even longer for NaK FL, which hampers a detailed structural comparison. We therefore used methyl groups as NMR observables, which have high sensitivity and are commonly used to probe the structure and dynamics of large proteins and molecular complexes (Rosenzweig and Kay, 2014). NaK has 32 methyl-bearing Ile, Leu, and Val residues (out of 110 total residues) for 53 probes per monomer in total, which are dispersed rather uniformly throughout the structure. The methyl groups were assigned previously (Lewis et al., 2021). We compared the methyl chemical shifts for U-[15N12C2H] Ile (δ1), Leu/Val-labelled NaK∆18, and NaK FL. The isotopic labeling of the methyl groups in these samples is a racemic mixture of 13CH3/12C2H3 for each Leu Cδ1/δ2 and Val Cγ1/γ2, respectively (referred to as ILV-labeling throughout). The methyl CSPs are generally <0.05 ppm, with only a few residues at the proposed “hinge region” (Jiang et al., 2002; Shen et al., 2002) and near the HBC showing larger perturbations (Fig. 2).

Methyl chemical shift perturbation between NaK∆18 and NaK FL. (a and b) Combined 1H,13C chemical shift difference extracted from the 1H,13C-HMQC spectra shown in b for NaK∆18 (red) and NaK FL (black). Chemical shift assignments are shown in b, with cyan arrowheads highlighting more pronounced perturbations. (c) Chemical shift differences plotted on the ILV methyl groups of the NaKΔ19 crystal structure (PDB accession no. 3E8H) in the same color scale as a. Black spheres indicate unassigned residues. NaK FL crystal structure (PDB accession no. 2AHZ) is shown in faded overlay, with arrowheads highlighting the M2 helix conformational change between the open and closed conformations.
Methyl chemical shift perturbation between NaK∆18 and NaK FL. (a and b) Combined 1H,13C chemical shift difference extracted from the 1H,13C-HMQC spectra shown in b for NaK∆18 (red) and NaK FL (black). Chemical shift assignments are shown in b, with cyan arrowheads highlighting more pronounced perturbations. (c) Chemical shift differences plotted on the ILV methyl groups of the NaKΔ19 crystal structure (PDB accession no. 3E8H) in the same color scale as a. Black spheres indicate unassigned residues. NaK FL crystal structure (PDB accession no. 2AHZ) is shown in faded overlay, with arrowheads highlighting the M2 helix conformational change between the open and closed conformations.
In accordance with previously published NaK FL solid-state NMR data (Shi et al., 2018; Lewis et al., 2021), we observe a broadening of resonances around the hinge, which becomes more severe in NaK FL, whereas residues in the M2 helix below V91 could not be assigned in ssNMR data on NaK FL. All of the M2 resonances are observable by solution NMR in bicelles. There is a broadening of both the amide and methyl resonances of G89 and L90, along with the L98 methyl resonance (Fig. 2 and Fig. S2), but resonances downstream of the hinge region, such as the Cγ1/2 methyls of V100 and V102, do not appear to be broadened. As we have previously reported (Lewis et al., 2021), the flexibility of the M2 helix in the region V102-L108 has increased ps–ns time-scale dynamics, which could explain why this region is not observable in the solid-state data. The data also suggest that HBC has enhanced dynamics in different lipid environments (DMPC/DHPC bicelles here and Lewis et al. [2021] and asolectin bilayers in Shi et al. [2018]). The ability to observe the terminal parts of M1 and M2 helices using solution NMR gives us a unique opportunity to probe the structure of the inner gate of a K+-like channel more directly by acquiring NMR distance restraints.
Open NaKΔ18 conformation in lipids, consistent with x-ray structure
Since the chemical shift differences between NaKΔ18 and FL appear rather small, we wanted to more clearly establish the specific structural differences at the HBC between the two variants and whether the observed changes really reflect the proposed transition between closed and open conformations in these constructs. Although chemical shifts directly reflect the shielding of a nucleus by the surrounding electrons and thus report on the structure, they have a nonlinear dependence on multiple structural features that makes direct interpretation of chemical shift perturbations challenging. For example, methyl CSPs may report on changes in bond angles, polarity, aromatic ring currents, change in populations of dynamically interconverting structures, and other factors. Amide chemical shifts have additional dependence on backbone torsion angles and hydrogen bonding. To more directly compare the structures of the two NaK variants, we decided to measure distances between the CH3 groups of ILV-labeled NaK samples using NOESY NMR experiments. Such distance measurements are one of the most precise and well-established NMR techniques and are routinely used to solve structures by NMR (Wuthrich, 1990).
Very high–quality methyl NOESY spectra could be obtained for each of the NaK variants in DMPC:DHPC isotropic bicelles (q = 0.33) at 40°C, displaying between 250 and 325 off-diagonal crosspeaks in total. A mixing time of 250 ms was used, which lead to the observation of the off-diagonal crosspeaks between methyl groups that are within 10 Å. We did not observe all of the expected possible intermethyl crosspeaks in the NaK crystal structure in this distance range, but 110 of these “missing” peaks are expected to be weak (79 of these unobserved crosspeaks report on atoms separated by more than 8 Å) or would overlap with the diagonal peaks in our 3-D experiments (31 crosspeaks had too small separation of their diagonal 13C frequencies). The absence of peaks originating from spin diffusion was further verified by comparing the spectra of ILV-labeled NaK recorded in both D2O and H2O (Lewis et al., 2021), and confirms that the NOESY crosspeaks correspond directly to the distance between the methyl groups.
NaKΔ18 crystallizes in an open conformation (PDB accession no. 3E8H), and we used this 1.8-Å resolution structure as a model for the open HBC confirmation when analyzing our NMR data. We used the NaK FL structure (PDB accession no. 2AHZ, 2.8 Å resolution) as the model for NaK with a closed HBC. Three C-terminal residues, S106–L108, which are missing in the 2AHZ structure, were modeled using I-TASSER (Yang et al., 2014). The open bundle-crossing conformation captured in the NaK∆18 structure is assumed to be the result of crystal contacts and does not represent a major conformation of the protein (Alam and Jiang, 2008). Thus, we expected that NaKΔ18 in lipid bicelles, as in our NMR samples, would be in a conformation where the HBC is closed.
The NMR-observed distance restraints for NaK∆18 in DMPC:DHPC isotropic bicelles are shown on the closed HBC structure in Fig. 3 d. Clearly, there is a significant discrepancy between this crystal structure and the NMR distance restraints in the HBC region. NOESY crosspeak intensities are strongly distance-dependent, resulting in strong crosspeaks if they are separated by <5 Å and becoming very weak as the distance approaches ∼10 Å. 63 pairs of methyl, for which we observe strong or intermediate NOESY crosspeaks, would be separated by distances >11 Å (many of them by ≈20 Å) in the closed crystal structure, and 13 strong NOESY crosspeaks are observed for pairs of methyl groups that are separated by >8 Å. A specific example from a residue near the HBC, I88, makes this discrepancy most evident (Fig. 3 g). One of the strongest off-diagonal crosspeaks we observe is between I88 and I95, which would be separated by 8.5 Å in a closed conformation. However, if the HBC was actually in the open conformation captured in the NaK∆19 crystal structure, these methyl groups would be separated by only half that distance (Fig. 3 c).

NaK methyl-methyl distance restraints reveal an open HBC in bicelles. (a, b, d, and e) NaKΔ18 (a and d) and NaK FL (b and e) methyl–methyl distance restraints measured using 3-D CCH HMQC-NOESY-HMQC NMR experiments on 13CH3-ILV-labeled protein in q = 0.33 DMPC/DHPC isotropic bicelles. The data are plotted on the NaK∆18 open structure (PDB accession no. 3E8H) in a and b, and the same data is plotted on the NaK FL closed structure (PDB accession no. 2AHZ) in d and e. Lines connect methyl groups that are close in space based on the NOESY crosspeaks. Line thickness corresponds to the intensity of NOESY crosspeaks. If the methyl groups with an observable NOE are within 10 Å in the crystal structure, the lines are colored green indicating consistency between the NOESY data and the crystal structure. If the methyl–methyl distance is >10 Å in the crystal structure, the lines are colored orange to indicate inconsistency with the NOESY data. A lighter orange is used to plot NOEs connecting residues missing from the NaK FL crystal structure that were added using I-Tasser. (c, f, and g) NOESY crosspeaks observed for I88 in NaKΔ18 and NaK FL and their correspondence to open (c) and closed (g) structures illustrate the consistency in the NOE pattern in both constructs, which contrasts with significant distance changes in the crystal structures. Green and red lines indicate distances, which are consistent and inconsistent with NOESY crosspeak intensities (as illustrated in f), respectively. Valine CH3 groups are colored yellow, leucines blue, and isoleucines in magenta.
NaK methyl-methyl distance restraints reveal an open HBC in bicelles. (a, b, d, and e) NaKΔ18 (a and d) and NaK FL (b and e) methyl–methyl distance restraints measured using 3-D CCH HMQC-NOESY-HMQC NMR experiments on 13CH3-ILV-labeled protein in q = 0.33 DMPC/DHPC isotropic bicelles. The data are plotted on the NaK∆18 open structure (PDB accession no. 3E8H) in a and b, and the same data is plotted on the NaK FL closed structure (PDB accession no. 2AHZ) in d and e. Lines connect methyl groups that are close in space based on the NOESY crosspeaks. Line thickness corresponds to the intensity of NOESY crosspeaks. If the methyl groups with an observable NOE are within 10 Å in the crystal structure, the lines are colored green indicating consistency between the NOESY data and the crystal structure. If the methyl–methyl distance is >10 Å in the crystal structure, the lines are colored orange to indicate inconsistency with the NOESY data. A lighter orange is used to plot NOEs connecting residues missing from the NaK FL crystal structure that were added using I-Tasser. (c, f, and g) NOESY crosspeaks observed for I88 in NaKΔ18 and NaK FL and their correspondence to open (c) and closed (g) structures illustrate the consistency in the NOE pattern in both constructs, which contrasts with significant distance changes in the crystal structures. Green and red lines indicate distances, which are consistent and inconsistent with NOESY crosspeak intensities (as illustrated in f), respectively. Valine CH3 groups are colored yellow, leucines blue, and isoleucines in magenta.
Replotting all of the methyl NOESY data for NaK∆18 on the open crystal structure shows a striking agreement (Fig. 3 a). For example, even side chains on the surface of NaK that do not appear to be constrained by packing display strong consistency between the observed NOE data for NaK in bicelles and the crystallographic distances indicating that they are in similar orientations (i.e., V29; Fig. S3). The few remaining discrepancies (Fig. 3 a) can be readily explained by reorientation of the I78 side chain or modest differences in the structure or dynamics of the M2 helix. This sort of minor discrepancy is not unexpected when comparing protein crystallized from DDM detergent versus protein reconstituted in lipid bicelles.

Correspondence between NMR NOESY and x-ray crystallography data for L33Cδ1. A slice from the 13CH3-13CH3 NOESY spectrum of NaK∆18 showing all the off-diagonal cross-peaks for L33Cδ1, with each cross-peak labeled according to the corresponding atom (left) and the open NaK∆18 structure (PDB accession no. 3E8H) centered on L33Cδ1 atom. All the residues within 10 Å are connected by lines, and the distance in the x-ray structure displayed on the line (in Ångstroms).
Correspondence between NMR NOESY and x-ray crystallography data for L33Cδ1. A slice from the 13CH3-13CH3 NOESY spectrum of NaK∆18 showing all the off-diagonal cross-peaks for L33Cδ1, with each cross-peak labeled according to the corresponding atom (left) and the open NaK∆18 structure (PDB accession no. 3E8H) centered on L33Cδ1 atom. All the residues within 10 Å are connected by lines, and the distance in the x-ray structure displayed on the line (in Ångstroms).
Full-length NaK is also open in lipid bicelles
The methyl NOESY data establishes that NaKΔ18 exists in an open conformation in lipid bicelles, but what about NaK FL? Although this construct crystallized in a closed HBC conformation, we observe small CSPs between NaK∆18 and NaK FL in bicelles and need to more directly assess whether these reflect an actual opening–closing transition of the HBC. The original construct used for x-ray crystallography lacked the four C-terminal residues RKKE. We have performed NOESY experiments on both NaK FL variants, either with or without the RKKE residues. Both variants display nearly identical NOESY crosspeaks (Fig. S4); however, the quality of NaK FL spectra without RKKE is improved, likely due to the faster rotational correlation time of this construct in the bicelle. We have therefore used the data obtained on this variant and refer to it as NaK FL. For this, we have recorded the same 3D13C-NOESY-HMQC experiment on NaK FL. The NOESY crosspeak patterns are very similar between NaKΔ18 and FL, indicating that the methyl–methyl distances and the structure of the FL channel are nearly identical to NaK∆18 (Fig. 3 f and Fig. S5). This is best illustrated by plotting NaK FL NOESY data on the open and closed structures of NaK (Fig. 3, b and d). In fact, crosspeaks indicating the proximity of N- and C-terminal atoms, a situation which only occurs in the open HBC structure, are slightly stronger in NaK FL. Almost all of the same crosspeaks appear in both spectra (with some loss of sensitivity and resolution in NaK FL due to overlap from the additional M0 helix residues) and direct comparison of the intensities of each unambiguous NOESY crosspeak between NaKΔ18 and NaK FL (Figs. S6, S7, and S8) shows ratios which are mostly close to 1. This indicates that there are only minor changes in the methyl–methyl distances across the protein. To get an approximate understanding of what distance certain crosspeak intensity changes correspond to, we looked into a well-defined change of the I88 side chain between Na+ and K+ bound NaK (Fig. S9). There, a 3.5 Å change in distance corresponds to approximately threefold change in NOESY crosspeak intensity, whereas open-to-close transition would require distance changes of 20 Å or more. Although the crosspeaks reporting on HBC structure are strongly consistent with an open FL structure, we do observe differences in the NOESY data for some M2 helix residues closer to the SF. For example, I88, which has been suggested to be important for channel activation in MthK appears to have weaker crosspeak intensities to the SF and pore helix residues V64 and V58 (Fig. 3 f, indicated by *) in NaK FL. However, the resolution of our data does not permit a more detailed refinement of the structure of M2 helix in NaK FL.

Comparison between NOESY spectra of NaK FL + RKKE and NaK FL − RKKE (RKKE refers to the four C-terminal residues). (a) Overlay of the projections from the 3-D NOESY spectra. (b) Slices of several cross-peaks corresponding to residues which are critical in establishing that NaK FL is in an open conformation.
Comparison between NOESY spectra of NaK FL + RKKE and NaK FL − RKKE (RKKE refers to the four C-terminal residues). (a) Overlay of the projections from the 3-D NOESY spectra. (b) Slices of several cross-peaks corresponding to residues which are critical in establishing that NaK FL is in an open conformation.

Correspondence between NMR NOESY data for NaK∆18, NaK FL, and the crystal structure of open NaK∆18 . Slices from the 13CH3-13CH3 NOESY spectra of NaK∆18 (red) and NaK FL (black) with off-diagonal cross-peaks assigned. The data is plotted on the NaK∆18 open structure (right; PDB accession no. 3E8H) with all methyl atoms within 10 Å connected by lines, and the crystallographic distance shown on the line (in Ångstroms). The red star on NaK FL spectrum denotes the position where L30Cδ2 should appear (this residue is broadened in NaK FL spectra).
Correspondence between NMR NOESY data for NaK∆18, NaK FL, and the crystal structure of open NaK∆18 . Slices from the 13CH3-13CH3 NOESY spectra of NaK∆18 (red) and NaK FL (black) with off-diagonal cross-peaks assigned. The data is plotted on the NaK∆18 open structure (right; PDB accession no. 3E8H) with all methyl atoms within 10 Å connected by lines, and the crystallographic distance shown on the line (in Ångstroms). The red star on NaK FL spectrum denotes the position where L30Cδ2 should appear (this residue is broadened in NaK FL spectra).

NaK∆18/NaK FL intensity ratios of all unambiguous off-diagonal and diagonal cross-peaks plotted with error bars based on the propagated standard deviation of spectral noise. Cross-peak identity is displayed below each bar (name of resonance coming from diagonal peak first). Continued in Fig. S7.
NaK∆18/NaK FL intensity ratios of all unambiguous off-diagonal and diagonal cross-peaks plotted with error bars based on the propagated standard deviation of spectral noise. Cross-peak identity is displayed below each bar (name of resonance coming from diagonal peak first). Continued in Fig. S7.

NaK∆18/NaK FL intensity ratios of all unambiguous off-diagonal and diagonal cross-peaks plotted with error bars based on the propagated standard deviation of spectral noise. Continued from Fig. S6.
NaK∆18/NaK FL intensity ratios of all unambiguous off-diagonal and diagonal cross-peaks plotted with error bars based on the propagated standard deviation of spectral noise. Continued from Fig. S6.

The same data as in Figs. S6 and S7 is plotted on the NaK∆18 open structure. Green lines represent ratios between 0.5 and 2. Orange lines indicate when the peak is >2× more intense in NaK∆18, and yellow lines where the peaks is <2× intense in NaK∆18 as compared to NaK FL.
The same data as in Figs. S6 and S7 is plotted on the NaK∆18 open structure. Green lines represent ratios between 0.5 and 2. Orange lines indicate when the peak is >2× more intense in NaK∆18, and yellow lines where the peaks is <2× intense in NaK∆18 as compared to NaK FL.

Impact of ion identity on I88 conformation in NaK. (a) Slices from 13C NOESY spectra illustrating V64Cγ2 cross peaks in either 100 mM (blue) K+ or 600 mM Na+ (brown). The peak with a most pronounced difference between the spectra to I88Cδ1 atom indicated by a dashed box. (b) X-ray structure of NaK (PDB accession no. 3E8H) with two orientations of I88 and the distance between V64Cγ2 and I88Cδ1 atoms indicated by a dashed line.
Impact of ion identity on I88 conformation in NaK. (a) Slices from 13C NOESY spectra illustrating V64Cγ2 cross peaks in either 100 mM (blue) K+ or 600 mM Na+ (brown). The peak with a most pronounced difference between the spectra to I88Cδ1 atom indicated by a dashed box. (b) X-ray structure of NaK (PDB accession no. 3E8H) with two orientations of I88 and the distance between V64Cγ2 and I88Cδ1 atoms indicated by a dashed line.
In combination, the NOESY and chemical shift perturbation NMR data of NaKΔ18 and NaK FL leave little doubt that, in contrast to x-ray structures solved in DDM, both NaK variants exist in an open conformation in a lipid environment. Since our measurements were performed at 40°C, slightly above physiological temperature, we wanted to see if the HBC changes conformation at lower temperatures. Decreasing the temperature to 20°C did not reveal any chemical shift changes in either NaKΔ18 or FL, which were significant enough to correspond to a conformational change of HBC closing (Fig. S10).

NaK FL 1 H, 13 C-HMQC spectra at 40°C (red) and 20°C (black). The combined 1H,13C chemical shift difference is shown as a bar plot (top) and on the methyl groups of NaKΔ19 open x-ray structure (right) using the same white to blue color scale. Black spheres indicate unassigned residues. Error bars are based on spectral resolution.
NaK FL 1 H, 13 C-HMQC spectra at 40°C (red) and 20°C (black). The combined 1H,13C chemical shift difference is shown as a bar plot (top) and on the methyl groups of NaKΔ19 open x-ray structure (right) using the same white to blue color scale. Black spheres indicate unassigned residues. Error bars are based on spectral resolution.
As we clearly see only a single set of peaks on a HMQC or HSQC spectra, this indicates that unlike in KcsA (Takeuchi et al., 2007; Imai et al., 2010), only a single major conformation exists in NaK. We have thus tried to detect any minor conformations which could potentially correspond to the closed HBC conformation of NaK. However, we could not detect such evidence in the vicinity of the HBC on the millisecond time scale (a timescale at which conformational changes of such magnitude would be expected) in either NaKΔ18 (Lewis et al., 2021) or NaK FL (Figs. S11 and S12). We do observe somewhat enhanced millisecond dynamics for I88 Cδ1 methyl group, which is in line with the broadening we observe for G89 and L90, indicating some conformational dynamics in this region.

CPMG relaxation dispersion profiles for NaKΔ18 and NaK FL at 800 MHz field. Continued in Fig. S12.
CPMG relaxation dispersion profiles for NaKΔ18 and NaK FL at 800 MHz field. Continued in Fig. S12.

CPMG relaxation dispersion profiles for NaKΔ18 and NaK FL at 800 MHz field. Continued from Fig. S11.
CPMG relaxation dispersion profiles for NaKΔ18 and NaK FL at 800 MHz field. Continued from Fig. S11.
Reconciling NaK structure and function
To assess the functional state of the channel, we turned to SSME (Thomas et al., 2021; Postis and Goldman, 2020). As it is not known what activates NaK, prior electrophysiology studies of NaK all used the F92A mutant (Fig. 1, a and b; Derebe et al., 2011), which substantially increases channel flux. SSME was designed to enable study of low-flux channels and transporters and allows us to functionally characterize the NaK channel both with and without the F92A mutation (Postis and Goldman, 2020).
In SSME experiments, a sensor is formed by immobilizing proteoliposomes onto an alkylated gold surface, thus creating a capacitively coupled system. Experiments are carried out by sequentially flowing two solutions that differ in the concentration of the solute of interest. As the interior of the proteoliposomes is initially equilibrated with the first solution, the application of the second solution results in a concentration gradient across the membrane. If the solute of interest is charged and is transported across the membrane, it leads to the charging of the liposomal membrane and subsequent charging of the measuring electrode, which produces the observed signal. The peak amplitude of the current roughly corresponds to steady-state transport. Charge build-up opposes the concentration gradient and the currents eventually decay to zero, with the decay rate reflecting on transport kinetics (Postis and Goldman, 2020).
For SSME measurements, each NaK variant was reconstituted in 3:1 POPC:POPG liposomes and immobilized on a Nanion sensor. As we were aiming to compare the transport between different NaK variants, it is important to ascertain whether similar amounts of proteoliposomes are loaded on different sensors and whether the membranes are of sufficient quality. These two properties would affect the peak amplitudes and are generally reflected in sensor’s conductance and capacitance values. We have further checked if each proteoliposome preparation contained similar amounts of protein (Fig. S13). The proteoliposomes had 0.5 mM internal K+ and 99.5 mM NMDG+(N-methyl-D-glucamine) in 50 mM pH 7 Tris-MOPS buffer. To measure whether the channels are conductive, we then flowed in a buffer containing 5 mM K+ and 95 mM NMDG+ in pH 7 MOPS-Tris buffer to create a 10-fold potassium gradient. Under these conditions, K+ ion transport into the liposomes is expected to trigger positive capacitive currents. Measurements performed on liposomes containing different protein-to-lipid ratios confirm that we observe currents due to transport and not ion binding (Fig. S14). In accordance with the previous electrophysiology measurements (Shi et al., 2006; Alam and Jiang, 2008, 2009; Derebe et al., 2011), neither WT NaKΔ18 nor FL channels displayed detectable currents, while both of the F92A variants did (Fig. 4 a). However, the currents observed for F92A-NaK FL were only slightly more than twofold smaller than F92A-NaK∆18, indicating a large population of full-length channels are open and conductive.
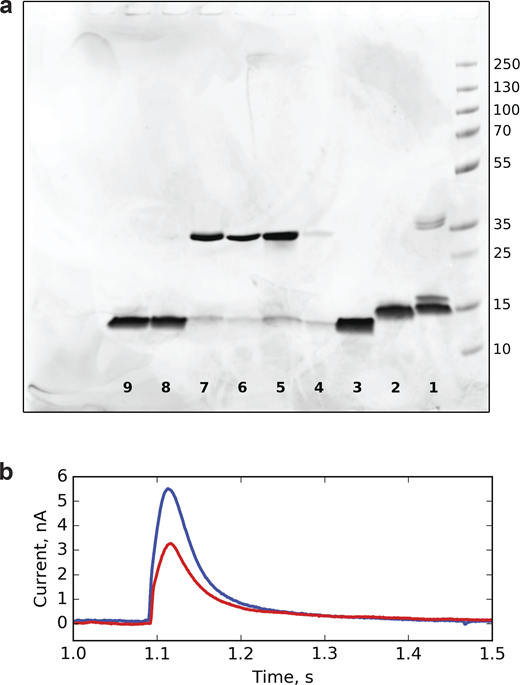
Comparison of NaK variant quantities used for SSME measurements. (a) SDS PAGE gel loaded with NaK variant proteoliposomes used for SSME measurements. 1, WT NaK full-length; 2, F92A NaK full-length; 3, F92A NaKΔ18; 4, WT NaKΔ18; 5, L61V NaKΔ18; 6, L61A NaKΔ18; 7, L61T NaKΔ18; 8, L35A NaKΔ18; 9, L35A/L61A NaKΔ18. (b) Comparison of SSME traces of a F92A NaKΔ18 sample (blue) and the same sample diluted 10-fold (red). Source data are available for this figure: SourceData FS13.
Comparison of NaK variant quantities used for SSME measurements. (a) SDS PAGE gel loaded with NaK variant proteoliposomes used for SSME measurements. 1, WT NaK full-length; 2, F92A NaK full-length; 3, F92A NaKΔ18; 4, WT NaKΔ18; 5, L61V NaKΔ18; 6, L61A NaKΔ18; 7, L61T NaKΔ18; 8, L35A NaKΔ18; 9, L35A/L61A NaKΔ18. (b) Comparison of SSME traces of a F92A NaKΔ18 sample (blue) and the same sample diluted 10-fold (red). Source data are available for this figure: SourceData FS13.

Comparison of SSME capacitive currents between FL NaK proteoliposomes reconstituted at 1:200 (blue) and 1:800 (red) protein:lipid ratio.
Comparison of SSME capacitive currents between FL NaK proteoliposomes reconstituted at 1:200 (blue) and 1:800 (red) protein:lipid ratio.

Only F92A mutation induces a significant current through NaK. (a) SSME recordings of current induced in NaK proteoliposomes by a 10-fold K+ gradient. Current traces for F92A-NaKΔ18 (black), F92A-NaK FL (orange) and WT NaK∆18 (blue). Each trace represents the capacitive current from an individual sensor. (b) Current traces for NaKΔ18 mutants L35A (yellow), L61A (blue), L35A + L61A (green), L61T (pink). Inset: Average peak current and standard error for each construct shown in the same color as the raw current traces.
Only F92A mutation induces a significant current through NaK. (a) SSME recordings of current induced in NaK proteoliposomes by a 10-fold K+ gradient. Current traces for F92A-NaKΔ18 (black), F92A-NaK FL (orange) and WT NaK∆18 (blue). Each trace represents the capacitive current from an individual sensor. (b) Current traces for NaKΔ18 mutants L35A (yellow), L61A (blue), L35A + L61A (green), L61T (pink). Inset: Average peak current and standard error for each construct shown in the same color as the raw current traces.
How does F92A increase channel flux?
The NMR data indicate that NaK∆18 and NaK FL have essentially identical open structures of the HBC in a lipid environment, but minor structural differences in the M2 helix closer to the SF. The electrophysiology data show that neither channel is conductive without the F92A mutation, and with this mutation, there are relatively modest differences in the flux between the FL and truncated channel (Derebe et al., 2011). Together, this suggests that the HBC does not perform the main role in regulating NaK flux. We therefore considered whether NaK is gated at the SF. Indeed, residues in the proximity of F92, and not the HBC, have recently been suggested by MD simulations to be the principal players in the activation of channels such as MthK and KcsA (Heer et al., 2017; Kopec et al., 2019; Boiteux et al., 2020; Gu and de Groot, 2020), with NaK2K F92A displaying similar a behavior (Kopec et al., 2019). In addition, a phenylalanine residue situated just below the P-helix appears to also play a major role in C-type inactivation of KcsA (Cuello et al., 2010a; Xu et al., 2017). While a phenylalanine residue in the M2 helix just below the SF is generally conserved in NaK and many K+ channels (Fig. 1 b), F92 in NaK is shifted downward by one position and is located where a small chain amino acid would be situated in most other channels. The cavity just below the SF is therefore very narrow in NaK, and this was suggested to account for a low flux of the WT NaK channel (Shi et al., 2011).
As there are no experimental structures of F92A-NaK, we wanted to investigate whether there is allosteric coupling between F92 and the SF, as proposed for other K+ channels, which could provide a more general alternative explanation for the gain of flux in the NaK F92A variant. We attempted to test F92A, F92D, and F92N variants for this experiment, but polar substitutions significantly reduced protein expression and disrupted tetramer formation (Fig. S1). The first rather striking observation is a stark difference in stability of P- and M1 α-helices of F92A NaKΔ18. NMR studies of a protein of this size in bicelles require deuteration of the protein to reduce relaxation and improve spectral sensitivity and resolution. This is achieved by expressing the protein in D2O and then purifying it in H2O, where it is hoped that most of the amide groups will back-exchange to protons so that they can be observed in 1H/15N correlation spectra. This effectively performs an H/D exchange experiment, with the peak intensity in the 1H/15N TROSY-HSQC spectrum providing a direct readout of the level of back-exchange that occurred during purification. F92A–NaK∆18 displays a much better back-exchange of the pore helix region, which is otherwise very poorly back-exchanged in the WT NaK∆18 channel (Lewis et al., 2021; Fig. S15). This stands in contrast to what was previously observed for NaK2K in Escherichia coli polar lipid extract (Öster et al., 2019). The latter study used K+-depleted channels, and this suggests an interesting possibility that K+ is required for the overall stability of NaK. However, when we tried to incubate NaKΔ18 without K+ following the procedure from Öster et al. (2019), the resulting samples had very little NMR signal, suggesting that the protein had aggregated.

Deuterium–hydrogen exchange of NaKΔ18 F92A as observed with 15 N HSQC spectra. Top: Overlay of WT NaKΔ18 (red) and NaKΔ18 F92A (black) in q = 0.33 DMPC/DHPC bicelles upon initial purification. Bottom: Residues which are usually poorly back-exchanged (Lewis et al., 2021) are indicated by arrowheads. Minimal change is observed over 3 wk at 40°C for NaKΔ18 F92A.
Deuterium–hydrogen exchange of NaKΔ18 F92A as observed with 15 N HSQC spectra. Top: Overlay of WT NaKΔ18 (red) and NaKΔ18 F92A (black) in q = 0.33 DMPC/DHPC bicelles upon initial purification. Bottom: Residues which are usually poorly back-exchanged (Lewis et al., 2021) are indicated by arrowheads. Minimal change is observed over 3 wk at 40°C for NaKΔ18 F92A.
Comparison of 2-D methyl HMQC spectra of ILV-labeled F92A NaKΔ18 and WT NaKΔ18 reveals CSPs that are clustered around the mutation site and the SF (Fig. S16), similar to what was observed for F103A–KcsA by ssNMR (Xu et al., 2017). This suggests that the overall structure is not strongly perturbed upon F92A mutation and both NaK and KcsA respond similarly to mutation of the corresponding aromatic residue. We see rather large methyl CSPs at residues I95 (∼0.4 ppm) and V91 (∼0.2 ppm). In addition, smaller but significant methyl CSPs occur throughout the residues in and adjacent to the SF (V64, V59, and I84), pore helix (L61 and L35), and also L48 (Fig. S16). L48 is not located in the SF, but its sidechain is in close proximity to residue F69, and its methyl group likely reports on the changes in the upper portion of the SF. I88 also displays moderate CSPs on Cδ1 (similar to I100 in KcsA; Xu et al., 2017). Therefore, CSP data suggest a structural link between the SF and F92 in NaK. Based on these NMR observables, the behavior appears to be similar to KcsA, where the allosteric coupling between the SF and the M2 residues below it is well-established functionally (Cuello et al., 2010a). As the removal of the phenylalanine ring will alter the impact of ring currents in the vicinity of the mutations, we looked for measurable structural changes on F92A mutation using methyl NOESY experiments.

Chemical shift difference between WT NaKΔ18 and NaKΔ18 F92A. (a–c) 1H,13C-HMQC spectra (b) for NaKΔ18 (black) and F92A (red) reveal some significant chemical shift perturbation that are plotted as a bar graph (a) and on the methyl groups of the NaKΔ19 crystal structure (c; PDB accession no. 3E8H) using the same blue to white color scale. F92 is shown in thick orange sticks and F69 in white sticks. Black spheres indicate unassigned residues.
Chemical shift difference between WT NaKΔ18 and NaKΔ18 F92A. (a–c) 1H,13C-HMQC spectra (b) for NaKΔ18 (black) and F92A (red) reveal some significant chemical shift perturbation that are plotted as a bar graph (a) and on the methyl groups of the NaKΔ19 crystal structure (c; PDB accession no. 3E8H) using the same blue to white color scale. F92 is shown in thick orange sticks and F69 in white sticks. Black spheres indicate unassigned residues.
The difference in diagonal peak intensities between F92A and WT NaK is generally below 10%, with slight changes in V91, L35, L61, I95, I81, and V29. As most of these residues are located in the region displaying the poorest H2O/D2O back exchange (and should appear more intense in F92A which is better back-exchanged), the decreased peak intensities likely reflect increased intermediate dynamics (Figs. S17 and S18). Overall, the off-diagonal NOESY crosspeak patterns, reflecting on the atom distance in space, are nearly identical between NaK F92A and the WT protein (Figs. S17, S18, and S19), further reinforcing the conclusion that there are no large global structural changes. However, focusing on the pore region, we observe a cluster of atoms, which display two- to fourfold intensity changes between F92A and WT protein (Fig. S17 and S18). Certain methyl NOESY crosspeaks reporting on the proximity of the M2 and pore helices become stronger, suggesting that in the absence of the bulky aromatic F92 sidechain, these two helices do pack more closely (Fig. 5). However, I88, which was implicated in the gating of several K+ channels such as KcsA and MthK and whose side chain was demonstrated to change conformation depending on the nature of ion in the SF (Lewis et al., 2021) is not affected by F92A substitution. Focusing on the SF, we notice that the S3–S4 sites of the SF are also altered slightly, as there are small but significant distance increases between the V64 and V59 methyl groups. NaK does not have any methyl-containing probes in the upper section of the SF, but the CSP of L48 Cδ atoms suggest changes in the SF at this position as well.

NaK∆18 WT/NaK∆18 F92A intensity ratios for all unambiguous off-diagonal and diagonal cross-peaks. Error bars represent propagated standard deviation of peak intensity. Cross-peak identity is displayed below the bars (name of resonance coming from diagonal peak first). Continued in Fig. S18.
NaK∆18 WT/NaK∆18 F92A intensity ratios for all unambiguous off-diagonal and diagonal cross-peaks. Error bars represent propagated standard deviation of peak intensity. Cross-peak identity is displayed below the bars (name of resonance coming from diagonal peak first). Continued in Fig. S18.

NaK∆18 WT/NaK∆18 F92A intensity ratios for all unambiguous off-diagonal and diagonal cross-peaks. Continued from Fig. S17.
NaK∆18 WT/NaK∆18 F92A intensity ratios for all unambiguous off-diagonal and diagonal cross-peaks. Continued from Fig. S17.

The same data in Figs. S17 and S18 as displayed on the NaK∆19 open structure. Green lines represent ratios between 0.5 and 2. Orange lines indicate where the peaks are at least 2× more intense in NaK∆18 (PDB accession no. 3E8H), and yellow lines are where the peaks are at least 2× less intense in NaK∆18 as compared to NaK FL. Substituted F92 residue is blue.
The same data in Figs. S17 and S18 as displayed on the NaK∆19 open structure. Green lines represent ratios between 0.5 and 2. Orange lines indicate where the peaks are at least 2× more intense in NaK∆18 (PDB accession no. 3E8H), and yellow lines are where the peaks are at least 2× less intense in NaK∆18 as compared to NaK FL. Substituted F92 residue is blue.

Location of structural changes upon F92A or NaK2K mutation. (a) Methyl NOESY crosspeak intensity differences between WT NaKΔ18 (red) and F92A NaKΔ18 (black) are largest (two- to threefold change) for residues located close to the SF. Blue boxes highlight these changes for NOEs between the methyl group listed in black (top) and blue (side). Blue stars indicated changes that are significant but lower than twofold. (b) Data from a are plotted on the crystal structure (PDB accession no. 3E8H). Green lines indicate distances that become shorter in F92A NaKΔ18, while orange lines represent distances that become longer. The SF is colored yellow and mutations are shown by blue sticks. (c) Methyl NOESY crosspeak intensity differences between WT NaK∆18 (red) and NaK2K∆18 (black). (d) In NaK2K, significant changes are observed at the end of M2 helices (blue boxes, labeled as in a), as represented on the structure (d, same color scheme as b).
Location of structural changes upon F92A or NaK2K mutation. (a) Methyl NOESY crosspeak intensity differences between WT NaKΔ18 (red) and F92A NaKΔ18 (black) are largest (two- to threefold change) for residues located close to the SF. Blue boxes highlight these changes for NOEs between the methyl group listed in black (top) and blue (side). Blue stars indicated changes that are significant but lower than twofold. (b) Data from a are plotted on the crystal structure (PDB accession no. 3E8H). Green lines indicate distances that become shorter in F92A NaKΔ18, while orange lines represent distances that become longer. The SF is colored yellow and mutations are shown by blue sticks. (c) Methyl NOESY crosspeak intensity differences between WT NaK∆18 (red) and NaK2K∆18 (black). (d) In NaK2K, significant changes are observed at the end of M2 helices (blue boxes, labeled as in a), as represented on the structure (d, same color scheme as b).
Notably, we do not see much correspondence between the magnitude of chemical shift perturbation and the distance changes between the methyl groups. For example, I95, which displays a very largest CSP of 0.4 ppm does not appear to have exceptional NOESY peak intensity changes with respect to the neighboring methyl-bearing residues. Thus, this large perturbation is likely due simply to ring current changes in F92A. This emphasizes the challenges in the interpretation of CSPs.
All of the residues around the SF display significant NOESY intensity changes in F92A-NaK∆18 (Figs. S17, S18, and S19), especially those located at the interaction point between the M1, M2, and pore helices (V58, L35, L61, I88, I84, and V91), have recently been implicated in channel activation/inactivation and allosteric coupling between the SF and HBC in MD simulations of KcsA and MthK channels (Heer et al., 2017; Kopec et al., 2019; Boiteux et al., 2020; Gu and de Groot, 2020; Li et al., 2018). Moreover, there is some experimental evidence from several different families of K+ channels showing that substitutions of these residues can alter ion flux. In KcsA, mutation of L40 (L35 in NaK) to alanine was shown to remove C-type inactivation and activate KcsA at higher pH (Heer et al., 2017), while in the large conductance potassium channel Slo2.1, a mutation of the corresponding L209T induces constitutive activation (Garg et al., 2013; Suzuki et al., 2016). The residue opposite L40 on the pore helix, A73, in KcsA (L61 in NaK) when mutated to E or C leads to a much higher open probability (Blunck et al., 2006), while F240T/C substitutions at an identical position in Slo2.1 renders the channel maximally active and no longer sensitive to the activator niflumic acid (Garg et al., 2013). The K2P channel TREK-1 responds to a broader range of mutations perturbing the pore helix, where substitutions (G137/V58 (NaK), W275{S/A/T/L/N/Q/D/E}/Y83 (NaK), W276/I81 (NaK), and I148/F69 (NaK)) produce channels with increased flux and also uncouple channel opening from stimuli (Lolicato et al., 2014; Bagriantsev et al., 2011).
We investigated whether altering the structure of the pore helix by mutating the aforementioned residues would also activate NaK. To test this, we introduced mutations in NaK∆18 at positions structurally impacted by F92A in our NMR studies and which were previously shown to increase conductance in KcsA or other channels, such as L35A, L61A, L35A + L61A, and L61T. All variants were expressed to similar levels and migrated identically on the size-exclusion column as the WT NaKΔ18 (Fig. S1), indicating that they retained a tetrameric structure. Nevertheless, increased aggregation propensity suggests that protein stability is compromised by these mutations. However, unlike F92A-NaK∆18, none of these mutations resulted in ion fluxes detectable by SSME (Fig. 4 b).
Coupling between SF and HBC
Distance changes between the M2 and M1 helices, and the SF and pore helix in F92A-NaK∆18 indicate that the pore helices are coupled to the surrounding structures. Indeed, such a coupling was suggested to play a central role in KcsA C-type inactivation, where the progressive opening of M2 helices allosterically transmits the signal, causing the SF of KcsA to collapse, with F103 playing a major role in the process (Cuello et al., 2010a; Xu et al., 2019; Wylie et al., 2014). In such a mechanism, structural changes of the SF may also affect residues below the SF. While it is not clear how in general such an allosteric coupling mechanism is, NaK2KΔ18 (Fig. 1 a), a variant of NaK with a four-site SF shows widely distributed chemical shift perturbations as observed by NMR (Brettmann et al., 2015), including the residues comprising M2. We therefore investigated if the four-site SF in NaK2K induces structural changes in the M2 helices, for example, making the HBC more closed, which is not evident from the x-ray structures.
Our first observation was that NaK2KΔ18 expressed in D2O and purified in H2O back-exchanges more slowly with water than the WT protein, consistent with a more rigid structure (Fig. S20) and in contrast with F92A-NaK. This is further supported by the observation that peak intensities of V58 and V59 become stronger (Fig. S21) in the four-site SF filter containing NaK2K. The broadening of these residues in NaKΔ18 likely occurs due to slow dynamics, and since these residues are not dynamic on the millisecond time scale (Figs. S11 and S12), the rigidification most likely happens on the microsecond timescale. Upon close examination of methyl 1H/13C-HMQC spectra, we noticed dramatic shifts (>1 ppm) for residues in and near the SF (V64 and V59; Figs. S20 and S21) that likely arise simply from ring currents due to the D66Y substitution in NaK2K that is in close proximity to these residues (Fig. S22). We also observe significant changes in the side chains of the residues just below the SF, including the hinge region (I88, L90, L91, and L98), and even more distant residues such as V100, in agreement with the previous solution amide (15HN; Brettmann et al., 2015) data. The shifts are of comparable or larger magnitude than the perturbations we observe in F92A NaK∆18.

Deuterium–hydrogen exchange of NaK2KΔ18. Overlay of WT NaKΔ18 (red) and NaK2KΔ18 (black) 1H-15N-TROSY-HSQC spectra. Residues which are usually poorly back-exchanged are indicated by arrowheads.
Deuterium–hydrogen exchange of NaK2KΔ18. Overlay of WT NaKΔ18 (red) and NaK2KΔ18 (black) 1H-15N-TROSY-HSQC spectra. Residues which are usually poorly back-exchanged are indicated by arrowheads.

Methyl chemical shift differences between WT NaKΔ18 and NaK2KΔ18. (a–c) 1H,13C-HMQC spectra of NaKΔ18 (black) and NaK2K (red) show some significant chemical shift perturbations (assignments as shown). The combined 1H,13C chemical shift difference is shown as a bar graph (a) and plotted on the structure (c; PDB accession no. 3E8H) using the same white to blue color scale. Mutated residues (D66Y and N68D) are shown in thick orange sticks. Black spheres indicate unassigned residues.
Methyl chemical shift differences between WT NaKΔ18 and NaK2KΔ18. (a–c) 1H,13C-HMQC spectra of NaKΔ18 (black) and NaK2K (red) show some significant chemical shift perturbations (assignments as shown). The combined 1H,13C chemical shift difference is shown as a bar graph (a) and plotted on the structure (c; PDB accession no. 3E8H) using the same white to blue color scale. Mutated residues (D66Y and N68D) are shown in thick orange sticks. Black spheres indicate unassigned residues.

D66Y substitution in NaK2K causes large CSPs due to ring currents. (a) Structural representation of the aromatic ring of tyrosine introduced into NaK after D66Y mutation (orange). (b) Methyl atoms undergoing very large CSPs relatively to the WT NaK spectra, as observed by NMR.
D66Y substitution in NaK2K causes large CSPs due to ring currents. (a) Structural representation of the aromatic ring of tyrosine introduced into NaK after D66Y mutation (orange). (b) Methyl atoms undergoing very large CSPs relatively to the WT NaK spectra, as observed by NMR.
After recording and analyzing methyl NOESY data for NaK2K, we observe that NOESY crosspeak intensities remain largely the same between this variant and NaK∆18. Out of 241 off-diagonal crosspeaks we assigned, only 11 display changes in intensity larger than twofold. In spite of the dramatic chemical shift perturbations, we only detect subtle changes in the pore helix, as reported by V59 or L35 residues (Fig. 5, c and d). In addition, we also observe some changes in NOESY crosspeak intensities in the termini of the M2 helices (Fig. 5, c and d; and Figs. S23, S24, and S25). For example, L108 displays weaker crosspeaks to its neighbors in NaK2K, and L27 and L90 show twofold weaker crosspeaks to I107. Remaining small but significant changes between M2 helix contacts support the observation of SF–HBC coupling, although the actual structural changes might be smaller than expected.

NaK∆18 WT/NaK2K∆18 intensity ratios of all unambiguous off-diagonal and diagonal cross-peaks. Error bars represent propagated standard deviation of peak intensity. Cross-peak identity is displayed below the bars (name of resonance coming from diagonal peak first). Continued in Fig. S24.
NaK∆18 WT/NaK2K∆18 intensity ratios of all unambiguous off-diagonal and diagonal cross-peaks. Error bars represent propagated standard deviation of peak intensity. Cross-peak identity is displayed below the bars (name of resonance coming from diagonal peak first). Continued in Fig. S24.

NaK∆18 WT/NaK2K∆18 intensity ratios of all unambiguous off-diagonal and diagonal cross-peaks. Continued from Fig. S23.
NaK∆18 WT/NaK2K∆18 intensity ratios of all unambiguous off-diagonal and diagonal cross-peaks. Continued from Fig. S23.

The same data as in Figs. S23 and S24 is plotted on PDB 3E8H . Green lines represent ratios between 0.5 and 2. Orange lines indicate when the peak is at least 2× more intense in NaK∆18, and orange lines where the peaks at least 2× less intense in NaK∆18 as compared to NaK2K. Substituted residues are blue.
The same data as in Figs. S23 and S24 is plotted on PDB 3E8H . Green lines represent ratios between 0.5 and 2. Orange lines indicate when the peak is at least 2× more intense in NaK∆18, and orange lines where the peaks at least 2× less intense in NaK∆18 as compared to NaK2K. Substituted residues are blue.
Discussion
Accurate assignment of x-ray and cryo-EM structures to functional states is of crucial importance since these structures form the basis for more detailed mechanistic models, are the starting point for MD simulations, and influence the design of future experiments. The difficulty of this problem can be illustrated by ion channels, where x-ray structures of K+ channels from various families were integrated into a single HBC steric gating model as a general mechanism of ion channel activation, yet subsequent investigations demonstrated that the HBC does not pose a barrier for K+ permeation under conditions where the channel is nonconductive in many cases (Black et al., 2020; Ben Soussia et al., 2019; Posson et al., 2013; Posson et al., 2015; Chen and Aldrich, 2011; Giese et al., 2017; Dong et al., 2015; Kowal et al., 2014; Zheng et al., 2020; Heer et al., 2017; Blunck et al., 2006). Structural changes occurring in the HBC during the functional cycle of a channel are further obscured by the tendency of the same channel to crystallize in only one conformation (either open, like MthK, or closed, like KcsA or Kir channels). KcsA is among the best-studied channels by x-ray crystallography, yet among >100 structures deposited to PDB, there is not a single structure of the open WT protein. Other methods, such as EPR or SANS, appear to detect structural changes at low pH (Zimmer et al., 2006; Díaz-García et al., 2021; Perozo et al., 1999). As none of the deposited structures are solved below a pH of 4.0, the pH at which the HBC in KcsA was suggested to open, it might be that the open conformation of KcsA displays substantial heterogeneity, which precludes crystallization. Furthermore, the removal of salt bridges stabilizing the closed state of KcsA by mutagenesis results in a heterogenous set of crystals, each displaying a different degree of HBC opening (Cuello et al., 2010a). In agreement with such interpretation, NaK solution and solid-state NMR data suggest that the C-terminal half of the M2 helix displays enhanced dynamics (Shi et al., 2018; Lewis et al., 2021). Moreover, the lack of x-ray structures of certain intermediates and the consequent difficulty in reconciling these structures with functional data is not limited to KcsA. For example, high conductance potassium channel Slo2.2 and K2P TASK channel cryo-EM structures have suggested the gate to be at the HBC (Rödström et al., 2020; Li et al., 2020; Hite et al., 2015), while this localization of the gate appears to disagree with functional observations (Ben Soussia et al., 2019; Giese et al., 2017). It also extends away from K+ channels to channels such as pLGICs (Gonzalez-Gutierrez et al., 2017).
We have measured the NMR spectra of the full-length NaK and its N-terminally truncated variant, NaKΔ18, which is missing the M0 helix. While the x-ray structures show two very different open and closed conformations for these variants, amide and methyl 2-D NMR spectra indicate moderate chemical shift differences between the two protein constructs in lipid bicelles. We show that the most pronounced methyl chemical shift perturbations, which are commonly associated with the largest structural changes, often occur due to changes in the orientation of neighboring aromatic side chains (as can be seen in the 2-D 13C HMQC spectra of F92A NaK and NaK2K). In this way, large methyl CSPs from aromatics neighboring side chains might “conceal” a more important change in structure with a lower CSP. In other words, the chemical shifts of the methyl groups over-represent reorientations of the aromatic side chains. To better characterize FL NaK and NaKΔ18 structures, we turned to NOESY distance measurements between the methyl groups of Leu, Val, and Ile. Surprisingly, they suggested that both NaKΔ18 and full-length variants are in the same, open conformation in DMPC/DHPC lipid bicelles. Thus, our data add to the accumulating evidence that K+ flux across several ion channels is not hindered by a steric HBC occlusion and is likely regulated at the SF instead.
In light of the observations that HBC is not fully closed in multiple different channels, the HBC steric gating hypothesis was revised to an allosteric model, where physical separation of the C-termini of M2 helices allosterically transmits changes to the SF, causing the opening of the channel (Heer et al., 2017; Kopec et al., 2019; Boiteux et al., 2020). Thus, when the orientation of the M2 helix is perturbed by opening at the HBC in MthK or KcsA during MD simulations, a small correlated change between residues S69 (S57), V70 (V58), and L40 (L35) in KcsA (Heer et al., 2017), or (I84, T59) in MthK leads to a slight expansion of ∼1 Å at the bottom of the SF, which leads to flux (Kopec et al., 2019; Gu and de Groot, 2020). Similar residues were suggested by analyzing MD trajectories (I56, V91, F87; Boiteux et al., 2020). This allosteric model is proposed to extend somewhat generally across multiple K+ families. Our data and previously published data (Shi et al., 2018; Lewis et al., 2021) on NaK suggest that the termini of M2 helices are somewhat flexible on various timescales, which may correspond to the intrinsic swaying of M2 helices. Such motions have not been investigated in other channels, such as KcsA or MthK, and may be important in understanding the gating mechanism.
While the coupling between the SF and M2 helix residues below it is well delineated in KcsA, it is interesting to note that we observe similar coupling in NaK. First of all, like the KcsA F103A variant (Xu et al., 2017), NaK F92A substitution compromises the whole tetramer stability, as can be seen in migration on SDS-PAGE gels, where NaKΔ18 primarily migrates as a tetramer, whereas F92A-NaKΔ18 migrates as a monomer (Fig. S13 a). This suggests that a hydrophobic residue in this position might play a more general role in stabilizing ion channel structure. We further show that F92A substitution increases deuterium–hydrogen exchange of NaK in DM micelles. This likely occurs because a fraction of tetramer dissociates into monomers in DM micelles, which may reduce helix stability and facilitate amide back-exchange. While NaK2K promotes the stability of the tetramer and thus shows decreased back-exchange, polar or charged substitutions in the F92 position, such as D or N, destabilize the tetramer and thus might explain the difficulty in expressing these variants.
In addition to our previous observation that the nature of ion in the SF impacts the M2 helices (Lewis et al., 2021), we also observe chemical shift perturbations and NOESY crosspeak intensity changes in NaK2K that support allosteric signal propagation between the SF and M2 helix, as well as changes in the SF upon F92A substitution, which also hints to some allosteric coupling. This is consistent with the SF gating model, but the definitive interpretation is complicated by several factors. Unlike the majority of channels with a tetrameric K+ channel fold, F92A in NaK points toward the conductance pathway and occupies a position where a small side chain, A or G, is typically located in other K+ channels (Fig. 1 c and Table S1). Indeed, a previous study on MthK made an A88F mutation to mimic NaK, and this greatly reduced the observed flux amplitude (although it actually increased the open probability; Shi et al., 2011). Mutations in this location appear to affect K+ channel gating in general (Ben Soussia et al., 2019; Lippiat et al., 2000; Flynn and Zagotta, 2003; Stepanovic et al., 2009; Choveau et al., 2012), but not always in the same manner. In TREK-1 similar substitutions (G171F and A286F) reduce flux (Al-Moubarak et al., 2019), although the WT level of the flux of this variant can be recovered by adding activator flufenamic acid. Moreover, the replacement of L267 (I88 in NaK) in the conduction pathway of Slo2.1 and Slo2.2 to an even bulkier W actually produces constitutively open channels with high activity (Giese et al., 2017), which appears to conflict with the conclusion obtained by Shi et al. (2011). We investigated whether perturbations of the pore helix at positions known to affect some of the K+ channel gating (which generally coincide with the residues in contact with all three helices: pore, M1, and M2) can also activate the NaK channel with F92 intact. While we could see an effect on the tetramer stability both on SDS-PAGE and gel filtration profiles, the L61 and L35 mutants did not display any flux. However, we do not know if such mutations sufficiently affect the SF, and better-designed functional and structural studies might help to dissect the overlapping effects that lead to NaK gating at the SF.
In light of these observations, what is the functional significance of the closed crystal structure obtained for NaK FL? Similar observations have appeared in the literature in the past, where a constitutively open KcsA variant, as demonstrated by single-channel recordings and EPR spectroscopy, crystallized in nearly the same conformation as the closed channel (Cuello et al., 2010c). Crystal lattice forces might explain why NaK FL appears to be closed in the x-ray structure or if this state might represent some minor intermediate with yet unassigned function that was stabilized by the particular crystallization conditions (Liu et al., 2015). In these studies, crystal lattice forces were indicated as preventing the channel from opening in the crystal. A similar phenomenon might explain why NaK FL appears to be closed in the x-ray structure.
Alternatively, a closed FL NaK structure might represent some minor intermediate with yet unassigned function, which was stabilized by the particular crystallization conditions (Kurauskas et al., 2017), for example, when lipids were replaced by detergent molecules. This raises the question: how reliably can K+ channel x-ray structures reveal the full repertoire of functionally relevant states? This problem extends beyond just the conformation of the HBC in closed channels and involves the structural heterogeneity of the SF as well. It was recently demonstrated that the S0–S2 site region of the SF of NaK displays a high degree of flexibility by NMR (Lewis et al., 2021), although it appears to be ordered in the x-ray structures (Shi et al., 2006; Alam and Jiang, 2008), and only minuscule differences in side-chain orientation are captured by cryo-EM (Liu and Gonen, 2018). Similarly, x-ray crystallography displays no differences between K+ selective NaK2K SF structures under different ionic conditions (Derebe et al., 2011), while differences were detected by NMR (Hendriks et al., 2021). In KcsA, variants with very different modal gating properties displayed identical SF conformations crystallographically (Chakrapani et al., 2011), yet differences between the spectra of these variants were detected with NMR (Jekhmane et al., 2019). It is thus clear that although crystal structures have provided invaluable insight into the structure of ion channels, they have revealed only a limited subset of the full range of functional states, and a better understanding of ion channel function will require structural techniques that can probe channel structure in lipid environments and identify the multiple conformations necessary for the dynamic gating and inactivation of these channels.
Acknowledgments
Crina M. Nimigean served as the editor.
We would like to thank Nathan Thomas for his suggestions on performing SSME measurements.
Research reported in this publication was supported by National Institute of General Medical Sciences of the National Institutes of Health under award numbers R01GM116047 and R35GM141748. The content is solely the responsibility of the authors and does not necessarily represent the official views of the National Institutes of Health. This study made use of the National Magnetic Resonance Facility at Madison, which is supported by National Institutes of Health grant R24GM141526.
The authors declare no competing financial interests.
Author contributions: V. Kurauskas prepared NaK constructs and samples, collected and analyzed NMR and SSME data, wrote the original manuscript, and revised the manuscript. M. Tonelli assisted in NMR data collection and revised the manuscript. K. Henzler-Wildman supervised the project, acquired funding, and revised the manuscript.
References
This work is part of a special issue on Structure and Function of Ion Channels in Native Cells and Macromolecular Complexes.

