


Smooth muscle (SM) is found in most hollow organs of the body. Phasic SM, as found in the gut, contracts to propel content, whereas tonic SM, as found in most blood vessels, maintains tension. This force maintenance is referred to as the latch state and occurs at low levels of myosin activation (myosin light chain [LC20] phosphorylation). Molecular mechanisms have been proposed to explain the latch state but have been studied only at the whole-muscle level because of technological limitations. In the current study, an assay chamber was devised to allow injection of myosin light chain phosphatase (MLCP) during laser trap and in vitro motility assays, without creating bulk flow, to reproduce latch state conditions at the molecular level. Using the laser trap in a single-beam mode, an actin filament was brought in contact with several myosin molecules on a pedestal. Myosin pulled on the actin filament until a plateau force was reached, at which point, MLCP was injected. Force maintenance was observed during LC20 dephosphorylation, the level of which was assessed in a parallel in vitro motility assay performed in the same conditions. Force was maintained longer for myosin purified from tonic SM than from phasic SM. These data support the longstanding dogma of strong bonds caused by dephosphorylated, noncycling cross-bridges. Furthermore, MLCP injection in an in vitro motility mixture assay performed with SM and skeletal muscle myosin suggests that the maintenance of these strong bonds is possible only if no energy is provided by surrounding actively cycling myosin molecules.
Introduction
Tonic smooth muscle (SM), as found in most blood vessels, is defined electrophysiologically (Somlyo and Somlyo, 1968) as a multiunit muscle that contracts slowly and maintains tone for long periods of time. Phasic SM, as found in the intestine, functions as a single-unit muscle (Somlyo and Somlyo, 1968) that contracts rapidly to propel content, as in peristalsis. At the molecular level, tonic and phasic SM also differ in their expression of a myosin isoform that contains a seven–amino acid insert in a flexible loop located near the nucleotide binding pocket. Tonic SM preferentially expresses myosin that lacks the insert (SMA isoform, [−]insert) whereas phasic SM mostly expresses the inserted isoform (SMB isoform, [+]insert; Kelley et al., 1993; White et al., 1993). The exclusion of the insert leads to a longer attachment time of myosin to actin by decreasing the MgADP release and MgATP attachment rates (Lauzon et al., 1998). Thus, the (−)insert isoform has a slower velocity of actin propulsion, as assessed in the in vitro motility assay (Kelley et al., 1993).
The ability of tonic SM to maintain force at low energy (MgATP) cost has puzzled researchers for a long time. This characteristic is known as the latch state and was first reported by Dillon et al. (1981) when measuring the mechanical properties of swine carotid artery SM tissue during K+-induced contraction. Following stimulation, force was seen to increase to a peak that was maintained despite myosin deactivation, that is, decreasing levels of regulatory light chain (LC20) phosphorylation. Conversely, shortening velocity peaked and decreased with LC20 phosphorylation levels, presumably resulting from changes in myosin cross-bridge cycling rate.
Many theories have been proposed to explain this efficient force maintenance. Dillon et al. (1981) suggested the presence of either noncycling or slowly cycling cross-bridges (latch bridges) that formed when myosin was dephosphorylated while attached to actin. Because MgADP must be released from myosin before it can detach from actin, Hai and Murphy (1988a,b) proposed that LC20 dephosphorylation of an attached myosin head may decrease the rate of MgADP release, thereby maintaining force. The greater affinity for MgADP of tonic SM compared with phasic SM, as well as the further increase in this affinity at low phosphorylation levels, were later demonstrated at the whole-muscle level (Fuglsang et al., 1993; Khromov et al., 1995; Khromov et al., 2004) and at the molecular level (Léguillette et al., 2008), corroborating the greater propensity of tonic SM to enter the latch state.
Cooperativity mechanisms have also been proposed to explain the latch state, whereby remaining phosphorylated myosin molecules facilitate the reattachment of dephosphorylated, detached myosin molecules to actin by communication via the thick filament or the actin regulatory proteins (Himpens et al., 1988; Somlyo et al., 1988; Vyas et al., 1992). Several other mechanisms have been proposed to explain the latch state involving nonmuscle myosin (Ogut et al., 2007), single-phosphorylated SM myosin heads (Tanaka et al., 2008), a calcium-dependent regulatory mechanism other than LC20 phosphorylation (Siegman et al., 1985), or actin regulatory proteins (Ngai and Walsh, 1984; Marston, 1989; Sutherland and Walsh, 1989; Winder and Walsh, 1990; Okagaki et al., 1991; Shirinsky et al., 1992; Haeberle, 1994; Morgan and Gangopadhyay, 2001; Szymanski, 2004; Roman et al., 2013; Roman et al., 2014).
Remarkably, all these potential mechanisms suggested to explain the latch state have been inferred from measurements performed at the whole-muscle level. Indeed, due to technological limitations, none of these mechanisms have been verified at the molecular level. One such limitation was the inability to measure molecular mechanics while making dynamic changes to the conditions of in vitro motility and laser trap assays. In the current study, a flow-through chamber was devised to allow injection of myosin light chain phosphatase (MLCP) during laser trap and in vitro motility assays, without creating bulk flow, to reproduce the latch state conditions at the molecular level. Thus, we studied the molecular mechanics of myosin purified from tonic SM (pig stomach fundus) and phasic SM (chicken gizzard) during LC20 dephosphorylation. We report, for the first time, force maintenance at the molecular level during LC20 dephosphorylation. Moreover, force was maintained longer for myosin from tonic SM than myosin from phasic SM.
Materials and methods
Reagents
The following reagents were purchased from Sigma-Aldrich: ATP (A3377), BSA (A7030), CaCl2 (C5080), calmodulin (P2277), catalase (C40), gelsolin (G8032), glucose (G7528), glucose oxidase (G2133-50KU), glycerol (356352), imidazole (I202), methylcellulose (M0512), MnCl2 (203734), and tetramethyl rhodamine isothiocyanate (TRITC)-phalloidin (P1951). The following reagents were purchased from Thermo Fisher Scientific: amylacetate (A718-500), dithiothreitol (DTT; BP172), EGTA (O2783), glutaraldehyde (BP25484), KCl (P330), and MgCl2 (M33-500).
Proteins
Myosin from tonic SM (gift from Dr. A. Sobieszek, Austrian Academy of Sciences, Vienna, Austria) was purified from pig stomach fundus, whereas myosin from phasic SM and skeletal muscle myosin (SkMM) was purified from chicken gizzard and pectoralis, respectively (obtained from a local slaughterhouse; Sobieszek, 1994). Myosin from tonic SM and phasic SM will, from here on, be referred to as tonic SMM and phasic SMM, respectively. Myosin light chain kinase (MLCK) and MLCP (gifts from Dr. A. Sobieszek, Austrian Academy of Sciences) were purified from turkey gizzard (Sobieszek et al., 1997a; Sobieszek et al., 1997b). The MLCP contains the catalytic subunit (PP1-37kD) and the target subunit (MyPT1-67kD). Actin was purchased commercially (AKF99; Cytoskeleton) and fluorescently labeled using TRITC-phalloidin (Warshaw et al., 1990). The proteins used for the in vitro motility and laser trap assays consisted of 100% phasic SMM or 100% tonic SMM, whereas for the in vitro motility mixture assays, the proteins consisted of 25% SkMM and 75% phasic or tonic SMM.
Buffers
Myosin buffer (300 mM KCl, 25 mM imidazole, 1 mM EGTA, 4 mM MgCl2, and 15 mM DTT; pH adjusted to 7.4) and actin buffer (25 mM KCl, 25 mM imidazole, 0.1 mM CaCl2, 4 mM MgCl2, 15 mM DTT, and an oxygen scavenger system consisting of 0.25 mg/ml glucose oxidase, 0.045 mg/ml catalase, and 5.75 mg/ml glucose; pH adjusted to 7.4) were used for all experiments. The motility assay buffer consisted of actin buffer to which methylcellulose (0.5%), MgATP (2 mM), and MnCl2 (1 mM; catalyst for MLCP; Lee et al., 1999; Shi, 2009) were added. The laser trap assay buffer consisted of actin buffer to which methylcellulose (0.3%), MgATP (200 μM), and MnCl2 (1 mM) were added. The injection buffer consisted of actin buffer to which MgATP (2 mM), MnCl2 (1 mM), and MLCP (1.5 μM) were added.
Myosin phosphorylation
Tonic and phasic SMM (5 mg/ml) were phosphorylated with CaCl2 (6–6.7 mM), calmodulin (3–3.75 μM), MLCK (0.07–0.08 μM), MgCl2 (10 mM), and MgATP (5 mM) by incubation with all reagents for 20 min at room temperature, stored in glycerol (50%) at −20°C, and used within 72 h.
Assay chamber
Flow-through chambers (10 μl) were constructed by securing a laser-cut polyethylene terephthalate glycol plastic coverslip (clear; 20 × 15 × 0.5 mm; Ponoko) to a glass coverslip (Fisherbrand; 60 × 24 × 0.15 mm; Thermo Fisher Scientific) coated in nitrocellulose (53153; Ladd Research Industries; 1.5% in amylacetate) with two pieces of double-sided tape (Scotch ATG 926; 6.4 × 0.13 mm; 3M) laid parallel ∼2 mm apart using an adhesive applicator (Scotch ATG 714; 3M). All buffers and proteins were flowed through the side openings between the plastic coverslip and glass coverslip. The plastic coverslip contained a through-hole (2-mm diameter) under which a hydrophilic, polycarbonate, microporous membrane (3-μm pore diameter; Sterlitech) was glued (NOA81; Norland Products) to allow for injection and diffusion of MLCP during the assay (Fig. S1).

Schematic diagrams of the assay chamber used for all experiments. (A–C) Exploded (A) and assembled (B) views of the flow-through chamber components are shown. A preinjection droplet and silicone grease (C) were used to minimize bulk flow during MLCP injections performed with a pipette tip (see Materials and methods for details). Dimensions are not to scale.
Schematic diagrams of the assay chamber used for all experiments. (A–C) Exploded (A) and assembled (B) views of the flow-through chamber components are shown. A preinjection droplet and silicone grease (C) were used to minimize bulk flow during MLCP injections performed with a pipette tip (see Materials and methods for details). Dimensions are not to scale.
In vitro motility assay preparation
Nonfunctional myosin molecules were removed by ultracentrifugation (Optima L-90K ultracentrifuge; 42.2 Ti rotor; 31 min; 4°C; 42,000 rpm; Beckman Coulter) of myosin (500 μg/ml) with filamentous actin (100 μg/ml) and MgATP (1 mM) in myosin buffer. The functional myosin was then diluted in myosin buffer to concentrations ranging between 75 and 100 μg/ml, perfused in the assay chamber, and incubated for 2 min. Note that appropriate quantities of SkMM and phasic or tonic SMM were mixed before dilution for the in vitro motility mixture assays (Warshaw and Trybus, 1991). This was followed by the addition of BSA (0.5 mg/ml in myosin buffer, two washes) and unlabeled globular actin (G-actin; 5 μM filamentous actin in actin buffer vortexed for 30 s, two washes) incubated for 1 min to bind any remaining nonfunctional myosin heads. MgATP (1 mM in actin buffer, two washes) was then perfused to remove the unlabeled G-actin from the functional myosin heads, followed by actin buffer (two washes), TRITC-labeled actin (60 nM in actin buffer) incubated for 1 min, and motility assay buffer. High-vacuum silicone grease (Z273554; Dow Corning; Sigma-Aldrich) was then used to seal the side openings of the assay chamber to further minimize bulk flow, as well as to secure the assay chamber to a metal frame for structural support.
In vitro motility assay data acquisition
The assay chamber was transferred to the stage of an inverted microscope (Eclipse Ti; Nikon Instruments) equipped with a high-numerical-aperture objective (CFI Plan Fluor DLL 100XA; oil immersion; 1.3 NA; Nikon Instruments). An objective lens heater (Bioptechs) and heated microscope slide holder (Chamlide TC; Quorum Technologies) were used to ensure that all experiments were conducted at 30°C. Actin filament movement was visualized and recorded using an excitation light source (X-Cite 120Q; Excelitas Technologies), electron-multiplying charge-coupled device camera (KP-E500; 720 × 480 resolution; 30 frames/s; 8-bit grayscale; Hitachi Kokusai Electric), and custom software with a frame grabber (MOR/2VD/84; Matrox). The average velocity (v) of all filaments moving faster than a specified cutoff velocity (0.05 μm/s for the in vitro motility assays or 0.10 μm/s for the in vitro motility mixture assays; see Table S1 for all parameters used in the video analysis) and motile fraction (fmot; the percentage of filaments moving above this threshold) were measured using customized Matlab (vR2018a) video analysis software (Ijpma et al., 2018). To improve the accuracy of v measurements at low fmot values, any instantaneous filament velocity greater than three times the mean velocity at each time point for all videos of a given condition was ignored.
MLCP injections
Immediately after transferring the assay chamber to the microscope stage, a 5-μl droplet of injection buffer lacking MLCP was placed on top of the microporous membrane. Injections of MLCP (5 μl of injection buffer) were performed using a 200-μl pipette tip connected to a glass Luer lock syringe (25 μl; McMaster-Carr) by polyethylene tubing (1.6-mm inside diameter; McMaster-Carr) filled with water. An air gap of ∼5 cm was left at the end of the tube connected to the pipette tip to prevent the water from mixing with the injection buffer. A transparent, acrylic plastic (McMaster-Carr) cover containing a small, angled through-hole (45°) was placed on top of the heated slide holder and secured with microscope stage clips to support the pipette tip during injections (Fig. S2). The pipette tip was positioned directly above the droplet on the microporous membrane, without touching the droplet, to prevent early diffusion of MLCP. Baseline motility was recorded for ∼30 s before injection. Note that the concentration of MLCP injected (see Materials and methods, Buffers) was selected based on its ability to dephosphorylate the SMM in a reasonable amount of time (∼40 s), as assessed by a decrease in fmot and v in the in vitro motility assay, such that the laser trap measurements (see Materials and methods, Laser trap assay data acquisition) could be performed. Note as well that a small decrease in v was usually observed after an injection was performed during the in vitro motility assays. These artifacts occurred immediately at the time of injection of MLCP or other control solutions and were presumably due to optical effects or trace amounts of convective flow. Indeed, in a control experiment wherein MgATP was injected during in vitro motility assays containing actin filaments bound to myosin in rigor, the filaments started moving ∼1 s after injection (Fig. S3). Because MgATP is a much smaller molecule than MLCP, this result eliminates the possibility that MLCP was acting immediately upon injection.

The experimental setup used for the laser trap and in vitro motility assays. An assay chamber is secured to a metal frame (red arrow), placed on the heated microscope slide holder (yellow arrow), and then positioned such that the region below the microporous membrane is located directly above the objective lens. An acrylic plastic cover (blue arrow) is used to support the pipette tip (green arrow) during injections.
The experimental setup used for the laser trap and in vitro motility assays. An assay chamber is secured to a metal frame (red arrow), placed on the heated microscope slide holder (yellow arrow), and then positioned such that the region below the microporous membrane is located directly above the objective lens. An acrylic plastic cover (blue arrow) is used to support the pipette tip (green arrow) during injections.

Injection of MgATP during in vitro motility assays containing actin filaments bound to SkMM in rigor. Each color represents the fmot data collected from individual assays (n = 3) as movement is initiated from rigor to maximum motility. MgATP was injected at time = 0 s. The parameter settings of the video analysis software used to measure fmot were the same as those used for the in vitro motility mixture assay (Table S1).
Injection of MgATP during in vitro motility assays containing actin filaments bound to SkMM in rigor. Each color represents the fmot data collected from individual assays (n = 3) as movement is initiated from rigor to maximum motility. MgATP was injected at time = 0 s. The parameter settings of the video analysis software used to measure fmot were the same as those used for the in vitro motility mixture assay (Table S1).
In vitro motility assay data and statistical analysis

Representative in vitro motility assay data fitted with the sigmoid model. (A and B) Blue lines: fmot (A) or v of actin movement (B) for phasic SMM (n = 1); black lines: model fit (Eq. 1). MLCP was injected at time = 0 s.
Representative in vitro motility assay data fitted with the sigmoid model. (A and B) Blue lines: fmot (A) or v of actin movement (B) for phasic SMM (n = 1); black lines: model fit (Eq. 1). MLCP was injected at time = 0 s.
To quantify the time course of dephosphorylation in the in vitro motility mixture assay, the v data were fitted in the same way as described for the in vitro motility assay, and the statistical analysis was also performed in the same manner. A sigmoid curve was not observed in the fmot data, which thus were not fitted with the sigmoid model.
Laser trap assay
The optical tweezers system (MMI CellManipulator Plus; Quorum Technologies) with an ytterbium infrared laser (8 W; 1,070 nm) combined with the in vitro motility assay described above was used as a single-trap assay for all force measurements.
Laser trap assay preparation
Before being coated with nitrocellulose, the glass coverslips were sprayed with 4.5 μm polystyrene microspheres (171355; Polybead; Polysciences) to create pedestals (Roman et al., 2014). Trapping was performed with 3-μm amino polystyrene microspheres (171455; Polybead; Polysciences) coated with gelsolin according to Suzuki et al. (1996), except that the time of suspension/gentle mixing of the microspheres in glutaraldehyde was increased to 15 h and the amount of protein dissolved in 0.5 ml of solution B was 27 μg gelsolin, 424 μg BSA, and 27 μg G-actin. Proteins and solutions were prepared and perfused in the assay chamber in the same manner as for the in vitro motility assay described above, with the exception that (gelsolin-coated) microsphere-tailed actin filaments were added to the laser trap assay buffer. The microsphere-tailed actin filaments were prepared according to Suzuki et al. (1996) with the following modifications: 5 μM TRITC-labeled actin was used, and the suspension was diluted 1:10 with laser trap assay buffer to be perfused in the assay chamber.
Laser trap assay data acquisition

Images from the laser trap assay. (A and B) In the bright-field (A) and fluorescence (B) images shown, the myosin (not visible) on a pedestal (black arrow) is pulling on a fluorescently labeled actin filament (white arrow) attached to a trapped microsphere (blue arrows). The myosin, pedestal, and trapped microsphere are not fluorescently labeled; the outline of the trapped microsphere is visible in B because of small pieces of attached, fluorescently labeled actin. Scale bars: 5 μm.
Images from the laser trap assay. (A and B) In the bright-field (A) and fluorescence (B) images shown, the myosin (not visible) on a pedestal (black arrow) is pulling on a fluorescently labeled actin filament (white arrow) attached to a trapped microsphere (blue arrows). The myosin, pedestal, and trapped microsphere are not fluorescently labeled; the outline of the trapped microsphere is visible in B because of small pieces of attached, fluorescently labeled actin. Scale bars: 5 μm.

Laser trap k T calibration. (A) At 6.0% laser power (LP), Δx was measured as it was being moved at constant velocity (vc). kT was calculated at increasing vc using the Stokes force (Ff) exerted on the microsphere (Eqs. 3 and 4) and then averaged. (B)kT was calculated at increasing LP (6.0–9.0%) across multiple weeks. Linear fits were determined for each trial (n = 5), represented by different colors, and their slopes were averaged to obtain an interpolation constant (kc) that was used to calculate kT for each individual laser trap assay experiment (Eq. 5). kT for the experiments reported in this study varied between 58 and 71 pN/μm.
Laser trap k T calibration. (A) At 6.0% laser power (LP), Δx was measured as it was being moved at constant velocity (vc). kT was calculated at increasing vc using the Stokes force (Ff) exerted on the microsphere (Eqs. 3 and 4) and then averaged. (B)kT was calculated at increasing LP (6.0–9.0%) across multiple weeks. Linear fits were determined for each trial (n = 5), represented by different colors, and their slopes were averaged to obtain an interpolation constant (kc) that was used to calculate kT for each individual laser trap assay experiment (Eq. 5). kT for the experiments reported in this study varied between 58 and 71 pN/μm.
Laser trap assay data and statistical analysis
The time before injection at which the force started increasing and did not return to zero (TInj), the time after injection during which force was maintained (time until the force drops and remains at zero; THold), and the average force after injection (Favg) were determined for each MLCP injection and control buffer injection individually and then averaged. Favg was calculated during THold for the MLCP-injection assays; for the control buffer-injection assays, Favg was calculated during the average THold of the MLCP-injection assays for either phasic or tonic SMM. Statistical significance was tested using Welch’s t test (TInj and Favg) to correct for unequal variance or Mann–Whitney U test (THold) to correct for nonnormal distributions and unequal variance. Comparisons between THold and t0 (from the in vitro motility assay) were done using Mann–Whitney U test. A value of P < 0.05 was considered significant. Data are reported as mean ± SEM (TInj and Favg) or median (interquartile range; THold), and n refers to the number of assays (one assay per chamber). For additional information about laser trap stiffness calibration, see the supplemental text at the end of the PDF.
Online supplemental material
Fig. S1 shows the components of the assay chamber in detail. Fig. S2 shows the experimental setup used to perform the in vitro motility and laser trap assays. Fig. S3 shows the in vitro motility assay MgATP injection data. Fig. S4 shows sample in vitro motility assay data fitted with the sigmoid model. Fig. S5 shows bright-field and fluorescence images taken during the laser trap assay. Fig. S6 shows the calibration method for kT. Fig. S7 shows the control data for the in vitro motility assay. Fig. S8 shows the Western blots of the phasic and tonic SMM. Table S1 shows the parameter settings of the Matlab software used to analyze the in vitro motility assay videos (Ijpma et al., 2018). Table S2 and Table S3 show the nonnormalized sigmoid model parameters determined by fitting the in vitro motility and mixture assay data, respectively. Eqs. 3, 4, and 5 show the calibration method for kT. Supplemental text provides additional details about the calibration method for kT, the control data for the in vitro motility assay, and the Western blot protocol.
Results
MLCP injection in the laser trap assay
To assess whether force maintenance occurs at the molecular level during myosin LC20 dephosphorylation, MLCP was injected in the laser trap assay once the force generated by the myosin molecules pulling on an actin filament attached to the trapped microsphere had reached a plateau level. Both tonic and phasic SMM showed force maintenance after MLCP injection (Fig. 1). Furthermore, Favg was not statistically different between tonic SMM and phasic SMM (51 ± 6 vs. 49 ± 5 pN; P = 0.79). However, THold was greater for tonic SMM than phasic SMM (32 [27–48] vs. 21 [15–27] s; P = 0.03). Note that TInj was not statistically different between tonic SMM and phasic SMM (12 ± 1 vs. 12 ± 1 s; P = 0.70).

Injection of MLCP in the laser trap assay. (A and B) The injection was performed at time = 0 s during plateau force generation by phasic SMM (n = 5; A) or tonic SMM (n = 5; B). Each color represents the data collected from an individual assay. TInj: time of the injection following the start of force generation (exemplified using the blue phasic SMM trace); THold: time of force maintenance after the injection (exemplified using the blue phasic SMM trace); (TInj)avg: average TInj; (THold)med: median THold.
Injection of MLCP in the laser trap assay. (A and B) The injection was performed at time = 0 s during plateau force generation by phasic SMM (n = 5; A) or tonic SMM (n = 5; B). Each color represents the data collected from an individual assay. TInj: time of the injection following the start of force generation (exemplified using the blue phasic SMM trace); THold: time of force maintenance after the injection (exemplified using the blue phasic SMM trace); (TInj)avg: average TInj; (THold)med: median THold.
Control buffer injection in the laser trap assay
To confirm that the abrupt drop in force observed after injecting MLCP (Fig. 1) was not due to a physical disturbance caused by the injection itself, the above laser trap measurements were repeated using control buffer (Fig. 2). Favg was not found to be statistically different when injecting control buffer instead of MLCP for both tonic SMM (51 ± 6 vs. 51 ± 6 pN; P = 0.96) and phasic SMM (45 ± 5 vs. 49 ± 5 pN; P = 0.59). However, THold was found to be statistically greater when injecting control buffer instead of MLCP for both tonic SMM (78 [60–211] vs. 32 [27–48] s; P = 0.02) and phasic SMM (84 [33–218] vs. 21 [15–27] s; P = 0.03). These results suggest that the abrupt decreases in force were real events induced by dephosphorylation and not simply artifacts. Note that TInj was not statistically different when injecting control buffer instead of MLCP for phasic SMM (19 ± 3 vs. 12 ± 1 s; P = 0.11). However, TInj was statistically greater when injecting control buffer instead of MLCP for tonic SMM (23 ± 2 vs. 12 ± 1 s; P = 0.007), but this difference in TInj of ∼11 s was very small compared with THold in the range of 78–84 s. Note as well that in this assay, a sawtooth behavior was often observed during the plateau phase because the myosin was still phosphorylated and thus able to reattach to the actin filament when it was dropped.

Injection of control buffer in the laser trap assay. (A and B) The injection was performed at time = 0 s during plateau force generation by phasic SMM (n = 5; A) or tonic SMM (n = 5; B). Each color represents the data collected from an individual assay. (TInj)avg: average time of the injection following the start of force generation; (THold)med: median time of force maintenance after the injection. Inset: A portion of the gray phasic SMM trace wherein the sawtooth pattern can be observed.
Injection of control buffer in the laser trap assay. (A and B) The injection was performed at time = 0 s during plateau force generation by phasic SMM (n = 5; A) or tonic SMM (n = 5; B). Each color represents the data collected from an individual assay. (TInj)avg: average time of the injection following the start of force generation; (THold)med: median time of force maintenance after the injection. Inset: A portion of the gray phasic SMM trace wherein the sawtooth pattern can be observed.
MLCP injection in the in vitro motility assay
To elucidate the underlying mechanisms of the force maintenance observed above, as well as assess the time course of SMM deactivation in these assay chambers, MLCP was injected during in vitro motility assays performed with tonic or phasic SMM. The sigmoidal fit to the fmot data showed no statistical difference in k between tonic SMM and phasic SMM (−0.30 ± 0.03 vs. −0.23 ± 0.02 s−1; P = 0.05) or t0 (26 ± 2 vs. 27 ± 2 s; P = 0.83; Fig. 3, A and B). Similarly, the sigmoidal fit to the v data showed no statistical difference in k between tonic SMM and phasic SMM (−0.25 ± 0.03 vs. −0.33 ± 0.04 s−1; P = 0.09) or t0 (28 ± 2 vs. 24 ± 1 s; P = 0.21; Fig. 3, C and D). Thus, these data do not show evidence for differences in dephosphorylation rate between tonic and phasic SMM. Importantly, comparing these t0 values (average t0 of fmot and v) with the THold values measured in the laser trap assay suggests that force maintenance was more likely to occur during dephosphorylation for tonic SMM (t0: 27 ± 1 vs. THold: 32 [27–48] s; P = 0.06), but not so convincingly for phasic SMM (t0: 26 ± 1 vs. THold: 21 [15–27] s; P = 0.27).

Injection of MLCP in the in vitro motility assay. (A–D) Normalized fmot and v of actin movement for phasic SMM (n = 11; A and C) or tonic SMM (n = 14; B and D). Gray lines: data collected from individual assays; solid black lines: averaged data; t0: average time at the sigmoid model fit midpoint (Eq. 1). MLCP was injected at time = 0 s. Individual curves were normalized with respect to the sum of the sigmoid model parameters (A and C; Eq. 1).
Injection of MLCP in the in vitro motility assay. (A–D) Normalized fmot and v of actin movement for phasic SMM (n = 11; A and C) or tonic SMM (n = 14; B and D). Gray lines: data collected from individual assays; solid black lines: averaged data; t0: average time at the sigmoid model fit midpoint (Eq. 1). MLCP was injected at time = 0 s. Individual curves were normalized with respect to the sum of the sigmoid model parameters (A and C; Eq. 1).
MLCP injection in the in vitro motility mixture assay
To determine whether dephosphorylated tonic SMM imposes a greater load than phasic SMM on other cycling myosin, MLCP was injected during in vitro motility mixture assays performed with phasic or tonic SMM mixed with nonphosphorylated SkMM (75% SMM + 25% SkMM), because the latter is not affected by MLCP. The sigmoidal fit to the v data showed no statistical difference in k between the tonic SMM-SkMM mixtures and the phasic SMM-SkMM mixtures (0.40 ± 0.11 vs. 0.35 ± 0.03 s−1; P = 0.68), or t0 (24 ± 5 vs. 22 ± 1 s; P = 0.75) or in the final v, normalized with respect to the initial v (1.83 ± 0.08 vs. 1.88 ± 0.07; P = 0.61; Fig. 4, A and B). Thus, these data do not show evidence for a difference in load between dephosphorylated tonic and phasic SMM. The fmot data did not show a clear pattern, as was observed for the regular in vitro motility assay, but rather a blended effect due to the deactivation of the SMM and the continued cycling of the SkMM (Fig. 4, C and D).

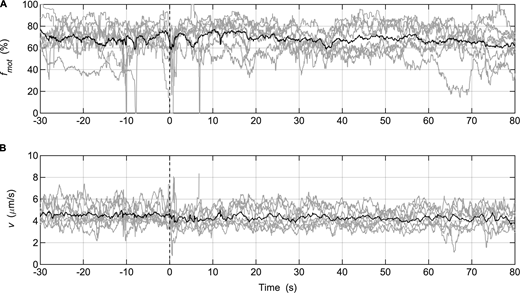
Injection of MLCP in the in vitro motility mixture assay. (A–D) Normalized v of actin movement and fmot for 75% phasic SMM + 25% SkMM (n = 4; A and C) or 75% tonic SMM + 25% SkMM (n = 5; B and D). Each color represents the data collected from an individual assay. MLCP was injected at time = 0 s. v was normalized with respect to the sigmoid model parameter C (Eq. 1). fmot was normalized with respect to the value at the time of MLCP injection.
Injection of MLCP in the in vitro motility mixture assay. (A–D) Normalized v of actin movement and fmot for 75% phasic SMM + 25% SkMM (n = 4; A and C) or 75% tonic SMM + 25% SkMM (n = 5; B and D). Each color represents the data collected from an individual assay. MLCP was injected at time = 0 s. v was normalized with respect to the sigmoid model parameter C (Eq. 1). fmot was normalized with respect to the value at the time of MLCP injection.
Discussion
In this study, the conditions for the latch state were reproduced in laser trap and in vitro motility assays, and force maintenance was observed, for the first time, at the molecular level.
The latch state
After its discovery in the 1980s, several molecular mechanisms have been proposed to explain the latch state (Dillon et al., 1981; Hai and Murphy, 1988a; Himpens et al., 1988; Fuglsang et al., 1993; Khromov et al., 1995). These mechanisms were based on measurements performed at the tissue level but were not explored at the molecular level due to technological limitations. Although researchers have since revisited the latch state following the development of the laser trap and in vitro motility assays (Haeberle, 1994; Haeberle, 1999; Baker et al., 2003; Léguillette et al., 2008; Roman et al., 2013; Roman et al., 2014), studies were still limited by the inability to record measurements while changing the assay conditions. Specifically, nobody has been able to induce LC20 dephosphorylation, a key aspect of the latch state, while measuring force in the laser trap assay. As such, the underlying molecular mechanism of the latch state remained elusive.
SMM dephosphorylation in the laser trap and in vitro motility assays
In the current study, the laser trap assay was used in a single-beam configuration with a single actin filament interacting with several myosin molecules. As such, random molecular force events (Guilford et al., 1997; Lauzon et al., 1998) summed to generate a smooth force increase until a plateau was reached. As predicted by tissue level and single-molecule level measurements (Lauzon et al., 1998), the plateau force (Favg) generated by tonic SMM was not different from that of phasic SMM. However, LC20 dephosphorylation during plateau force generation led to longer THold for tonic SMM than phasic SMM. This difference in THold could not be explained by a difference in TInj, as it was not different between tonic and phasic SMM.
To verify whether myosin was dephosphorylated during the force maintenance phase, MLCP was injected during the in vitro motility measurements with tonic or phasic SMM. The observed decrease in v and fmot confirmed the deactivation of the SMM by the MLCP injected into the assay chamber. It was more convenient to verify this deactivation mechanically, because measuring the phosphorylation level of such few myosin molecules on a gel is challenging. The similar k values from the sigmoidal fits suggest similar rates of dephosphorylation for tonic and phasic SMM. To our knowledge, the phosphorylation and dephosphorylation rates of tonic and phasic SMM have been studied only at the tissue level, and differences reported were attributed to differences in MLCK/MLCP ratios (Himpens et al., 1988). Comparatively, in our study, the same concentration of MLCP led to a similar dephosphorylation rate yet to a different THold in the laser trap assay. Note that previous in vitro motility mixture assay studies performed with unphosphorylated-phosphorylated SMM reported that the v starts dropping only when ≥50% of the myosin is unphosphorylated (Warshaw et al., 1990; Warshaw and Trybus, 1991; Harris et al., 1994), indicating that it is likely that dephosphorylation occurred even earlier than our fmot and v traces suggest.
The fact that we observed a trend for a greater THold in the laser trap assay than t0 in the motility assay for tonic SMM (THold ∼32 vs. t0 ∼27 s) suggests that force maintenance did occur during dephosphorylation and, thus, beyond the phase of active force generation. Comparatively, for phasic SMM, THold (∼21 s) was less than t0 (∼26 s), which indicates that force maintenance likely did not occur past the active force generation phase. The latch state is known to occur with greater propensity in tonic SM, although force maintenance is also sometimes seen in phasic SM (Merkel et al., 1990). Some of our phasic SMM force traces also suggest force maintenance, but on average, THold was longer for tonic SMM than phasic SMM during LC20 dephosphorylation. Interestingly, LC20 dephosphorylation did not appear to decrease the tonic SMM force level at all.
Once the force decreased after injecting MLCP, it did so in an abrupt manner for both tonic and phasic SMM. This abrupt decrease is likely the result of an “avalanche” effect caused by the low myosin concentration used in the laser trap assay. The unitary force and displacement of both the (+)insert (predominant isoform in phasic SM) and (−)insert (predominant isoform in tonic SM) SMM heavy chain isoforms were previously shown to be ∼1 pN and ∼10 nm, respectively (Lauzon et al., 1998). Because Favg was ∼50 pN for both tonic and phasic SMM, it is reasonable to assume that only ∼50 myosin molecules were attached to the actin filament at any given time during the postinjection force plateau. Microsphere displacement from the laser trap center was typically ∼1 μm. Thus, due to the restorative force of the trap on the microsphere, the release of a single cross-bridge would be expected to cause the actin filament to slip by ∼20 nm; it is possible that such slippage disrupted additional cross-bridges and led to the sudden, large drop in force. It is worth noting that abrupt decreases in force were also observed during laser trap assays wherein control buffer was injected. However, in the absence of MLCP, the force could increase again after the sudden drops due to phosphorylated myosin molecules reattaching to the actin filament and preventing the “avalanche” effect from reaching completion. This detachment-reattachment occurred in both phasic and tonic SMM in these control experiments, but it appeared to occur at a greater rate in phasic SMM than in tonic SMM. However, this was not quantified, because of the difficulty in defining the incomplete detachments. This greater detachment-reattachment rate for phasic SMM may have been due to the greater ATPase rate of phasic SMM, as previously reported by Kaya et al. (2017) in experiments performed with SkMM at limiting to nonlimiting ATP concentrations (see Kaya et al., 2017 for sawtooth pattern from 10 µM to 1 mM MgATP). However, in our control experiments, THold appeared to be limited only by the detachment of the actin filament from the microsphere or the microsphere getting pulled out of the trap, as assessed by visual inspection of the recorded video, or by manually stopping the assay because the fluorescence of the actin filaments had faded completely. Conversely, during the MLCP injection experiments, it was the myosin molecules that detached from actin (the actin filament remained bound to the microsphere and the microsphere itself remained in the trap). A different THold was observed between tonic and phasic SMM, suggesting that they behave differently during LC20 dephosphorylation.
Having obtained evidence that force is maintained at the molecular level during LC20 dephosphorylation, the key questions now become: What causes this force maintenance, why is force not reduced with time, and why is force maintained longer in tonic than phasic SMM? Based on molecular mechanics and energetics data, Baker et al. (2003) and Jackson and Baker (2009) proposed a mechano-chemical model for the MgADP release step of myosin. Their model suggests that this energetically unfavorable step for SMM is accelerated if energy is provided by the power strokes of other myosin molecules (Baker et al., 2003; Jackson and Baker, 2009). Following this reasoning, in our system, before MLCP injection, an equilibrium must be reached between the force generated by the myosin heads and the restoring force from the trap to a point of constant force and null displacement. Myosin heads must be cycling at a reduced rate (Jones et al., 1999), because the population of active myosin heads is incapable of generating any further displacement, thus inhibiting the MgADP release step. When myosin heads start to dephosphorylate, assuming dephosphorylation rate is independent of attachment state, some heads dephosphorylate when attached, and some when detached. The heads that are dephosphorylated when attached maintain force and stop cycling altogether, while those that dephosphorylate while detached do not contribute to force generation any more. As the ratio of heads that dephosphorylate while attached vs. those while detached is equal to the ratio of active heads attached and detached at any one time (a function of the duty cycle), the total force remains the same as long as the dephosphorylated attached heads generate the same force and do not detach. The longer force maintenance that we observed for tonic vs. phasic SMM is then caused by a nonzero detachment rate of dephosphorylated phasic SMM, which would be a reflection of the greater affinity for MgADP of tonic SMM (Fuglsang et al., 1993; Khromov et al., 1995; Baker et al., 2003; Khromov et al., 2004). Our in vitro motility mixture assay data showed that the dephosphorylated attached myosin heads detach at similar rates for phasic and tonic SMM, but in this case, energy is provided by cycling SkMM (see the next section for details). It is possible that this load-bearing state also induces reattachment of dephosphorylated myosin (Somlyo et al., 1988), but this would not contribute to the force as long as there is no net displacement. Note that we cannot exclude the possibility that myosin heads in direct proximity to actin (both attached and detached) do not dephosphorylate because of steric hindrance; however, we are not aware of any evidence to support this. Finally, our data do not exclude the potential contribution of other proteins, not studied here, to the latch state.
SMM dephosphorylation in the in vitro motility mixture assay
The original studies addressing the latch state at the whole-muscle level suggested that the dephosphorylation of cross-bridges while attached to actin would lead to noncycling cross-bridges (latch bridges) that generate a load on the remaining cycling cross-bridges, thereby decreasing their cycling rates (Dillon et al., 1981; Hai and Murphy, 1988a; Fuglsang et al., 1993; Khromov et al., 1995). Confirming the presence of these high loads in the in vitro motility assay is difficult because of the “wiggly” behavior of the actin filaments at low phosphorylation levels, making it challenging to measure v precisely. Dephosphorylated myosin is expected to have stopped cycling and to bind only weakly to actin (Somlyo et al., 1988; Léguillette et al., 2008), thereby generating only a small load in agreement with the wiggly movement. The presence of strong bonds could potentially explain the stationary behavior.
To determine whether a load is induced following SMM LC20 dephosphorylation, MLCP was injected during in vitro motility mixture assays performed with phasic or tonic SMM mixed with SkMM. Because SkMM is not regulated at the LC20 level, it continues to cycle in the presence of MLCP (Fig. S7). If noncycling SMM cross-bridges were to form (Dillon et al., 1981; Hai and Murphy, 1988a; Fuglsang et al., 1993; Khromov et al., 1995), they would impose a load on the actin filaments being propelled by the still-cycling SkMM, and thus v would decrease. No such decrease was observed apart from a small drop that occurred immediately after MLCP injection and was attributed to an imaging artifact rather than a biological effect, as it occurred almost instantaneously with all the injections performed. Furthermore, if noncycling SMM cross-bridges were to form preferentially in tonic SMM, we would expect a slower rise in v upon dephosphorylation of the tonic SMM compared with that of the phasic SMM, in their respective mixtures with SkMM. This was not observed, as we saw similar k, t0, and v values. It is possible, however, that the concentration of SkMM we chose to work with was too high and led to the immediate ripping of any strong bonds, therefore preventing the distinction between the behavior of tonic and phasic SMM. However, performing more testing at lower concentrations of SkMM was difficult because the resolution between the initial v and the final v was lost. Lastly, the final v did not reach that expected for pure SkMM (Fig. S7) for either the phasic SMM-SkMM or tonic SMM-SkMM mixtures. This also is unlikely to have been caused by noncycling SMM cross-bridges (Dillon et al., 1981; Hai and Murphy, 1988a; Fuglsang et al., 1993; Khromov et al., 1995) because a final v of ∼2.1 μm/s was observed for >30 s across all trials, during which time actin filaments would have traveled ∼60 μm across the motility surface. This distance is much greater than the 10-nm unitary displacement of SMM and SkMM (Guilford et al., 1997; Lauzon et al., 1998), and as such, it is unrealistic to expect that SMM cross-bridges would remain attached and noncycling over that distance. Thus, weak binding of unphosphorylated SMM to actin is the likely explanation as to why the final v in both the phasic SMM-SkMM and tonic SMM-SkMM mixtures did not reach the level of SkMM. Indeed, early mixture assays demonstrated that unphosphorylated SMM imposes a small load on actin filaments propelled by SkMM, thereby reducing their velocity (Warshaw et al., 1990). Moreover, single-molecular-level measurements showed that both unphosphorylated tonic and phasic SMM bind to actin with ∼1/10 the amount of force generated by phosphorylated myosin (Léguillette et al., 2008), thereby explaining their similar effect in the in vitro motility mixture assays.
Injection of MLCP during in vitro motility assays performed with SkMM. (A and B) Gray lines: fmot (A) or v of actin movement (B) data collected from individual assays (SkMM = 125 μg/ml; n = 8); solid black lines: averaged data. MLCP was injected at time = 0 s. The parameter settings of the video analysis software used to measure fmot were the same as those used for the in vitro motility mixture assay (Table S1).
Injection of MLCP during in vitro motility assays performed with SkMM. (A and B) Gray lines: fmot (A) or v of actin movement (B) data collected from individual assays (SkMM = 125 μg/ml; n = 8); solid black lines: averaged data. MLCP was injected at time = 0 s. The parameter settings of the video analysis software used to measure fmot were the same as those used for the in vitro motility mixture assay (Table S1).
Additional remarks
A few additional points are worth noting, the first being that the SMM molecules used in this study were not pure (+)insert or (−)insert SMM heavy chain isoform preparations. Instead, myosin was purified from organs in which the SM exhibit mostly tonic or mostly phasic behaviors (Fig. S8). While these SMM preparations are representative of real physiological systems, it made the interpretation of our results more challenging at times. For example, while v at the beginning of the in vitro motility assay is lower for tonic SMM than phasic SMM (0.38 ± 0.02 vs. 0.57 ± 0.02 µm/s; P < 0.001; Table S2), this difference is lost once the SMM is mixed with SkMM in the in vitro motility mixture assay (1.11 ± 0.02 vs. 1.18 ± 0.03 µm/s; P = 0.13; Table S3). It is therefore remarkable that differences between phasic and tonic SMM for THold in the laser trap assay could still be observed, further supporting the robustness of these results.
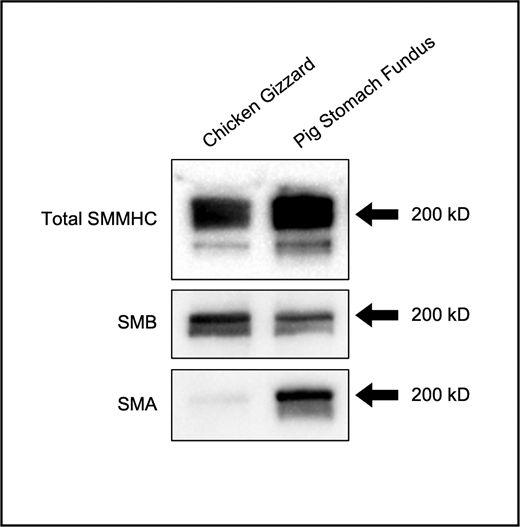
Western blot of SMM. Total SMM heavy chain (SMMHC), the (+)insert (SMB) isoform and the (−)insert (SMA) isoform content in purified phasic SMM (chicken gizzard) and tonic SMM (pig stomach fundus). Black arrows: 200-kD molecular weight. Source data are available for this figure: SourceData FS8.
Western blot of SMM. Total SMM heavy chain (SMMHC), the (+)insert (SMB) isoform and the (−)insert (SMA) isoform content in purified phasic SMM (chicken gizzard) and tonic SMM (pig stomach fundus). Black arrows: 200-kD molecular weight. Source data are available for this figure: SourceData FS8.
Another important point to consider is that the purification of tonic SMM is inherently more difficult to accomplish than that of phasic SMM because of its longer attachment time to actin. Thus, the initial fmot is lower for tonic SMM than phasic SMM in the in vitro motility assay (41.30 ± 2.01 vs. 79.13 ± 2.89%; P < 0.001; Table S2) due to the presence of some nonfunctional myosin molecules (deadheads). It is possible that, even with all the precautions taken (myosin spindown, assay preparation with washes of unlabeled G-actin), some of these deadheads bound in rigor to actin and possibly contributed to the reattachment of dephosphorylated myosin, as previously suggested (Somlyo et al., 1988). However, this is unlikely to have contributed much to the results of this study because the strong binding of deadheads to actin leads to actin filament breakage and poor motility, and this was not observed to any large extent.
Conclusions
Using a flow-through chamber that permits efficient diffusion of MLCP in the laser trap assay, we observed force maintenance during LC20 dephosphorylation of tonic SMM; LC20 deactivation was confirmed in a parallel in vitro motility assay performed in the same conditions. To our knowledge, this is the first report of force maintenance observed at the molecular level. These data support the longstanding dogma of strong bonds caused by dephosphorylated, noncycling cross-bridges. Furthermore, MLCP injection in an in vitro motility mixture assay performed with SMM and SkMM suggests that the maintenance of these strong bonds is possible only if no energy is provided by surrounding actively cycling myosin heads. Taken together, these data mark an important step toward elucidating the underlying mechanisms of the latch state.
Acknowledgments
Henk L. Granzier served as editor.
We thank Michael Alveis from Marvid Poultry, Montreal, Quebec, Canada for tissue donations, Nedjma Baya Zitouni for contributing to the phasic SMM purification, and Apolinary Sobieszek (Austrian Academy of Sciences, Vienna, Austria) for the purified MLCK, MLCP, and tonic SMM. We also thank Dr. Renaud Léguillette and Dr. Horia Nicolae Roman, who contributed to earlier versions of these assays toward the dream experiment.
The authors acknowledge funding from the Natural Sciences and Engineering Research Council of Canada (RGPIN-2015-05054 to A.M. Lauzon). The Meakins-Christie Laboratories (Research Institute of the McGill University Health Centre) are supported in part by a center grant from Le Fonds de la Recherche en Santé du Québec. M.J. Hammell was supported in part by a studentship from the Department of Biological and Biomedical Engineering, McGill University.
The authors declare no competing financial interests.
Author contributions: M.J. Hammell, G. IJpma, and A.M. Lauzon conceptualized and designed the experiments. L. Kachmar purified the phasic SMM and SkMM and prepared the actin, the gelsolin-coated microspheres, and the experiment stock buffers. Z. Balassy designed an early prototype of the assay chamber and designed and performed preliminary experiments. M.J. Hammell, Z. Balassy, and G. IJpma developed the data analysis software. M.J. Hammell performed the experiments, analyzed the data, prepared the figures and tables, and wrote the manuscript. M.J. Hammell, G. IJpma, and A.M. Lauzon developed data analysis strategies, interpreted the results of the experiments, and edited and revised the manuscript. All authors approved the final version of the manuscript.

