


Initiation of skeletal muscle contraction is triggered by rapid activation of RYR1 channels in response to sarcolemmal depolarization. RYR1 is intracellular and has no voltage-sensing structures, but it is coupled with the voltage-sensing apparatus of CaV1.1 channels to inherit voltage sensitivity. Using an opto-electrophysiological approach, we resolved the excitation-driven molecular events controlling both CaV1.1 and RYR1 activations, reported as fluorescence changes. We discovered that each of the four human CaV1.1 voltage-sensing domains (VSDs) exhibits unique biophysical properties: VSD-I time-dependent properties were similar to ionic current activation kinetics, suggesting a critical role of this voltage sensor in CaV1.1 activation; VSD-II, VSD-III, and VSD-IV displayed faster activation, compatible with kinetics of sarcoplasmic reticulum Ca2+ release. The prominent role of VSD-I in governing CaV1.1 activation was also confirmed using a naturally occurring, charge-neutralizing mutation in VSD-I (R174W). This mutation abolished CaV1.1 current at physiological membrane potentials by impairing VSD-I activation without affecting the other VSDs. Using a structurally relevant allosteric model of CaV activation, which accounted for both time- and voltage-dependent properties of CaV1.1, to predict VSD-pore coupling energies, we found that VSD-I contributed the most energy (~75 meV or ∼3 kT) toward the stabilization of the open states of the channel, with smaller (VSD-IV) or negligible (VSDs II and III) energetic contribution from the other voltage sensors (<25 meV or ∼1 kT). This study settles the longstanding question of how CaV1.1, a slowly activating channel, can trigger RYR1 rapid activation, and reveals a new mechanism for voltage-dependent activation in ion channels, whereby pore opening of human CaV1.1 channels is primarily driven by the activation of one voltage sensor, a mechanism distinct from that of all other voltage-gated channels.
Introduction
The contraction of skeletal muscles is initiated by a brief (3–5 ms) action potential that causes a depolarization of muscle fibers (Bannister, 2016; Shishmarev, 2020). This sudden change of the sarcolemma membrane potential is detected by CaV1.1 channel voltage-sensing domains (VSDs), which are compelled to move by the change in electric field. The ensuing structural rearrangements of the VSDs not only open the CaV1.1 pore (allowing Ca2+ to enter the cell) but also propagate to ryanodine receptor 1 (RYR1) channel, located intracellularly in the membrane of the SR. As a result, the RYR1 channel, which cannot directly “sense” an electrical excitation, acquires voltage dependence by physically coupling with a voltage-sensing protein (CaV1.1), such that sarcoplasmic Ca2+ release and muscle contraction become voltage-dependent (depolarization-driven) events (Rios and Brum, 1987; Ríos et al., 1992).
Seminal studies in the early 1970s recognized that an intramembrane “charge movement” was associated with, and necessary for, the skeletal muscle excitation–contraction (EC) coupling process (Schneider and Chandler, 1973; Hernández-Ochoa and Schneider, 2018). This charge movement is indeed the electrical manifestation of the voltage-dependent conformational changes of CaV1.1 voltage-sensing machinery composed of four VSDs (Fig. 1 A, gray trace). In this study, we sought to resolve the independent conformational rearrangements of the four CaV1.1 VSDs to answer a fundamental question in muscle physiology: how does the CaV1.1 channel voltage-sensing machinery govern two different events with very distinct voltage- and time-dependent properties, i.e., the slow opening of CaV1.1 pore and the fast activation of RYR1? In fact, CaV1.1 pore activation takes several tens of milliseconds to reach steady-state open probability (Fig. 1 A, red ionic current trace), while the kinetics of SR Ca2+ release through RYR1 is ∼25-fold faster than pore opening (Fig. 1 B, black trace). We postulated that the four homologous but not identical CaV1.1 VSDs possess different functional properties, enabling CaV1.1 to control both fast and slow molecular events.

Time course of the activation of CaV1.1 and R Y R1 channels. (A) Membrane current from CaV1.1 channels expressed in Xenopus oocytes displaying gating (gray) and ionic currents (red). (A and B) The rearrangement of CaV1.1 voltage sensors upon depolarization (gating currents, gray) activates two processes with very distinct kinetics: CaV1.1 ionic current (slow; red in A) and SR Ca2+ release (fast; in B) from dissociated mouse muscle fibers (flexor digitorum brevis) loaded with the Ca2+ dye OGB-5N. Recordings are shown on the same time scale to illustrate their drastically different kinetics.
Time course of the activation of CaV1.1 and R Y R1 channels. (A) Membrane current from CaV1.1 channels expressed in Xenopus oocytes displaying gating (gray) and ionic currents (red). (A and B) The rearrangement of CaV1.1 voltage sensors upon depolarization (gating currents, gray) activates two processes with very distinct kinetics: CaV1.1 ionic current (slow; red in A) and SR Ca2+ release (fast; in B) from dissociated mouse muscle fibers (flexor digitorum brevis) loaded with the Ca2+ dye OGB-5N. Recordings are shown on the same time scale to illustrate their drastically different kinetics.
Indeed, CaV channels are pseudo-tetramers composed of four concatenated repeats, each encompassing six transmembrane segments (S1–S6; Fig. S1 A): S1–S4 encode for the voltage sensors, while S5 and S6 from each repeat form the central pore (Dolphin, 2016; Hering et al., 2018; Catterall et al., 2020). Thus, a unique amino acid sequence pertains to each voltage sensor (Fig. S1 B), likely underpinning their distinct operation, as previously shown for the close relative CaV1.2 channel (Pantazis et al., 2014; Savalli et al., 2016) and for two NaV isoforms (Cha et al., 1999; Chanda and Bezanilla, 2002; Varga et al., 2015). Until recently, studies of CaV1.1 biophysical properties have been hampered by negligible expression level of this channel in heterologous systems. With the discovery of Stac3-mediated trafficking of CaV1.1 channels (Polster et al., 2015; Flucher and Campiglio, 2019), it is now possible to express these proteins at the plasma membrane both in HEK cells (Polster et al., 2015; Niu et al., 2018) and in Xenopus laevis oocytes (Wu et al., 2018). We used the voltage-clamp fluorometry (VCF) technique (Mannuzzu et al., 1996; Gandhi and Olcese, 2008) to resolve the depolarization-induced structural changes of the four CaV1.1 VSDs in a cellular environment. We found that each VSD of human CaV1.1 channels exhibits distinct biophysical properties. VSD-I time-dependent properties were strikingly similar to ionic current activation kinetics, while VSDs II–IV displayed faster activation, compatible with SR Ca2+-release kinetics, suggesting that VSD-I plays a major role in pore opening. The relevance of VSD-I to CaV1.1 activation was reinforced using a naturally occurring, charge-neutralizing mutation in VSD-I (R174W; Eltit et al., 2012), which ablates CaV1.1 current at physiological membrane potentials by stabilizing VSD-I resting state. Using a structurally relevant allosteric model of CaV activation, which accounted for both time- and voltage-dependent properties of CaV1.1, we quantified the energetic interactions of each VSD with pore opening. Overall, this study revealed a new mechanism for voltage sensing among the voltage-gated superfamily of ion channels, whereby the open state of the human CaV1.1 channel is mainly stabilized by one voltage sensor, leaving the other three VSDs available for other voltage-dependent tasks, such as RYR1 activation.

Topology of CaV1.1 channels, S4 segments sequence alignment, and voltage dependence of CaV1.1 channel opening for WT and Cys mutants. (A) The topology of the pore-forming α1S subunit of skeletal CaV1.1 channels is shown: four concatenated homologous but nonidentical repeats (I–IV) form the α1S subunit. Each repeat includes six transmembrane segments (S1–S6): S1–S4 make the VSD (colored cylinders), while S5 and S6 contribute to one quarter of the pore (gray cylinders). (B) A sequence alignment of the four S4 segments is based on the most recent structure of CaV1.1 channels (bold font corresponds to residues included in S4 helices; Protein Data Bank accession no. 6JP5; Zhao et al., 2019). Part of S3 and S4 loops are also reported to illustrate the location of the amino acids substituted into cysteines for fluorophore conjugation (pink, with a rhodamine molecule above them). Putative voltage-sensing, charged amino acids are in blue. (C) Mean voltage dependence of channel opening (G(V)) for WT and Cys mutants is shown (n = 3–7). G(V)s for WT channels have been measured from oocytes with (pink circle) or without (black circles) fluorophore labeling. G(V)s from Cys mutants are all from fluorophore-labeled channels. Note that fluorophore conjugation to the 13 endogenous extracellular cysteines (WT channels) did not modify channel activation. (D) Mean voltage dependence of gating charge (Q(V)) for WT and Cys mutants was calculated by integrating 10-ms gating current recordings. Lines in C and D are fits to single Boltzmann distributions (fitting parameters are reported in Tables 1 and 2, respectively). Note that Cys substitutions in the four VSDs did not perturb CaV1.1 voltage dependence of G(V) and Q(V).
Topology of CaV1.1 channels, S4 segments sequence alignment, and voltage dependence of CaV1.1 channel opening for WT and Cys mutants. (A) The topology of the pore-forming α1S subunit of skeletal CaV1.1 channels is shown: four concatenated homologous but nonidentical repeats (I–IV) form the α1S subunit. Each repeat includes six transmembrane segments (S1–S6): S1–S4 make the VSD (colored cylinders), while S5 and S6 contribute to one quarter of the pore (gray cylinders). (B) A sequence alignment of the four S4 segments is based on the most recent structure of CaV1.1 channels (bold font corresponds to residues included in S4 helices; Protein Data Bank accession no. 6JP5; Zhao et al., 2019). Part of S3 and S4 loops are also reported to illustrate the location of the amino acids substituted into cysteines for fluorophore conjugation (pink, with a rhodamine molecule above them). Putative voltage-sensing, charged amino acids are in blue. (C) Mean voltage dependence of channel opening (G(V)) for WT and Cys mutants is shown (n = 3–7). G(V)s for WT channels have been measured from oocytes with (pink circle) or without (black circles) fluorophore labeling. G(V)s from Cys mutants are all from fluorophore-labeled channels. Note that fluorophore conjugation to the 13 endogenous extracellular cysteines (WT channels) did not modify channel activation. (D) Mean voltage dependence of gating charge (Q(V)) for WT and Cys mutants was calculated by integrating 10-ms gating current recordings. Lines in C and D are fits to single Boltzmann distributions (fitting parameters are reported in Tables 1 and 2, respectively). Note that Cys substitutions in the four VSDs did not perturb CaV1.1 voltage dependence of G(V) and Q(V).
Materials and methods
Ca2+ release measurement
Enzymatically dissociated flexor digitorum brevis fibers from mice were loaded with the dye OGB-5N (250 µM) and voltage-clamped using the two-electrode voltage-clamp technique. The intracellular solution was (in mM) 75 aspartate, 5 ATP-Na2, 5 phospho-creatine di-Tris, 5 reduced glutathione, 5 MgCl2, 30 EGTA, 15 Ca(OH)2, 20 3-(N-morpholino)propanesulfonic acid, and 4 MOPS, pH 7.4 with KOH. The extracellular solution was (in mM) 150 TEA-Cl, 10 CsCl, 2 CaCl2, 1 MgCl2, and 10 MOPS, pH 7.4. Fluorescence was filtered at 2 kHz.
Xenopus oocytes isolation
A Xenopus frog is anesthetized by immersion in water containing 0.17% tricaine for ∼30 min. The anesthetized frog is euthanized by central nervous system pithing and laid supine on ice. Ovarian lobes are taken out and placed in sterile OR-2 solution (in mM: 82.5 NaCl, 2.5 KCl, 1 MgC12, and 5 HEPES, pH 7). After shredding the ovarian lobes, ∼5 ml shredded ovaries are incubated with 20 ml of fresh collagenase type-I solution (207 U/ml dissolved in OR-2) in a 50-ml centrifuge tube. The tube is secured horizontally to an orbital shaker and shaken vigorously for 10–20 min to enzymatically and mechanically defolliculate oocytes. After rinsing five or six times with OR-2 to remove the collagenase, oocytes are incubated with a 1:4 SOS:OR-2 solution to gradually increase Ca2+ and osmolarity (SOS in mM: 100 NaCl, 2 KCl, 1.8 CaCl2, 1 MgC12, and 5 HEPES, pH 7, with 100 U/ml penicillin, 100 µg/ml streptomycin, and 50 µg/ml gentamicin). After removing damaged and undeveloped oocytes, mature cells are incubated at 18°C for 2 h. Oocytes are then incubated with a 1:2 SOS:OR-2 solution for 30 min and finally transferred in pure SOS solution for use.
Molecular biology
The human α1S subunits (GenBank accession no. BC133671) of skeletal CaV1.1 channels, with a Cys substituted at the extracellular flank of the S4 helix of each VSD (L159C, M519C, V893C, or S1231C for VSDs I–IV, respectively; Fig. S1 B), was coexpressed with mouse Stac3 (UniProt accession no. Q8BZ71) and rabbit β1a (UniProt accession no. P19517) in Xenopus oocytes. Single-point mutations were generated using the QuikChange Site-Directed Mutagenesis Kit (Agilent Technologies) and confirmed by sequencing. The coding RNA of the different subunits was transcribed in vitro (AmpliCap-Max T7 High Yield Message Maker Kit; CellScript) and injected into stage VI Xenopus oocytes (50 nl at 0.1–0.5 µg/µl) using a Drummond nano-injector.
VCF
4–5 d after injection, oocytes were incubated with thiol-reactive fluorophores sensitive to environmental changes (10 µM tetramethylrhodamine-6-maleimide [TMRM-6′] for VSD-I or 20 µM MTS-5(6)-carboxytetramethylrhodamine [MTS-TAMRA] for VSDs II, III, or IV) in a depolarizing solution (in mM: 120 K-methanesulfonate [MES], 2 Ba(MES)2, and 10 HEPES, pH 7.0) for 5–20 min on ice. Subsequently, oocytes were voltage-clamped using the cut-open oocyte technique implemented for epifluorescence measurements (Stefani and Bezanilla, 1998; Pantazis and Olcese, 2013). Fluorescence changes and ionic currents were acquired simultaneously from the same membrane area (Gandhi and Olcese, 2008). The extracellular solution for ionic current recordings was (in mM) 2 Ba(MES)2, 120 NaMES, and 10 HEPES, pH 7.0. To isolate gating currents, the extracellular solution was supplemented with (in mM) 0.5 CdCl2, 0.1 LaCl3, and 0.1 ouabain to block CaV1.1 ionic currents and the Na+/K+ pump, respectively. Intracellular solution contained (in mM) 120 K-glutamate and 10 HEPES, pH 7.0. Pipette solution was (in mM) 2,700 Na-MES, 10 NaCl, and 10 Na-HEPES, pH 7.0. Prior to experiments, oocytes were injected with 100 nl of 80 mM BAPTA•4K, pH 7.0, to prevent activation of endogenous Ca2+- and Ba2+-dependent Cl− channels (Barish, 1983). Holding potential was −90 mV. Ionic current and fluorescence were filtered at 1/5 of the sampling frequency (typically 1–5 kHz).
Data analysis
The voltage dependence of ionic conductance (G(V), estimated from the peaks of the tail currents), gating charge (Q(V)), and fluorescence changes (F(V)) was characterized by fitting the data points to one Boltzmann function as F(V) = {[fmax − fmin] / [1 + exp(z · (Vm − Vhalf)(F/RT))]} + fmin, where fmax and fmin are the maximum and minimum values of the function, respectively; z is the effective valence; Vhalf is the half-activation potential; Vm is the membrane potential; T the absolute temperature; and F and R are the Faraday and Gas constants, respectively. For G(V) datasets, fmin was 0. F(V) curves were calculated at steady-state (200-ms pulses; Fig. 3 C). The F(V) curves used to compute their weighed sum were constructed from the fluorescence recording at 10 ms, which is the time of gating current integration used to construct Q(V) curves (Fig. 4 C and Fig. S1 D). Ionic current and fluorescence kinetics were fit to one or two exponential function(s). Fittings were performed by least squares using Microsoft Excel. Data are presented as mean ± SEM.
Allosteric model of CaV activation and statistical analysis
CaV1.1 kinetics and steady-state data were described by an allosteric model of five particles: four nonidentical voltage sensors (with voltage-dependent equilibria J1...J4), coupled to a central pore that was allowed to be intrinsically voltage-dependent (equilibrium L; Fig. 6), as previously described (Pantazis et al., 2014; Savalli et al., 2016). VSDs and the pore interact with each other via coupling energies (W1...W4).
Online supplemental material
Fig. S1 shows topology of CaV1.1 channels, S4 segments sequence alignment, and voltage dependence of CaV1.1 channel opening for WT and Cys mutants. Fig. S2 shows that the VSD-I time course of activation follows ionic current kinetics. Fig. S3 shows that the R174W mutation disfavors CaV1.1 channel activation. Fig. S4 shows optically tracked voltage-dependent rearrangements of the individual VSD in human CaV1.1 R174W mutant. Fig. S5 shows the model prediction of each VSD contribution to pore opening. Table S1 shows fitting parameters and confidence intervals (CIs) for the allosteric model predictions. The parameters that have changed in the presence of the R174W mutation are in bold.
Results
Depolarization-driven structural rearrangements of each VSD in the human CaV1.1 channel exhibit distinct time- and voltage-dependent properties
To understand how CaV1.1 voltage-sensing machinery can control both the CaV1.1 pore itself and the RYR1-induced Ca2+ release, we optically tracked the structural rearrangements of each of the four VSDs of this CaV channel (Fig. 2 A), using the VCF technique, a hybrid electrophysiological–optical approach (see VCF; Mannuzzu et al., 1996; Gandhi and Olcese, 2008; Pantazis and Olcese, 2013). We engineered each VSD of the human pore-forming α1S subunit for site-directed fluorescent labeling by substituting amino acids at strategic positions in the extracellular end of the S4 helix with a cysteine suitable for labeling with thiol-reactive fluorophores (Fig. S1 B; see Molecular biology for Cys positions). Among the four helices forming each VSD, S4 segments carry a signature motif of positively charged residues able to sense changes of membrane potential and rearrange in response to this electrical stimulus (Catterall, 2010; Wu et al., 2016). The Cys constructs chosen for this study did not perturb channel function: the voltage dependence of channel activation (G(V)) and of Q(V) of Cys mutant channels appeared identical to that of WT channels (Fig. S1, C and D; Table 1; and Table 2).

WT CaV1.1 does not elicit voltage-dependent fluorescence change when labeled with a thiol-reactive fluorophore. (A) Top view of a cryo-EM structure of the pore-forming α1S subunit of CaV1.1 channels (Protein Data Bank accession no. 5GJV; Wu et al., 2016), illustrating four VSDs that surround and control the central pore. (B) Simultaneously recorded Ba2+ currents (black) and fluorescence signals (gray traces) at the indicated membrane potentials from human CaV1.1 channels (α1S+β1a+Stac3) without an engineered Cys, expressed in Xenopus oocytes and labeled with thiol-reactive fluorophores, are shown.
WT CaV1.1 does not elicit voltage-dependent fluorescence change when labeled with a thiol-reactive fluorophore. (A) Top view of a cryo-EM structure of the pore-forming α1S subunit of CaV1.1 channels (Protein Data Bank accession no. 5GJV; Wu et al., 2016), illustrating four VSDs that surround and control the central pore. (B) Simultaneously recorded Ba2+ currents (black) and fluorescence signals (gray traces) at the indicated membrane potentials from human CaV1.1 channels (α1S+β1a+Stac3) without an engineered Cys, expressed in Xenopus oocytes and labeled with thiol-reactive fluorophores, are shown.
Fitting parameters for the Boltzmann functions fitting the voltage dependence of CaV1.1 activation data (curves in Fig. S1 C and Fig. 5 A)
| Parameter | Mean ± SEM | |
|---|---|---|
| G(V) WT no fluorophore | z (e0) | 2.0 ± 0.04 (n = 7) |
| Vhalf (mV) | 31 ± 1.1 | |
| G(V) WT with TAMRA | z (e0) | 2.0 ± 0.02 (n = 3) |
| Vhalf (mV) | 30 ± 1.3 | |
| G(V) L159C (VSD-I) with TMRM | z (e0) | 1.9 ± 0.02 (n = 6) |
| Vhalf (mV) | 29 ± 1.1 | |
| G(V) M519C (VSD-II) with TAMRA | z (e0) | 2.0 ± 0.05 (n = 7) |
| Vhalf (mV) | 28 ± 0.6 | |
| G(V) V893C (VSD-III) with TAMRA | z (e0) | 2.1 ± 0.07 (n = 5) |
| Vhalf (mV) | 31 ± 1.9 | |
| G(V) S1231C (VSD-IV) with TAMRA | z (e0) | 1.8 ± 0.03 (n = 6) |
| Vhalf (mV) | 32 ± 1.1 | |
| G(V) R174W no fluorophore | z (e0) | 1.8 ± 0.06 (n = 3) |
| Vhalf (mV) | 64 ± 0.6 |
Fitting parameters for the Boltzmann functions fitting the voltage dependence of CaV1.1 gating charge data (curves in Fig. S1 D)
| Parameter | Mean ± SEM | |
|---|---|---|
| Q(V) WT | z (e0) | 1.1 ± 0.03 (n = 5) |
| Vhalf (mV) | −1.4 ± 0.9 | |
| Q(V) L159C (VSD-I) | z (e0) | 1.1 ± 0.03 (n = 3) |
| Vhalf (mV) | −1.3 ± 1.5 | |
| Q(V) M519C (VSD-II) | z (e0) | 1.1 ± 0.03 (n = 3) |
| Vhalf (mV) | −3.5 ± 0.8 | |
| Q(V) V893C (VSD-III) | z (e0) | 1.0 ± 0.01 (n = 4) |
| Vhalf (mV) | −1.1 ± 1.2 | |
| Q(V) S1231C (VSD-IV) | z (e0) | 1.1 ± 0.03 (n = 4) |
| Vhalf (mV) | −1.4 ± 1.4 |
We expressed human CaV1.1 channels in Xenopus oocytes (Wu et al., 2018). Oocytes were voltage-clamped using the cut-open oocyte Vaseline gap technique (Stefani and Bezanilla, 1998; Pantazis and Olcese, 2013): we simultaneously recorded membrane current and fluorescence emission from channels labeled with thiol-reactive fluorophores, used as optical reporters of VSD structural rearrangements. Voltage-dependent fluorescence signals were not detected in CaV1.1 WT channels (no engineered cysteines but 13 endogenous extracellular cysteines are present; Fig. 2 B). Also, fluorescent labeling of endogenous cysteines had no effect on the voltage dependence of channel activation (Fig. S1 C). Notably, when engineered Cys were fluorescently labeled one at the time, we resolved distinct voltage-dependent conformational changes of each CaV1.1 voltage sensor (Fig. 3 A). Fluorescence signals from VSD-I and VSD-III decreased upon depolarization, implying that fluorophores conjugated to these VSDs experienced a more quenching environment in their active state, while fluorophores conjugated to VSD-II and VSD-IV were brighter during depolarization. Overall, these results support the premise that fluorescence changes from channels with introduced Cys report VSD-specific structural rearrangements.

Depolarization-driven structural rearrangements of each VSD in the human CaV1.1 channel exhibit distinct time- and voltage-dependent properties. (A) Simultaneously recorded Ba2+ currents (black) and fluorescence signals (colored traces) reporting local protein structural changes at the indicated membrane potentials from human CaV1.1 channels (α1S+β1a+Stac3) expressed in Xenopus oocytes and labeled with thiol-reactive fluorophores are shown. Fluorophore conjugated at the extracellular flank of S4 helices of each VSD reported time- and voltage-dependent structural rearrangements upon depolarization. (B) Ionic current (black) elicited by 20 mV depolarization is shown superimposed to the fluorescence traces from each VSD (holding potential was −90 mV). Note that only VSD-I fluorescence signal exhibited kinetics compatible with pore opening (see also Fig. S2). (C) Mean voltage dependence of VSD activation constructed at 200 ms from experiments as in A. Lines represents fits to single Boltzmann distributions (SEM bars are within the symbols, when not visible; n = 5–7). Note that each VSD exhibited distinct voltage-dependent properties. Table 3 reports fitting parameters of Boltzmann functions describing these F(V) curves.
Depolarization-driven structural rearrangements of each VSD in the human CaV1.1 channel exhibit distinct time- and voltage-dependent properties. (A) Simultaneously recorded Ba2+ currents (black) and fluorescence signals (colored traces) reporting local protein structural changes at the indicated membrane potentials from human CaV1.1 channels (α1S+β1a+Stac3) expressed in Xenopus oocytes and labeled with thiol-reactive fluorophores are shown. Fluorophore conjugated at the extracellular flank of S4 helices of each VSD reported time- and voltage-dependent structural rearrangements upon depolarization. (B) Ionic current (black) elicited by 20 mV depolarization is shown superimposed to the fluorescence traces from each VSD (holding potential was −90 mV). Note that only VSD-I fluorescence signal exhibited kinetics compatible with pore opening (see also Fig. S2). (C) Mean voltage dependence of VSD activation constructed at 200 ms from experiments as in A. Lines represents fits to single Boltzmann distributions (SEM bars are within the symbols, when not visible; n = 5–7). Note that each VSD exhibited distinct voltage-dependent properties. Table 3 reports fitting parameters of Boltzmann functions describing these F(V) curves.
Each voltage sensor exhibited distinct kinetic properties that could be well-described by the sum of two exponential functions: VSD-I time-dependent properties were overall similar to ionic current activation kinetics, while VSDs II–IV displayed a faster activation component, compatible with SR Ca2+ release kinetics (Fig. 3 B and Fig. S2). Nevertheless, all VSDs exhibited a slow kinetic component of τ ≈ 100 ms (Fig. S2 A), which is prevalent in VSD-I and less represented in VSD-II, VSD-III, and VSD-IV (Fig. S2 B). Thus, using VCF, we demonstrated the existence of fast- and slow-activating CaV1.1 VSDs by directly measuring their activation kinetics, a result that confirms the predictions of Feldmeyer et al. (1990) based on ionic current recordings and those of the Flucher laboratory (Fernández-Quintero et al., 2021) based on molecular dynamics simulations, which estimated slow and fast activation kinetics for VSD-I and VSD-IV, respectively.

VSD-I time course of activation follows ionic current kinetics. (A and B) The activation kinetics of ionic current (black symbols) and of each VSD (colored symbols) were well described by the sum of two exponential functions (τfast, empty symbols; τslow, filled symbols). In the plots, fast and slow time constants (A) and their relative amplitudes (B) are compared for each individual VSD with those of the ionic current. Note that all domains share with the pore a kinetic component with τslow ∼100 ms. However, only VSD-I exhibits a fast component compatible with that of the ionic current; the other VSDs display a τfast approximately fivefold faster, likely more suitable for RYR1 activation.
VSD-I time course of activation follows ionic current kinetics. (A and B) The activation kinetics of ionic current (black symbols) and of each VSD (colored symbols) were well described by the sum of two exponential functions (τfast, empty symbols; τslow, filled symbols). In the plots, fast and slow time constants (A) and their relative amplitudes (B) are compared for each individual VSD with those of the ionic current. Note that all domains share with the pore a kinetic component with τslow ∼100 ms. However, only VSD-I exhibits a fast component compatible with that of the ionic current; the other VSDs display a τfast approximately fivefold faster, likely more suitable for RYR1 activation.
The voltage dependence of activation for each CaV1.1 VSD (from experiments as in Fig. 3 A) was inferred by plotting the change in fluorescence intensity (ΔF) at 200 ms against the corresponding membrane potentials ((F(V) curve, Fig. 3 C): each VSD of human CaV1.1 channels exhibited distinct voltage-dependent activation curves, all preceding the G(V) curve (voltage dependence of channel opening) on the voltage axis (Fig. 4): VSD-I was the most sensitive to changes in membrane potential (effective valence z = 3.1 ± 0.05 e0, n = 6), while VSD-IV was the least (z = 0.68 ± 0.01 e0, n = 6). Moreover, the half-activation potential (Vhalf) of the four F(V) curves spanned a range of ∼40 mV along the membrane potential axis: VSD-I was the most depolarized (Vhalf = 4.2 ± 0.8 mV, n = 6), followed by VSD-II, -III, and -IV (Fig. 3 C and Table 3).

Charge movement and fluorescence signals arise from the same conformational changes. (A and B) Gating current and fluorescence recordings are shown in the same time scale (enlarged view in B). Note that VSD-I barely activates during the time course of gating current measurements (10 ms). (C) Mean voltage dependence of charge movement (Q(V)), channel activation (G(V)), and individual VSD activations (F(V)) are shown. For clarity, only Boltzmann distributions describing G(V) and F(V) datasets are plotted (data points were already presented in Fig. S1 C and Fig. 3 C, respectively). The sum of F(V) curves weighed by their respective valence (pink diamonds) resembles the voltage dependence of the mean Q(V) curve (black circles; SEM bars are within the symbols, when not visible, n = 5).
Charge movement and fluorescence signals arise from the same conformational changes. (A and B) Gating current and fluorescence recordings are shown in the same time scale (enlarged view in B). Note that VSD-I barely activates during the time course of gating current measurements (10 ms). (C) Mean voltage dependence of charge movement (Q(V)), channel activation (G(V)), and individual VSD activations (F(V)) are shown. For clarity, only Boltzmann distributions describing G(V) and F(V) datasets are plotted (data points were already presented in Fig. S1 C and Fig. 3 C, respectively). The sum of F(V) curves weighed by their respective valence (pink diamonds) resembles the voltage dependence of the mean Q(V) curve (black circles; SEM bars are within the symbols, when not visible, n = 5).
Fitting parameters for the Boltzmann functions fitting the voltage dependence of each VSD structural changes (curves in Figs. 3 and 5)
| Parameter | WT (mean ± SEM) | R174W (mean ± SEM) | |
|---|---|---|---|
| F(V) L159C (VSD-I) | z (e0) | 3.1 ± 0.05 (n = 6) | 1.8 ± 0.06 (n = 5) |
| Vhalf (mV) | 4.2 ± 0.8 | 35 ± 1.1 | |
| F(V) M519C (VSD-II) | z (e0) | 1.6 ± 0.06 (n = 7) | 1.3 ± 0.08 (n = 4) |
| Vhalf (mV) | 4.6 ± 1.1 | 4.2 ± 1.9 | |
| F(V) V893C (VSD-III) | z (e0) | 1.4 ± 0.03 (n = 5) | 1.5 ± 0.1 (n = 4) |
| Vhalf (mV) | −27 ± 1.1 | −28 ± 0.7 | |
| F(V) S1231C (VSD-IV) | z (e0) | 0.7 ± 0.01 (n = 6) | 0.6 ± 0.02 (n = 3) |
| Vhalf (mV) | −38 ± 1.3 | −36 ± 1.5 |
These results reveal the striking functional diversity of the four VSDs in human CaV1.1 channels in terms of time and voltage dependence, possibly underlying distinct physiological roles.
Charge movement and fluorescence signals arise from the same conformational changes
Before VCF was developed, gating current recordings represented the gold standard measurement to extrapolate information about the properties of voltage sensors (Bezanilla and Stefani, 1998). However, gating currents are ensemble composite signals generated by the movement of the four charged voltage sensors, and thus the computed voltage dependence of the charge movement (Q(V) curve) blends together information from all four heterologous VSDs. The Q(V) curve of human CaV1.1 channels falls within the voltage range of the four F(V) curves describing the voltage dependence of each distinct VSD (Fig. 4). As charge movement (Q(V)) and fluorescence signals (F(V)s) are expected to arise from the same voltage-dependent conformational rearrangements, a reasonable prediction is that the sum of four F(V) curves weighed by their respective effective valence (z) would approximate the Q(V) curve. For this purpose, the four F(V) curves were constructed from the amplitude of fluorescence signals after 10-ms depolarizations, which is the time of gating current integration to construct Q(V) curves. The result of this operation is reported in Fig. 4 C, which shows that Q(V) and F(V) weighed sum have practically identical voltage dependence: in other words, VCF allowed decomposition of the Q(V) curve into its four components, providing previously unattainable information.
A naturally occurring, charge-neutralizing mutation (R174W) impairs VSD-I activation and voltage-dependent channel opening
The relevance of VSD-I to CaV1.1 activation, highlighted by the compatible kinetics (Fig. 3 B and Fig. S2), was confirmed by introducing a naturally occurring mutation that neutralizes the innermost charge of VSD-I S4 helix (R174W) and that has been linked to a skeletal muscle disorder called malignant hyperthermia (MH; Eltit et al., 2012; Bannister and Beam, 2013b). We expressed either WT or mutant CaV1.1 channels in Xenopus oocytes and measured ionic currents (Fig. S3). The activation voltage dependence of R174W channels shifted to more depolarized membrane potentials by ∼35 mV as compared with WT channels, impairing Ca2+ influx at physiological membrane potentials (Fig. 5 A). To gain a mechanistic understanding of how R174W impairs CaV1.1 pore activation, we optically tracked the movement of VSD-I using the VCF technique (Fig. S4 A). We found that the MH-linked mutation caused a ∼30 mV rightward-shift of VSD-I voltage-dependent activation and reduced the sensitivity to changes in membrane potentials (effective charge, z; Fig. 5 B and Table 3). These results demonstrate that R174 is indeed a voltage-sensing charge and further support the role of VSD-I as the main driver of pore opening.

The R174W mutation disfavors CaV1.1 channel activation. (A and B) Ba2+ currents from Xenopus oocytes expressing human CaV1.1 WT (A) or R174W (B) channels are shown. Holding potential was −90 mV. Membrane potentials steps are 10 mV apart.
The R174W mutation disfavors CaV1.1 channel activation. (A and B) Ba2+ currents from Xenopus oocytes expressing human CaV1.1 WT (A) or R174W (B) channels are shown. Holding potential was −90 mV. Membrane potentials steps are 10 mV apart.

A naturally occurring, charge-neutralizing mutation (R174W) impairs VSD-I activation and voltage-dependent channel opening, leaving VSDs II, III, and IV unaffected. (A) Voltage dependence of pore opening, as measured by normalized Ba2+ current tails for WT or R174W channels. Lines are fits to single Boltzmann distributions. Note that the R174W mutation caused a rightward-shift of the current voltage dependence G(V). (B) Mean voltage dependence of VSD activation constructed from experiments as in Fig. S4. Lines are fits to single Boltzmann distributions. Note that the R174W mutation impaired VSD-I activation, as revealed by a more depolarized voltage dependence, leaving VSDs II, III, and IV unaffected. Tables 1 and 3 report fitting parameters of Boltzmann functions describing G(V) and F(V) curves for R174W CaV1.1 channels, respectively.
A naturally occurring, charge-neutralizing mutation (R174W) impairs VSD-I activation and voltage-dependent channel opening, leaving VSDs II, III, and IV unaffected. (A) Voltage dependence of pore opening, as measured by normalized Ba2+ current tails for WT or R174W channels. Lines are fits to single Boltzmann distributions. Note that the R174W mutation caused a rightward-shift of the current voltage dependence G(V). (B) Mean voltage dependence of VSD activation constructed from experiments as in Fig. S4. Lines are fits to single Boltzmann distributions. Note that the R174W mutation impaired VSD-I activation, as revealed by a more depolarized voltage dependence, leaving VSDs II, III, and IV unaffected. Tables 1 and 3 report fitting parameters of Boltzmann functions describing G(V) and F(V) curves for R174W CaV1.1 channels, respectively.

Optically tracked voltage-dependent rearrangements of the individual VSD in human CaV1.1 R174W mutant. (A–D) Simultaneously recorded Ba2+ currents (black) and fluorescence signals reporting local protein structural changes (colored traces) from human R174W CaV1.1 channels (α1S+β1a+Stac3) expressed in Xenopus oocytes are shown. The topology above the recorded traces highlights the position of the R174W mutation (innermost gating charge of S4 in VSD-I; yellow star) and the location of the conjugated thiol-reactive fluorophore (pink rhodamine molecule). Note that, for VSD-I (A), larger depolarizations are needed to achieve voltage sensor activation as compared with WT VSD-I (Fig. S4 A versus Fig. 3 A, blue traces), since the neutralization of one of its gating charges (R174W) impaired its voltage-dependent activation (Fig. 5 B). Note that the current scale in A is 10-fold bigger than in B, C, and D.
Optically tracked voltage-dependent rearrangements of the individual VSD in human CaV1.1 R174W mutant. (A–D) Simultaneously recorded Ba2+ currents (black) and fluorescence signals reporting local protein structural changes (colored traces) from human R174W CaV1.1 channels (α1S+β1a+Stac3) expressed in Xenopus oocytes are shown. The topology above the recorded traces highlights the position of the R174W mutation (innermost gating charge of S4 in VSD-I; yellow star) and the location of the conjugated thiol-reactive fluorophore (pink rhodamine molecule). Note that, for VSD-I (A), larger depolarizations are needed to achieve voltage sensor activation as compared with WT VSD-I (Fig. S4 A versus Fig. 3 A, blue traces), since the neutralization of one of its gating charges (R174W) impaired its voltage-dependent activation (Fig. 5 B). Note that the current scale in A is 10-fold bigger than in B, C, and D.
VSD-I contributes the most energy to stabilizing WT CaV1.1 open states
To quantify the energetic contribution of the individual CaV1.1 VSDs to channel opening, we used a structurally relevant, allosteric model of CaV activation, previously developed for CaV1.2 channels (Pantazis et al., 2014; Savalli et al., 2016).
This model accounts for both time- and voltage-dependent properties of CaV channels and comprises five two-state gating particles, resulting in 25 = 32 possible states (16 closed states and 16 open states): a pore, which can exist either in the open or closed state, and four voltage sensors, each transitioning between resting and active states (Fig. 6; Pantazis et al., 2014; Savalli et al., 2016). The voltage-dependent equilibrium of each particle was characterized by Vi, the voltage at which they are equally distributed among the two states, and qi, the apparent number of elementary charges displaced during activation (see Allosteric model of CaV... for further details). This allosteric model has no a priori assumptions, i.e., the channel can potentially open from any of the 16 closed states. The activation of each VSD contributes some energy (Wi) to the stabilization of the open state of the pore. We performed a global simultaneous fit of ionic currents and fluorescence changes (which report the movements of each VSD) at four different membrane potentials together with their corresponding steady-state curves G(V) and F(V)s (voltage dependence of activation of the pore and VSDs, respectively) for WT and R174W channels. As shown in Fig. 7, we found a parameter set that faithfully reproduced the experimental data obtained with WT as well as R174W CaV1.1 channels simultaneously; only parameters pertaining to VSD-I were allowed to differ between WT and mutant channels (Table S1). This solution was found by Markov chain Monte Carlo sampling with 5 ∙ 106 samples in three replicas that also tested for uniqueness and provided CIs for all parameters (Fig. 7 and Table S1).

Scheme of a structurally relevant, allosteric model of CaV activation, accounting for both time- and voltage-dependent properties of VSD activation and pore opening. See Pantazis et al. (2014), Savalli et al. (2016), and Allosteric model of CaV... Briefly, each VSD and the pore (equilibrium constant J and L) are modeled as two-state particles, undergoing resting (R)–active (A), or closed (C)–open (O), voltage-dependent transitions, respectively. VSD activation allosterically stabilizes the pore open state by coupling energy W.
Scheme of a structurally relevant, allosteric model of CaV activation, accounting for both time- and voltage-dependent properties of VSD activation and pore opening. See Pantazis et al. (2014), Savalli et al. (2016), and Allosteric model of CaV... Briefly, each VSD and the pore (equilibrium constant J and L) are modeled as two-state particles, undergoing resting (R)–active (A), or closed (C)–open (O), voltage-dependent transitions, respectively. VSD activation allosterically stabilizes the pore open state by coupling energy W.
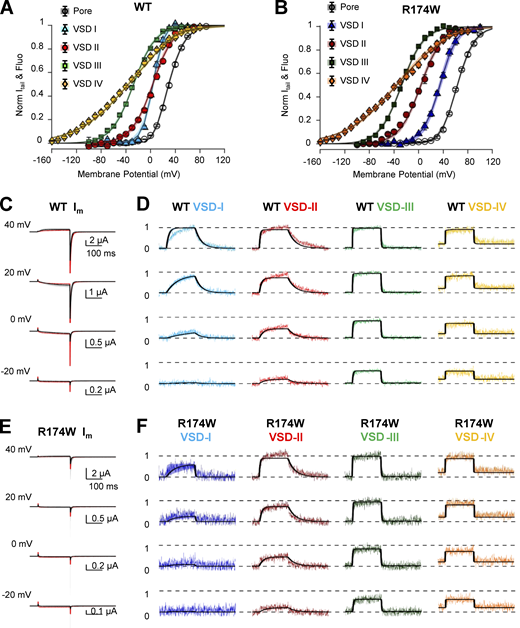
VSD-I is the main contributor to CaV1.1 pore opening. A CaV allosteric model (scheme in Fig. 6) was used to simultaneously fit steady-state and kinetics data in both WT and R174W channels. An error function was minimized using a Markov chain Monte Carlo sampling as in Savalli et al. (2016). Only parameters characterizing VSD-I activity could vary independently for WT and R174W channels. (A and B) Experimental G(V) and F(V) data points are shown superimposed to the model predictions (black lines) for WT (A) and R174W (B) channels. (C–F) Ionic currents (C and E) and fluorescence traces (D and F) from each VSD (normalized to the steady-state probability of activation) in both WT (C and D) and R174W (E and F) channels are shown superimposed with model predictions (black lines, best solutions out of 1.5 ∙ 106 trials from three replicas). Shaded areas depict all solutions within the 95% CI. Solution uniqueness and CIs are described in Fig. 8 and Table S1.
VSD-I is the main contributor to CaV1.1 pore opening. A CaV allosteric model (scheme in Fig. 6) was used to simultaneously fit steady-state and kinetics data in both WT and R174W channels. An error function was minimized using a Markov chain Monte Carlo sampling as in Savalli et al. (2016). Only parameters characterizing VSD-I activity could vary independently for WT and R174W channels. (A and B) Experimental G(V) and F(V) data points are shown superimposed to the model predictions (black lines) for WT (A) and R174W (B) channels. (C–F) Ionic currents (C and E) and fluorescence traces (D and F) from each VSD (normalized to the steady-state probability of activation) in both WT (C and D) and R174W (E and F) channels are shown superimposed with model predictions (black lines, best solutions out of 1.5 ∙ 106 trials from three replicas). Shaded areas depict all solutions within the 95% CI. Solution uniqueness and CIs are described in Fig. 8 and Table S1.
This analysis revealed that VSD-I contributes the most energy to stabilizing the open state in WT channels (−99 < W1WT < −71 meV; 95% CI; Table S1). The other three VSDs were predicted to have a smaller or negligible contribution (Wi > −21 meV), as illustrated in Fig. S5, which compares the impact of each VSD on the facilitation of voltage dependence of activation (i.e., leftward shift of G(V) curve with respect to the intrinsic voltage dependence of the pore). These plots show that the largest contribution is conferred by VSD-I (Fig. S5 A), with a smaller role of VSD-IV (Fig. S5 D) and negligible influence of VSD-II and VSD-III (Fig. S5, B and C).

Model prediction of each VSD contribution to pore opening. The intrinsic voltage dependence of the pore is extremely rightward-shifted (no VSDs coupled; gray curves). The activation of each voltage sensor provides an energetic contribution to the stabilization of the open state of the channel, resulting in an overall facilitation of channel opening (leftward shift of the G(V); dotted colored lines). Please note that VSD-I activation caused the largest leftward shift of the G(V) (A; blue dotted line), with a smaller contribution of VSD-IV (D; orange dotted line) and negligible roles of VSD-II (B) and VSD-III (C).
Model prediction of each VSD contribution to pore opening. The intrinsic voltage dependence of the pore is extremely rightward-shifted (no VSDs coupled; gray curves). The activation of each voltage sensor provides an energetic contribution to the stabilization of the open state of the channel, resulting in an overall facilitation of channel opening (leftward shift of the G(V); dotted colored lines). Please note that VSD-I activation caused the largest leftward shift of the G(V) (A; blue dotted line), with a smaller contribution of VSD-IV (D; orange dotted line) and negligible roles of VSD-II (B) and VSD-III (C).
Sampling the parameters space by Markov chain Monte Carlo as in Savalli et al. (2016) yields the probabilities distributions for the parameters describing the data according to the allosteric model. These distributions, depicted as violin plots in Fig. 8, indicate that the likelihood that VSD-II, VSD-III, or VSD-IV contribute to pore opening >1 kT (i.e., Wi < −25 meV) is <0.00075, <0.03, and <0.15, respectively.
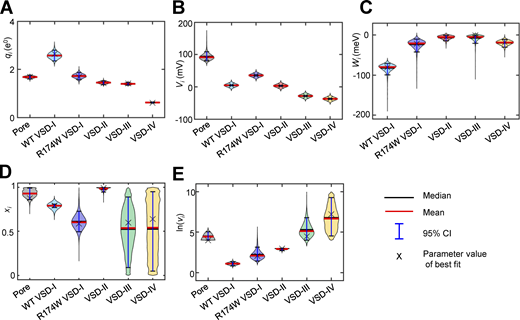
Violin plots describing the estimated probability distributions of parameters.(A–E)qi (A), Vi (B), Wi (C), xi (D), and ln(νi) (E). The best fit solution (X) exhibits the smallest error out of 1.5 ⋅ 106 samples distributed in three replicas and corresponds to the model predictions presented in Fig. 7 (black lines). The mean and median of each parameter are shown as red and black horizontal lines, respectively. The vertical blue line indicates the 95% CI for each parameter. The shaded areas depict the posterior probability density function for each parameter obtained by the Markov chain Monte Carlo sampling smoothed by a kernel density estimator (Hoffmann, 2021). The computational model yielded a highly constrained set of parameters describing simultaneously datasets from both WT and R174W mutants (Table S1). Note that, since VSD-III and VSD-IV activation kinetics are extremely fast, the actual relative position in the electric field of the transitions energy barrier (x3 and x4) has little influence on the goodness of fit, as illustrated by the vertical spreading of these parameter distributions (D).
Violin plots describing the estimated probability distributions of parameters.(A–E)qi (A), Vi (B), Wi (C), xi (D), and ln(νi) (E). The best fit solution (X) exhibits the smallest error out of 1.5 ⋅ 106 samples distributed in three replicas and corresponds to the model predictions presented in Fig. 7 (black lines). The mean and median of each parameter are shown as red and black horizontal lines, respectively. The vertical blue line indicates the 95% CI for each parameter. The shaded areas depict the posterior probability density function for each parameter obtained by the Markov chain Monte Carlo sampling smoothed by a kernel density estimator (Hoffmann, 2021). The computational model yielded a highly constrained set of parameters describing simultaneously datasets from both WT and R174W mutants (Table S1). Note that, since VSD-III and VSD-IV activation kinetics are extremely fast, the actual relative position in the electric field of the transitions energy barrier (x3 and x4) has little influence on the goodness of fit, as illustrated by the vertical spreading of these parameter distributions (D).
Analyzing VCF data with an allosteric model for CaV activation, we also found that a single charge-neutralizing mutation in VSD-I not only made this sensor reluctant to activate but also drastically decreased the energetic coupling between VSD-I and the pore (−42 < W1R174W < −10 meV; 95% CI; Table S1). In other words, in R174W channels, when VSD-I activates, its contribution to the stabilization of the open configuration of the channel is weaker, resulting in reduced Ca2+ influx at physiological membrane potentials. Also, the valence (q1) of the perturbed VSD-I was reduced by ∼60%, consistent with the neutralization of a relevant gating charge. The fitting parameter set and relative CIs are presented in Table S1.
The allosteric model developed here predicts that the pore has an intrinsic voltage dependence of ∼1.7 e0 (1.6 < qL < 1.8 e0; 95% CI). A salient feature of allosteric interactions is that channel opening will still occur when all the sensors are at the resting state. However, if the pore domain conformational changes during channel gating are intrinsically voltage-dependent, a continuous increase in the channel Popen should be observed after all voltage sensors are maximally active. This behavior can be visualized by plotting the G(V) as a Hill plot adapted for voltage-dependent equilibrium ln[G(V)/(1 − G(V)] (Sigg, 2013). With such transformation, a two-state system yields a straight line with a slope corresponding to the effective valence and intercept (G(V) = 0.5) at V1/2. The Hill-transformed G(V) for both WT and R174W channels became asymptotic for positive membrane potentials with a slope representing the effective valence of the intrinsic voltage dependence of the pore (i.e., without the contribution of the VSDs; Sigg, 2013). Note that the model approximates the data well, yielding the intrinsic effective valence of the pore (qL = 1.7 e0). The allosteric model also predicted that R174W mutation is associated with a reduction of VSD–pore coupling energy of 59 meV (ΔΔG = ∑WWT− ∑WR174W) (Fig. 9).

Hill plot of CaV1.1 WT and R174W channels activity highlights the intrinsic voltage dependence of the pore. The filled circles represent the Hill-transformed experimental G(V) data points for WT and R174W channels. Continuous lines are the Hill-transformed G(V) curves predicted by the allosteric model. Dashed lines correspond to straight lines with slope of 1.7 e / kT obtained as described in the text. Note that the two channels exhibit a difference in the overall pore–VSD coupling energy (ΔΔG) of 59 meV (as estimated from ΣWi for the WT and R174W obtained from the model best fit).
Hill plot of CaV1.1 WT and R174W channels activity highlights the intrinsic voltage dependence of the pore. The filled circles represent the Hill-transformed experimental G(V) data points for WT and R174W channels. Continuous lines are the Hill-transformed G(V) curves predicted by the allosteric model. Dashed lines correspond to straight lines with slope of 1.7 e / kT obtained as described in the text. Note that the two channels exhibit a difference in the overall pore–VSD coupling energy (ΔΔG) of 59 meV (as estimated from ΣWi for the WT and R174W obtained from the model best fit).
In summary, the 32-state allosteric model of CaV gating lends further support to a predominant role of VSD-I in CaV1.1 activation and assigned a smaller contribution of VSD-IV. Based on this analysis, VSD-II and VSD-III would not contribute to channel opening. We speculate that VSD-II and VSD-III remain available for other voltage-dependent channel functions, such as RYR1 activation and, consequently, SR Ca2+ release, since EC coupling remains functional in patients carrying a R174W missense mutation of CaV1.1 (Eltit et al., 2012).
Discussion
Using VCF and computational modeling, we have dissected the operation of the voltage-sensing apparatus of the human skeletal muscle CaV1.1 channel, revealing the functional properties of each of its four voltage sensors. The experimental results expose a striking heterogeneity in their voltage- and time-dependent properties and shed light on the apparent paradox whereby an extremely slowly activating channel controls a very fast process, SR Ca2+ release, that takes place during 2–5 ms of the skeletal muscle action potential. We found that VSD-I plays a major role in CaV1.1 channel activation, based on several pieces of evidence: (1) VSD-I time-dependent properties are compatible with ionic current activation kinetics (Fig. 3 B and Fig. S2); (2) the neutralization of the innermost charge of VSD-I (R174W) impairs the activation of this voltage sensor, in turn compromising voltage-dependent CaV1.1 pore opening at physiological membrane potentials (Fig. 5); and (3) a statistical mechanical model relevant to CaV molecular architecture predicts that the open state of the human CaV1.1 pore is mostly stabilized by VSD-I activation (W1 = −81 meV or ∼3 kT) with a minimal contribution of the other VSDs (W2-4 > −25 meV or <1 kT; Fig. 7 and Table S1). Other mutations of voltage-sensing charges in VSD-I also affect ionic current voltage dependence (García et al., 1997; El Ghaleb et al., 2019), in agreement with a role of VSD-I in channel opening. On the other hand, VSD-II, -III, and -IV display activation components ∼20-fold faster than VSD-I (Fig. 3 B and Fig. S2), a feature that qualifies them as kinetically compatible candidates for a role as voltage sensor(s) of SR Ca2+ release. Since a large body of evidence implicates the intracellular II–III loop for a major role in transducing depolarization sensed by CaV1.1 to RYR1 opening (Bannister and Beam, 2013a), we speculate that either VSD-II or VSD-III (or both) represent the voltage sensor(s) of skeletal EC coupling (Fig. 10).

The role of CaV1.1 VSDs: fast and slow VSDs control R Y R1 and CaV1.1 activation, respectively. (A) Scheme depicting the main players in the skeletal muscle EC coupling process: RYR1 (orange) is unable to sense depolarizations of the sarcolemma because of its localization in the intracellular SR. RYR1 is in physical contact (directly or via auxiliary proteins) with CaV1.1 channel (red), which is inserted in the sarcolemma and confers voltage dependence to RYR1. At rest, both channels are closed, and the skeletal muscle is relaxed. (B and C) Upon depolarization, the VSDs of CaV1.1 channels (blue and green) rearrange. VSD-II and VSD-III kinetics are compatible with the SR Ca2+-release time course; thus, we propose that their movement mechanically and rapidly propagates to RYR1 (B), allowing for SR Ca2+-release: VSD-II and/or VSD-III constitute the voltage sensor(s) of skeletal muscle contraction. On the other hand, VSD-I (blue) activates with slower kinetics compatible with CaV1.1 opening. Indeed, combining fluorometry, mutagenesis, and mathematical modeling, we demonstrated that VSD-I contributes the most energy to CaV1.1 activation (C). While each homotetrameric RYR1 interacts with four CaV1.1 channels, for clarity, the cartoon only depicts one CaV1.1 interacting with one monomer of RYR1. This scheme was created with http://www.BioRender.com.
The role of CaV1.1 VSDs: fast and slow VSDs control R Y R1 and CaV1.1 activation, respectively. (A) Scheme depicting the main players in the skeletal muscle EC coupling process: RYR1 (orange) is unable to sense depolarizations of the sarcolemma because of its localization in the intracellular SR. RYR1 is in physical contact (directly or via auxiliary proteins) with CaV1.1 channel (red), which is inserted in the sarcolemma and confers voltage dependence to RYR1. At rest, both channels are closed, and the skeletal muscle is relaxed. (B and C) Upon depolarization, the VSDs of CaV1.1 channels (blue and green) rearrange. VSD-II and VSD-III kinetics are compatible with the SR Ca2+-release time course; thus, we propose that their movement mechanically and rapidly propagates to RYR1 (B), allowing for SR Ca2+-release: VSD-II and/or VSD-III constitute the voltage sensor(s) of skeletal muscle contraction. On the other hand, VSD-I (blue) activates with slower kinetics compatible with CaV1.1 opening. Indeed, combining fluorometry, mutagenesis, and mathematical modeling, we demonstrated that VSD-I contributes the most energy to CaV1.1 activation (C). While each homotetrameric RYR1 interacts with four CaV1.1 channels, for clarity, the cartoon only depicts one CaV1.1 interacting with one monomer of RYR1. This scheme was created with http://www.BioRender.com.
CaV1.1 channels exhibit a unique mechanism for voltage-dependent channel opening, among the super family of voltage-gated ion channels
The present study suggests that CaV1.1 complexes operate mainly upon activation of a single voltage sensor (VSD-I), a feature which has not been observed in any other voltage-gated ion channel (Smith-Maxwell et al., 1998; Chanda and Bezanilla, 2002; Pantazis et al., 2014). Indeed, KV channels typically require activation of all four VSDs to favor pore opening (Smith-Maxwell et al., 1998), while NaV channels require the activation of three VSDs (specifically, VSDs I, II, and III; Chanda and Bezanilla, 2002; Goldschen-Ohm et al., 2013). In addition, we recently discovered that pore opening in CaV1.2 channels is mainly driven by two voltage sensors (VSDs II and III; Pantazis et al., 2014; Savalli et al., 2016).
Previous studies in rabbit embryonic and adult CaV1.1 variants suggested that VSD-IV controls voltage sensitivity of pore opening (Tuluc et al., 2016). However, in the human adult CaV1.1 channel used in our study, the computational analysis with a CaV allosteric model predicts a small energetic contribution of VSD-IV activation to the stabilization of the pore open state (Table S1). The difference with previous studies regarding the role of VSD-IV may arise from the different CaV1.1 isoform (human in this study versus rabbit in Tuluc et al. [2016]) or from the different cellular environment (Xenopus oocytes in this study versus mouse dysgenic myotubes in Tuluc et al. [2016]). It is also possible that the deletion of 19 amino acids in VSD-IV of embryonic channels increases the energetic contribution of this sensor to channel activation.
Different L-type Ca2+ channels engage different VSDs to open their pores
In skeletal CaV1.1 channels composed of α1S/β1a, the mid-point of VSDs activation spans a range of ∼40 mV (Table 3), while in CaV1.2 channels (α1C/β3), the extent is larger (∼80 mV; Savalli et al., 2016), implying a more loose coupling between voltage sensors and pore in the latter case. Indeed, the overall energetic coupling (∑W) between VSDs and pore quantified by an allosteric model of CaV channel activation supports this view: in skeletal channels, ∑W is ∼100 meV (Table S1), while in CaV1.2 channels, ∑W corresponds to a smaller value (∼40 meV; Savalli et al., 2016). Thus, the mechanism of voltage-dependent pore opening in L-type CaV channels appears to be isoform-specific and does not conform to a single conserved mechanism, despite ∼90% sequence homology in the transmembrane segments and practically identical S4 helices. Conceivably, the difference in extracellular and intracellular linkers mediates the large functional difference of CaV1.1 and CaV1.2 channels, resulting in very different physiological functions. Indeed, previous studies in CaV channels (Nakai et al., 1994; Tuluc et al., 2016; Liu et al., 2017) and other voltage-gated ion channels (Priest et al., 2013) demonstrate the importance of the S3–S4 linker sequence and length in defining the biophysical properties of channel activation.
Conclusions and perspectives
We have pioneered VCF in human CaV1.1 complexes and resolved unique time- and voltage-dependent properties of its four VSDs. We explained how CaV1.1 channels solve the task of controlling both the fast (1–3 ms) SR Ca2+ release via RYR1 activation and the slow (40–60 ms) opening of its own pore, by assigning each function to distinct VSDs. VSD-I qualifies as the main contributor of CaV1.1 activation, a new solution for voltage-dependent channel activation, while VSD-II and -III exhibit biophysical properties compatible with the timing of SR Ca2+ release, likely representing the voltage sensor(s) of skeletal EC-coupling mechanism. More studies are certainly needed to reveal the precise role of Cav1.1 VSDs in RYR1 gating and EC coupling. However, the experimental strategy developed here sets a framework to mechanistically address clinically relevant questions on the functional consequences of disease-causing mutations in CaV1.1 voltage dependence (e.g., hypokalemic periodic paralysis and MH-associated mutations; Flucher, 2020). The approach developed in this work can also advance our knowledge on the fundamental mechanisms underlying CaV1.1 modulation by auxiliary subunits or alternative splicing, benefitting from the new level of information attainable by simultaneously acquiring structural data from functional channel proteins operating in a membrane environment.
Acknowledgments
Eduardo Ríos served as editor.
We are thankful for the insightful discussions and comments of Dr. Michela Ottolia and Dr. Andreas Schwingshackl and their laboratory members. We thank Dr. Daniel Sigg for insightful discussions on the mathematical modeling.
This work was supported by the National Institutes of Health/National Institute of General Medical Sciences (grant R35GM131896 to R. Olcese), the National Institutes of Health/National Institute of Arthritis and Musculoskeletal and Skin Diseases (grant R01AR063182 to S.C. Cannon); an American Heart Association Postdoctoral Fellowship (17POST33670046 to M. Angelini); and Chilean Government (grants FONDECYT 1161672 to A. Neely). The Centro Interdisciplinario de Neurociencia de Valparaíso is a Millennium Institute supported by the Millennium Scientific Initiative of the Chilean Ministry of Economy.
The authors declare no competing financial interests.
Author contributions: Conceptualization, N. Savalli, A. Neely, S.C. Cannon, and R. Olcese; Investigation, N. Savalli, M. Angelini, F. Steccanella, J. Wier, F. Wu, M. Quinonez, and M. DiFranco; Software, N. Savalli, A. Neely, and R. Olcese; Formal Analysis, N. Savalli, M. Angelini, F. Steccanella, A. Neely, and R. Olcese; Writing—Original Draft, N. Savalli and R. Olcese; Writing—Review & Editing, N. Savalli, M. Angelini, F. Steccanella, M. DiFranco, A. Neely, S.C. Cannon, and R. Olcese; Funding Acquisition, M. Angelini, A. Neely, S.C. Cannon, and R. Olcese.
References
This work is part of a special issue on excitation–contraction coupling.

