


The majority of mucopolysaccharidosis IIIC (MPS IIIC) patients have missense variants causing misfolding of heparan sulfate acetyl-CoA:α-glucosaminide N-acetyltransferase (HGSNAT), which are potentially treatable with pharmacological chaperones. To test this approach, we generated a novel HgsnatP304L mouse model expressing misfolded HGSNAT Pro304Leu variant. HgsnatP304L mice present deficits in short-term and working/spatial memory 2–4 mo earlier than previously described constitutive knockout Hgsnat-Geo mice. HgsnatP304L mice also show augmented severity of neuroimmune response, synaptic deficits, and neuronal storage of misfolded proteins and gangliosides compared with Hgsnat-Geo mice. Expression of misfolded human Pro311Leu HGSNAT protein in cultured hippocampal Hgsnat-Geo neurons further reduced levels of synaptic proteins. Memory deficits and majority of brain pathology were rescued in mice receiving HGSNAT chaperone, glucosamine. Our data for the first time demonstrate dominant-negative effects of misfolded HGSNAT Pro304Leu variant and show that they are treatable by oral administration of glucosamine. This suggests that patients affected with mutations preventing normal folding of the enzyme can benefit from chaperone therapy.
Introduction
Mucopolysaccharidosis IIIC (MPS IIIC) or Sanfilippo syndrome type C is a rare genetic disease manifesting with neuropsychiatric problems, such as hyperactivity, aggressiveness, and autistic features, followed by developmental delay, hearing loss, and childhood dementia (Bartsocas et al., 1979). Most patients become paraplegic during adolescence and die before adulthood, but some survive until the fourth decade of life (Bartsocas et al., 1979) with progressive dementia and retinitis pigmentosa (Berger-Plantinga et al., 2004; Ruijter et al., 2008; Scriver et al., 2001; Valstar et al., 2008).
The disease is caused by deleterious variants in the gene encoding the lysosomal membrane enzyme, heparan sulfate acetyl-CoA:α-glucosaminide N-acetyltransferase (HGSNAT), which catalyzes transmembrane acetylation of glucosamine residues of heparan sulfate (HS) before their hydrolysis by α-N-acetylglucosaminidase. Lysosomal storage of undegraded HS in the brain cells leads to neuroinflammation and neuronal dysfunction followed by neurodegeneration (reviewed in Heon-Roberts et al. [2020]). Of >70 disease-causing HGSNAT variants identified in MPS IIIC patients, 35 are missense (Martins et al., 2019). Expression studies showed that the resulting amino acid substitutions led to the synthesis of misfolded HGSNAT protein, unable to escape the ER and reach the lysosome (Fedele and Hopwood, 2010; Feldhammer et al., 2009b). These mutations are among the most frequent, with ∼55% of MPS IIIC patients affected with at least one of them. Previously, we could partially rescue 10 mutant misfolded HGSNAT variants by treating patient’s cells with the inhibitor of HGSNAT, glucosamine (Feldhammer et al., 2009b), suggesting that these patients could potentially benefit from pharmacological chaperone (PC) therapy, applicable to disorders caused by missense pathogenic variants.
Lysosomal enzymes are secreted into the lumen of the ER in a largely unfolded state (Ellgaard et al., 1999). The WT enzyme folds into the appropriate (native) conformation with the assistance of various chaperones, such as immunoglobulin-binding protein (BiP), heat shock proteins, calnexin, and calreticulin (Ellgaard and Helenius, 2003). In contrast, mutant enzymes, although they might be catalytically active in the acidic milieu of the lysosome, are often not folded properly and cannot be transported to the lysosomes. These mutant proteins are retained in the ER and degraded by the proteasome-associated pathway (Helenius et al., 1992). However, molecules that mimic substrate binding in the active site, such as competitive inhibitors, may work as PCs, stabilizing the proper position of active site residues and shifting the equilibrium toward the correctly folded state of the enzyme (Asano et al., 2000; Fan et al., 1999; Frustaci et al., 2001; Maegawa et al., 2007; Matsuda et al., 2003; Sawkar et al., 2002; Tropak et al., 2004). As a result, the correctly folded mutant enzyme passes the quality-control system of the ER and undergoes further maturation and normal transport to the lysosome. Once a mutant enzyme-chaperone complex reaches the lysosome, the chaperone is replaced by a highly concentrated (accumulated) substrate to allow the enzyme to function. Previous studies identified effective chaperones for several lysosomal enzymes, some showing therapeutic effect in mouse models of GM1 and GM2 gangliosidoses, Gaucher disease, and Fabry disease (reviewed in Desnick [2004] and Parenti [2009]). PC therapy is now being translated into clinical applications for cystic fibrosis (Arora and Naren, 2016) and for the lysosomal diseases Fabry, Gaucher, and Pompe (Boyd et al., 2013; Germain et al., 2016; Narita et al., 2016; Parenti et al., 2014). In particular, a PC drug for Fabry disease, Galafold (Germain et al., 2016), has received approval in the European Union and the U.S.
Because the constitutive knockout Hgsnat-Geo mice we generated previously (Martins et al., 2015) cannot be used to test chaperone therapy in vivo, in the current study, we produced a mouse expressing HGSNAT with the human misfolded variant Pro311Leu (Pro304Leu in the mouse protein). Mice homozygous for the HgsnatP304L allele show a drastically bigger increase of neuroinflammation and synaptic defects compared with the knockout mice and have 2-mo-earlier onset of memory impairment, consistent with the dominant-negative effect of the misfolded HGSNAT mutant. Behavioral problems, synaptic defects, and majority of brain pathology were rescued by treating mice daily with oral glucosamine, validating the use of chaperone therapy as a promising approach to treat MPS IIIC patients with missense variants.
Results
HgsnatP304L mice and Hgsnat-Geo knockout mice show complete deficiency of HGSNAT activity and similar storage of HS in tissues
The mouse HgsnatP304L strain with the Pro304Leu analog of human misfolded HGSNAT Pro311Leu variant (Feldhammer et al., 2009a) was produced essentially as described by Stephenson et al. (2010), following the scheme shown in Fig. S1. Genotyping the offspring from heterozygous breeding revealed an expected Mendelian frequency (25%) for mice homozygous for the HgsnatP304L allele. Similarly to knockout Hgsnat-Geo mice (Martins et al., 2015), homozygous HgsnatP304L mice of both sexes were viable and fertile, produced normal litter sizes, and showed normal body weight (BW) gain and general behavior similar to their WT or heterozygous siblings until the age of 7–8 mo, when they presented with BW loss, lethargy, and urinary retention.

Generation and skeletal phenotype of Hgsnat P304L mice. (A) Schema showing the Cas9/sgRNA-targeting site in Hgsnat exon 9. The sgRNA-targeting sequence is underlined, and the protospacer-adjacent motif (PAM) sequence is shown in green. The c.911C>T mutation is shown in red and marked with an arrow. The C>T substitution disrupts the NcoI restriction site (shown in bold). The exon sequence is capitalized. (B) Sanger sequencing of single allele fragment obtained by PCR amplification of genomic DNA from the tail clips of the HgsnatP304L founder mouse showing the presence of the c.911C>T mutation. (C) Genotyping of HgsnatP304L mice. The DNA was extracted from clipped mouse tails and a 988-bp product amplified using a forward primer 5′-ATGGAGTGCCTGATGGGAGG-3′ and a reverse primer 5′-GATCTAGAAACGGCCCGAAGA-3′. The PCR products were further digested with NcoI and analyzed on a 2% agarose gel. The 688- and 300-bp fragments are detected for the WT allele, and an undigested 988-bp fragment, for the targeted HgsnatP304L allele. (D) A 763-bp fragment of the Spg7 gene, containing the potential off-target sequence 5′-CTGTGGGAAGACGCTGTTGGCCA-3′, was amplified by PCR from DNA extracted from tail clips of HgsnatP304L founder mice (KI-1 and KI-2) and a control WT mouse. (E) Sanger sequencing of a PCR product confirms the absence of mutations in the Spg7 gene fragment adjacent to the 5′-CTGTGGGAAGACGCTGTTGGCCA-3′ fragment homologous to the PAM sequence. (F) A high-resolution in vivo micro-CT scanner (SkyScan 1176) was used to evaluate skeletal deformities in 4-mo-old Hgsnat-Geo and HgsnatP304L mice. The mice were anesthetized by isoflurane flow and the images were taken from the dorsal side. Both Hgsnat-Geo and HgsnatP304L mice do not develop abnormalities of skull bones. Panels show typical images of three mice analyzed per genotype.
Generation and skeletal phenotype of Hgsnat P304L mice. (A) Schema showing the Cas9/sgRNA-targeting site in Hgsnat exon 9. The sgRNA-targeting sequence is underlined, and the protospacer-adjacent motif (PAM) sequence is shown in green. The c.911C>T mutation is shown in red and marked with an arrow. The C>T substitution disrupts the NcoI restriction site (shown in bold). The exon sequence is capitalized. (B) Sanger sequencing of single allele fragment obtained by PCR amplification of genomic DNA from the tail clips of the HgsnatP304L founder mouse showing the presence of the c.911C>T mutation. (C) Genotyping of HgsnatP304L mice. The DNA was extracted from clipped mouse tails and a 988-bp product amplified using a forward primer 5′-ATGGAGTGCCTGATGGGAGG-3′ and a reverse primer 5′-GATCTAGAAACGGCCCGAAGA-3′. The PCR products were further digested with NcoI and analyzed on a 2% agarose gel. The 688- and 300-bp fragments are detected for the WT allele, and an undigested 988-bp fragment, for the targeted HgsnatP304L allele. (D) A 763-bp fragment of the Spg7 gene, containing the potential off-target sequence 5′-CTGTGGGAAGACGCTGTTGGCCA-3′, was amplified by PCR from DNA extracted from tail clips of HgsnatP304L founder mice (KI-1 and KI-2) and a control WT mouse. (E) Sanger sequencing of a PCR product confirms the absence of mutations in the Spg7 gene fragment adjacent to the 5′-CTGTGGGAAGACGCTGTTGGCCA-3′ fragment homologous to the PAM sequence. (F) A high-resolution in vivo micro-CT scanner (SkyScan 1176) was used to evaluate skeletal deformities in 4-mo-old Hgsnat-Geo and HgsnatP304L mice. The mice were anesthetized by isoflurane flow and the images were taken from the dorsal side. Both Hgsnat-Geo and HgsnatP304L mice do not develop abnormalities of skull bones. Panels show typical images of three mice analyzed per genotype.
HGSNAT protein could not be detected in neither WT nor HgsnatP304L mouse tissues by immunoblot with the commercially available antibodies because it is expressed at a very low level. Expression level of Hgsnat mRNA, measured by quantitative PCR (qPCR) in the brain, liver, and kidney (Fig. 1 A) or by total hippocampal RNA sequencing (data not shown) of the homozygous HgsnatP304L mice, was similar to that in the WT mice, and the message contained the expected c.911C>T change as demonstrated by Sanger sequencing of the RT-PCR products (Fig. 1 A). HGSNAT activity, measured with 4-muf-β-D-glucosaminide in the liver, kidney, and cultured embryonic skin fibroblasts (MEF cells) of homozygous HgsnatP304L mice, was reduced to 0.3–5.0% of that in WT mice, i.e., levels similar to those in the tissues of homozygous knockout Hgsnat-Geo mice and below or close to the detection limit of the method (Fig. 1 B). In the brain tissues of both HgsnatP304L and Hgsnat-Geo homozygous mice, the residual HGSNAT activity against 4-muf-β-D-glucosaminide, was 12–15% of normal. However, the N-acetyltransferase HGSNAT activity in the brain homogenates, directly measured using 1[4,4-difluoro-5,7-dimethyl-4-bora-3a,4a-diaza-s-indacene-3-propionyl-glycylamino]-β-D-glucosamine (BODIPY-glucosamine; Choi et al., 2015), was reduced to below detection levels (Fig. 1 C). We, therefore, conclude that like human Pro311Leu HGSNAT (Feldhammer et al., 2009b), the mouse enzyme containing the Pro304Leu variant lacks catalytic activity. The residual activity against 4-muf-β-D-glucosaminide was detected only in the brains and not in other studied tissues of homozygous HgsnatP304L and Hgsnat-Geo mice or in the soluble mouse liver glycoprotein fraction, suggesting that our batch of 4-muf-β-D-glucosaminide substrate was free of contamination. We speculate, therefore, that the source of brain residual activity was an unknown hydrolase capable of cleaving nonacetylated β-D-glucosaminide.

Hgsnat P304L homozygous mice express mutant Hgsnat mRNA and show complete deficiency of HGSNAT activity and greater increase of lysosomal biogenesis, but similar GAG storage compared with Hgsnat-Geo mice. (A) Normal levels of Hgsnat mRNA containing c.911C>T mutation are expressed in the tissues of 4-mo-old HgsnatP304L mice. The values are normalized for the level of control RPL32 mRNA. Data, means, and SD of experiments performed with five mice (three male and two female) for each genotype are shown. All amplified PCR fragments were homozygous for c.911C>T mutation (inset). (B) HGSNAT activity toward 4-muf-β-D-glucosaminide in the tissues and in cultured MEF cells of 4-mo-old WT, homozygous HgsnatP304L, and Hgsnat-Geo mice is reduced to the background level in all studied tissues except for the brain. (C) HGSNAT activity measured using BODIPY-glucosamine is reduced to the background level in the brains of both HgsnatP304L and Hgsnat-Geo mice. (D) Activity of total lysosomal β-hexosaminidase shows a bigger increase in the tissues of HgsnatP304L compared with Hgsnat-Geo mice. (E) LAMP2 immunostaining is increased in cortical neurons of 4-mo-old HgsnatP304L mice compared with Hgsnat-Geo mice, suggesting higher levels of lysosomal storage. Panels show representative images of the somatosensory cortex (layers 4 and 5) and CA1 region of hippocampus of 4-mo-old HgsnatP304L, Hgsnat-Geo, and WT mice. Bars represent 15 µm. Graphs show quantification of LAMP2-stained area by ImageJ software. (F) Levels of disaccharides produced by enzymatic digestion of HS (ΔDiHS-0S and ΔDiHS-NS) were measured by MS/MS in blood serum, urine, and brain tissues of WT, HgsnatP304L, and Hgsnat-Geo mice at the age of 2, 4, and 6 mo (MO). (G) Levels of disaccharides produced by enzymatic digestion of DS (ΔDi-0S/4S), and KS and DiS-KS were measured in brain tissues of WT, HgsnatP304L, and Hgsnat-Geo mice at the age of 2, 4, and 6 mo. All graphs show individual data, means, and SD of experiments performed using tissues from four to seven mice per genotype per age. MEF cell data show results for three cultures, each obtained from pooled skin samples of three mice. P values were calculated by one-way ANOVA with Tukey post hoc test (A and C), nested one-way ANOVA test with Tukey post hoc test (E), or two-way ANOVA with Tukey post hoc test (B and D–F). *, P < 0.05; **, P < 0.01; ***, P < 0.001; ****, P < 0.0001.
Hgsnat P304L homozygous mice express mutant Hgsnat mRNA and show complete deficiency of HGSNAT activity and greater increase of lysosomal biogenesis, but similar GAG storage compared with Hgsnat-Geo mice. (A) Normal levels of Hgsnat mRNA containing c.911C>T mutation are expressed in the tissues of 4-mo-old HgsnatP304L mice. The values are normalized for the level of control RPL32 mRNA. Data, means, and SD of experiments performed with five mice (three male and two female) for each genotype are shown. All amplified PCR fragments were homozygous for c.911C>T mutation (inset). (B) HGSNAT activity toward 4-muf-β-D-glucosaminide in the tissues and in cultured MEF cells of 4-mo-old WT, homozygous HgsnatP304L, and Hgsnat-Geo mice is reduced to the background level in all studied tissues except for the brain. (C) HGSNAT activity measured using BODIPY-glucosamine is reduced to the background level in the brains of both HgsnatP304L and Hgsnat-Geo mice. (D) Activity of total lysosomal β-hexosaminidase shows a bigger increase in the tissues of HgsnatP304L compared with Hgsnat-Geo mice. (E) LAMP2 immunostaining is increased in cortical neurons of 4-mo-old HgsnatP304L mice compared with Hgsnat-Geo mice, suggesting higher levels of lysosomal storage. Panels show representative images of the somatosensory cortex (layers 4 and 5) and CA1 region of hippocampus of 4-mo-old HgsnatP304L, Hgsnat-Geo, and WT mice. Bars represent 15 µm. Graphs show quantification of LAMP2-stained area by ImageJ software. (F) Levels of disaccharides produced by enzymatic digestion of HS (ΔDiHS-0S and ΔDiHS-NS) were measured by MS/MS in blood serum, urine, and brain tissues of WT, HgsnatP304L, and Hgsnat-Geo mice at the age of 2, 4, and 6 mo (MO). (G) Levels of disaccharides produced by enzymatic digestion of DS (ΔDi-0S/4S), and KS and DiS-KS were measured in brain tissues of WT, HgsnatP304L, and Hgsnat-Geo mice at the age of 2, 4, and 6 mo. All graphs show individual data, means, and SD of experiments performed using tissues from four to seven mice per genotype per age. MEF cell data show results for three cultures, each obtained from pooled skin samples of three mice. P values were calculated by one-way ANOVA with Tukey post hoc test (A and C), nested one-way ANOVA test with Tukey post hoc test (E), or two-way ANOVA with Tukey post hoc test (B and D–F). *, P < 0.05; **, P < 0.01; ***, P < 0.001; ****, P < 0.0001.
Interestingly, levels of total β-hexosaminidase activity, measured at 4 mo in the brain, liver, kidney, and lungs of HgsnatP304L mice, showed elevation compared with those in both WT and Hgsnat-Geo mice, consistent with increased levels of lysosomal biogenesis and lysosomal storage (Fig. 1 D). This was also supported by higher levels of lysosome-associated membrane protein 2 (LAMP2)+ puncta in the somatosensory cortical (layers 4 and 5) pyramidal neurons in the brains of 4-mo-old HgsnatP304L compared with Hgsnat-Geo mice (Fig. 1 E). To determine whether knock-in mice also show increased levels of glycosaminoglycan (GAG) storage, we analyzed their brain tissues and urine by liquid chromatography tandem mass spectrometry (LC-MS/MS). This method measures the concentration of disaccharides produced by enzyme digestion of GAGs known to accumulate in MPS diseases: ΔDi-0S/4S (dermatan sulfate), ΔDiHS-NS and ΔDiHS-0S (HS), as well as mono- (KS) and disulfated (DiS-KS) keratan sulfate. Disaccharides were quantified by negative ion mode of multiple reaction monitoring (Fig. 1, E and F). We observed drastically increased levels of HS-derived ΔDiHS-0S disaccharide in serum, urine, and brain and ΔDiHS-NS disaccharide in the brains of homozygous HgsnatP304L and Hgsnat-Geo mice. The levels of HS disaccharides in HgsnatP304L mice showed a trend for an increase compared with Hgsnat-Geo mice, but no significant difference was found between the strains. The brain levels of mono- and disulfated KS- and DS-derived ΔDi-0S/4S were similar for HgsnatP304L and Hgsnat-Geo mice and their WT counterparts at all ages (Fig. 1 G).
HgsnatP304L mice show an earlier onset of behavioral changes, reduced longevity, and increased visceromegaly compared with the Hgsnat-Geo strain
Previously, we have reported progressive behavioral changes in the homozygous Hgsnat-Geo mice, including hyperactivity and reduced anxiety at the age between 8 (6 in the female group) and 10 mo, as well as deficits in spatial memory and learning at 10 mo (Martins et al., 2015). To test whether increased lysosomal storage in HgsnatP304L mice coincided with earlier onset of behavioral changes, mice were studied using elevated plus maze (anxiety and fear), open field (OF; anxiety and hyperactivity), novel object recognition (NOR; short-term memory), and Y-maze (YM, short-term and spatial memory) tests. The tests were performed every 2 mo starting from the age of 2 mo, each time with a naive group of mice.
At the age of 4 mo, both male and female HgsnatP304L mice showed abnormal behavior in all four tests, including increased hyperactivity (increased distance traveled in OF; Fig. 2 A), reduced anxiety (increased distance traveled in the central part of the arena in OF; Fig. 2 B), increased percentage of time spent in the open arms and increased number of open arm entries in elevated plus maze; Fig. 2, C and D), and deficits in spatial as well as short-term memory (reduced recognition index in NOR; Fig. 2 E; reduced alteration rate in YM; Fig. 2 F). In contrast, Hgsnat-Geo mice demonstrated normal behavior in YM at both 4 and 6 mo and reduced alternation only at 8 mo (Fig. 2 F), and as we reported previously, showed hyperactivity and reduced anxiety in OF test only between 8 (6 in the female group) and 10 mo (Martins et al., 2015). Together, these data demonstrate that behavioral changes occur in HgsnatP304L mice at least 2–4 mo earlier than in the Hgsnat-Geo mice.

Pathological phenotypes of Hgsnat-Geo and Hgsnat P304L mice. (A and B) Significant increase in total distance traveled in the OF (A) and the distance traveled in the central zone (B) by HgsnatP304L mice compared with age-matched WT controls. (C) Significant decrease and increase in the percentage of time spent in open arms and closed arms in the elevated plus maze, respectively, by Hgsnat-Geo and HgsnatP304L mice compared with age-matched WT controls. (D) Significant increase in the number of open arm entries in the elevated plus maze by Hgsnat-Geo and HgsnatP304L mice compared with age-matched WT controls. (E) Significant decrease in the discrimination index in HgsnatP304L mice at 4 and 6 mo (MO) in NOR test compared with age-matched WT controls. (F)HgsnatP304L and Hgsnat-Geo mice show onset of learning impairment in YM at 4 and 8 mo, respectively. All graphs show individual data, means, and SD of experiments performed with 6–17 mice per genotype. P values were calculated by t test for experiments involving comparison of two groups (A and B), and ANOVA with Tukey post hoc test, when comparing three groups (C–F). (G) Kaplan–Meier plot showing survival of HgsnatP304L (n = 43) and Hgsnat-Geo male and female mice (n = 35) and their WT counterparts (n = 28). The significance of survival rate differences between strains was determined by the Mantel–Cox test (P < 0.05). By the age of 45 wk, most HgsnatP304L mice had to be euthanized on veterinarian request due to urinary retention, while Hgsnat-Geo mice survived to the average age of 63 wk. (H) Wet organ weight of 8-mo-old HgsnatP304L, Hgsnat-Geo, and WT mice is shown as a percentage of BW. Enlargement of visceral organs, compared with age-matched WT controls, is detected in HgsnatP304L but not in Hgsnat-Geo mice. All graphs show individual data, means, and SD of experiments performed with five or more mice per genotype. P values were calculated using two-way ANOVA with Tukey post hoc test. *, P < 0.05; **, P < 0.01; ***, P < 0.001; ****, P < 0.0001.
Pathological phenotypes of Hgsnat-Geo and Hgsnat P304L mice. (A and B) Significant increase in total distance traveled in the OF (A) and the distance traveled in the central zone (B) by HgsnatP304L mice compared with age-matched WT controls. (C) Significant decrease and increase in the percentage of time spent in open arms and closed arms in the elevated plus maze, respectively, by Hgsnat-Geo and HgsnatP304L mice compared with age-matched WT controls. (D) Significant increase in the number of open arm entries in the elevated plus maze by Hgsnat-Geo and HgsnatP304L mice compared with age-matched WT controls. (E) Significant decrease in the discrimination index in HgsnatP304L mice at 4 and 6 mo (MO) in NOR test compared with age-matched WT controls. (F)HgsnatP304L and Hgsnat-Geo mice show onset of learning impairment in YM at 4 and 8 mo, respectively. All graphs show individual data, means, and SD of experiments performed with 6–17 mice per genotype. P values were calculated by t test for experiments involving comparison of two groups (A and B), and ANOVA with Tukey post hoc test, when comparing three groups (C–F). (G) Kaplan–Meier plot showing survival of HgsnatP304L (n = 43) and Hgsnat-Geo male and female mice (n = 35) and their WT counterparts (n = 28). The significance of survival rate differences between strains was determined by the Mantel–Cox test (P < 0.05). By the age of 45 wk, most HgsnatP304L mice had to be euthanized on veterinarian request due to urinary retention, while Hgsnat-Geo mice survived to the average age of 63 wk. (H) Wet organ weight of 8-mo-old HgsnatP304L, Hgsnat-Geo, and WT mice is shown as a percentage of BW. Enlargement of visceral organs, compared with age-matched WT controls, is detected in HgsnatP304L but not in Hgsnat-Geo mice. All graphs show individual data, means, and SD of experiments performed with five or more mice per genotype. P values were calculated using two-way ANOVA with Tukey post hoc test. *, P < 0.05; **, P < 0.01; ***, P < 0.001; ****, P < 0.0001.
Similar to Hgsnat-Geo mice and the mouse models of MPS IIIA and MPS IIIB (Bhaumik et al., 1999; Li et al., 1999), HgsnatP304L mice develop urinary retention resulting in abdominal distension and requiring humane euthanasia. However, their average life span is ∼20 wk less than the lifespan of Hgsnat-Geo mice (Fig. 2 G). Like Hgsnat-Geo mice, HgsnatP304L animals do not develop skeletal abnormalities (Fig. S1). However, HgsnatP304L mice sacrificed around the age of 40 wk show enlargement of liver, kidneys, and spleen, unlike Hgsnat-Geo mice, which show only hepatomegaly (Fig. 2 H).
HgsnatP304L mice show more pronounced defects in synaptic neurotransmission compared with the Hgsnat-Geo strain
To characterize synaptic neurotransmission in MPS IIIC mice, we performed whole-cell patch-clamp recordings on acute slices from HgsnatP304L mice at postnatal day 14 (P14)–P20 and P45–P60. When the data were analyzed together with our previous results for the age-matched groups of Hgsnat-Geo and WT mice (Pará et al., 2021), we found that the amplitudes of miniature excitatory postsynaptic currents (mEPSCs) were significantly reduced in both Hgsnat-Geo and HgsnatP304L mice compared with WT mice. However, no significant difference was detected between Hgsnat-Geo and HgsnatP304L mice (Fig. 3, A and B). Also, no differences in the mEPSCs kinetics between the two animal groups were observed (not depicted). Importantly, for both Hgsnat-Geo and HgsnatP304L mice, there was an age-dependent (P14–P20 vs. P45–P60) significant decrease in mEPSC amplitudes (Fig. 3 A) suggesting progressive synaptic deficits. The mEPSC frequency was significantly reduced in both Hgsnat-Geo and HgsnatP304L mice compared with WT controls at both ages; however, at P45–P60, HgsnatP304L mice displayed significantly reduced mEPSC frequencies compared with Hgsnat-Geo mice (Fig. 3 C). In contrast, aggravated defects in inhibitory neurotransmission were observed in HgsnatP304L mice compared with the knockout model. At both P14–P20 and P45–P60, HgsnatP304L mice showed significantly reduced frequencies of miniature inhibitory postsynaptic currents (mIPSCs) compared with WT or Hgsnat-Geo mice of the same age (Fig. 3, D–F).

Synaptic defects in Hgsnat-Geo and Hgsnat P304L mice. (A–F) Neurotransmission is impaired in Hgsnat-Geo and HgsnatP304L mice. Significant decrease in the amplitude (A) and frequency (C) of mEPSCs in Hgsnat-Geo and HgsnatP304L mice at the ages of P14–P20 and P45–P60 compared with age-matched WT controls. (B) Representative recordings of mEPSCs from WT, Hgsnat-Geo, and HgsnatP304L mice at P14–P20 and P45–P60, and overlay of representative individual mEPSC events from neurons of Hgsnat-Geo, HgsnatP304L, and WT mice. Significant decrease in the amplitude (D) and frequency (F) of mIPSCs in Hgsnat-Geo and HgsnatP304L mice at the ages of P14–P20 and P45–P60 compared with age-matched WT controls. (E) Representative recording of mIPSCs from neurons of WT, Hgsnat-Geo, and HgsnatP304L mice at the ages of P14–P20 and P45–P60, and overlay of representative individual mIPSC events from neurons of Hgsnat-Geo, HgsnatP304L, and WT mice. All graphs show individual data, means, and SD of experiments performed with six or more mice per genotype. P values were calculated using one-way Kruskal–Wallis test with Dunn’s multiple comparison post hoc test. (G and H) Reduction of synaptic vesicle densities, areas of PSDs, and length of PSDs in Hgsnat-Geo and HgsnatP304L CA1 pyramidal neurons. Density of synaptic vesicles, length (µm), and area (µm2) of PSDs were measured in asymmetrical (G) and symmetrical (H) pyramidal neurons from the CA1 region of the hippocampus. Synaptic terminals on the TEM images are marked with black arrowheads and PSDs with red asterisks. Data show values, means, and SD of the results obtained with three mice per genotype with 10–15 neurons quantified per animal. P values were calculated by nested one-way ANOVA test with Tukey post hoc test. Scale bars equal 200 nm in all panels. *, P < 0.05; **, P < 0.01; ***, P < 0.001; ****, P < 0.0001. MO, mo.
Synaptic defects in Hgsnat-Geo and Hgsnat P304L mice. (A–F) Neurotransmission is impaired in Hgsnat-Geo and HgsnatP304L mice. Significant decrease in the amplitude (A) and frequency (C) of mEPSCs in Hgsnat-Geo and HgsnatP304L mice at the ages of P14–P20 and P45–P60 compared with age-matched WT controls. (B) Representative recordings of mEPSCs from WT, Hgsnat-Geo, and HgsnatP304L mice at P14–P20 and P45–P60, and overlay of representative individual mEPSC events from neurons of Hgsnat-Geo, HgsnatP304L, and WT mice. Significant decrease in the amplitude (D) and frequency (F) of mIPSCs in Hgsnat-Geo and HgsnatP304L mice at the ages of P14–P20 and P45–P60 compared with age-matched WT controls. (E) Representative recording of mIPSCs from neurons of WT, Hgsnat-Geo, and HgsnatP304L mice at the ages of P14–P20 and P45–P60, and overlay of representative individual mIPSC events from neurons of Hgsnat-Geo, HgsnatP304L, and WT mice. All graphs show individual data, means, and SD of experiments performed with six or more mice per genotype. P values were calculated using one-way Kruskal–Wallis test with Dunn’s multiple comparison post hoc test. (G and H) Reduction of synaptic vesicle densities, areas of PSDs, and length of PSDs in Hgsnat-Geo and HgsnatP304L CA1 pyramidal neurons. Density of synaptic vesicles, length (µm), and area (µm2) of PSDs were measured in asymmetrical (G) and symmetrical (H) pyramidal neurons from the CA1 region of the hippocampus. Synaptic terminals on the TEM images are marked with black arrowheads and PSDs with red asterisks. Data show values, means, and SD of the results obtained with three mice per genotype with 10–15 neurons quantified per animal. P values were calculated by nested one-way ANOVA test with Tukey post hoc test. Scale bars equal 200 nm in all panels. *, P < 0.05; **, P < 0.01; ***, P < 0.001; ****, P < 0.0001. MO, mo.
To test if changes in synaptic transmission were associated with those in the architecture of the synaptic compartment, we analyzed hippocampal tissues of Hgsnat-Geo and HgsnatP304L mice at the ages of 3 and 6 mo by transmission electron microscopy (TEM). As before (Pará et al., 2021), we have measured the length and the area of postsynaptic densities (PSDs) and densities of synaptic vesicles in the terminals of asymmetric (excitatory) and symmetric (inhibitory) synapses of pyramidal CA1 neurons (Fig. 3, G and H).
At the age of 3 mo, the areas of excitatory PSDs of CA1 neurons in Hgsnat-Geo mice were similar to those in WT mice, while in the HgsnatP304L mice they were already significantly reduced. At the age of 6 mo, the areas of excitatory PSDs in hippocampal neurons of both MPS IIIC mouse models were reduced compared with WT mice, but the HgsnatP304L mice expressed a particularly drastic phenotype, with PSD areas ∼50% smaller than those in WT mice. A similar trend was observed for the excitatory PSD length: by 6 mo, PSD length in HgsnatP304L mice was significantly reduced compared with both WT and Hgsnat-Geo mice. The density of synaptic vesicles (total number of synaptic vesicles divided by the area of the terminal) also showed a more rapid decrease in HgsnatP304L mice, with a reduction by ∼43% at 3 mo and ∼60% at 6 mo compared with WT mice. In Hgsnat-Geo mice, they were reduced only by ∼30 and ∼40%, respectively (Fig. 3, G and H). Together, these data revealed that the HgsnatP304L strain shows more pronounced defects in neurotransmission and synaptic architecture compared with the Hgsnat-Geo strain.
HgsnatP304L mice show accelerated progression in central nervous system (CNS) pathology
Comparative analysis of pathological changes in the brain of Hgsnat-Geo and HgsnatP304L mice demonstrated that they are aggravated in the knock-in mice. The levels of activated CD68+ microglia and GFAP+ astrocytes at 4 mo were significantly increased in the hippocampi and GFAP+ astrocytes in the hippocampi and somatosensory (layers 4–5) cortices of HgsnatP304L mice compared with both WT and Hgsnat-Geo strains (Fig. 4 A). This coincided with the significantly increased expression levels of inflammatory cytokines MIP1α and TNFα in the brains of HgsnatP304L compared with Hgsnat-Geo mice (Fig. 4 B).

Aggravated pathological changes in the brains of Hgsnat P304L mice. (A) Astromicrogliosis in brain hippocampal and cortex regions of MPS IIIC mice is indicative of neuroimmune response. Panels show representative confocal microscopy images of brain tissues of 4-mo-old Hgsnat-Geo and HgsnatP304L mice and their age-matched WT controls stained with antibodies against CD68 (red) and GFAP (green) markers for activated microglia and astrocytes, respectively. DAPI (blue) was used as a nuclear counterstain. Graphs show quantification of fluorescence with ImageJ software. Individual data, means, and SD obtained for five mice per genotypes (three areas/mouse) are shown. P values were calculated using nested one-way ANOVA test with Tukey post hoc test. (B) Total brain tissues of HgsnatP304L mice show increased expression of inflammation markers, MIP1α, and TNFα compared with Hgsnat-Geo mice. The cytokine mRNA levels are normalized for the RLP32 mRNA content. Data show individual data, means, and SD. Five to eight mice were analyzed for each genotype. P values were calculated using one-way ANOVA with Tukey post hoc test. (C–F) Somatosensory cortices (layers 4–5) of HgsnatP304L mice show increased levels of markers of impaired autophagy and proteolysis compared with Hgsnat-Geo and/or age-matched WT mice: cytoplasmic LC3-positive puncta (C), granular autofluorescent ceroid materials (D), amyloid-β protein (AP; E), and misfolded SCMAS (F). Panels show representative confocal microscopy images of brain tissues of 4-mo-old (A, B, and D) or 6-mo-old (C, E, and F) Hgsnat-Geo, HgsnatP304L, and WT mice. Bars represent 20 µm in A and C, 100 and 25 µm in D, and 25 µm in E and F. Fluorescence was quantified with ImageJ software. Graphs show individual data, means, and SD obtained for five mice per genotype (three areas/mouse). P values were calculated using nested one-way ANOVA test with Tukey post hoc test. (G) Alteration of sphingolipid levels in the brains of Hgsnat-Geo and HgsnatP304L mice. Levels of glycans produced by enzymatic cleavage of total sphingolipid extracts of brain tissues from WT, Hgsnat-Geo, and HgsnatP304L 2-, 4-, and 6-mo-old mice were measured by normal HPLC. The values show percentage of the specific lipid. Pooled samples of three mice per age per genotype were analyzed. (H) Increased levels of GM2 ganglioside in the brains of Hgsnat-Geo and HgsnatP304L mice. Confocal microscopy images of brain cortex and hippocampus tissues of individual Hgsnat-Geo, HgsnatP304L, and WT 4-mo-old mice stained with antibodies against GM2 (green) and NeuN (red). DAPI (blue) was used as the nuclear counterstain. Scale bar equals 15 µm. Graphs show results of quantification performed using ImageJ software. Individual data, means, and SD obtained for five mice per genotypes (three areas/mouse) are shown. P values were calculated using nested one-way ANOVA test with Tukey post hoc test. *, P < 0.05; **, P < 0.01; ***, P < 0.001; ****, P < 0.0001. MO, mo.
Aggravated pathological changes in the brains of Hgsnat P304L mice. (A) Astromicrogliosis in brain hippocampal and cortex regions of MPS IIIC mice is indicative of neuroimmune response. Panels show representative confocal microscopy images of brain tissues of 4-mo-old Hgsnat-Geo and HgsnatP304L mice and their age-matched WT controls stained with antibodies against CD68 (red) and GFAP (green) markers for activated microglia and astrocytes, respectively. DAPI (blue) was used as a nuclear counterstain. Graphs show quantification of fluorescence with ImageJ software. Individual data, means, and SD obtained for five mice per genotypes (three areas/mouse) are shown. P values were calculated using nested one-way ANOVA test with Tukey post hoc test. (B) Total brain tissues of HgsnatP304L mice show increased expression of inflammation markers, MIP1α, and TNFα compared with Hgsnat-Geo mice. The cytokine mRNA levels are normalized for the RLP32 mRNA content. Data show individual data, means, and SD. Five to eight mice were analyzed for each genotype. P values were calculated using one-way ANOVA with Tukey post hoc test. (C–F) Somatosensory cortices (layers 4–5) of HgsnatP304L mice show increased levels of markers of impaired autophagy and proteolysis compared with Hgsnat-Geo and/or age-matched WT mice: cytoplasmic LC3-positive puncta (C), granular autofluorescent ceroid materials (D), amyloid-β protein (AP; E), and misfolded SCMAS (F). Panels show representative confocal microscopy images of brain tissues of 4-mo-old (A, B, and D) or 6-mo-old (C, E, and F) Hgsnat-Geo, HgsnatP304L, and WT mice. Bars represent 20 µm in A and C, 100 and 25 µm in D, and 25 µm in E and F. Fluorescence was quantified with ImageJ software. Graphs show individual data, means, and SD obtained for five mice per genotype (three areas/mouse). P values were calculated using nested one-way ANOVA test with Tukey post hoc test. (G) Alteration of sphingolipid levels in the brains of Hgsnat-Geo and HgsnatP304L mice. Levels of glycans produced by enzymatic cleavage of total sphingolipid extracts of brain tissues from WT, Hgsnat-Geo, and HgsnatP304L 2-, 4-, and 6-mo-old mice were measured by normal HPLC. The values show percentage of the specific lipid. Pooled samples of three mice per age per genotype were analyzed. (H) Increased levels of GM2 ganglioside in the brains of Hgsnat-Geo and HgsnatP304L mice. Confocal microscopy images of brain cortex and hippocampus tissues of individual Hgsnat-Geo, HgsnatP304L, and WT 4-mo-old mice stained with antibodies against GM2 (green) and NeuN (red). DAPI (blue) was used as the nuclear counterstain. Scale bar equals 15 µm. Graphs show results of quantification performed using ImageJ software. Individual data, means, and SD obtained for five mice per genotypes (three areas/mouse) are shown. P values were calculated using nested one-way ANOVA test with Tukey post hoc test. *, P < 0.05; **, P < 0.01; ***, P < 0.001; ****, P < 0.0001. MO, mo.
The presence of LC3+ puncta was detected in cortical layer 4–5 pyramidal neurons of both Hgsnat-Geo and HgsnatP304L mice, but not of WT mice at 6 mo, suggesting an autophagy block (Fig. 4 C). Neurons of the same layers also contained increased levels of enlarged autofluorescent ceroid materials visible already at 4 mo (Fig. 4 D). Importantly, the number of cells containing autofluorescent material was significantly increased in HgsnatP304L compared with Hgsnat-Geo mice, suggesting that the progression of this pathology is accelerated in the knock-in model. At 6 mo, neurons of the same layers were heavily stained with antibodies against the amyloid-β protein (AP; Fig. 4 E) or misfolded subunit C of mitochondrial ATP synthase (SCMAS; Fig. 4 F). Together, these data are suggestive of mitophagy block and a general impairment of proteolysis.
Levels of simple gangliosides GM2 and GM3 are drastically increased in the brains of MPS IIIA-D patients (Viana et al., 2020) and in the knockout MPS IIIC mouse model (Martins et al., 2015). To analyze if they are also induced in the brain of HgsnatP304L mice, glycosphingolipids were extracted from the pooled brain tissues of 2-, 4-, and 6-mo-old mice. Analysis of their fluorescently labeled glycan chains by normal-phase HPLC (Fig. 4 G) demonstrated that brain glycosphingolipid composition was significantly altered in both HgsnatP304L and Hgsnat-Geo mice, but, on average, changes in the HgsnatP304L mice were more pronounced. The most drastic changes were observed in the levels of GM3 (approximately sevenfold increase in HgsnatP304L and approximately sixfold increase in Hgsnat-Geo mice), followed by GM2 (five- and fourfold increases, respectively) and GA2 (three- and twofold increases, respectively). Interestingly, HgsnatP304L mice showed a trend for a progressive increase in the levels of these gangliosides in contrast to Hgsnat-Geo mice, in which the levels remained similar at all studied ages. No changes were observed for complex gangliosides GM1a, GD1a, GD1b, and GT1b.
To confirm the HPLC results, we analyzed the presence and distribution of GM2 ganglioside in brain tissues by immunohistochemistry, using the human-mouse chimeric monoclonal antibody, KM966 (Nakamura et al., 1994). Numerous KM966+ neurons were present in the somatosensory cortex layers 4–5 and CA1 region of the hippocampus of both HgsnatP304L and Hgsnat-Geo mice. However, in both brain regions, the amounts of GM2+ cells were significantly increased in the knock-in compared with knockout mice (Fig. 4 H).
Aggravated pathological alterations in gene expression and increased levels of protein markers of unfolded protein response (UPR) and ER stress in the brains of HgsnatP304L mice
To get insight into the molecular mechanisms underlying the severe phenotype of HgsnatP304L mice, we performed a bulk analysis of gene expression levels in the hippocampi of 4-mo-old mice by RNA sequencing. Three mice (one female and two male) were analyzed for each genotype. The expression levels of each gene were compared between the HgsnatP304L and Hgsnat-Geo strains, as well as between each of the MPS IIIC strains and the corresponding WT controls.
A higher number of hippocampal genes with altered expression levels was found in HgsnatP304L (439 upregulated, 127 downregulated) compared with Hgsnat-Geo mice (221 upregulated, 124 downregulated; Fig. S2 A and Table S1). These genes were classified according to their biological function and linked to metabolic or signaling pathways using automated Gene Ontology (GO) terms annotation (Huang et al., 2009). The pathways involved in synaptic transmission (30–60% of all genes in the pathway) and neuronal growth/differentiation (10–30% of all genes) showed major downregulation in both strains (Fig. 5, A and B). Importantly, the expression levels of the genes involved in GABAergic neurotransmission were reduced only in the HgsnatP304L mice but not in Hgsnat-Geo mice, which was consistent with more pronounced defects in the inhibitory synapses detected in the knock-in mice by electrophysiology experiments (Fig. 5 A).
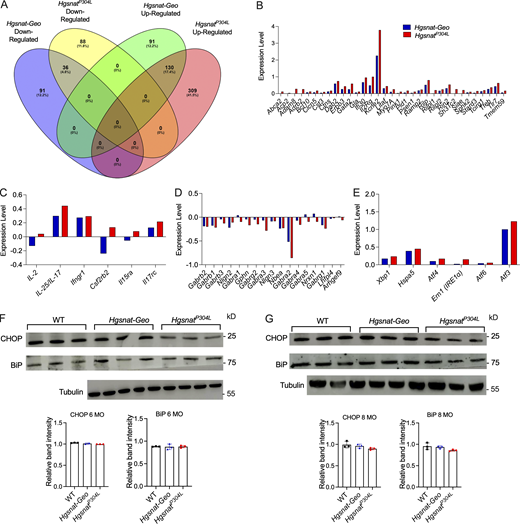
ER stress and UPR in the brain tissues of HgsnatP304Lmice. (A) A higher number of hippocampal genes with altered expression levels is found in HgsnatP304L than in Hgsnat-Geo mice. Venn diagram showing the number of genes that were upregulated or downregulated in hippocampal tissues of 4-mo-old HgsnatP304L and Hgsnat-Geo mice compared with the age- and sex-matched WT mice. Three mice (two male and one female) were studied for each genotype. (B–E) The expression levels of genes involved in lysosomal biogenesis (B), inflammatory response (C), and ER stress/UPR (E) show a trend for a greater increase, while the expression of genes involved in inhibitory synaptic transmission (D) show a trend for further decrease in HgsnatP304L compared with Hgsnat-Geo mice. (F and G) Normal protein levels the ER stress markers, CHOP and BiP, are detected in brain cortex tissues of 6-mo-old (F) and 8-mo-old (G) WT, HgsnatP304L, and Hgsnat-Geo mice by immunoblot. Graphs show band intensity values measured using ImageJ software. Individual results, means, and SD of experiments with three mice per genotype, per age are shown. P values were calculated using one-way ANOVA with Tukey post hoc test. Source data are available for this figure: SourceData FS2.
ER stress and UPR in the brain tissues of HgsnatP304Lmice. (A) A higher number of hippocampal genes with altered expression levels is found in HgsnatP304L than in Hgsnat-Geo mice. Venn diagram showing the number of genes that were upregulated or downregulated in hippocampal tissues of 4-mo-old HgsnatP304L and Hgsnat-Geo mice compared with the age- and sex-matched WT mice. Three mice (two male and one female) were studied for each genotype. (B–E) The expression levels of genes involved in lysosomal biogenesis (B), inflammatory response (C), and ER stress/UPR (E) show a trend for a greater increase, while the expression of genes involved in inhibitory synaptic transmission (D) show a trend for further decrease in HgsnatP304L compared with Hgsnat-Geo mice. (F and G) Normal protein levels the ER stress markers, CHOP and BiP, are detected in brain cortex tissues of 6-mo-old (F) and 8-mo-old (G) WT, HgsnatP304L, and Hgsnat-Geo mice by immunoblot. Graphs show band intensity values measured using ImageJ software. Individual results, means, and SD of experiments with three mice per genotype, per age are shown. P values were calculated using one-way ANOVA with Tukey post hoc test. Source data are available for this figure: SourceData FS2.
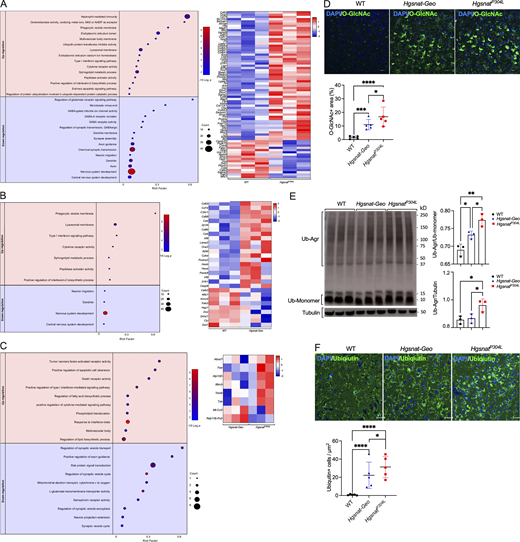
Aggravated pathological alterations in the gene expression and increased levels of protein markers of UPR and the ER stress in the brains of HgsnatP304Lmice. (A–C) Hippocampal mRNA profiling in 4-mo-old MPS IIIC mice reveals increased expression of genes involved in lysosomal, lipid synthesis, and proinflammatory processes and reduced expression of genes involved in synaptic transmission, vesicular transport, and neurogenesis. Dot plots (left) show significantly enriched GO terms (biological processes, molecular functions, and cellular components) and heatmaps (right) of the genes significantly upregulated and downregulated in the hippocampi of HgsnatP304L mice compared with WT mice (A), Hgsnat-Geo mice compared with WT mice (B), and HgsnatP304L mice compared with Hgsnat-Geo mice (C). GO terms are plotted in the order of gene ratios, and each pathway is shown as a circle with the color representing the P values (−log10) and the size representing the number of differentially expressed genes. The heatmap colors and their intensity show changes in gene expression levels. Data were obtained by sequencing mRNA samples extracted from three mice per genotype. (D) Brain cortex of HgsnatP304L 6-mo-old mice shows increased levels of O-GlcNAc–modified proteins compared with Hgsnat-Geo and WT mice. Panels show representative images of brain cortex (layers 4–5) immunostained for O-GlcNAc (green). DAPI (blue) was used as a nuclear counterstain. Scale bar equals 25 µm. Graphs show results of quantification performed using ImageJ software. Individual data, means, and SD obtained for five mice per genotype (three areas/mouse) are shown. P values were calculated using nested one-way ANOVA test with Tukey post hoc test. (E) Increased levels of ubiquitinated protein aggregates are detected in the brain homogenates of HgsnatP304L mice by immunoblotting. Graphs show combined intensities (individual values, means, and SD) of protein ubiquitin+ bands, quantified with ImageJ software and normalized by either intensity of tubulin bands or bands of ubiquitin monomers. Three mice per genotype were analyzed. P values were calculated using ANOVA with Tukey post hoc test. (F) Somatosensory cortex (layers 4–5) of HgsnatP304L mice shows increased levels of pyramidal neurons containing cytoplasmic ubiquitin+ materials. Panels show representative confocal microscopy images of brain tissues, stained for ubiquitin, of 6-mo-old Hgsnat-Geo, HgsnatP304L, and WT mice. Scale bar equals 25 µm. Graph shows results of quantification performed using ImageJ software. Individual data, means, and SD obtained for five mice per genotypes (three areas/mouse) are shown. P values were calculated using nested one-way ANOVA test with Tukey post hoc test. *, P < 0.05; **, P < 0.01; ***, P < 0.001; ****, P < 0.0001. Source data are available for this figure: SourceData F5.
Aggravated pathological alterations in the gene expression and increased levels of protein markers of UPR and the ER stress in the brains of HgsnatP304Lmice. (A–C) Hippocampal mRNA profiling in 4-mo-old MPS IIIC mice reveals increased expression of genes involved in lysosomal, lipid synthesis, and proinflammatory processes and reduced expression of genes involved in synaptic transmission, vesicular transport, and neurogenesis. Dot plots (left) show significantly enriched GO terms (biological processes, molecular functions, and cellular components) and heatmaps (right) of the genes significantly upregulated and downregulated in the hippocampi of HgsnatP304L mice compared with WT mice (A), Hgsnat-Geo mice compared with WT mice (B), and HgsnatP304L mice compared with Hgsnat-Geo mice (C). GO terms are plotted in the order of gene ratios, and each pathway is shown as a circle with the color representing the P values (−log10) and the size representing the number of differentially expressed genes. The heatmap colors and their intensity show changes in gene expression levels. Data were obtained by sequencing mRNA samples extracted from three mice per genotype. (D) Brain cortex of HgsnatP304L 6-mo-old mice shows increased levels of O-GlcNAc–modified proteins compared with Hgsnat-Geo and WT mice. Panels show representative images of brain cortex (layers 4–5) immunostained for O-GlcNAc (green). DAPI (blue) was used as a nuclear counterstain. Scale bar equals 25 µm. Graphs show results of quantification performed using ImageJ software. Individual data, means, and SD obtained for five mice per genotype (three areas/mouse) are shown. P values were calculated using nested one-way ANOVA test with Tukey post hoc test. (E) Increased levels of ubiquitinated protein aggregates are detected in the brain homogenates of HgsnatP304L mice by immunoblotting. Graphs show combined intensities (individual values, means, and SD) of protein ubiquitin+ bands, quantified with ImageJ software and normalized by either intensity of tubulin bands or bands of ubiquitin monomers. Three mice per genotype were analyzed. P values were calculated using ANOVA with Tukey post hoc test. (F) Somatosensory cortex (layers 4–5) of HgsnatP304L mice shows increased levels of pyramidal neurons containing cytoplasmic ubiquitin+ materials. Panels show representative confocal microscopy images of brain tissues, stained for ubiquitin, of 6-mo-old Hgsnat-Geo, HgsnatP304L, and WT mice. Scale bar equals 25 µm. Graph shows results of quantification performed using ImageJ software. Individual data, means, and SD obtained for five mice per genotypes (three areas/mouse) are shown. P values were calculated using nested one-way ANOVA test with Tukey post hoc test. *, P < 0.05; **, P < 0.01; ***, P < 0.001; ****, P < 0.0001. Source data are available for this figure: SourceData F5.
The most upregulated groups of genes were those encoding lysosomal and autophagosomal proteins, sphingolipid biosynthesis genes, and genes involved in inflammatory and innate immune response, consistent with induced lysosomal biogenesis, alterations of ganglioside levels, and inflammation observed in the mouse brains (Fig. 5, A and B). Specifically, several lysosomal (including Arsg, Ctsc, Ctsz, Ctsd, Npc2, and Slc12A4) and inflammatory genes showed a significant increase only in HgsnatP304L but not in Hgsnat-Geo mice, mirroring higher levels of lysosomal storage and neuroimmune response in the 4-mo-old knock-in animals (Fig. 5 A).
A direct comparison of HgsnatP304L and Hgsnat-Geo expression profiles did not reveal significant changes in the expression of a gene or genes that could be directly responsible for the enhanced pathology in the knock-in mice. However, the pathways related to inflammation, cytokine production, apoptosis, and lipid biosynthesis were upregulated, while those involved in synaptic function, neurogenesis, and mitochondrial biogenesis and function, downregulated in HgsnatP304L compared with Hgsnat-Geo mice. Besides, compared with WT mice, the levels of genes related to lysosomal/endosomal biogenesis (such as Kcne2, Tfeb, Cst3, Gata2, Rilp, Pld1, Tlr7, and Tmem59) and inflammatory response (Tlr7, Il-2, Il-25/Il-17, Ifngr1, Csf2rb2, Il15ra, and Il17rc) showed a trend for a bigger increase in HgsnatP304L than in Hgsnat-Geo mice (Fig. S2, B and C). In similar fashion, genes involved in inhibitory synapse showed a trend for bigger reduction (Fig. S2 D).
Interestingly, a similar trend was observed for Xbp1, Atf4, Ern1, Atf6, Atf3, and Hspa5 genes, which induction has been previously associated with the ER stress and UPR (Fig. S2 E). This suggested a higher degree of the ER stress and UPR in the brain cells expressing the misfolded HGSNAT enzyme. To test this further, we have analyzed brain tissues by immunohistochemistry using antibodies against O-linked GlcNAc glycan and found increased levels of O-GlcNAc–modified proteins, an indication of the ER stress often associated with impaired cellular proteolysis (Chatham and Marchase, 2010), in the CA1 and cortical neurons of HgsnatP304L compared with Hgsnat-Geo mice (Fig. 5 D). We have also found increased levels of polyubiquitinated protein aggregates in the homogenates of dissected cortices of HgsnatP304L compared with Hgsnat-Geo mice (Fig. 5 E). This was consistent with the increased number of pyramidal neurons containing ubiquitin-positive materials in somatosensory cortex layers 4 and 5 of HgsnatP304L compared with Hgsnat-Geo mice (Fig. 5 F). These results, together, confirmed higher levels of ER stress and UPR in the neurons of the knock-in MPS IIIC mice. Other markers of ER stress, C/EBP homologous protein (CHOP) and BiP, did not show an increase in the brains of HgsnatP304L compared with Hgsnat-Geo mice at either 6 or 8 mo (Fig. S2, F and G).
Expression of the P304L HGSNAT variant in hippocampal cultured neurons of Hgsnat-Geo mice causes ER stress and aggravates deficits in the expression of synaptic proteins and synaptic architecture
To test directly whether the expression of the mutant Pro311Leu human HGSNAT variant aggravates neuronal dysfunction, we expressed it in the primary cultured hippocampal neurons of Hgsnat-Geo mice. To confirm that the Pro311Leu variant caused misfolding of the HGSNAT protein and its retention in the ER, we transduced HEK293 cells and human cultured skin fibroblasts with the lentiviral vectors (LVs) that encode the WT HGSNAT-GFP fusion protein and its Pro311Leu variant. Cells expressing GFP marker were isolated by cell sorting and propagated. As expected, we detected highly increased HGSNAT activity in the cells overexpressing human WT HGSNAT, while the activity in the cells overexpressing the mutant variant was similar to that of nontransduced cells (Fig. S3 A). The WT protein was correctly processed as detected by the appearance of a 29-kD band on the Western blot (Fig. S3 B). It was also showing a “halo-like” pattern around the LysoTracker Red–stained lysosomes on the images obtained by a high-resolution confocal fluorescent microscopy suggesting that it was correctly targeted to the lysosomal membrane (Fig. S3 C). In contrast, the mutant HGSNAT-GFP fusion protein was detected only in the form of a 75-kD precursor (Fig. S3 B) and did not show any colocalization with LysoTracker Red or P115-stained Golgi apparatus (Fig. S3, C and D). Instead, it was retained in the ER as demonstrated by its colocalization with the ER marker, Calreticulin (Fig. S3 F). In both fibroblasts (Fig. S3, C and D) and HEK293 cells (data not shown), Pro311Leu HGSNAT-GFP protein also formed cytoplasmic aggregates.

The missense variant Pro311Leu affects expression, lysosomal targeting, processing, and enzymatic activity of HGSNAT. (A) Pro311Leu HGSNAT mutant lacks enzymatic activity. The N-acetyltransferase activity was measured in homogenates of primary cultured skin fibroblasts of healthy control donor (Control) or fibroblasts transduced with LV vectors encoding for the GFP-tagged WT HGSNAT (LV-HGSNAT) or the Pro311Leu mutant (LV-P311L-HGSNAT). The graph shows individual values, means, and SD of three independent experiments. P values were calculated by one-way ANOVA followed by Tukey post hoc test; ****, P < 0.0001. (B) The 75-kD (with EGFP tag) nonglycosylated precursor is the main HGSNAT form detected in the homogenates of cells transduced with the mutant virus, while the fully glycosylated 83-kD precursor and the cleaved 29-kD α-subunit are detected in cells expressing the WT enzyme. The 50-kD band represents a nonspecific cross-reacting protein also present in nontransduced cells. The panel shows a representative blot from three independent experiments yielding similar results. (C and D) The Pro311Leu HGSNAT mutant protein is not targeted to lysosomes. Representative confocal images show fibroblast cells transduced with LV vectors encoding for the GFP-tagged WT HGSNAT (LV-HGSNAT) and or the Pro311Leu mutant (LV-P311L-HGSNAT). (E) Cells grown on glass slides were labeled with Lysotracker Red for 1 h before fixation (C) or stained for the ER (anti-Calreticulin antibodies; D) or Golgi (anti-P115 antibodies; E; red). Scale bar equals 10 μm. Panels show typical images of triplicate experiments.
The missense variant Pro311Leu affects expression, lysosomal targeting, processing, and enzymatic activity of HGSNAT. (A) Pro311Leu HGSNAT mutant lacks enzymatic activity. The N-acetyltransferase activity was measured in homogenates of primary cultured skin fibroblasts of healthy control donor (Control) or fibroblasts transduced with LV vectors encoding for the GFP-tagged WT HGSNAT (LV-HGSNAT) or the Pro311Leu mutant (LV-P311L-HGSNAT). The graph shows individual values, means, and SD of three independent experiments. P values were calculated by one-way ANOVA followed by Tukey post hoc test; ****, P < 0.0001. (B) The 75-kD (with EGFP tag) nonglycosylated precursor is the main HGSNAT form detected in the homogenates of cells transduced with the mutant virus, while the fully glycosylated 83-kD precursor and the cleaved 29-kD α-subunit are detected in cells expressing the WT enzyme. The 50-kD band represents a nonspecific cross-reacting protein also present in nontransduced cells. The panel shows a representative blot from three independent experiments yielding similar results. (C and D) The Pro311Leu HGSNAT mutant protein is not targeted to lysosomes. Representative confocal images show fibroblast cells transduced with LV vectors encoding for the GFP-tagged WT HGSNAT (LV-HGSNAT) and or the Pro311Leu mutant (LV-P311L-HGSNAT). (E) Cells grown on glass slides were labeled with Lysotracker Red for 1 h before fixation (C) or stained for the ER (anti-Calreticulin antibodies; D) or Golgi (anti-P115 antibodies; E; red). Scale bar equals 10 μm. Panels show typical images of triplicate experiments.
We further transduced primary hippocampal neurons of Hgsnat-Geo mice with either LV-HGSNAT-GFP or LV-P311L-HGSNAT-GFP to detect whether mutant protein expression aggravated synaptic defects. The cells were studied by immunocytochemistry to detect markers of synaptic vesicles (Syn1), GABAergic (VGAT/Gephyrin), and glutamatergic (VGLUT1/PSD-95) synapses. Nontransduced neurons of WT, HgsnatP304L, and Hgsnat-Geo mice were studied for comparison.
Analysis of nontransduced cells confirmed that neurons from both HgsnatP304L and Hgsnat-Geo mice showed a similar reduction in density of Syn1+ puncta along the MAP2-stained dendrites as well as of PSD95+ in juxtaposition with VGLUT1+ puncta (Fig. 6, A–C) compared with WT neurons. This was consistent with our electrophysiology results, demonstrating that glutamatergic synapse is similarly affected in both strains. In contrast, the number of Gephyrin+/VGAT+ puncta in juxtaposition was reduced in neurons from HgsnatP304L but not in those from Hgsnat-Geo mice, confirming that the GABAergic synapse is affected only in the knock-in mice (Fig. 6 C).

Expression of mouse P304L and human P311L mutant HGSNAT variants aggravates GABAergic synaptic defects in cultured primary hippocampal mouse neurons. (A) Hippocampal neurons from HgsnatP304L and Hgsnat-Geo mice show reduction in density of Syn1+ puncta in proximity to MAP2+ dendrites compared with WT cells. The levels of Syn1+ puncta are rescued by expression of WT active human HGSNAT but not of the P311L variant. (B) Hippocampal neurons from HgsnatP304L and Hgsnat-Geo mice show an equal reduction in density of PSD-95+/VGLUT1+ puncta in juxtaposition. The levels of PSD-95+/VGLUT1+ puncta in juxtaposition are rescued by expression of WT active human HGSNAT but not of the P311L variant. (C) Densities of Gephyrin+/VGAT+ puncta in juxtaposition are reduced in neurons from HgsnatP304L mice but not from Hgsnat-Geo mice compared with WT cells. Primary hippocampal neurons of Hgsnat-Geo mice transduced with LV-P311L-HGSNAT show reduction of Gephyrin+/VGAT+ puncta in juxtaposition compared with WT and nontransduced Hgsnat-Geo cells. The panels show representative confocal images of neurons and enlargements of selected axonal and dendritic fragments. Scale bars equal 40 μm. Graphs show results of puncta quantification with ImageJ software. Puncta were quantified in 20-μm-long segments of dendrite or axon, 30 μm away from the neuronal soma. Individual data, means, and SD from three independent cultures, each involving pooled embryos from at least three mice per genotype, are shown. For each culture, 5–10 neurons were analyzed. P values were calculated using nested one-way ANOVA test with Tukey post hoc test. *, P < 0.05; **, P < 0.01; ***, P < 0.001; ****, P < 0.0001.
Expression of mouse P304L and human P311L mutant HGSNAT variants aggravates GABAergic synaptic defects in cultured primary hippocampal mouse neurons. (A) Hippocampal neurons from HgsnatP304L and Hgsnat-Geo mice show reduction in density of Syn1+ puncta in proximity to MAP2+ dendrites compared with WT cells. The levels of Syn1+ puncta are rescued by expression of WT active human HGSNAT but not of the P311L variant. (B) Hippocampal neurons from HgsnatP304L and Hgsnat-Geo mice show an equal reduction in density of PSD-95+/VGLUT1+ puncta in juxtaposition. The levels of PSD-95+/VGLUT1+ puncta in juxtaposition are rescued by expression of WT active human HGSNAT but not of the P311L variant. (C) Densities of Gephyrin+/VGAT+ puncta in juxtaposition are reduced in neurons from HgsnatP304L mice but not from Hgsnat-Geo mice compared with WT cells. Primary hippocampal neurons of Hgsnat-Geo mice transduced with LV-P311L-HGSNAT show reduction of Gephyrin+/VGAT+ puncta in juxtaposition compared with WT and nontransduced Hgsnat-Geo cells. The panels show representative confocal images of neurons and enlargements of selected axonal and dendritic fragments. Scale bars equal 40 μm. Graphs show results of puncta quantification with ImageJ software. Puncta were quantified in 20-μm-long segments of dendrite or axon, 30 μm away from the neuronal soma. Individual data, means, and SD from three independent cultures, each involving pooled embryos from at least three mice per genotype, are shown. For each culture, 5–10 neurons were analyzed. P values were calculated using nested one-way ANOVA test with Tukey post hoc test. *, P < 0.05; **, P < 0.01; ***, P < 0.001; ****, P < 0.0001.
Transduction of neurons from Hgsnat-Geo mice with LV HGSNAT-GFP rescued levels of synaptic protein markers (dendrite-associated Syn1 puncta, VGLUT1+ puncta in juxtaposition with PSD-95+ puncta; Fig. 6, A–C). In contrast, the Hgsnat-Geo neurons expressing mutant Pro311Leu HGSNAT-GFP protein showed levels of inhibitory VGAT+/Gephyrin+ synaptic puncta in juxtaposition significantly lower than those in the nontransduced cells (Fig. 6 D). The levels of excitatory VGLUT+/PSD-95+ puncta in juxtaposition in Hgsnat-Geo neurons expressing Pro311Leu HGSNAT-GFP showed a nonsignificant trend for reduction. Together, these results confirm that expression of Pro311Leu HGSNAT aggravates synaptic deficits caused by deficiency of HGSNAT activity and HS storage. Moreover, it expands the locus of the deficit toward the inhibitory GABAergic synapse.
Treatment of HgsnatP304L mice with a PC, glucosamine, partially restores the activity of the mutant enzyme and ameliorates clinical phenotype
A competitive inhibitor of HGSNAT, glucosamine, rescues folding and activity of the missense HGSNAT variants in cultured skin fibroblasts from MPS IIIC patients (Feldhammer et al., 2009b). Thus, we tested whether, by reducing the load of the misfolded Pro304Leu protein, this drug ameliorates the clinical phenotype in HgsnatP304L mice. Importantly, mice tolerate well chronic oral daily doses of glucosamine ≤2.0 g/kg, and it can penetrate the brain parenchyma (Popov, 1985).
First, we tested if glucosamine increases deficient HGSNAT activity in cultured MEF cells of HgsnatP304L mice. The compound was added daily in a range of concentrations (inhibitory constant [Ki] 3–10) to the cell culture medium, for a total of 5 d. Then, the cells were cultured overnight in the medium without glucosamine, harvested, and lysed to measure HGSNAT activity. Glucosamine in the concentration of 7 mM (Ki 10) had the maximal effect, increasing the residual activity ∼1.5-fold (Fig. 7 A). We further tested the drug in a group of 12 male and 12 female homozygous HgsnatP304L mice and 12 male and 12 female WT mice. Starting from the age of 3 wk (after weaning), mice were administered water supplemented with 10 mg/ml glucosamine. Similar-size control groups of WT and homozygous HgsnatP304L mice received normal drinking water. After 7 d, three mice from each group were sacrificed, and HGSNAT activity was measured in the homogenates of their brain tissues. The remaining animals continued to be treated until the age of 16 wk, when they were studied by the YM and NOR behavior tests and sacrificed at the age of 18 wk to measure HGSNAT activity, HS levels, and pathological changes in the CNS tissues. To test if chronic consumption of glucosamine results in major metabolic changes, mouse BW was measured monthly, and blood glucose levels were analyzed as described previously (Fougerat et al., 2018). No difference between treated and untreated HgsnatP304L mice was detected for both parameters (Fig. S4, A–C), although, for an unknown reason, the blood glucose level in treated HgsnatP304L mice was slightly lower than in untreated WT mice.

Hgsnat P304L mice treated with glucosamine show significant increase of HGSNAT activity in brain and liver tissues, reveal delay in development of deficits in memory and learning, and partial rescue of synaptic protein markers in the CA1 area of the hippocampus. (A) HGSNAT activity, measured using the fluorogenic substrate, muf-β-D-glucosaminide, was increased in cultured MEF cells of homozygous HgsnatP304L mice with glucosamine (+GA) for 5 d compared with untreated cells. Graph shows individual results, means, and SD of experiments conducted with four to six different cell cultures, each established from pooled tissues of three mice. (B–D) HGSNAT activity is also increased in the brain (B and C) and liver (D) tissue homogenates of 4-mo-old HgsnatP304L mice treated with glucosamine (+GA) for 1 wk (B) or 13 wk (C and D) compared with untreated HgsnatP304L mice of the same age. (E and F) No decrease in total β-hexosaminidase activity in both organs was detected for HgsnatP304L mice treated with glucosamine for 13 wk. Individual results, means and SD from experiments performed with 6–10 mice per genotype, per treatment are shown. P values were calculated using an unpaired t test. (G–I)HgsnatP304L mice, treated with glucosamine, show rescue or a trend for improvement of deficits in spatial/short-term memory in the YM test (G) and short-term memory in the NOR test at the age of 4 mo (H and I) compared with untreated HgsnatP304L mice. Individual results, means and SD from experiments performed with 24 mice per genotype, per treatment are shown. P values were calculated using one-way ANOVA with Tukey post hoc test. (J) Deficient levels of protein markers of glutamatergic synaptic neurotransmission, VGUT1 and PSD-95, are rescued in the CA1 hippocampal area of HgsnatP304L mice, treated with glucosamine at the age of 4 mo. Panels show representative images of brain cortex (layers 4–5) and CA1 area of the hippocampus, stained for PSD-95 (red) and VGLUT1 (green), of 4-mo-old WT and HgsnatP304L mice treated or not with glucosamine. Scale bar equals 15 µm. The graph shows quantification of fluorescence with ImageJ software. Individual results, means, and SD from experiments performed with five mice per genotype (three areas/mouse), per treatment are shown. P values were calculated using nested one-way ANOVA test with Tukey post hoc test. (K) Deficient level of synaptic vesicular protein Syn-1 is rescued in the somatosensory cortex area of HgsnatP304L mice, treated with glucosamine at the age of 4 mo. Panels show representative images of brain cortex (layers 4–5) and CA1 area of the hippocampus, stained for PSD-95 (red) and Syn1 (green), of 4-mo-old WT, and HgsnatP304L mice treated or not with glucosamine. Scale bar equals 15 µm. The graph shows quantification of fluorescence with ImageJ software. Individual results, means, and SD from experiments performed with five mice per genotype (three areas/mouse), per treatment are shown. P values were calculated using nested one-way ANOVA test with Tukey post hoc test. *, P < 0.05; **, P < 0.01; ***, P < 0.001; ****, P < 0.0001.
Hgsnat P304L mice treated with glucosamine show significant increase of HGSNAT activity in brain and liver tissues, reveal delay in development of deficits in memory and learning, and partial rescue of synaptic protein markers in the CA1 area of the hippocampus. (A) HGSNAT activity, measured using the fluorogenic substrate, muf-β-D-glucosaminide, was increased in cultured MEF cells of homozygous HgsnatP304L mice with glucosamine (+GA) for 5 d compared with untreated cells. Graph shows individual results, means, and SD of experiments conducted with four to six different cell cultures, each established from pooled tissues of three mice. (B–D) HGSNAT activity is also increased in the brain (B and C) and liver (D) tissue homogenates of 4-mo-old HgsnatP304L mice treated with glucosamine (+GA) for 1 wk (B) or 13 wk (C and D) compared with untreated HgsnatP304L mice of the same age. (E and F) No decrease in total β-hexosaminidase activity in both organs was detected for HgsnatP304L mice treated with glucosamine for 13 wk. Individual results, means and SD from experiments performed with 6–10 mice per genotype, per treatment are shown. P values were calculated using an unpaired t test. (G–I)HgsnatP304L mice, treated with glucosamine, show rescue or a trend for improvement of deficits in spatial/short-term memory in the YM test (G) and short-term memory in the NOR test at the age of 4 mo (H and I) compared with untreated HgsnatP304L mice. Individual results, means and SD from experiments performed with 24 mice per genotype, per treatment are shown. P values were calculated using one-way ANOVA with Tukey post hoc test. (J) Deficient levels of protein markers of glutamatergic synaptic neurotransmission, VGUT1 and PSD-95, are rescued in the CA1 hippocampal area of HgsnatP304L mice, treated with glucosamine at the age of 4 mo. Panels show representative images of brain cortex (layers 4–5) and CA1 area of the hippocampus, stained for PSD-95 (red) and VGLUT1 (green), of 4-mo-old WT and HgsnatP304L mice treated or not with glucosamine. Scale bar equals 15 µm. The graph shows quantification of fluorescence with ImageJ software. Individual results, means, and SD from experiments performed with five mice per genotype (three areas/mouse), per treatment are shown. P values were calculated using nested one-way ANOVA test with Tukey post hoc test. (K) Deficient level of synaptic vesicular protein Syn-1 is rescued in the somatosensory cortex area of HgsnatP304L mice, treated with glucosamine at the age of 4 mo. Panels show representative images of brain cortex (layers 4–5) and CA1 area of the hippocampus, stained for PSD-95 (red) and Syn1 (green), of 4-mo-old WT, and HgsnatP304L mice treated or not with glucosamine. Scale bar equals 15 µm. The graph shows quantification of fluorescence with ImageJ software. Individual results, means, and SD from experiments performed with five mice per genotype (three areas/mouse), per treatment are shown. P values were calculated using nested one-way ANOVA test with Tukey post hoc test. *, P < 0.05; **, P < 0.01; ***, P < 0.001; ****, P < 0.0001.

Mice treated daily with 2.0 g/kg BW glucosamine (GA) for 13 wk do not show alterations in growth and BW, blood glucose levels, or astro- and microgliosis in brain tissues. (A and B) BW was measured monthly, between the ages of 1 and 3 mo. Mean values and SD obtained for 12 mice per genotype, per sex, per treatment are shown. (C) The blood glucose levels were tested at the age of 4 mo. Individual data, means, and SD obtained for ≥24 mice per genotype, per treatment are shown. P values were measured using two-way ANOVA (A and B) and one-way ANOVA (C) with Tukey post hoc tests. (D) Levels of activated CD68+ microglia and GFAP+ astrocytes are not changed in the hippocampus and somatosensory cortex of 4-mo-old HgsnatP304L mice treated with glucosamine. Panels show representative images of somatosensory cortex (layers 4–5) and hippocampus of 4-mo-old WT, and HgsnatP304L mice treated or not with glucosamine and stained for GFAP (green) and CD68 (red). Scale bars equal 25 µm. Bar graph shows quantification of CD68+ and GFAP+ area with ImageJ software. Individual results, means, and SD of experiments with five mice per genotype, per treatment are shown. P values were calculated using nested one-way ANOVA test with Tukey post hoc test. **, P < 0.01; ***, P < 0.001; ****, P < 0.0001.
Mice treated daily with 2.0 g/kg BW glucosamine (GA) for 13 wk do not show alterations in growth and BW, blood glucose levels, or astro- and microgliosis in brain tissues. (A and B) BW was measured monthly, between the ages of 1 and 3 mo. Mean values and SD obtained for 12 mice per genotype, per sex, per treatment are shown. (C) The blood glucose levels were tested at the age of 4 mo. Individual data, means, and SD obtained for ≥24 mice per genotype, per treatment are shown. P values were measured using two-way ANOVA (A and B) and one-way ANOVA (C) with Tukey post hoc tests. (D) Levels of activated CD68+ microglia and GFAP+ astrocytes are not changed in the hippocampus and somatosensory cortex of 4-mo-old HgsnatP304L mice treated with glucosamine. Panels show representative images of somatosensory cortex (layers 4–5) and hippocampus of 4-mo-old WT, and HgsnatP304L mice treated or not with glucosamine and stained for GFAP (green) and CD68 (red). Scale bars equal 25 µm. Bar graph shows quantification of CD68+ and GFAP+ area with ImageJ software. Individual results, means, and SD of experiments with five mice per genotype, per treatment are shown. P values were calculated using nested one-way ANOVA test with Tukey post hoc test. **, P < 0.01; ***, P < 0.001; ****, P < 0.0001.
Brain residual levels of HGSNAT activity were significantly increased, although by a small margin, already after 7 d of treatment with glucosamine (Fig. 7 B). A similar increase was also observed in the brains of 5-mo-old mice, after 13 wk of treatment (Fig. 7 C). The level of HGSNAT activity measured in the liver of treated HgsnatP304L mice was also increased compared with that of untreated mice (Fig. 7 D). However, no difference in total β-hexosaminidase activity was observed between treated and untreated mice (Fig. 7, E and F).
When mouse memory and learning were tested using YM, we observed a significant increase in the percentage of alternations between the maze arms in treated mice, suggesting a rescue of the memory deficit (Fig. 7 G). In the NOR test, WT mice spent more time exploring a novel than a familiar object, showing a positive discrimination index, whereas untreated HgsnatP304L mice spent equal time exploring both objects or spent more time with a familiar object (negative discrimination index), showing signs of repetitive behavior (Fig. 7 H). For treated mice, we observed a significant increase in the discrimination index and the percentage of time spent with a novel object (Fig. 7, H and I). Together, these data suggest that deficits in short-term memory in HgsnatP304L mice were delayed by glucosamine treatment. Consistent with memory improvements, we also observed a partial rescue of the deficient protein marker of the excitatory synapse, VGLUT1, and a synaptic protein Syn1 in the hippocampal CA1 neurons of treated HgsnatP304L mice (Fig. 7, J and K). At the same time, the deficient levels of PSD-95 in HgsnatP304L mice were not increased by the treatment (Fig. 7 J).
To test if delayed memory impairment in treated HgsnatP304L mice coincided with a reduction in the development of brain pathology, we analyzed fixed brain slices of treated and untreated HgsnatP304L mice, as well as their WT counterparts, for markers of primary and secondary storage (HS/LAMP2 and GM2 ganglioside, respectively), micro- and astrogliosis (CD68 and GFAP, respectively), and misfolded protein accumulation (SCMAS, auto-fluorescent ceroid materials, and O-GlcNAc–modified proteins). These biomarkers were prioritized because, as described above, they were a key for discriminating between the aggravated phenotype of HgsnatP304L and a milder phenotype of Hgsnat-Geo mice. In addition, we studied GAG levels and the levels of ubiquitinated protein aggregates.
The pathological features showing the best response to glucosamine treatment were an accumulation of autofluorescent ceroid materials (Fig. 8 A) and misfolded SCMAS (Fig. 8 B) in the deep cortical pyramidal neurons, as well as accumulation of GM2 ganglioside in pyramidal neurons of somatosensory cortex and CA1 area of the hippocampus (Fig. 8 C). All three biomarkers were reduced in treated mice almost to the levels observed in the WT mice of similar age. The level of total brain HS measured by LC-MS/MS analysis showed modest but significant reduction in mouse brain homogenates; however, it still remained at a significantly higher level than in WT mice (Fig. 8 D). The LC-MS/MS data were supported by the results of immunohistochemistry that has revealed a significant reduction of HS+ areas in the pyramidal neurons of both cortex and hippocampus (Fig. 8 E). The size and abundance of lysosomes (LAMP2+ area) showed significant reduction only in the cortex and just a trend for reduction in the hippocampus (Fig. 8 E). At the same time, glucosamine treatment did not change the severity of astromicrogliosis, one of the hallmarks of CNS pathology in MPS IIIC and other neurological MPS diseases. The levels of CD68+ cells were similar for untreated and treated mice in the cortex and hippocampus, whereas GFAP+ cells were unchanged in the cortex, but, for an unknown reason, increased in the hippocampus of treated mice (Fig. S4 D). The levels of ubiquitinated protein aggregates and O-GlcNAc–modified proteins were still undetectable at 4 mo of age in the brains of both treated and untreated HgsnatP304L mice as well as WT mice (data not shown).

The levels of biomarkers of CNS pathology in the somatosensory cortex are normalized and brain storage of HS is reduced in Hgsnat P304L mice treated with glucosamine. (A) Reduction of granular autofluorescent ceroid material in cortical neurons. Panels show representative images of brain cortex (layers 4–5) of 4-mo-old WT and HgsnatP304L mice treated or not with glucosamine (GA) showing autofluorescent ceroid inclusions in the neurons (green). Scale bar equals 100 µm (upper panels) and 25 µm (lower panel). The graph shows quantification of autofluorescence with ImageJ software. (B) Reduction of GM2 ganglioside in cortical neurons. Panels show representative images of somatosensory cortex (layers 4–5) of 4-mo-old WT, and HgsnatP304L mice treated or not with glucosamine showing immunostaining for GM2 ganglioside and NeuN. DAPI was used as a nuclear counterstain. Scale bar equals 100 µm (upper panels) and 25 µm (lower panel). The bar graph shows quantification of GM2 staining with ImageJ software. (C) Reduction of misfolded SCMAS aggregates in cortical neurons. Panels show representative images of somatosensory cortex (layers 4–5), stained for SCMAS, of 4-mo-old WT and HgsnatP304L mice treated or not with glucosamine. DAPI (blue) was used as a nuclear counterstain. Scale bar equals 100 µm (upper panels) and 25 µm (lower panel). The bar graph shows quantification of SCMAS staining with ImageJ software. All graphs show individual data, means, and SD obtained for five mice per genotype per treatment (three areas/mouse). P values were calculated using nested one-way ANOVA test with Tukey post hoc test. (D) Levels of disaccharides produced by enzymatic digestion of HS (ΔDiHS-0S and ΔDiHS-NS), measured by MS/MS, are reduced in brain tissues of 4-mo-old HgsnatP304L mice treated with glucosamine. All graphs show individual data, means, and SD obtained for five to six mice per genotype per treatment. P values were calculated using two-way ANOVA test with Tukey post hoc test. (E) Reduction of HS+ and LAMP2+ puncta in cortical neurons. Panels show representative images of brain cortex (layers 4–5) and CA1 region of hippocampus, stained for LAMP2 (green) and HS (red), of 4-mo-old WT and HgsnatP304L mice, treated or not with glucosamine. Scale bar equals 25 µm. Graphs show quantification of HS and LAMP2 staining with ImageJ software. All graphs show individual results, means, and SD from experiments conducted with five mice (three panels per mouse) per genotype per treatment. P values were calculated using nested one-way ANOVA test with Tukey post hoc test. *, P < 0.05; **, P < 0.01; ***, P < 0.001; ****, P < 0.0001.
The levels of biomarkers of CNS pathology in the somatosensory cortex are normalized and brain storage of HS is reduced in Hgsnat P304L mice treated with glucosamine. (A) Reduction of granular autofluorescent ceroid material in cortical neurons. Panels show representative images of brain cortex (layers 4–5) of 4-mo-old WT and HgsnatP304L mice treated or not with glucosamine (GA) showing autofluorescent ceroid inclusions in the neurons (green). Scale bar equals 100 µm (upper panels) and 25 µm (lower panel). The graph shows quantification of autofluorescence with ImageJ software. (B) Reduction of GM2 ganglioside in cortical neurons. Panels show representative images of somatosensory cortex (layers 4–5) of 4-mo-old WT, and HgsnatP304L mice treated or not with glucosamine showing immunostaining for GM2 ganglioside and NeuN. DAPI was used as a nuclear counterstain. Scale bar equals 100 µm (upper panels) and 25 µm (lower panel). The bar graph shows quantification of GM2 staining with ImageJ software. (C) Reduction of misfolded SCMAS aggregates in cortical neurons. Panels show representative images of somatosensory cortex (layers 4–5), stained for SCMAS, of 4-mo-old WT and HgsnatP304L mice treated or not with glucosamine. DAPI (blue) was used as a nuclear counterstain. Scale bar equals 100 µm (upper panels) and 25 µm (lower panel). The bar graph shows quantification of SCMAS staining with ImageJ software. All graphs show individual data, means, and SD obtained for five mice per genotype per treatment (three areas/mouse). P values were calculated using nested one-way ANOVA test with Tukey post hoc test. (D) Levels of disaccharides produced by enzymatic digestion of HS (ΔDiHS-0S and ΔDiHS-NS), measured by MS/MS, are reduced in brain tissues of 4-mo-old HgsnatP304L mice treated with glucosamine. All graphs show individual data, means, and SD obtained for five to six mice per genotype per treatment. P values were calculated using two-way ANOVA test with Tukey post hoc test. (E) Reduction of HS+ and LAMP2+ puncta in cortical neurons. Panels show representative images of brain cortex (layers 4–5) and CA1 region of hippocampus, stained for LAMP2 (green) and HS (red), of 4-mo-old WT and HgsnatP304L mice, treated or not with glucosamine. Scale bar equals 25 µm. Graphs show quantification of HS and LAMP2 staining with ImageJ software. All graphs show individual results, means, and SD from experiments conducted with five mice (three panels per mouse) per genotype per treatment. P values were calculated using nested one-way ANOVA test with Tukey post hoc test. *, P < 0.05; **, P < 0.01; ***, P < 0.001; ****, P < 0.0001.
Discussion
Correction of a primary genetic defect by either enzyme replacement or gene therapy/hematopoietic stem cell gene therapy remains the major approach for developing novel treatments for neurological MPS, including Sanfilippo disease. However, outcomes of all recent clinical trials involving MPS III patients are either still unknown or failed to produce desired effects, prompting researchers to explore novel alternative treatments. In particular, approaches based on the use of small-molecule drugs to reduce neuroinflammation (Parker et al., 2020; NCT04018755 clinical trial), activate autophagy (Lotfi et al., 2018; Monaco et al., 2020), reduce or block stored HS (De Pasquale et al., 2021), rescue activity/expression of the mutant enzymes (Feldhammer et al., 2009b; Matos et al., 2014), and stimulate translational readthrough of premature termination codons (Gomez-Grau et al., 2015) have been described.
Development of a chaperone therapy for MPS IIIC requires a generation of a novel murine model expressing misfolded HGSNAT protein. For this purpose, we selected a Pro304Leu mutation, an analog of a pathological human variant Pro311Leu, which we previously identified in severely affected MPS IIIC patients (Feldhammer et al., 2009a; Feldhammer et al., 2009b; Martins et al., 2019). Now, we show that the knock-in HgsnatP304L mouse has a drastically aggravated clinical phenotype compared with our previously developed gene-targeted Hgsnat-Geo mouse model, with a constitutive disruption of gene expression (Martins et al., 2015). In particular, the onset of behavioral abnormalities for the knock-in HgsnatP304L mouse was observed at 4 mo, at least 2–3 mo before that in the Hgsnat-Geo mouse. In addition, the lifespan was reduced by ∼20 wk compared with the Hgsnat-Geo mouse, and, at sacrifice, HgsnatP304L mice showed a pronounced enlargement of kidney, liver, and spleen, unlike Hgsnat-Geo mice, which had only mild hepatomegaly. Most of the CNS disease progression biomarkers, including neuroimmune response, astromicrogliosis, and accumulation of primary and secondary storage materials, were aggravated in HgsnatP304L mice compared with Hgsnat-Geo mice of the same age. Moreover, the severity of synaptic deficits in CA1 and cultured HgsnatP304L hippocampal neurons was increased and expanded to the GABAergic synapse. Because the residual brain level of HGSNAT acetyltransferase activity, measured with the specific BODIPY-glucosamine substrate, was reduced to below detection levels in both strains, we speculate that the difference in the clinical severity is most likely related to a toxicity of the mutant misfolded HGSNAT P304L variant expressed in the cells of the HgsnatP304L mouse.
RNA sequencing analysis of mouse hippocampi demonstrated that the same types of pathways were altered in both knockout and knock-in compared with WT mice. In particular, lysosomal biogenesis was increased, as well as the pathways related to inflammatory and immune response. On the other hand, the expression of genes involved in neurogenesis and synaptic transmission was decreased. However, the number of significantly changed pathways (especially of those related to GABAergic synapse) and the degree of gene alterations were higher in the HgsnatP304L mouse, reflecting an increased severity of CNS pathology. Several pathways induced in the HgsnatP304L mouse were related to ER stress/UPR. This, together with the increased levels of ER stress biomarkers (O-GlcNAc–modified proteins, ubiquitinated protein aggregates) detected in the hippocampal and cortical pyramidal neurons in the knock-in mouse, prompted us to hypothesize that expression of the HGSNAT mutant misfolded variant puts an additional constraint on the ER in these cells. This can further impair proteasomal protein degradation (Bifsha et al., 2007) and, together with autophagy block, can result in aggravated neuronal dysfunction, accumulation of toxic misfolded protein aggregates, neuroimmune response, and eventually neurodegeneration. In accordance with this hypothesis, we observed a similar level of a primary substrate, HS, in the brains, plasma, and urine of Hgsnat-Geo and HgsnatP304L mice. However, the levels of LAMP2+ neuronal puncta and β-hexosaminidase activity in the brains of HgsnatP304L mice were significantly higher. Because both markers reflect increased lysosomal biogenesis, we speculate that misfolded protein response poses an additional stress on the lysosomal system and causes increased storage of the secondary metabolites: gangliosides, ceroid materials, and misfolded proteins. Because the presence of storage bodies in axonal spheroids disrupts axonal transport and causes deficiency of synaptic vesicles (Pará et al., 2021), this could also translate to further aggravation of synaptic phenotypes.
To test this hypothesis, we transduced cultured hippocampal neurons established from embryos of Hgsnat-Geo mice with LVs expressing either human WT HGSNAT or the P311L HGSNAT variant. In preliminary experiments, we demonstrated that the mutant HGSNAT protein was misfolded, did not have any enzymatic activity, was not proteolytically processed, did not undergo targeting to Golgi or lysosomes, and was retained in the ER. Moreover, when overexpressed, it formed cytoplasmic inclusions. When levels of synaptic proteins in cultured hippocampal Hgsnat-Geo neurons overexpressing WT human HGSNAT enzyme were compared to those in nontransduced cells from WT, Hgsnat-Geo, and HgsnatP304L mice, we observed a complete rescue of the markers of inhibitory and excitatory synapses. In contrast, neurons overexpressing the mutant P311L enzyme showed a reduction in the density of inhibitory synapses and further reduction in the density of excitatory synapses to the levels detected in the HgsnatP304L neurons. These results directly confirm that the mutant P311L HGSNAT protein is responsible for the aggravation of synaptic deficits, especially those affecting the GABAergic synapse that are known to lead to seizures and autistic behavioral features (Chao et al., 2010). Further natural history study is required to establish whether human MPS IIIC patients with missense mutations resulting in protein misfolding also present an aggravated phenotype; however, our recent analysis of a large group of novel Brazilian patients suggests that they are at least as severely affected as those having nonsense mutations or indels (Martins et al., 2019).
We attempted to reduce the burden caused by the misfolded mutant enzyme in the HgsnatP304L mice by treating them with glucosamine, a known HGSNAT chaperone. This compound increases the levels of residual HGSNAT activity in cultured fibroblasts of human MPS IIIC patients with several missense mutations, including P311L (Feldhammer et al., 2009b). A similar effect was observed in the current study in MEF cells of HgsnatP304L mice, confirming that the drug also has a beneficial effect on the mouse P304L HGSNAT mutant. Thus, glucosamine was provided to the mutant mice in drinking water and was well tolerated. The treatment was started in asymptomatic mice at weaning and conducted for 13 wk until the mice were 4 mo old. At this time point, behavioral testing revealed a rescue or partial rescue of defects in short-term, working, and spatial memory. Analysis of CNS pathology showed significantly reduced defects in cortical pyramidal and hippocampal CA1 neurons associated with the disease phenotype, including accumulation of autofluorescent ceroid material, primary (HS) and secondary (GM2 ganglioside, unfolded SCMAS) storage materials, and induced lysosomal biogenesis. However, the treatment failed to reduce the number of astrocytes and microglia, which stayed drastically elevated in both cortex and hippocampus. As we reported previously (Martins et al., 2015), activation of microglial cells is caused by secreted oligomers of HS that act directly on TLR-4 receptors (Ausseil et al., 2008). A similar mechanism could also underlie activation of astrocytes, although we could not detect lysosomal storage in this type of cells (Martins et al., 2015). Because the HS storage is reduced only partially, neuroinflammation remains unaffected in treated mice. It is tempting to speculate that these biomarkers, although important for assessment of overall CNS pathology progression, do not directly correlate with behavioral deficits. In contrast, the reduced levels of synaptic proteins VGLUT1 and Syn1 in the hippocampus were rescued by glucosamine therapy, once again reinforcing our previous conclusion that synaptic defects underlie the behavioral changes in MPS IIIC mice (Pará et al., 2021). Future studies, however, are required to confirm whether glucosamine also improves electrophysiological phenotypes in treated mice or increases their longevity.
The residual HGSNAT activity in the brain and liver of treated mice showed a moderate (∼1.5-fold) but statistically significant increase, suggesting a partial rescue of the mutant enzyme. Nevertheless, we cannot exclude the possibility that glucosamine induced the expression of an unknown acetyltransferase or hydrolase active against unacetylated muf-β-glucosaminide substrate. Although we have observed promising behavioral improvement, it remains to be determined whether such a small increase in the residual HGSNAT activity and HS catabolism is sufficient to produce a long-term correction of the clinical phenotype in HgsnatP304L mice. It also remains to be determined whether glucosamine treatment would lead to any improvements in the knockout Hgsnat-Geo mice. Alternatively, glucosamine can reduce the pool of the misfolded HGSNAT variant accumulating in the ER, thus decreasing the load on ubiquitin-mediated protein degradation pathway and ER stress. Paradoxically, glucosamine, which is known to induce the ER stress and UPR in multiple types of cells (reviewed in Beriault and Werstuck [2012]), did not induce ER stress markers in the brain of treated mice, including accumulation of ubiquitinated aggregates, or levels of O-GlcNAc–modified proteins, which at 4 mo remained at the normal level in both treated and untreated groups.
Administration of glucosamine in concentrations of 1–2 g/kg/d, similar to those we used in this study, is safe in mice, but in humans it is hardly achievable (Miller and Clegg, 2011). Thus, identifying HGSNAT chaperones with higher potency and bioavailability either by library screening or by a rational design is required before such an approach can be tested in human patients. Besides, since glucosamine does not increase residual activity of the deficient N-sulfoglucosamine sulfohydrolase enzyme in the cultured fibroblasts of MPS IIIA patients affected with missense mutations (unpublished data), specific chaperones must be identified for other subtypes of MPS III. Importantly, our current study establishes that, while secondary accumulation of misfolded proteins and gangliosides shows a drastic response to chaperone treatment, neuroimmune response is not reduced. This suggests that the efficacy of chaperone therapy can be further improved when combined with drugs that primarily address neuroimmune response, such as recently described blockers of the IL-1β pathways (Parker et al., 2020).
In conclusion, the results of this study validate the novel HgsnatP304L mouse strain as a model closely mimicking the phenotype of the early-onset, fast-progressing MPS IIIC patients, useful for testing prognostic biomarkers of the disease and novel therapies. It also suggests that introducing mutations with CRISPR/Cas9 may be a better approach for generation of animal models of lysosomal storage disorders than producing constitutive knockouts. Importantly, our work establishes that misfolded mutant HGSNAT protein expression is a key contributing factor for the pathophysiology of MPS IIIC and suggests that treatment with chaperones capable of rescuing the folding process of such mutants should be considered as a possible therapy for this disease.
Materials and methods
Murine models
Approval for animal experimentation was granted by the Animal Care and Use Committee of the Sainte-Justine Hospital Research Center. Mice were housed in an enriched environment with continuous access to food and water, under constant temperature and humidity, on a 12-h light/dark cycle. Mice were kept on a normal chow diet (5% fat, 57% carbohydrate). Hgsnat-Geo mice have been previously described (Martins et al., 2015). HgsnatP304L knock-in C57Bl/6J mouse strain was generated at McGill Integrated Core for Animal Modeling using CRISPR/Cas9 technology, targeting exon 9 of the Mus musculus gene Hgsnat. To generate knock-in founders, a single guide nucleotide RNA (sgRNA) was designed using the CRISPR online tool (http://crispr.mit.edu) to target a genomic site on the murine Hgsnat locus with minimal potential off-target effects. sgRNA and Cas9 mRNA were microinjected into zygotes with single-stranded oligodeoxynucleotide, barring a c.911C˃T mutation encoding for the P304L change (Fig. S1 A; 100 ng/μl single-stranded oligodeoxynucleotide, 20 ng/μl sgRNA, and 20 ng/μl Cas9).
The zygotes were further cultured overnight in EmbryoMax KSOM drops (Millipore) covered with mineral oil (Irvine Scientific) in a 35-mm dish at 37°C in a 5% CO2 incubator. The embryos, which developed up to the 2-cell stage, were transferred to oviducts of pseudo-pregnant females to generate chimeric mouse litters. Pups were delivered at full term and, at weaning, were genotyped by Sanger sequencing of single allele fragments, obtained by PCR amplification of genomic DNA from tail clips. The adult founder mice containing the allele with the desired mutation were mated with C57Bl/6N mice (Envigo). Genotypes of the offspring were determined by amplifying a 988-bp product from purified mouse tail DNA (forward primer: 5′-ATGGAGTGCCTGATGGGAGG-3′; reverse primer: 5′-GATCTAGAAACGGCCCGAAGA-3′). Because the c.911C ˃T mutation eliminated the NcoI restriction site, to distinguish between mutant and WT amplicons, the PCR products were further digested with NcoI (Cat# R3193S; New England Biolabs) at 37°C for 1 h and then run on a 2% agarose gel. Fragments of 688 and 300 bp were detected for the WT allele and an undigested 988-bp fragment for the targeted HgsnatP304L allele (Fig. S1, B and C). To test for the presence of potential off-target effects, the sgRNA sequence (5′-TGAACGTCGCCAGGTCGCGG-3′) was blasted against the Mus musculus genome. Fragments of 763 bp of the Spg7 gene exon 7, presenting the highest identity score, were amplified by PCR from genomic DNA of F1 and WT mice (forward primer: 5′-CTTTTGGAGCTGTGGCCCTA-3′; reverse primer: 5′-AGTGGAAGATTTTGCCAGGC-3′) and analyzed by Sanger sequencing for the presence of deleterious variants. This analysis did not reveal mutations in the Spg7 gene in the F1 generation (Fig. S1, D and E). The F1 mice were bred to C57Bl/6J mice to generate heterozygous mice that were further backcrossed to C57Bl/6J for four generations to eliminate mutations resulting from potential off-target effects, not predicted by BLAST (Basic Local Alignment Search Tool) analysis. Finally, the heterozygous pairs were bred to generate WT, heterozygote, and homozygous mutants. In all experiments WT littermates were used as a control.
Sex consideration
Equal cohorts of male and female mice were studied separately for each experiment, and statistical methods were used to test whether the progression of the disease, levels of biomarkers, or response to therapy were different between male and female animals. Because differences between sexes were not detected, the data for male and female mice and cells were pooled together.
Enzyme activity assays
The specific enzymatic activities of HGSNAT, β-hexosaminidase, and β-galactosidase were assayed essentially as previously described (Martins et al., 2015). Tissues extracted from mice or pellets of cultured cells were snap-frozen in liquid nitrogen before storage at −80°C. 50-mg samples were homogenized in 250 µl of H2O using a sonic homogenizer (Artek Systems Corp.). Cultured MEF cells were harvested by scraping and lysed in H2O by 10-s sonication on ice (60 W). For HGSNAT assays, 5-µl aliquots of the homogenates were combined with 5 µl of McIlvain buffer (pH 5.5), 5 µl of 3 mM 4-methylumbelliferyl-β-D-glucosaminide (Moscerdam), 5 µl of 5 mM acetyl-coenzyme A, and 5 µl H2O. The reaction was incubated for 3 h at 37°C and stopped with 975 µl of 0.4 M glycine buffer (pH 10.4), and fluorescence was measured using a ClarioStar plate reader (BMG Labtech). Blank samples were incubated without the homogenates, which were added after the glycine buffer.
The activity of β-hexosaminidase was measured by combining 2.5 μl of 10× diluted homogenate (∼2.5 ng of protein) with 15 μl of 0.1 M sodium acetate buffer (pH 4.2), and 12.5 µl of 3 mM 4-methylumbelliferyl N-acetyl-β-D-glucosaminide (Sigma-Aldrich) followed by incubation for 30 min at 37°C. The reaction was stopped with 0.4 M glycine buffer (pH 10.4), and fluorescence was measured as above.
The activity of acidic β-galactosidase was measured by adding 12.5 µl of 0.4 M sodium acetate, 0.2 M NaCl (pH 4.2), and 12.5 µl of 1.5 mM 4-methylumbelliferyl β-D-galactoside (Sigma-Aldrich) to 10 μl of 10× diluted homogenate (∼1 ng protein). After 15-min incubation at 37°C, the reaction was stopped with 0.4 M glycine buffer (pH 10.4), and fluorescence was measured as above.
HGSNAT N-acetyltransferase activity assay with BODIPY-glucosamine substrate in brain homogenates was performed by combining 6 µl of homogenate (∼6 µg protein), 6 µl McIlvain’s phosphate/citrate buffer (pH 6.5), 4 µl of 10 mM acetyl CoA in H2O, and 4 µl of 40 mM BODIPY-glucosamine (Choi et al., 2015). After incubation for 3 h at 37°C in a 96-well PCR plate (BioScience), the reaction was terminated by the addition of 180 µl of 100 mM HCl. 20-µl aliquots of the final reaction mixture were transferred to a 96-well filter plate (Millipore; 40-mm nylon mesh) pre-embedded with 100 µl Toyopearl cation exchange media SP 650M (Tosoh) for each well. Before the assay, the resin was washed twice with 250 µl H2O per well, and the plates were centrifuged at 50 g for 30 s to remove any excess water. The fluorescent neutral reaction product was eluted with four 90-µl aliquots of 1 M HCl by centrifugation of the plates at 50 g for 30 s. Combined eluent (360 µl) was transferred to 96-well Reader Black polystyrene plates (Life Science), and the amount of fluorescent product was measured.
Behavioral analysis
The spontaneous alternation behavior, spatial working memory, and exploratory activity of mice were evaluated using a white YM as previously described (Pan et al., 2017). The maze consisted of three identical white Plexiglas arms (40 × 10 × 20 cm, 120° apart) under dim lighting conditions. Each mouse was placed at the end of one arm, facing the center, and allowed to explore the maze for 8 min. All experiments were performed at the same time of day and by the same investigator to avoid circadian and handling bias. Sessions were video-recorded, and arm entries were scored by a trained observer unaware of the mouse genotype or treatment. Successful alternation was defined as consecutive entries into a new arm before returning to the two previously visited arms. Alternation was calculated as (number of alternations/total number of arm entries − 2) × 100.
NOR test was used for assessing short-term recognition memory (Akkerman et al., 2012; Antunes and Biala, 2012). Mice were placed individually in a 44 × 33 × 20-cm (length × width × height) testing chamber with white Plexiglas walls for a 10-min habituation period and returned to their home cage. The next day, mice were placed in the testing chamber for 10 min with two identical objects (red plastic towers, 3 × 1.5 × 4.5 cm) and returned to the home cages, and 1 h later, were placed back into the testing chamber in the presence of one of the original objects and one novel object (a blue plastic base, 4.5 × 4.5 × 2 cm) for 10 min. After each mouse, the test arena as well as the plastic objects were cleaned with 70% ethanol to avoid olfactory cue bias. The discrimination index (DI) was calculated as the difference in the exploration time between the novel and old object divided by total exploration time. A preference for the novel object was defined as DI significantly >0 (Ennaceur and Delacour, 1988). Mice who showed a side preference, noted as DI ± 0.20 during the familiarization period, and those who had a total exploration time <3 s were excluded from analysis.
The OF test was performed as previously described (Amegandjin et al., 2021). Briefly, mice were habituated in the experimental room for 45 min before commencement of the test. Each mouse was then gently placed in the center of the OF arena and allowed to explore for 20 min. The mouse was removed and transferred to its home cage after the test, and the arena was cleaned with 70% ethanol before commencement of the next test. Analysis of behavioral activity was done using Smart video tracking software (v3.0; Panlab Harvard Apparatus); the total distance traveled and percentage of time spent in the center zone were measured for hyperactivity and anxiety assessment, respectively.
The elevated plus maze test was performed as described by Amegandjin et al. (2021). Each mouse was placed in the center of the elevated plus maze and allowed to freely explore undisturbed for 10 min. After each testing, the mouse was returned to the home cage and the arena was cleaned with 70% ethanol before commencement of the next test. Analysis of behavioral activity (percentage of time spent in the center zone, closed arms, and open arms and the number of open arm entries) was done in Smart v3.0 software.
TEM
At 3 and 6 mo, three mice from each group were anesthetized with sodium pentobarbital (50 mg/kg) and perfused with PBS, followed by 2.5% glutaraldehyde in 0.2 M phosphate buffer (pH 7.2). The brains were extracted and postfixed in the same fixative for 24 h at 4°C. The hippocampi were dissected, mounted on glass slides, stained with toluidine blue, and examined on a Leica DMS light microscope to select the CA1 region of the hippocampus for EM. The blocks were further embedded in Epon, and 100-nm ultrathin sections were cut with an Ultracut E ultramicrotome, mounted on 200-mesh copper grids, stained with uranyl acetate (Electron Microscopy Sciences) and lead citrate, and examined on a FEI Tecnai 12 TEM. For quantification, the micrographs were taken with 13,000 and 30,000× magnification.
Neuronal cultures
Primary hippocampal neurons were cultured from the brains of embryos at gestational day 16 (E16). The hippocampi were isolated and treated with 2.5% trypsin solution (T4674; Sigma-Aldrich) for 15 min at 37°C. The cells were washed three times with HBSS (14025-092; Gibco) and mechanically dissociated by pipetting, using glass Pasteur pipettes with three different opening sizes (3, 2, and 1 mm). The cells were counted with the viability dye trypan blue (15250061; Thermo Fisher Scientific) using a hemocytometer and resuspended in Neurobasal media (21103-049; Gibco) containing L-glutamine, B27, N2, penicillin, and streptomycin. The cells were plated at a density of 60,000 cells per well, respectively, in a 12-well plate on coverslips previously coated with poly-L-lysine (P9155; Sigma-Aldrich). Cells were cultured for 21 d, and 50% of medium was changed every 3 d.
Whole-cell recordings in acute hippocampal slices
Acute hippocampal slices were prepared as described (Croce et al., 2010). Briefly, animals were anaesthetized deeply with isoflurane and decapitated. The brain was dissected carefully and transferred rapidly into an ice-cold (0–4°C) solution containing 250 mM sucrose, 2 mM KCl, 1.25 mM NaH2PO4, 26 mM NaHCO3, 7 mM MgSO4, 0.5 mM CaCl2, and 10 mM glucose (pH 7.4). The solution was oxygenated continuously with 95% O2 and 5% CO2, 330–340 mOsm/liter. Transverse hippocampal slices (thickness, 300 µm) were cut using a vibratome (VT1000S; Leica Microsystems), transferred to a bath at room temperature (23°C) with standard artificial cerebral spinal fluid (ACSF) at pH 7.4 containing 126 mM NaCl, 3 mM KCl, 1 mM NaH2PO4, 25 mM NaHCO3, 2 mM MgSO4, 2 mM CaCl2, and 10 mM glucose, continuously saturated with 95% O2 and 5% CO2, and allowed to recover for 1 h. During the experiments, slices were transferred to the recording chamber at physiological temperature (30–33 °C) continuously perfused with standard ACSF, as described above, at 2 ml/min. Pyramidal CA1 neurons from the hippocampus were identified visually using a 40× water-immersion objective. Whole-cell patch-clamp recordings were obtained from single cells in voltage- or current-clamp mode, and only one cell per slice was recorded to enable post hoc identification and immunohistochemical processing. Recording pipettes (4–6 MΩ) were filled with a K-gluconate–based solution for voltage-clamp recordings (130 mM K-gluconate, 10 mM KCl, 5 mM diNa-phosphocreatine, 10 mM Hepes, pH 7.4, 2.5 mM MgCl2, 0.5 mM CaCl2, 1 mM EGTA, 3 mM ATP-Tris, 0.4 mM GTP-Li, and 0.3% biocytin, 280–290 mOsm/liter).
After obtaining whole-cell configuration, passive membrane properties were monitored for 5 min, and current clamp recordings were done to measure action potential characteristics. Slices were then perfused with 0.5 μM tetrodotoxin (TTX; to isolate miniature events) for 3 min before commencing voltage clamp recordings. Cells were voltage clamped at −70 mV for mEPSCs recording and then held at 0 mV (calculated from the reversal potential of Cl) for mIPSCs recording. Data acquisition (filtered at 2–3 kHz and digitized at 15 kHz; Digidata 1440A; Molecular Devices) was performed using the Axopatch 200B amplifier and the Clampex 10.6 software (Molecular Devices). Both mEPSCs and mIPSCs were recorded for 7 min and a running template on a stable baseline (minimum of 30 events) was used for the analysis of miniature events on MiniAnalysis. Clampfit 10.2 software was used for analysis of action potential characteristics and other passive membrane properties.
For some experiments, to verify that all mEPSCs are blocked, slices were perfused with 5 μM 6,7-dinitroquinoxaline-2,3-dione and 50 μM AP5 in addition to the TTX while recording mEPSCs at −70 mV after addition of α-amino-3-hydroxy-5-methyl-4-isoxazolepropionic acid and N-methyl-D-aspartate receptor blockers. Similarly, for some experiments, slices were perfused with 100 μM bicuculline methiodide and 50 μM AP5 in addition to the TTX in the ACSF to verify that all mIPSCs were blocked at 0 mV.
Real-time qPCR
RNA was isolated from snap-frozen brain, kidney, and liver tissues using TRIzol reagent (Invitrogen) and reverse-transcribed using iScript Reverse Transcription Supermix (#1708840; Bio-Rad) according to the manufacturer’s protocol. qPCR was performed using a LightCycler 96 Instrument (Roche) and SsoFast EvaGreen Supermix with Low ROX (#1725211; Bio-Rad) according to the manufacturer’s protocol. RLP32 mRNA was used as a reference control. The primers used are listed in Table 1.
Primers
| Gene | Sequence |
|---|---|
| Hgsnat forward | 5′-TAGGGGGTTAGCTCTCGTCC-3′ |
| Hgsnat reverse | 5′-CCTCGTTGCAGGATAGAAGTCA-3′ |
| MIPα forward | 5′-GCCCTTGCTGTTCTTCTCTG-3′ |
| MIPα reverse | 5′-CAGATCTGCCGGTTTCTCTT-3′ |
| TNFα forward | 5′-TCTTCTCATTCCTGCTTGTGG-3′ |
| TNFα reverse | 5′-CACTTGGTGGTTTGCTACGA-3′ |
| TGF1β forward | 5′-GTCAGACATTCGGGAAGCAG-3′ |
| TGF1β reverse | 5′-CTGCCGTACAACTCCAGTGA-3′ |
| RPL32 forward | 5′-TTCTTCCTCGGCGCTGCCTACGA-3′ |
| RPL32 reverse | 5′-AACCTTCTCCGCACCCTGTTGTCA-3′ |
RNA extraction and transcriptome sequencing
Total RNA was extracted from ∼30 mg of hippocampal tissue using the RNeasy Mini Kit (Qiagen), according to the manufacturer’s instructions. RNA was quantified using the NanoDrop 8000. Samples with a 28S/18S ratio >1.8, an OD 260/280 ratio >1.9 and an RNA integrity number >9 (Agilent Bioanalyzer 2100) were chosen for cDNA library construction. Library preparation and sequencing were performed at the Genomics Platform of the Institute for Research in Immunology and Cancer, Montreal. All cDNA libraries were sequenced using single-end strategy (40 M reads per sample) on an Illumina NextSeq500 platform with a read length of 75 bp (single-end mode). Raw data were converted to FASTQ files using bcl2fastq (v2.20) and allowed 0 mismatches in the multiplexing barcode. Data were analyzed by BioJupies using default parameters. Gene expression–level differences were accepted as statistically significant if they had a P value <0.05, and the result was visualized by an in-house Matlab code. The data are available at Sequence Read Archive website, accession number PRJNA832487 (https://www.ncbi.nlm.nih.gov/sra/PRJNA832487).
Normal-phase HPLC (NP-HPLC) for glycosphingolipids (GSLs) in mouse brain extracts
GSLs were analyzed essentially as described previously (Neville et al., 2004). Lipids from aqueous mouse brain homogenates (∼2.5 mg wet weight in 0.5 ml) were extracted with chloroform and methanol overnight at 4°C. The GSLs were then further purified using solid-phase C18 columns (Telos; Kinesis). After elution, the GSL fractions were dried down under a stream of nitrogen at 42°C and digested with recombinant endoglycoceramidase (rEGCase I, prepared by Genscript) to release the oligosaccharide headgroups. The liberated free glycans were then fluorescently labeled with anthranilic acid (2AA). To remove excess 2AA label, labeled glycans were purified using DPA-6S SPE columns (Supelco). Purified 2AA-labeled oligosaccharides were separated and quantified by NP-HPLC as previously described (Neville et al., 2004). The NP-HPLC system consisted of a Waters Alliance 2695 separations module and an in-line Waters 2475 multi λ-fluorescence detector set at excitation λ 360 nm and emission λ 425 nm. As a solid phase, a 4.6 × 250-mm TSK gel-Amide 80 column (Tosoh Bioscience) was used. A 2AA-labeled glucose homopolymer ladder (Ludger) was included to determine the glucose unit (GU) values for the HPLC peaks. Individual GSL species were identified by their GU values and quantified by comparison of integrated peak areas with a known amount of 2AA-labeled BioQuant chitotriose standard (Ludger). Protein concentration in homogenates was determined using the BCA assay (Sigma-Aldrich).
Immunohistochemistry
Mouse brains were collected from animals, perfused with 4% PFA in PBS, and postfixed in 4% PFA in PBS overnight. Brains were cryopreserved in 30% sucrose for 2 d at 4°C, embedded in Tissue-Tek OCT Compound, cut in 40-µm-thick sections, and stored in cryopreservation buffer (0.05 M sodium phosphate buffer, pH 7.4, 15% sucrose, and 40% ethylene glycol) at −20°C pending immunohistochemistry. Mouse brain sections were washed three times with PBS and permeabilized/blocked by incubating in 5% BSA and 0.3% Triton X-100 in PBS for 1 h at room temperature. Incubation with primary antibodies, diluted in 1% BSA and 0.3% Triton X-100 in PBS, was performed overnight at 4°C. The antibodies and working concentrations used are listed in Table 2.
Antigens and dilutions
| Antigen | Host/Target species | Dilution | Manufacturer |
|---|---|---|---|
| Synapsin-1 | Rabbit anti-mouse | 1:200 | Abcam (ab64581) |
| GFAP | Rabbit anti-mouse | 1:300 | DSHB (8-1E7-s) |
| LAMP2 | Rat anti-mouse | 1:200 | DSHB (ABL-93-s) |
| HS (10E4 epitope) | Mouse anti-mouse | 1:200 | AMSBIO (F58-10E4) |
| NeuN | Rabbit anti-mouse | 1:250 | Millipore Sigma (MABN140) |
| CD68 | Rabbit polyclonal to CD68 | 1:200 | Abcam (ab125212) |
| GM2 | Mouse humanized | 1:400 | KM966 |
| LC3B | Rabbit anti-mouse | 1:200 | GeneTex (GTX82986) |
| VGLUT1 | Rabbit anti-mouse | 1:1,000 (cells) and 1:200 (tissues) | Abcam (ab104898) |
| PSD-95 | Mouse anti-mouse | 1:1,000 (cells) and 1:200 (tissues) | Abcam (ab99009) |
| Ubiquitin | Mouse | 1:200 | Abcam (ab7254) |
| β-Amyloid (D54D2) | Rabbit anti-mouse | 1:200 | Cell Signaling (8243S) |
| SCMAS | Rabbit anti-mouse | 1:200 | Abcam (ab181243) |
| Anti-O-GlcNAc | Mouse anti-mouse | 1:400 | Kerafast (EJH004) |
| MAP2 | Chicken anti-mouse | 1:2,000 | Abcam (ab5392) |
| Vesicular γ aminobutyric acid (GABA) transporter vGAT | Rabbit anti-mouse | 1:1,000 | Synaptic Systems (131003) |
| Gephyrin | Mouse anti-mouse | 1:1,000 | Synaptic Systems (147021) |
| Calreticulin | Rabbit anti-human | 1:200 | Sigma-Aldrich (208910) |
| IgG | Goat anti-rabbit, anti-mouse, anti-rat, or anti-chicken Alexa Fluor 488–, Alexa Fluor 555–, or Alexa Fluor 633–conjugated | 1:400 | Thermo Fisher Scientific |
The mouse brain sections were washed three times with PBS and counterstained with Alexa Fluor–labeled secondary antibodies (dilution 1:400) for 2 h at room temperature. After washing three times with PBS, the mouse brain sections were treated with TrueBlack Lipofuscin Autofluorescence Quencher (23007, dilution 1:10; Biotium) for 1 min, and then again washed three times with PBS. The slides were mounted with Prolong Gold Antifade mounting reagent with DAPI (P36935; Invitrogen) and analyzed using a Leica DM 5500 Q upright confocal microscope (10×, 40×, and 63× oil objective, NA 1.4). Images were processed and quantified using ImageJ 1.50i software (National Institutes of Health) in a blinded fashion. Panels were assembled with Adobe Photoshop.
Immunocytochemistry
Cultured neurons on day in vitro 21 were fixed in 4% paraformaldehyde and 4% sucrose solution in PBS (pH 7.4). The cells were permeabilized with 0.1% Triton X-100 in PBS for 5 min, and nonspecific binding sites were blocked with 5% BSA in PBS for 1 h and incubated overnight at 4°C with primary antibodies in 1% BSA in PBS (see Table 2 for the source of antibodies and their dilutions). The next day, neurons were washed three times with PBS and labeled with Alexa Fluor 488– or Alexa Fluor 555–conjugated goat anti-rabbit or Alexa Fluor 633–anti-mouse IgG (1:1,000, all from Thermo Fisher Scientific) for 1 h at room temperature. Coverslips were washed three times again in PBS, mounted on slides using ProLong Gold mounting medium, containing DAPI (P36935; Invitrogen), and analyzed by LSM510 Meta Laser or Leica TCS SPE confocal microscopes (63× glycerol-immersion objectives, NA 1.4). Images were processed with Leica Application Suite X software and Photoshop 2021 (Adobe) and quantified using ImageJ 1.50i. Quantification was blinded and performed in at least three different experiments.
Western blot
Cerebral cortical tissues were homogenized in five volumes of radioimmunoprecipitation assay lysis buffer (50 mM Tris-HCl, pH 7.4, 150 mM NaCl, 1% NP-40, 0.25% sodium deoxycholate, 0.1% SDS, 2 mM EDTA, and 1 mM PMSF), containing protease and phosphate inhibitor cocktails (4693132001 and 4906837001; Sigma-Aldrich), using a Dounce homogenizer. The homogenates were kept on ice for 30 min and centrifuged at 13,000 g at 4°C for 25 min. The supernatant was centrifuged again at 13,000 g for 15 min, the protein concentration in resulting lysates was measured, and 20 µg of protein from each sample was separated by SDS-PAGE on 4–20% precast polyacrylamide gel (4561096; Bio-Rad). Western blot analyses were performed according to standard protocols using the following antibodies: anti-Grp78 (BiP; rabbit polyclonal, 1:2,000; Stressgen), CHOP (1:50, mouse; Developmental Studies Hybridoma Bank [DSHB]), anti-ubiquitin, (1:1,000, rabbit; Sigma-Aldrich), and α-tubulin (1:2,000, mouse; DSHB). Equal protein loading was confirmed by Ponceau S staining and normalized for tubulin immunoreactive band. Detected bands were quantified using ImageJ 1.50i software (National Institutes of Health).
Production of the LV for expression of WT and mutant human HGSNAT
The plasmid expressing missense HGSNAT mutant P304L was obtained by site-directed mutagenesis of previously described pENTR1A-HGSNAT-GFP plasmid, containing the codon-optimized cDNA of WT human HGSNAT fused at the C-terminus with GFP (Pará et al., 2021). HGSNAT-P311L-GFP cDNA was further subcloned to LV plasmid (pLenti CMV/TO Puro DEST [775-1], Plasmid #17432; Addgene; Campeau et al., 2009), using Gateway technology according to the manufacturer’s instructions (Gateway LR Clonase II Enzyme mix, #11791020; Invitrogen). To produce an LV expressing HGSNAT-P311L-GFP protein under the control of the CMV promotor, the HEK293T cells were cotransfected with pLenti-HGSNAT-P304L-GFP plasmid, the packaging plasmids REV (Plasmid #12253; Addgene) and pMDL (gag-pol; Plasmid #12251; Addgene), and the envelope plasmid VSVG (Plasmid#12259; Addgene) in the presence of Lipofectamine 2000 Transfection Reagent (11668019; Invitrogen). After 30 h, the cell medium containing lentivirus was collected and used to transfect primary mouse neurons or human skin fibroblasts.
Analysis of GAGs by LC-MS/MS
Analysis of brain glycans was conducted as previously described by Viana et al. (2020). Briefly, 30–50 mg of mouse brain tissues were homogenized in ice-cold acetone and centrifuged at 12,000 g for 30 min at 4°C. The pellets were dried, resuspended in 0.5 N NaOH, and incubated for 2 h at 50°C. Then, the pH of the samples was neutralized with 1 N HCl, and NaCl was added to the reaction mix in a final concentration of 3 M. After centrifugation at 10,000 g for 5 min at room temperature, the supernatants were collected and acidified using 1 N HCl. After another centrifugation at 10,000 g for 5 min at room temperature, the supernatants were collected and neutralized with 1 N NaOH to a pH of 7.0. The samples were diluted at a ratio of 1:2 with 1.3% potassium acetate in absolute ethanol and centrifuged at 12,000 g and 4°C for 30 min. The pellets were washed with cold 80% ethanol, dried at room temperature, and dissolved in 50 mM Tris-HCl buffer. The samples were further filtered using AcroPrep Advance 96-Well Filter Plates with Ultrafiltration Omega 10 K membrane filters (PALL Corp.) and digested with chondroitinase B, heparitinase, and keratanase II overnight at 37°C. The samples were analyzed by mass spectrometry using a 6460 Triple Quad instrument (Agilent Technologies) with Hypercarb columns, as described (Viana et al., 2020).
Glucosamine treatment
Starting from 3 wk of age, homozygous HgsnatP304L male (n = 24) and female (n = 24) mice were randomly divided in two equal groups. The control group was administered water, and for the treatment group, water was supplemented with 10 mg/ml glucosamine (G4875-25G; Sigma-Aldrich), which would result in a dose of ∼2.0 g/kg BW/d. The dose formulation was changed twice a week. The untreated WT group included male and female siblings of HgsnatP304L mice (n = 14 and 13, respectively). At 16 wk, all mice were studied by YM and NOR behavioral tests and sacrificed to analyze CNS pathology as described above (Galeano et al., 2007).
Statistical analysis
Statistical analyses were performed using Prism v9.3.0 software (GraphPad). The normality for all data was checked using the D’Agostino and Pearson omnibus normality test. Significance of the difference was determined using t test (normal distribution) or Mann–Whitney U test, when comparing two groups. One-way ANOVA or nested ANOVA tests, followed by Tukey’s multiple comparison test (normal distribution) or Kruskal–Wallis test followed by Dunn’s multiple comparisons test, were used when comparing more than two groups. Two-way ANOVA followed by Tukey’s post hoc test was used for two-factor analysis. A P value of ≤0.05 was considered significant.
Online supplemental material
Fig. S1 shows the generation and skeletal phenotype of HgsnatP304L mice. Fig. S2 shows a Venn diagram displaying the number of genes upregulated or downregulated in hippocampal tissues of 4-mo-old HgsnatP304L and Hgsnat-Geo mice compared with the age- and sex-matched WT mice; and the gene and protein expression data related to ER stress and UPR in the brain tissues of HgsnatP304L mice. Fig. S3 shows data confirming that the missense variant Pro311Leu impairs expression, lysosomal targeting, processing, and enzymatic activity of HGSNAT. Fig. S4 shows data providing evidence that mice treated daily with 2.0 g/kg glucosamine for 13 wk do not show alterations in growth and BW, blood glucose levels, or astro- and microgliosis in brain tissues. Table S1 lists the top 10 upregulated and downregulated genes in hippocampi of Hgsnat-Geo mice and HgsnatP304L mice compared with each other and WT mice.
Data availability
The RNA sequencing data generated in this study are available at Sequence Read Archive website, accession no. PRJNA832487. Any other data, analytic methods, and study materials can be provided upon request for purposes of reproducing the results or replicating the procedure.
Acknowledgments
The authors thank Dr. Jeffrey A. Medin, Dr. Monty McKillop, Dr. Christian Beauséjour, and Gaël Moquin-Beaudry for the help in production of LV-HGSNAT-GFP and LV-P311L-HGSNAT-GFP. We also thank Jeannie Mui and the Facility for Electron Microscopy Research (McGill University) for help with the TEM, Dr. Elke Küster-Schöck and the Plateforme d’Imagerie Microscopique (Centre Hospitalier Universitaire Sainte-Justine) for help with life imaging microscopy, Mitra Cowan and the McGill Integrated Core for Animal Modeling for help with mouse production, and Dr. Mila Ashmarina for critically reading the manuscript and helpful advice.
This work has been partially supported by an operating grant PJT-156345 from the Canadian Institutes of Health Research, Elisa Linton Sanfilippo Research Laboratory endowed fund, and gifts from JLK Foundation, Jonah’s Just Began Foundation, and Sanfilippo Children’s Research Foundation (Australia) to A.V. Pshezhetsky. F.M. Platt is a Wellcome Trust Investigator in Science and a Wolfson Royal Society Merit Award holder. D.A. Priestman was supported by the Mizutani Foundation and R. Heon-Roberts by scholarships from the Canadian MPS Society and the Canadian Glycomics Network.
Authors’ contributions: M. Taherzadeh, X. Pan, P. Bose, R. Heon-Roberts, A.L.A. Nguyen, TM. Xu, C. Pará, D. Priestman, N. Fnu, and S. Khan conducted experiments and acquired data; X. Pan, M. Taherzadeh; P. Bose, R. Heon-Roberts, A.L.A. Nguyen, TM. Xu, D.A. Priestman, N. Fnu, S. Khan, S. Tomatsu, F.M. Platt, C.R. Morales, Y. Yamanaka, and A.V. Pshezhetsky analyzed data; A.V. Pshezhetsky designed the experiments and wrote the manuscript (first draft); X. Pan, M. Taherzadeh, P. Bose, S. Khan, S. Tomatsu, N. Fnu, D.A. Priestman, C.R. Morales, and A.V. Pshezhetsky wrote the manuscript (editing). All authors read and approved the final version of the manuscript.

