Skip to Main Content
Skip Nav Destination

Activation-induced cytidine deaminase (AID) is essential for B cell affinity maturation. We investigated why AID deficiency gives rise to giant germinal centers (GCs) using the AIDR112H mouse model that is devoid of AID activity. The increased GC response was associated with accumulation of GC B cells in the light zone in immunized AIDR112H mice. AIDR112H GC B cells had reduced capacity to upregulate IRF4 to initiate plasma cell differentiation, leading to accumulation of a transitional GC population with reduced GL7 expression. Genetic introduction of a high-affinity B cell receptor was unable to restore plasma cell differentiation of AIDR112H B cells, while ectopic expression of catalytically active AID rescued plasma cell generation. AID and ten-eleven translocation 2 (TET2) synergistically facilitated demethylation of the Irf4 promoter/enhancer, and this was impeded in AIDR112H cells. These data reveal a B cell–intrinsic mechanism that governs the plasma cell fate decision through epigenetic remodeling mediated by AID in cooperation with TET2.

A hallmark of the humoral immune response is the formation of isotype-switched, long-lived plasma cells (PCs) and memory B cells in germinal centers (GCs). A mature GC can be histologically divided into a dark zone (DZ) and a light zone (LZ). Proliferative B cells populating the DZ highly express activation-induced cytidine deaminase (AID) to diversify their B cell receptors (BCRs) through somatic hypermutation (SHM) and Ig class-switch recombination (CSR) (Di Noia and Neuberger, 2007; Stavnezer et al., 2008; Muramatsu et al., 1999; Muramatsu et al., 2000). The somatically mutated B cells test their BCR affinity through capturing antigens deposited on follicular dendritic cells (FDCs) and presentation to T follicular helper (Tfh) cells in the LZ (Victora et al., 2010; Victora and Nussenzweig, 2012). External signals from FDCs and Tfh cells intertwined with epigenetic and transcriptional programs to orchestrate GC B cell differentiation into PCs (Venturutti and Melnick, 2021).

As B cells transit through the GC response to form PCs, the genomic architecture is reconfigured substantially (Papin et al., 2022) due to epigenetic remodeling including alterations in histone modification and DNA methylation (Venturutti and Melnick, 2021). To counteract the passive DNA demethylation induced by rapid cell proliferation, GC B cells express a DNA methyltransferase, DNMT1, to maintain the B cell–specific DNA methylome pattern (Shaknovich et al., 2011). Locus-specific DNA demethylation occurs in GC B cells to ensure normal GC B cell differentiation (Wu et al., 2022), and is mediated by the members of the ten-eleven translocation (TET) protein family, including TET2 and TET3 (Wu and Zhang, 2017). TET proteins can mediate iterative oxidation of 5-methylcytosine (5mC), therefore generating 5-hydroxymethylcytosine (5hmC), 5-formylcytosine (5fC), and 5-carboxylcytosine (5caC) (Pastor et al., 2013). 5hmC, 5fC, and 5caC can lead to passive DNA demethylation through replication-dependent dilution of 5mC. Alternatively, 5fC and 5caC can be excised by thymine DNA glycosylase (TDG) that is coupled with the base excision repair (BER) pathway to mediate active DNA demethylation (Wu and Zhang, 2017). The loci undergoing DNA hypomethylation in GC B cells are overrepresented at B cell enhancers that cover key genes for PC formation, Irf4, Prdm1, and Xbp1 (Barwick et al., 2016). Concomitantly, upregulation of IRF4 and downregulation of BCL6 and PAX5 precede the PC differentiation (Nutt et al., 2015). This coincides with a progressive DNA demethylation at the Irf4 locus from naive B cells to the terminally differentiated PC stage and is mediated by TET proteins (Fujii et al., 2020).

To initiate SHM and CSR, AID is associated with the transcription machinery and specifically targeted to the Ig variable and switch regions, where AID can deaminate cytidine into uracil at the single-stranded DNA (ssDNA) exposed during transcription (Nambu et al., 2003; Pavri et al., 2010; Kodgire et al., 2013; Maul et al., 2014; Wang et al., 2014). The resulting U:G mismatch can be sensed and removed by uracil-DNA glycosylase (UNG), eliciting a DNA damage response (Daniel and Nussenzweig, 2013; Yan et al., 2007; Rada et al., 2004; Methot and Di Noia, 2017). Repair of AID-induced DNA damage will result in SHM in the variable region and CSR in the constant region of the Ig locus (Di Noia and Neuberger, 2007; Stavnezer et al., 2008). AID deficiency leads to type II hyper-IgM syndrome (Revy et al., 2000) with a hotspot mutation in arginine 112-to-histidine mutation (AIDR112H) that abolishes the catalytic activity of the AID (Kohli et al., 2009; Carpenter et al., 2010; Wang et al., 2010; Prochnow et al., 2007). In addition to the complete absence of SHM and CSR, both type II hyper-IgM patients and AID-deficient mice possess lymphadenopathy caused by giant and persistent GCs (Muramatsu et al., 2000; Revy et al., 2000; Dahlberg et al., 2014). In addition to BCR diversification, it has been suggested that AID mediates active demethylation probably via deamination of 5mCs in various non–B cell models (Morgan et al., 2004; Ramiro and Barreto, 2015).

Using our previously established mouse model for the type II hyper-IgM syndrome (Dahlberg et al., 2014), we found that lymphadenopathy in AIDR112H mice was associated with accumulation of GC B cells with low expression of GL7 at a transitional GC (tGC) stage. This was caused by reduced capacity to induce PC differentiation due to compromised upregulation of IRF4 in AIDR112H GC B cells. Genetic introduction of a high-affinity BCR failed to rescue the PC differentiation in AIDR112H GC B cells; instead, ectopic expression of the wild-type (WT) AID protein fully restored the capacity to generate PCs. Our data reveal that AID and TET2 cooperate at the Irf4 promoter/enhancer, and that AID deamination activity was required for efficient DNA demethylation of the Irf4 gene for commitment to the PC lineage.

Increased GC response with accumulation of LZ B cells in AIDR112H mice

The expression of AID is detectable throughout B cell development with the highest expression in GC DZ B cells (Kuraoka et al., 2011; Meyers et al., 2011). B cell development in bone marrow and spleen was comparable between AIDR112H and WT mice (Fig. 1, A and B). To examine the B cell–intrinsic effect of the AIDR112H mutation and to exclude an effect of the microenvironment in AIDR112H mice, we generated mixed bone marrow chimeric mice that were reconstituted with a 1:1 ratio of CD45.1 WT and CD45.2 AIDR112H cells. Circulating B cells, follicular B cells, and marginal zone B cells were comparable in WT and AIDR112H mice (Fig. S1 A), suggesting that the antigen-independent phase of B cell development in the bone marrow and spleen was not impaired by the AIDR112H mutation.

Immunohistochemistry and flow cytometry analysis revealed that AIDR112H mice had increased GC response with elevated GC B cells when compared to WT mice (Fig. 1, C and D) (Dahlberg et al., 2014). AIDR112H GC B cells had a reduced active caspase 3+ population (Fig. 1 E), which is consistent with previous findings of reduced apoptosis in AID knockout GC B cells (Zaheen et al., 2009; Mayer et al., 2017). To study the GC response, we analyzed sheep red blood cell (SRBC)–immunized GC B cells (GL7+CD95+) and, among these LZ (CXCR4loCD83/86hi) and DZ (CXCR4hiCD83/86lo) populations, the generation of spleen plasmablasts (PBs, B220+CD138+), PCs (B220CD138+), and memory B cells (PD-L2+CD73+). The GC in AIDR112H mice had an altered structure, with increased LZ population leading to a reduced DZ-to-LZ ratio in AIDR112H mice (Fig. 1 D). AIDR112H mice showed a more than twofold increase of the memory B cell population (Fig. 1 F). The output of total spleen PBs and PCs was comparable between AIDR112H and WT mice (Fig. S1 B). The proportion of Tfh cells was comparable between AIDR112H and WT mice (Fig. S1 C). In the competitive setting of bone marrow chimeric mice, CD45.2 AIDR112H B cells had twofold accumulation of GC B cells when compared to CD45.1 WT B cells (Fig. 1, G and H). Moreover, CD45.2 AIDR112H GC B cells predominantly located in the LZ, whereas the CD45.1 WT GC B cells were distributed normally between the two zones (Fig. 1 H). This demonstrated a cell-intrinsic effect of AIDR112H GC B cells even in an environment where the WT cells could sustain a GC response and where IgG from WT B cells could mediate antibody feedback regulation (Zhang et al., 2013). Consistent with the increased memory B cell population in individually immunized AIDR112H mice (Fig. 1 F), CD45.2 AIDR112H B cells showed an advantage in memory B cell formation in competition with CD45.1 WT B cells (Fig. 1 G). WT and AIDR112H cells contributed equally to differentiation of PBs, and there was a disadvantage of PC formation from the AIDR112H GC B cells (Fig. 1 G). These data show that AID deficiency led to aberrant accumulation of GC B cells with preferential localization in the LZ of the GC.

Unaltered cell proliferation rate but compromised G1/S transition of AIDR112H GC B cells

To study whether the accumulation of GC B cells in AIDR112H mice was caused by increased cell proliferation, SRBC-immunized WT and AIDR112H mice were given a 4-h BrdU pulse before analysis on day 7. DZ B cells contained a higher proportion of BrdU+ cells when compared to the LZ cells (Fig. 2 A). Surprisingly, GC B cells from AIDR112H mice had a decreased BrdU+ cell population when compared to GC B cells from WT mice regardless of their location in DZ or LZ (Fig. 2 A). Cell cycle distribution of GC B cells showed an increased G1 population and a decreased early S-phase cell population in AIDR112H mice when compared to WT mice (Fig. 2 A). These data suggested a reduced fraction of proliferating B cells in AIDR112H GCs compared with WT GCs, which is likely due to compromised G1/S transition of AIDR112H GC B cells. This may be caused by an impaired BCR affinity maturation in AIDR112H mice, since capacity of GC B cell division is proportional to the amount of captured antigens (Gitlin et al., 2014). To investigate whether there is defective DNA replication/initiation in AIDR112H B cells, we set up a system using induced GC B (iGB) cells to separate cells that newly initiated the G1/S transition from those already in the DNA synthesis phase of the cell cycle (Nojima et al., 2011). iGB cells were first given a 15-min EdU pulse, followed by BrdU labeling for 5 min, and 1, 2, and 4 h. Cells that were in the S phase were EdU+BrdU+, while cells that were in the G1 phase during EdU labeling and had newly entered the S phase during BrdU labeling were EdUBrdU+. By measuring the increase of the BrdU single-positive cells, we could measure the rate of G1/S transition. AIDR112H iGB cells showed a reduced G1/S transition rate when compared to WT iGB cells (Fig. 2 B). Consistently, cell cycle distribution of iGB cells showed increased G1 and decreased S-phase cell populations among AIDR112H iGB cells when compared to WT iGB cells (Fig. 2 B). Despite decreased G1/S transition of AIDR112H cells, the global cell proliferation rate in AIDR112H iGB cells was unaffected when compared to WT iGB cells as shown by the dilution of cell division dye CellTrace Violet (CTV) (Fig. 2 C).

Together, these data excluded that the lymphadenopathy and accumulation of GC B cells in AIDR112H mice were caused by a faster GC B cell proliferation rate.

AIDR112H mice have reduced PC differentiation in GC and accumulate GL7lo/− tGC B cells

Our data from bone marrow chimeric mice showed an advantage of AIDR112H B cells to form GC B cells but a disadvantage to contribute to the PC pool. We reasoned that the large GCs formed in AIDR112H mice were caused by a blockage of PC differentiation from GC B cells. PCs can differentiate from both the GC pathway and the extrafollicular pathway (Nutt et al., 2015). To investigate whether there was defective PC formation from GC B cells in AIDR112H mice, we performed a new gating strategy as shown in Fig. 3 A to examine the PC differentiation within the GC. Newly formed PBs and PCs were analyzed in the DZ and LZ of the GL7+CD95+ GC population (Fig. 3 A). AIDR112H mice had a reduced CD138+ population (including both PBs and PCs) from both DZ and LZ cells when compared to WT mice (Fig. 3 B). The majority of CD138+ cells in the LZ were PBs (Fig. 3 A). In contrast, in the DZ population most of the CD138+ cells had downregulated the cell surface receptor B220 and become PCs (Fig. 3 A). Similar to individual mice, analysis of bone marrow chimeric mice showed that GC B cells from CD45.2 AIDR112H B cells had a reduced CD138+ (PB + PC) population when compared to CD45.1 WT GC B cells (Fig. S1, D and E).

In addition to the increased GC B cell population (GL7+CD95+), AIDR112H mice had an increased population of GL7lo/−CD95+ B cells (Fig. 3 A). Immunohistochemistry of spleen sections confirmed a significant increase of an aberrant type of GCs in AIDR112H mice as marked by IgDCD21/35+ area with a lower or undetectable level of GL7 compared with WT mice (Fig. 3 C and Fig. S1 F). Based on the surface expression of CXCR4 and CD83/CD86, these cells could be divided into three populations (Fig. 3 A; CXCR4hi, CD83/86hi, and CXCR4loCD83/86lo). To examine whether this population contained a tGC B population destined to leave the GC, we analyzed PC differentiation within the GL7lo/−CD95+ B cell population. The GL7lo/−CD95+CXCR4hi B cells contained a higher percentage of CD138+ (PB + PC) cells (Fig. 3 B) when compared to DZ B cells in WT mice. This suggested that the GL7lo/−CD95+ B cells included B cells at a tGC stage, and we refer to them as GL7lo/−CD95+ tGC B cells. In AIDR112H mice, the CD138+ (PB + PC) cells among the GL7lo/−CD95+ B cells were reduced more than threefold when compared to WT mice (Fig. 3 B). To further validate the differentiation stage of the GL7lo/−CD95+ B cell population and to be able to identify antigen-specific B cells, we immunized WT mice with NP-KLH and examined the GL7lo/−CD95+ B cells. There were an increased proportion of NP-PE+ B cells in the GL7lo/−CD95+ B population when compared to total GC B cells (Fig. 3 D). Importantly, there was a more than twofold increase of NP+CD138+ cells in the GL7lo/−CD95+ B cell population when compared to total GC B cells (Fig. 3 D). In the bone marrow chimeric mice, GL7lo/−CD95+ CD45.2 AIDR112H B cells were increased, while generation of CD138+ cells in the GL7lo/−CD95+ B cells was greatly compromised when compared to CD45.1 WT B cells (Fig. S1, D and E). Altogether, these results suggest that the GL7lo/−CD95+ cells contained a tGC population and were enriched for CD138+ PBs and PCs. Moreover, PC differentiation from the GC response was significantly compromised in the AIDR112H mice and characterized by accumulation of the tGC B cells in the GL7lo/−CD95+ population with a GC LZ phenotype.

To define the transcriptome profile of these B cells, we sorted the GL7lo/−CD95+ cell population (GL7.lo) and compared with sorted GL7+CD95+ GC cells (GL7.hi) by RNA sequencing. The GL7lo/−CD95+ B cells clustered together irrespective of the genotype using an unsupervised hierarchical clustering (Fig. S1 G). Gene set enrichment analysis (GSEA) revealed a significant enrichment for signatures of GC DZ and LZ cells in the GL7hi population. In contrast, the GL7lo/−CD95+ B cell population was significantly enriched for gene signatures of early and late pre-PBs (E.prePB and L.prePB), as well as GC memory B cells (Fig. 3 E) (Gómez-Escolar et al., 2022). Interestingly, GL7lo/−CD95+ B cells were enriched for a gene signature of CCR6+-activated precursor B cells that are a heterogeneous population destined to various cell fates preceding the GC response at days 3–4 upon immunization (Fig. 3 E) (Glaros et al., 2021). Analysis of the GL7lo/−CD95+ B cell using a GC lineage tracing model (S1PR2-ERT2Cre-RS-loxStoplox-tdTomato [Shinnakasu et al., 2016]) showed that ≥40% of cells in this gate had GC identity (BCL6+) and/or were GC-derived (S1PR2-tdTomato+, Fig. S2 A). This suggested that the GL7lo/−CD95+ B cell was a heterogeneous population consisting of both tGC B cells and cells of the extrafollicular pathways. Additionally, the GSEA network analysis revealed a significant enrichment of genes related to cell cycle and DNA repair/replication in the GL7+CD95+ (GL7.hi) B cell population, while these gene sets were diminished in the GL7lo/−CD95+ B cell population (Fig. 3 E and Fig. S2 B). This suggested a downregulation of mitotic signatures in the GL7lo/−CD95+ B cell population. Instead, the GL7lo/−CD95+ B cells had enriched signatures for cell activation and migration, suggesting an ongoing selection and differentiation process occurring in these cells (Fig. S2 B).

Together, the AIDR112H GC B cells differentiated into a tGC phenotype that gradually became GL7lo/− when residing in GCs. These B cells were halted at the pre-PB stage and failed to differentiate into PCs, likely contributing to the increased LZ and GL7lo/−CD95+ cell population in AIDR112H mice.

AIDR112H GC B cells have reduced capacity to upregulate IRF4

To investigate the molecular mechanism underlying the defective PC differentiation of AIDR112H B cells, we examined the expression of transcription factors BCL6, IRF4, and PAX5 in GC B cells from SRBC-immunized mice. Around 90% of the GL7+ GC B cells were BCL6+ in both WT and AIDR112H mice (Fig. 4 A). The BCL6+ cells among the GL7loCD95+ population were twofold higher in AIDR112H mice compared with WT mice (Fig. 4 A), supporting that the BCL6+ cells accumulated in the GL7loCD95+ population in AIDR112H mice. AIDR112H GCs showed more than threefold reduction of the IRF4hiPAX5lo population when compared to WT GCs (Fig. 4 A). Consistently, the IRF4hiPAX5lo population among the GL7lo/−CD95+ B cells showed more than sevenfold reduction in AIDR112H mice when compared to WT mice (Fig. 4 A). This was confirmed using the GC lineage tracing (S1PR2-ERT2Cre-RS-loxStoplox-tdTomato) in WT mice where the GL7lo/−CD95+ B cells contained IRF4hiPAX5lo cells of GC identity (S1PR2-tdTomato+, Fig. S2 C). In addition, we found that there was a reduction of the IRF4 protein in AIDR112H GC B cells when compared to WT cells, while PAX5 protein expression was comparable between AIDR112H and WT GC B cells (Fig. 4 B).

Downregulation of BCL6 precedes PC differentiation (Tunyaplin et al., 2004). Although GC B cells had a comparable level of BCL6lo cells between AIDR112H and WT mice, GL7lo/−CD95+ B cells from AIDR112H mice had fewer BCL6lo cells (Fig. 4 A). Moreover, we found that IRF4hi cells only existed in the BCL6lo population. Quantification of the IRF4hi population among the BCL6lo cells showed a significant reduction in AIDR112H GCs when compared to WT GCs (Fig. 4 A). By treating the SRBC-immunized mice with BI-3802, a small molecule inhibitor toward BCL6, we detected an increased BCL6lo population in AIDR112H GC B cells. However, increased BCL6lo cells in AIDR112H GCs did not lead to increased IRF4hiPAX5lo cells (Fig. S2 D). This suggests that downregulation of BCL6 was not sufficient for IRF4 upregulation and PC differentiation in AIDR112H GC B cells. Moreover, AIDR112H B cells had reduced capacity to downregulate CXCR5 on GCs and tGC B cells, providing an explanation for the failure of AIDR112H B cells to egress from the GC (Fig. S2 E).

These results suggest that AIDR112H B cells downregulated BCL6, but showed reduced capacity to upregulate IRF4 that is required for GC B cells to differentiate into PCs.

Reduced AIDR112H PC formation from in vitro iGB cells

To investigate whether the defective PC differentiation in AIDR112H mice is B cell–intrinsic, we examined PC differentiation using the iGB cell culture system (Fig. 5 A) (Nojima et al., 2011). Similar to PCs generated in vivo, B cells differentiating into PBs downregulated PAX5 and upregulated IRF4 and CD138 (Fig. 5 A). On day 7, a substantial proportion of cells had differentiated into PBs in the WT cell culture (Fig. 5, B and C). Consistent with our in vivo data, the differentiation of PBs from AIDR112H B cells was significantly compromised (Fig. 5, B and C). AIDR112H iGB cells showed reduced IRF4 protein when compared to WT iGB cells, while PAX5 protein was similar in WT and AIDR112H iGB cells (Fig. 5 D). The impaired upregulation of IRF4 in AIDR112H iGB cells was not due to compromised cell proliferation (Fig. S2 F). Analysis of iGB cells using imaging flow cytometry confirmed that AIDR112H B cells had greatly reduced nuclear IRF4 when compared to WT B cells (Fig. 5 E). At the same time, PAX5 and FOXO1, two transcription factors that are present in the GC B cells and downregulated in PCs (Nera et al., 2006; Sander et al., 2015; Dominguez-Sola et al., 2015; Omori et al., 2006), were similar in WT and AIDR112H iGB cells, and indeed were downregulated in the WT IRF4hiPAX5lo population (Fig. 5 E).

We next examined whether ectopic expression of IRF4 could rescue defective PB generation in AIDR112H iGB cells. The overexpression of IRF4 in the AIDR112H iGB cells by retroviral transfection was able to fully restore the IRF4hiPAX5lo cell population (Fig. S2 G), showing that upregulation of IRF4 plays a critical role in promoting PC differentiation. Moreover, upregulation of IRF4 may represent one of the earliest detectable events of PC fate–committed B cells. IRF4hiPAX5lo cells had an increased intracellular Ig production (Fig. S2 H), but not all IRF4hiPAX5lo cells expressed surface marker CD138 (Fig. 5 A and Fig. S2 H).

These results validated our in vivo findings and showed that reduced PB generation in AIDR112H mice was caused by a B cell–intrinsic defect to upregulate IRF4.

High-affinity BCR fails to rescue PC differentiation of AIDR112H GC B cells

To examine whether the defective PC differentiation of AIDR112H GC B cells was caused by compromised affinity maturation, we took advantage of the B1-8hi mice carrying a preassembled Ig heavy chain that when paired with an Ig lambda chain produce a BCR with high affinity for NP. To compare the NP high-affinity WT and AIDR112H B cells side by side, we adoptively transferred CTV-labeled naive B cells from B1-8hiAIDR112H and B1-8hiWT mice mixed at a 1:1 ratio and analyzed at day 7 upon immunization with NP-CGG (Fig. 6 A). B1-8hiAIDR112H and B1-8hiWT B cells maximally diluted CTV, suggesting an equivalent cell proliferation. IRF4hi PBs were among the most divided cell population (≥7 divisions) from both B1-8hiAIDR112H and B1-8hiWT B cells in vivo (Fig. 6 A). There was a more than twofold reduction of IRF4hi PBs from B1-8hiAIDR112H B cells as compared to B1-8hiWT B cells (Fig. 6 A). Moreover, there was more than threefold reduction of antigen-specific PCs (IRF4hiNP+) generated from B1-8hiAIDR112H cells compared with B1-8hiWT B cells (Fig. S3 A), suggesting an impaired high-affinity antibody response. Analysis of the GC response revealed that the GC B cell population was composed of both host B cells and adoptively transferred B1-8hiAIDR112H and B1-8hiWT B cells. Although the total transferred B1-8hiAIDR112H and B1-8hiWT B cells maintained a 1:1 ratio 7 days after immunization, there was a more than twofold accumulation of B1-8hiAIDR112H B cells over B1-8hiWT B cells in the GC (Fig. 6 A).

To further validate this, we adoptively transferred naive B cells from B1-8hiAIDR112H (IgMa, CD45.2) and AIDR112H (IgMb, CD45.2) mice, mixed at a 1:1 ratio and injected into WT recipient mice (IgMb, CD45.1, Fig. S3 B). At day 7 upon NP-CGG immunization, the PC differentiation from B1-8hiAIDR112H (IgMa, CD45.2) GC B cells was comparable to the differentiation from AIDR112H (IgMb, CD45.2) GC B cells, and both were significantly lower than that from WT (IgMb, CD45.1) GC B cells (Fig. S3, B and C).

In the adoptive transfer model, we observed a higher percentage of NP+ cells among the B1-8hiAIDR112H GC B population when compared to the NP+ cells among the B1-8hiWT GC B cells (94.8% versus 65.2%, Fig. 6 B). There was an increased MFI of surface NP-PE binding of B1-8hiAIDR112H GC B cells compared with the B1-8hiWT cells. This was likely due to both an increased fraction of NP+ B cells and a higher BCR level of AIDR112H GC B cells (Stewart et al., 2018). A fraction of IgM-expressing cells contained BCR that had lost NP binding in B1-8hiWT GC B cells, which was not observed in the B1-8hiAIDR112H GC B cells (14.2% versus 2.3%, Fig. 6 B). This can be attributed to SHM mediated by AID in the WT cells.

Together, these data suggest that the defective upregulation of IRF4 and PC differentiation of AIDR112H B cells did not result from impaired affinity maturation.

Restored AID activity rescues PC differentiation

To rule out that the defective PC differentiation is caused by compromised Ig class switching of AIDR112H GC B cells, we analyzed the PC output rate in nonswitched (IgM+) and switched (IgM) GC B cells from SRBC-immunized mice. Indeed, there was a comparable level of PC differentiation between IgM and IgM+ GC B cells in WT mice, while the IgM+ GC B cells from AIDR112H mice had decreased capacity to form PCs as compared to IgM+ B cells from WT mice (Fig. 7 A). Additionally, the capacity of BCR signaling was unaltered in AIDR112H GC B cells when compared to WT GC B cells as assessed by p-Syk, p-Btk, and p-Erk (Fig. 7 B). Flow cytometry analysis showed a comparable level of c-MYC expression in AIDR112H GC B cells compared with WT cells (Fig. 7 C). Upon stimulation, AIDR112H GC B cells upregulated c-MYC to a comparable level of WT GC B cells (Fig. 7 D). These data demonstrate that the defective upregulation of IRF4 and PC differentiation of AIDR112H GC B cells did not result from impaired affinity maturation, Ig class switching, and BCR-induced upregulation of c-MYC, indicating that there is another layer of IRF4 regulation mediated by AID activity.

To investigate whether AID activity is directly involved in orchestrating PC differentiation besides its role in affinity maturation during the GC response, we took advantage of the iGB culture system supplemented with IL-21, which provides signals to support PC differentiation and bypasses the BCR affinity-mediated selection (Nojima et al., 2011). We expressed WT AID protein in the AIDR112H iGB cells by retroviral transduction. AIDR112H cells that received the WT AID protein completely restored the IRF4hiPAX5lo cell population when compared to AIDR112H cells that received a control plasmid (Fig. 7 E). This establishes that WT AID activity plays a critical role in the PC fate decision in addition to its role in affinity maturation–driven selection.

To mimic the molecular consequence of AID deamination activity, we used 5-fluorouracil (5-FU) and pemetrexed (PEM) that elevate the level of deoxyuridine triphosphate and lead to incorporation of deoxyuridine into DNA (Longley et al., 2003). 5-FU– and PEM–treated WT iGB cells had no change in generation of the IRF4hiPAX5lo cell population when compared to the nontreated WT cells. In contrast, the AIDR112H iGB cells treated with 5-FU and PEM had increased IRF4hiPAX5lo populations when compared to nontreated AIDR112H cells (Fig. 7 F). This prompted us to investigate whether UNG that senses and removes uracil from DNA is involved in regulation of PC differentiation. We ectopically expressed Ugi, a small peptide inhibitor, in WT iGB cells to inhibit UNG activity (Di Noia and Neuberger, 2002). Reduced Ig CSR in Ugi-transduced cells suggested efficient inhibition of UNG activity, while the cell proliferation rate was unaffected in the Ugi-transduced cells compared with the control plasmid–transduced iGB cells (Fig. S3, D and E). WT cells that received the Ugi reduced the IRF4hiPAX5lo cell population by ≥50% when compared to cells that received a control plasmid (Fig. 7 G).

These data suggest that the deamination activity of AID and the signaling cascade elicited by DNA U:G mismatch were involved in upregulation of IRF4 for PC fate decision in the GC B cells.

AID accelerates demethylation of the Irf4 enhancer/promoter via cooperation with TET2 in GC B cells

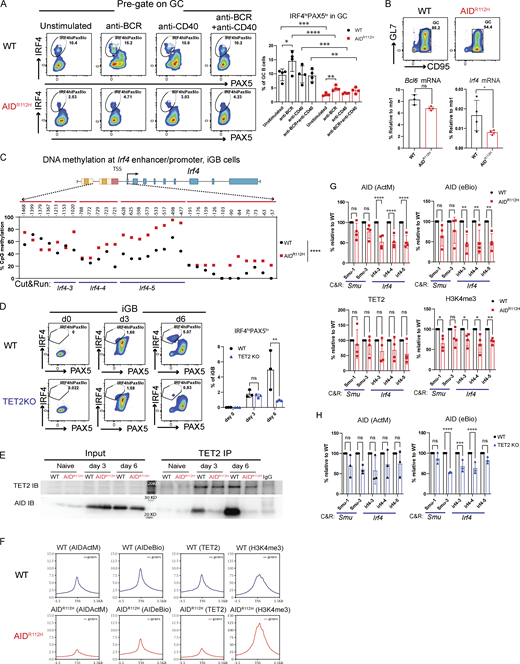
Recent work has demonstrated that the level of the IRF4 protein was restricted posttranscriptionally by ubiquitin ligases Cbl and Cbl-b in GC B cells (Li et al., 2018). To understand whether the failure to upregulate IRF4 in AIDR112H GC B cells occurred at the transcriptional level or at the posttranscriptional level, we stimulated WT and AIDR112H GC B cells in vitro and examined the IRF4hiPax5lo population. WT GC B cells upregulated IRF4hiPAX5lo cells upon BCR activation, whereas AIDR112H GC B cells failed to upregulate the IRF4hiPAX5lo population (Fig. 8 A). The overall level of the IRF4hiPAX5lo population among AIDR112H GC B cells was reduced compared with WT GC B cells in both unstimulated and stimulated groups, suggesting a lower mRNA level of Irf4 in AIDR112H GC B cells. We next examined the Irf4 mRNA level from enriched GC B cells by quantitative (q)PCR. The mRNA level of Irf4 from AIDR112H GC B cells showed a twofold reduction, in contrast to the Bcl6 mRNA that remained comparable between AIDR112H and WT GC B cells (Fig. 8 B).

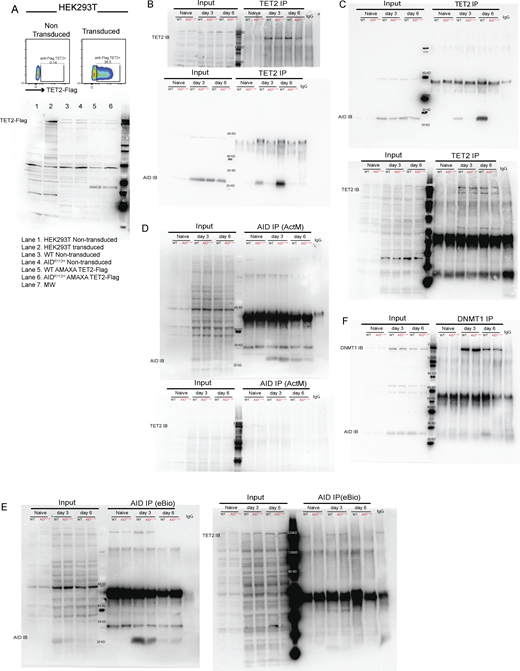
Upregulation of IRF4 is associated with a progressive DNA demethylation at the Irf4 enhancer/promoter region as B cells transit through the GC to form PCs (Fujii et al., 2020). Recent studies have demonstrated a role of AID in regulating the DNA methylome in GC B cells (Dominguez et al., 2015; Català-Moll et al., 2021). To test whether the impaired Irf4 transcription was due to compromised DNA demethylation in AIDR112H GC B cells, we analyzed the DNA methylation pattern at the Irf4 enhancer/promoter region (−1,471 to −14 bp relative to the first exon) using bisulfite sequencing. This indeed revealed an impaired DNA demethylation at the Irf4 enhancer/promoter in AIDR112H iGB cells when compared to WT iGB cells on day 7 (Fig. 8 C and Fig. S3 F). TET proteins play a critical role in mediating demethylation of the Irf4 enhancer/promoter during B cell differentiation into PCs (Fujii et al., 2020). Intriguingly, overall transcriptome and methylome alterations occurring in TET2 knockout (TET2 KO) GC B cells are largely shared by AID knockout GC B cells (Rosikiewicz et al., 2020). Therefore, we reasoned that AID and TET2 may cooperate to mediate Irf4 demethylation. Indeed, TET2 KO iGB cells showed a reduction of IRF4hiPAX5lo cells compared with WT iGB cells on day 6 (Fig. 8 D). The reduced IRF4hiPax5lo population did not result from the lower level of the AID protein in the TET2 KO iGB cells, because these cells underwent a comparable level of Ig class switching as WT iGB cells on both day 3 and day 6 (Fig. S3 G) (Lio et al., 2019). To examine a possible interaction between AID and TET2 proteins in B cells, we performed co-immunoprecipitation using iGB cells from day 3 and day 6 cultures. We first confirmed the specificity of the TET2 detection by expressing Flag-tagged TET2 in HEK293 cells (Fig. S4 A). We detected AID from TET2 immunoprecipitations in WT iGB cells but not in the AIDR112H iGB cells (Fig. 8 E; and Fig. S4, B and E). AID was undetectable from the DNMT1 immunoprecipitation from either WT or AIDR112H iGB cells (Fig. S4 F). This suggested a proximity of AID and TET2 proteins at the chromatin level in WT iGB cells, which was compromised in AIDR112H iGB cells. To examine the AID- and TET2-associated genomic loci in iGB cells, we performed Cleavage Under Targets and Release Using Nuclease (CUT&RUN) sequencing and qPCR. Results from the CUT&RUN sequencing revealed a preferential association of AID with the promoter region of genes (Fig. 8 F). Association of AID and TET2 to chromatin at the global level was reduced in AIDR112H iGB cells compared with WT cells as confirmed using two different AID antibodies (Fig. 8 F). A closer examination at several selected gene loci revealed genes with combined reduction of both AID and TET2 chromatin association (Bcl6, Pax5, and Pim1), genes with reduction of either AID or TET2 chromatin association (Cd83, Irf4, and Xbp1), and genes with minimum chromatin association of AID or TET2 (Prdm1, Fig. S5, A and B). In contrast, the global level of H3K4me3 spanning the transcription start site (TSS) had a moderate increase in the AIDR112H iGB cells compared with WT cells (Fig. 8 F). To further investigate this in detail, we performed qPCR using CUT&RUN samples at the selected regions spanning the Irf4 enhancer/promoter. The results showed a reduced association of AID with the Irf4 enhancer/promoter in AIDR112H cells when compared to WT iGB cells on day 3 (Fig. 8 G). TET2 association was comparable in WT and AIDR112H iGB cells (Fig. 8 G). On the other hand, WT AID was associated with the Irf4 enhancer/promoter in TET2 KO iGB cells (Fig. 8 H). Association of AID with Switch mu regions was comparable between AIDR112H and WT iGB cells, suggesting differential recruitment mechanisms of AID to non-Ig loci versus Ig loci. Interestingly, although there was a moderate increase of active histone mark H3K4me3 at the global level in AIDR112H iGB cells when compared to WT iGB cells, the H3K4me3 at the Irf4 enhancer/promoter region showed a reduction in AIDR112H cells, indicating a reduced Irf4 transcription initiation/elongation (Fig. 8, F and G).

Together, these data suggest that chromatin association of AID and TET2 was likely independent of each other. However, a synergistic effect from TET2 and AID led to efficient demethylation of the Irf4 promoter/enhancer and that the absence of either TET2 or AID activity interferes with demethylation of the Irf4 gene to induce transcription.

In silico structure modeling of AID reveals how R112H abolishes the deaminase activity

To examine the impact of the R112H mutation on protein structure and deamination activity of AID, we performed in silico modeling analysis. The AID RoseTTAFold structures were used to predict ΔΔG of selected mutations (Fig. 9, A–C). Among 26 patient mutations in AID, the R112H mutation showed an intermediate score (−1.81 kcal/mol) in contrast to the strongly destabilizing mutations, C87S (−4.09 kcal/mol), W80R (−3.69 kcal/mol), and M139T (−3.05 kcal/mol) (Fig. 9, B and C). The low root-mean-square deviation (RMSD) values after the alignment of the structures of C87S (0.425 Å), W80R (0.370 Å), M139T (0.372 Å), and R112H (0.441 Å) indicated minimal structural difference from the WT AID structure (Fig. 9 B). The H112 residue in AIDR112H indirectly altered the positive charge near the H56 and the negative charged surface around the catalytic pocket cytosines (Fig. 9 D). The R112H mutation induced a polar interaction to R19 and an aromatic interaction to L172, leading to reduced interaction distance between W84 and H56 (Fig. 9, E and F). This resulted in less accessibility to the catalytic pocket of mutant AIDR112H (King et al., 2015). Y114 had very high contact frequency with the phosphodiester backbone during ssDNA-AID binding (King et al., 2015), and Y114 interacted with an oxygen of dCMP (Qiao et al., 2017). The perturbed interaction between W84 with Y114 could indicate a change in the interaction between AIDR112H and ssDNA/dCMP. Indeed, molecular docking of AIDR112H with the Irf4-AGCT motif had a reduced electrostatic interaction energy compared with the WT-Irf4-AGCT complex (Fig. S5 C). Together, these data explain how the R112H mutation in the APOBEC-like domain of AID leads to a catalytically dead AID with a direct impact on the demethylation status of the Irf4 gene.

Generation of high-affinity and long-lived PCs from GCs is essential for humoral immunity (Shlomchik and Weisel, 2012; Shapiro-Shelef and Calame, 2005). Using the AIDR112H mouse model that spontaneously develops GC hyperplasia (Dahlberg et al., 2014), we here demonstrate that lack of AID activity halted GC B cell differentiation at a tGC and pre-PB stage, which resulted in the accumulation of GL7lo/−CD95+ B cells. The GL7lo/− tGC B cells in AIDR112H mice failed to upregulate IRF4 irrespective of BCL6 downregulation and therefore were unable to initiate the PC differentiation program. The expression of a high-affinity BCR was unable to restore the halted PC generation from AIDR112H GC B cells in mice. Our data show that the synergistic effects of AID and TET2 accelerated the DNA demethylation of the Irf4 enhancer/promoter and promoted Irf4 transcription. This study identifies an important example where AID “off-target” activity has direct consequence for cell fate decision during B cell differentiation in GCs.

The cell fate decisions of B cells in GCs critically depend on the interplay between two groups of transcription factors (Shapiro-Shelef and Calame, 2005; Nutt et al., 2015). Downregulation of BCL6 precedes PC differentiation of GC B cells (Klein and Dalla-Favera, 2008; Shapiro-Shelef and Calame, 2005). Our study showed that the IRF4hi population was nearly completely abolished among the BCL6lo/− cells in AIDR112H mice. This suggests that downregulation of BCL6 alone was not sufficient for IRF4 upregulation and PC differentiation. These data strongly suggest an additional layer of regulation of IRF4 mediated by AID, independent of downregulation of BCL6 (Phan et al., 2007). Moreover, the GL7lo/−CD95+ cells in AIDR112H mice mainly consisted of halted tGC B cells as evident by the BCL6 expression. In WT mice, the GL7lo/−CD95+ cells were a heterogeneous cell population consisting of cells from both the GC pathway and the extrafollicular pathway. Therefore, the reduced IRF4hiPAX5lo population in GL7lo/−CD95+ cells likely resulted from compromised generation of PCs from both the GC response and extrafollicular pathway. Importantly, the expression of the WT AID protein in the AIDR112H iGB cells fully restored generation of IRF4hiPAX5lo cells. Treatment with 5-FU or PEM, which could increase the incorporation of deoxyuridine into DNA, partly restored the IRF4hiPAX5lo cell population in AIDR112H iGB cells. Moreover, inhibition of UNG that removes uracil generated by AID using the small peptide inhibitor Ugi significantly decreased the IRF4hiPAX5lo cells in WT iGB cultures, suggesting the involvement of UNG in PC fate decision downstream of AID-mediated deamination.

B cell deficiency for TET2 and TET3 leads to an increased GC response, aberrant accumulation of GC LZ B cells, and impaired PC generation, which resembles the GC response from the AIDR112H mice (Dominguez et al., 2018; Schoeler et al., 2019; this study). Our data demonstrate a collaboration between AID and TET2 in GC B cells, which provides an explanation for the phenotypic resemblance and the shared transcriptome and methylome changes observed in AID knockout and TET2 KO GC B cells (Rosikiewicz et al., 2020). Although there is still a controversy regarding a direct role of AID in active demethylation, altered DNA demethylation in GC B cells deficient for AID has been demonstrated by several studies in both mouse models and a hyper-IgM syndrome patient (Dominguez et al., 2015; Català-Moll et al., 2021). AID-associated loci are overrepresented in the hypomethylated loci of GC B cells (Shaknovich et al., 2011). Independent studies have shown that the purified AID protein can deaminate 5mCs in vitro although with less activity as compared to unmethylated cytosine deamination. It is unclear whether AID-dependent deamination on cytosines or 5mCs is directly involved in DNA demethylation. Moreover, to process TET2-mediated 5mC deoxygenation, cells employ a similar spectrum of repair proteins from the BER pathway as used for processing of AID-mediated cytosine deamination, e.g., TDG and apurinic/apyrimidinic endonuclease (Wu and Zhang, 2017). The synergistic effect of AID and TET2 may greatly augment the DNA damage response and facilitate the recruitment of the shared components from the BER pathway, which in turn accelerates the active demethylation of the Irf4 enhancer/promoter. Similarly, incorporation of dUs in iGB cells by 5-FU/PEM treatment may trigger excessive amount of DNA damage that augments the recruitment of BER proteins and/or impaired maintenance of DNA methylation by DNMT1. This would lead to global DNA demethylation and increased IRF4hiPax5lo cells. Our data link the deamination activity of AID to epigenetic regulation during B cell differentiation.

The Irf4 gene has been repeatedly identified as one of the AID off-target genes (Álvarez-Prado et al., 2018; Meng et al., 2014; Chiarle et al., 2011; Yamane et al., 2011). Our AID CUT&RUN data using two different AID antibodies suggested that AID preferentially associated with TSSs at its off-target genes, where TET2 showed shared occupancy. Although global chromatin association of AID and TET2 was reduced in AIDR112H B cells, the reduced association of both proteins was only observed at some off-target genes (Bcl6, Pax5, and Pim1). It is possible that chromatin association of AID and TET2 proteins is independent of each other. However, their synergistic effect may be important for efficient global methylome alteration during the differentiation from GC B cells to PCs. At the Irf4 locus, our data show that this effect is translated into efficient DNA demethylation at the promoter/enhancer region. Our in silico modeling provided evidence that the R112H mutation affected the catalytic pocket of AID by indirectly altering the positive charge around H56 and the negative surface around the catalytic pocket. This would impact on the catalytic pocket accessibility, ssDNA binding, interaction with dCMP, and possibly the AIDR112H occupancy at on- and off-target sites.

AID off-targets at non-Ig loci are preferentially associated with B cell superenhancers undergoing convergent/divergent transcription (Meng et al., 2014; Qian et al., 2014; Pefanis et al., 2014). This predisposes the GC B cells into increased risk of malignant transformation, as chromosome translocation of IgH to proto-oncogenes is a hallmark of GC-derived B cell lymphomas (Casellas et al., 2016). Besides a few highly mutated off-target genes (e.g., Bcl6, Pim1), AID-dependent mutations at the majority of the off-target loci are usually neglectable due to the robust DNA repair in B cells (Liu et al., 2008; Yamane et al., 2011; Álvarez-Prado et al., 2018; Qian et al., 2014). It is possible that the AID-dependent deamination at some of these loci has been translated into epigenetic modification instead of mutations due to the availability of DNA repair factors and the epigenetic machinery at the loci. A central question concerns the mechanism that ensures robust SHM in GC B cells to generate high-affinity PCs, but that also prevents the heavily mutated GC B cells from undergoing tumor transformation. Here, we established that in addition to SHM and CSR, AID activity is critical to initiate the PC program in GCs by promoting IRF4 expression through locus-specific DNA demethylation. A mechanistic linkage of AID activity and downstream PC lineage commitment probably acts as an additional safeguard against adverse mutational effects of high-level SHM, as it would ensure their sequestration into a terminally differentiated and quiescent cell subset.

Mice and cell transfers

Mice were bred in the animal facility of KM Wallenberg and Department of Microbiology, Tumor and Cell Biology, Stockholm, Sweden. All animal experiments performed are approved by the Stockholm North Animal Ethics Committee permits N272/14, 11159-18, and 05294-2023. AIDR112H C57BL/6 (Dahlberg et al., 2014) and WT C57BL/6 mice were littermates. To generate mixed bone marrow chimeric mice, 1 × 10⁷ mixed bone marrow cells in 1:1 ratio of CD45.1 WT cells and CD45.2 AIDR112H cells were injected intravenously (i.v.) to the lethally irradiated WT congenic recipient mice. B1-8hi IgH knock-in mice were purchased from The Jackson Laboratory and crossed with AIDR112H mice to generate B1-8hiAIDR112H mice (IgMa, CD45.2) (Shih et al., 2002). 5 × 10⁶ naive spleen B cells mixed in 1:1 ratio from B1-8hiAIDR112H mice (IgMa, CD45.2) and AIDR112H mice (IgMb, CD45.2) were injected i.v. into WT recipient mice (IgMb, CD45.1). This was followed by i.p. immunization with 50 μg NP-CGG per mouse for analysis at day 7. Alternatively, B1-8hi IgH knock-in mice were bred with CD45.1 mice to generate B1-8hiWT (IgMa, CD45.1/CD45.2) mice. 5 × 10⁶ CTV-labeled naive spleen B cells mixed in 1:1 ratio from B1-8hiAIDR112H mice (IgMa, CD45.2) and B1-8hiWT mice (IgMa, CD45.1/CD45.2) were injected i.v. into WT recipient mice (IgMb, CD45.1), followed by NP-CGG immunization for 7 days. The S1pr2-ERT2cre mice were generously provided by T. Kurosaki, Osaka University, Osaka, Japan (Shinnakasu et al., 2016), and Rosa26-tdTomato mice (Ai14; Rosa-CAG-LSL-tdTomato-WPRE, Stock No. 007914) were purchased from The Jackson Laboratory (Termote et al., 2025).

B cell isolation and iGB cell culture

Mouse splenic B cells were enriched by the negative B cell selection kit from StemCell Technology. B cells were cultured at 1.6 × 10⁴ cell/ml on top of 80 Gy-irradiated 40LB cells (Nojima et al., 2011). Cell culture was supplemented with 1–2 ng/ml of mouse IL-4 (PeproTech). On day 4, 2–4 × 10³ cells from this culture were replated on freshly irradiated 40LB cells with 10–20 ng/ml of mouse IL-21 (PeproTech) for another 4–6 days to induce PC differentiation. 10 ng/ml of topoisomerase inhibitor etoposide was added on day 4 for 48 or 96 h 500 ng/ml 5-FU or 50 ng/ml PEM was added on day 4 for 24 h. To induce T-independent activation of B cells in vitro, 4 × 10⁵ cells/ml of isolated B cells were cultured with complete RPMI 1640 with 10 µg/ml LPS for up to 4 days.

EdU and BrdU labeling

iGB cultures were pulsed with 20 uM of EdU for 15 min and washed away, followed by labeling with BrdU for 5 min, or 1, 2, or 4 h before harvesting the culture. Detection of EdU was performed using the Click-It EdU kit (Thermo Fisher Scientific). BrdU was detected using monoclonal anti-BrdU antibody.

Immunization and flow cytometry

WT, AIDR112H, and WT:AIDR112H bone marrow chimeric mice were immunized with SRBCs via i.p. injections. Seven days after immunization, single-cell suspensions were prepared from spleen, lymph nodes, and bone marrow, and labeled with fluorescence-conjugated antibodies including B220, CD43, CD24, CD23, CD21, IgM, IgD, IgG1, CD93, CD138, GL7, CD95, CXCR4, CXCR5, CD83, CD86, CD73, PD-L2, CD80, Blimp1, PAX5, IRF4, BCL6, FOXO1, CD45.1, CD45.2, IgMa, IgMb, anti-BrdU. Data were obtained by LSRFortessa flow cytometry (BD) and analyzed with FlowJo software (TreeStar).

Western blot and immunoprecipitation

iGB cells were washed with cold PBS and then lysed in radioimmunoprecipitation assay buffer (150 mM NaCl, 1.0% IGEPAL, 0.5% sodium deoxycholate, 0.1% SDS, 50 mM Tris, pH 8.0) containing protease and phosphatase inhibitors for 1 h on ice. For immunoprecipitation, 3 μg of antibody was added to the cell lysate from 5 × 10⁶ cells per antibody, and then rotated at 4° overnight. Immune complexes were pulled down using 10 µl Protein A/G magnetic beads (Cat. #88803; Thermo Fisher Scientific) for 3 h at 4°. The protein was eluted with 60 μl of 2× SDS by boiling for 5 min at 95°. Anti-TET2 (Cat. #ab124297; Abcam), anti-DNMT1 (Cat. #39204; Active Motif), anti-AID (Cat. #39885; Active Motif), anti-AID (eBioscience, Cat. #14-5959-82; Thermo Fisher Scientific), anti-H3K4me3, and anti-IgG (present in CST #91931 kit) antibodies were used in the experiments.

CUT&RUN

5 × 10⁵ cells were processed with CUT&RUN Assay Kit (Cat. #91931; Cell Signaling Technology) according to the manufacturer’s instructions. 4 µg of anti-AID (Cat. #39885; Active Motif), anti-TET2 (Cat. #ab124297; Abcam), anti-DNMT1 (Cat. #39204; Active Motif), anti-H3K4me3, and anti-IgG (present in CST #91931 kit) antibodies were used in the experiments. CUT&RUN DNA products were purified using QIAquick PCR Purification Kit (Cat. #28106) and quantified with real-time PCR using SsoAdvanced SYBR Green Supermix (Cat. #1725274; Bio-Rad). Primer sequences are shown in Table S1.

CUT&RUN-sequencing analysis

Paired-end (150-bp) sequencing was performed by Novogene, using the Illumina NovaSeq 6000 platform. Raw reads were quality-filtered with Cutadapt 4.9, and mapped to both Mus musculus (mm39) and Saccharomyces cerevisiae (sacCer3, spike-in) genomes with Bowtie2 2.5.4 (Langmead and Salzberg, 2012) using the following options: end-to-end --very-sensitive --no-mixed --no-discordant. After normalization with the spike-in raw counts and removal of off-target sequences (Nordin et al., 2023), normalized bedGraph files were generated with bedtools 2.31.0 and converted to bigWig files using UCSC’s bedGraphToBigWig tool (Quinlan and Hall, 2010; Kent et al., 2010). Visualization was done in the UCSC Genome Browser, and TSS-centered heatmaps and profiles were generated with deepTools 3.5.5 (Ramírez et al., 2016).

DNA methylation analysis by bisulfite treatment

Inducible GC B cells from day 7 were subjected to CpG methylation analysis using EZ DNA Methylation-Direct Kit (Cat. #D5021; Zymo Research). In brief, 1 × 10⁴ iGB cells were lysed for 20 min at 50° with M-digestion buffer containing proteinase K. Cell lysates containing DNA were directly subjected to bisulfite conversion for 3.5 h. Reaction was stopped using desulfonation buffer, and then, DNA was purified with a Zymo-Spin column. The modified DNA was amplified by PCR. PCR products were cloned into a pCR4-TOPO TA vector and sequenced (Cat. #K457501; Thermo Fisher Scientific). Primer sequences are shown in Table S1.

Immunofluorescence staining

Spleens from unimmunized and SRBC-immunized mice were imbedded with Tissue-Tek OCT compound (Sakura) for immunofluorescence staining. 8-mm-thick tissue sections were cut from the imbedded spleen using a cryostat microtome. Sections were fixed in ice-cold acetone for 10 min and blocked with 5% fetal calf serum for 1 h. The sections were incubated with primary antibodies overnight at 4°C, washed with PBS, and then incubated with secondary antibodies for 45 min. Fluorescence images were captured using Leica DM IRBE confocal microscope that has one argon laser and two HeNe lasers. HC PL APO lens at 20×/0.70 CS was used at room temperature. Images were processed with ImageJ software.

Genotyping

Exon 2 from the aicda gene was amplified by Taq polymerase with the following primers: 5′-TCT​GGC​TGC​CAC​GTG​GAA​TTG​T-3′ and 5′-TGA​TCC​CGA​TCT​GGA​CCC​CAG​C-3′. PCR program steps were as follows: 95°C, 2 min, 30 cycles of 95°C for 30 s, 63°C for 30 s, and 72°C for 30 s, and a last step of 72°C for 10 min. The PCR product was digested with 1U BssHII at 37°C overnight. PCR products from WT alleles would be cut into two fragments (175- and 84-bp), whereas the AIDR112H product would be resistant to the digestion.

RNA-sequencing analysis and GSEA

Total RNA was purified from sorted cells using RNeasy kit #74104 (Qiagen). Each RNA sample was treated with an RNase-free DNase kit #79254 (Qiagen) during the RNA isolation procedure. The concentration of purified total RNA was measured by NanoDrop 2000 (Thermo Fisher Scientific). RNA sequencing was performed using the Illumina HiSeq PE150 platform at Novogene, Hong Kong, China. Reads were aligned to the reference genome of mouse (M. musculus) assembly December 2011 (GRCm38/mm10).

The analysis was conducted with R 4.2.3. Briefly, raw gene counts were used as inputs of DESeq2 package (1.38.3) for differential gene expression (DGE) analysis. Prefilter conditions include total gene count <10 and immunoglobulin variable genes. Marker genes from each condition were identified by ranking the product of log fold change and log-transformed adjusted P value times −1. Identified marker genes were visualized using ComplexHeatmap package (2.14.0) with z-score of variance-stabilizing–transformed gene counts. The GSEA was performed with clusterProfiler package (4.4.4) with full-ranked DGE result and published marker genes for different stages of B cells (Gómez-Escolar et al., 2022) as input files of GSEA command. Pathway enrichment analysis was done in two steps. First, the enriched gene ontology terms were identified for each ranked gene list with the gseGO() function. Following that, enriched terms were visualized using Cytoscape (3.9.1).

Structural modeling analysis of AID

The 3D models of WT and mutated AID were built with RoseTTAFold (Baek et al., 2021). PyMOL 3.1 was used for visualization of the structures (https://pymol.org/). The RMSD was used to evaluate structural divergence among the predicted models. The mutated AID predicted models were aligned with the WT AID, and the RMSD was measured with PyMOL 3.1. To predict mutation effects on protein stability, we calculated the ΔΔG for 26 single point mutations in AID using DDMut web server (https://biosig.lab.uq.edu.au/ddmut/) (Zhou et al., 2023). The surface electrostatic potential was evaluated using the Adaptive Poisson–Boltzmann Solver PyMOL plugin (Jurrus et al., 2018). To further elucidate the impact of the R112H mutation, the interatomic interactions of WT and AIDR112H were evaluated with Arpeggio (Jubb et al., 2017). Figures were prepared using PyMOL 3.1. The ssDNA (5′- AGT​AGT​TAT​CAG​CTA​TGC​TCA​GTG-3′) was built using the program 3DNA (Lu and Olson, 2003), and the AID models were generated using RoseTTAFold. The protein–DNA complex was formed by docking using HADDOCK software with default parameters (van Dijk et al., 2013). The docked complex was selected from the top-ranked clustered structures.

Statistics

Statistical analysis was performed as indicated in the figure legends. Statistics was performed using GraphPad Prism version 8. P ≤ 0.05, significant; P > 0.05, nonsignificant.

Online supplemental material

Fig. S1 includes flow cytometry data on B cell differentiation in vivo from regular mice or bone marrow chimeric mice, immunofluorescence images of spleen sections (E), and heatmap from bulk RNA sequencing of GC B cells and GL7lo/− B cells. Fig. S2 includes flow cytometry data on GC fate mapping, expression of BCL6 and CXCR5, in vitro B cell proliferation, and IRF4 ectopic expression; and GO analysis of bulk RNA sequencing of GC B cells and GL7lo/− B cells. Fig. S3 includes flow cytometry data on high-affinity B cell differentiation in vivo, Ugi-ectopic expression and cell proliferation, and Ig class switching of TET2 KO B cells. DNA methylation data of naive B cells are included. Fig. S4 includes full images of all co-immunoprecipitation data and western blot data. Fig. S4 displays the peak profiles of selected genes from CUT&RUN-sequencing data. Table S1 shows primer sequences.

The data for transcriptomics and CUT&RUN sequencing are stored at European Nucleotide Archive (https://www.ebi.ac.uk/ena) with the accession number ERP170279. All the data described in the text are available in main figures and supplementary figures. Additional raw data are available upon reasonable request.

We are grateful to the staff of Komparativ medicin Annexet (KMA) and the Department of Microbiology, Tumor and Cell Biology (MTC) animal facilities for their technical support. We thank Dr. Javier di Noia (McGill University, Montreal, Canada), Dr. Kohsuke Imai (Tokyo Medical and Dental University, Tokyo, Japan), and Dr. Stephen Malin (Karolinska Institutet, Solna, Sweden) for helpful discussions.

This work was supported by postdoctoral fellowships from Olle Engkvist Byggmästare to M. He and from Wenner-Gren Foundations to L.G. Pinho; Karolinska Institutet PhD fellowships to R. D’Aulerio, E. Doukoumopoulos, T. Yong, and M.M.S. Oliveira; a PhD fellowship from Fundação para a Ciência e a Tecnologia and European Social Fund to M.M.S. Oliveira; a CAPES-STINT joint grant to R.G. Galvani, V. Cotta-de-Almeida, and L.S. Westerberg; the Swedish Research Council and Swedish Cancer Society to L. Ström and L.S. Westerberg; and Worldwide Cancer Research, Childhood Cancer Fund, Radiumhemmet Research Funds, and Karolinska Institutet to L.S. Westerberg. L.S. Westerberg is a Ragnar Söderberg fellow in Medicine and holds a senior research position awarded by the Childhood Cancer Fund. The CNIC is supported by the Instituto de Salud Carlos III, the Ministerio de Ciencia, Innovación y Universidades (MICIU), and the Pro CNIC Foundation, and is a Severo Ochoa Center of Excellence (grant CEX2020-001041-S funded by MICIU/Agencia Estatal de Investigación (AEI)/10.13039/501100011033). Open Access funding provided by Karolinska Institutet.

Author contributions: Minghui He: conceptualization, data curation, formal analysis, funding acquisition, investigation, methodology, project administration, validation, visualization, and writing—original draft, review, and editing. Roberta D’Aulerio: data curation, formal analysis, investigation, methodology, and writing—review and editing. Lia G. Pinho: formal analysis. Evangelos Doukoumopoulos: investigation, visualization, and writing—review and editing. Tracer Yong: software and visualization. Rhaissa C. Vieira: formal analysis. Mariana M.S. Oliveira: investigation and methodology. Laura Eiben: investigation. Manon Termote: methodology and resources. Rômulo G. Galvani: formal analysis, software, and writing—review and editing. Saikiran Sedimbi: investigation and methodology. Christina Seitz: writing—review and editing. Nikolai V. Kuznetsov: formal analysis, investigation, resources, and validation. Maria A. Zuriaga: resources. Daisuke Kitamura: methodology. José J. Fuster: resources. Vinicius Cotta-de-Almeida: resources and writing—review and editing. Lena Ström: resources and writing—review and editing. Pia Dosenovic: resources, supervision, and writing—review and editing. Søren E. Degn: conceptualization, resources, and writing—review and editing. Lisa S. Westerberg: conceptualization, data curation, formal analysis, funding acquisition, investigation, methodology, project administration, resources, software, supervision, validation, visualization, and writing—original draft, review, and editing.

Álvarez-Prado
,
Á.F.
,
P.
Pérez-Durán
,
A.
Pérez-García
,
A.
Benguria
,
C.
Torroja
,
V.G.
de Yébenes
, and
A.R.
Ramiro
.
2018
.
A broad atlas of somatic hypermutation allows prediction of activation-induced deaminase targets
.
J. Exp. Med.
215
:
761
771
.
Baek
,
M.
,
F.
DiMaio
,
I.
Anishchenko
,
J.
Dauparas
,
S.
Ovchinnikov
,
G.R.
Lee
,
J.
Wang
,
Q.
Cong
,
L.N.
Kinch
,
R.
Dustin Schaeffer
, et al
.
2021
.
Accurate prediction of protein structures and interactions using a three-track neural network
.
Science
.
373
:
871
876
.
Barwick
,
B.G.
,
C.D.
Scharer
,
A.P.R.
Bally
, and
J.M.
Boss
.
2016
.
Plasma cell differentiation is coupled to division-dependent DNA hypomethylation and gene regulation
.
Nat. Immunol.
17
:
1216
1225
.
Carpenter
,
M.A.
,
E.
Rajagurubandara
,
P.
Wijesinghe
, and
A.S.
Bhagwat
.
2010
.
Determinants of sequence-specificity within human AID and APOBEC3G
.
DNA Repair
.
9
:
579
587
.
Casellas
,
R.
,
U.
Basu
,
W.T.
Yewdell
,
J.
Chaudhuri
,
D.F.
Robbiani
, and
J.M.
Di Noia
.
2016
.
Mutations, kataegis and translocations in B cells: Understanding AID promiscuous activity
.
Nat. Rev. Immunol.
16
:
164
176
.
Català-Moll
,
F.
,
A.G.
Ferreté-Bonastre
,
T.
Li
,
D.
Weichenhan
,
P.
Lutsik
,
L.
Ciudad
,
Á.F.
Álvarez-Prado
,
J.
Rodríguez-Ubreva
,
C.
Klemann
,
C.
Speckmann
, et al
.
2021
.
Activation-induced deaminase is critical for the establishment of DNA methylation patterns prior to the germinal center reaction
.
Nucleic Acids Res.
49
:
5057
5073
.
Chiarle
,
R.
,
Y.
Zhang
,
R.L.
Frock
,
S.M.
Lewis
,
B.
Molinie
,
Y.-J.
Ho
,
D.R.
Myers
,
V.W.
Choi
,
M.
Compagno
,
D.J.
Malkin
, et al
.
2011
.
Genome-wide translocation sequencing reveals mechanisms of chromosome breaks and rearrangements in B cells
.
Cell
.
147
:
107
119
.
Dahlberg
,
C.I.M.
,
M.
He
,
T.
Visnes
,
M.L.
Torres
,
E.M.
Cortizas
,
R.E.
Verdun
,
L.S.
Westerberg
,
E.
Severinson
, and
L.
Ström
.
2014
.
A novel mouse model for the hyper-IgM syndrome: A spontaneous activation-induced cytidine deaminase mutation leading to complete loss of Ig class switching and reduced somatic hypermutation
.
J. Immunol.
193
:
4732
4738
.
Daniel
,
J.A.
, and
A.
Nussenzweig
.
2013
.
The AID-induced DNA damage response in chromatin
.
Mol. Cell
.
50
:
309
321
.
Di Noia
,
J.
, and
M.S.
Neuberger
.
2002
.
Altering the pathway of immunoglobulin hypermutation by inhibiting uracil-DNA glycosylase
.
Nature
.
419
:
43
48
.
Di Noia
,
J.M.
, and
M.S.
Neuberger
.
2007
.
Molecular mechanisms of antibody somatic hypermutation
.
Annu. Rev. Biochem.
76
:
1
22
.
Dominguez
,
P.M.
,
H.
Ghamlouch
,
W.
Rosikiewicz
,
P.
Kumar
,
W.
Béguelin
,
L.
Fontán
,
M.A.
Rivas
,
P.
Pawlikowska
,
M.
Armand
,
E.
Mouly
, et al
.
2018
.
TET2 deficiency causes germinal center hyperplasia, impairs plasma cell differentiation, and promotes b-cell lymphomagenesis
.
Cancer Discov.
8
:
1633
1653
.
Dominguez
,
P.M.
,
M.
Teater
,
N.
Chambwe
,
M.
Kormaksson
,
D.
Redmond
,
J.
Ishii
,
B.
Vuong
,
J.
Chaudhuri
,
A.
Melnick
,
A.
Vasanthakumar
, et al
.
2015
.
DNA methylation dynamics of germinal center B cells are mediated by AID
.
Cell Rep.
12
:
2086
2098
.
Dominguez-Sola
,
D.
,
J.
Kung
,
A.B.
Holmes
,
V.A.
Wells
,
T.
Mo
,
K.
Basso
, and
R.
Dalla-Favera
.
2015
.
The FOXO1 transcription factor instructs the germinal center dark zone program
.
Immunity
.
43
:
1064
1074
.
Fujii
,
K.
,
S.
Tanaka
,
T.
Hasegawa
,
M.
Narazaki
,
A.
Kumanogoh
,
H.
Koseki
,
T.
Kurosaki
, and
W.
Ise
.
2020
.
Tet DNA demethylase is required for plasma cell differentiation by controlling expression levels of IRF4
.
Int. Immunol.
32
:
683
690
.
Gitlin
,
A.D.
,
Z.
Shulman
, and
M.C.
Nussenzweig
.
2014
.
Clonal selection in the germinal centre by regulated proliferation and hypermutation
.
Nature
.
509
:
637
640
.
Glaros
,
V.
,
R.
Rauschmeier
,
A.V.
Artemov
,
A.
Reinhardt
,
S.
Ols
,
A.
Emmanouilidi
,
C.
Gustafsson
,
Y.
You
,
C.
Mirabello
,
Å.K.
Björklund
, et al
.
2021
.
Limited access to antigen drives generation of early B cell memory while restraining the plasmablast response
.
Immunity
.
54
:
2005
2023.e10
.
Gómez‐Escolar
,
C.
,
A.
Serrano‐Navarro
,
A.
Benguria
,
A.
Dopazo
,
F.
Sánchez‐Cabo
, and
A.R.
Ramiro
.
2022
.
Single cell clonal analysis identifies an AID-dependent pathway of plasma cell differentiation
.
EMBO Rep.
23
:e55000.
Jubb
,
H.C.
,
A.P.
Higueruelo
,
B.
Ochoa-Montaño
,
W.R.
Pitt
,
D.B.
Ascher
, and
T.L.
Blundell
.
2017
.
Arpeggio: A web server for calculating and visualising interatomic interactions in protein structures
.
J. Mol. Biol.
429
:
365
371
.
Jurrus
,
E.
,
D.
Engel
,
K.
Star
,
K.
Monson
,
J.
Brandi
,
L.E.
Felberg
,
D.H.
Brookes
,
L.
Wilson
,
J.
Chen
,
K.
Liles
, et al
.
2018
.
Improvements to the APBS biomolecular solvation software suite
.
Protein Sci.
27
:
112
128
.
Kent
,
W.J.
,
A.S.
Zweig
,
G.
Barber
,
A.S.
Hinrichs
, and
D.
Karolchik
.
2010
.
BigWig and BigBed: Enabling browsing of large distributed datasets
.
Bioinformatics
.
26
:
2204
2207
.
King
,
J.J.
,
C.A.
Manuel
,
C.V.
Barrett
,
S.
Raber
,
H.
Lucas
,
P.
Sutter
, and
M.
Larijani
.
2015
.
Catalytic pocket inaccessibility of activation-induced cytidine deaminase is a safeguard against excessive mutagenic activity
.
Structure
.
23
:
615
627
.
Klein
,
U.
, and
R.
Dalla-Favera
.
2008
.
Germinal centres: Role in B-cell physiology and malignancy
.
Nat. Rev. Immunol.
8
:
22
33
.
Kodgire
,
P.
,
P.
Mukkawar
,
S.
Ratnam
,
T.E.
Martin
, and
U.
Storb
.
2013
.
Changes in RNA polymerase II progression influence somatic hypermutation of Ig-related genes by AID
.
J. Exp. Med.
210
:
1481
1492
.
Kohli
,
R.M.
,
S.R.
Abrams
,
K.S.
Gajula
,
R.W.
Maul
,
P.J.
Gearhart
, and
J.T.
Stivers
.
2009
.
A portable hot spot recognition loop transfers sequence preferences from APOBEC family members to activation-induced cytidine deaminase
.
J. Biol. Chem.
284
:
22898
22904
.
Kuraoka
,
M.
,
T.M.
Holl
,
D.
Liao
,
M.
Womble
,
D.W.
Cain
,
A.E.
Reynolds
, and
G.
Kelsoe
.
2011
.
Activation-induced cytidine deaminase mediates central tolerance in B cells
.
Proc. Natl. Acad. Sci. USA
.
108
:
11560
11565
.
Langmead
,
B.
, and
S.L.
Salzberg
.
2012
.
Fast gapped-read alignment with Bowtie 2
.
Nat. Methods
9
:
357
359
.
Li
,
X.
,
A.
Gadzinsky
,
L.
Gong
,
H.
Tong
,
V.
Calderon
,
Y.
Li
,
D.
Kitamura
,
U.
Klein
,
W.Y.
Langdon
,
F.
Hou
, et al
.
2018
.
Cbl ubiquitin ligases control B cell exit from the germinal-center reaction
.
Immunity
.
48
:
530
541.e6
.
Lio
,
C.-W.J.
,
V.
Shukla
,
D.
Samaniego-Castruita
,
E.
González-Avalos
,
A.
Chakraborty
,
X.
Yue
,
D.G.
Schatz
,
F.
Ay
, and
A.
Rao
.
2019
.
TET enzymes augment activation-induced deaminase (AID) expression via 5-hydroxymethylcytosine modifications at the Aicda superenhancer
.
Sci. Immunol.
4
:eaau7523.
Liu
,
M.
,
J.L.
Duke
,
D.J.
Richter
,
C.G.
Vinuesa
,
C.C.
Goodnow
,
S.H.
Kleinstein
, and
D.G.
Schatz
.
2008
.
Two levels of protection for the B cell genome during somatic hypermutation
.
Nature
.
451
:
841
845
.
Longley
,
D.B.
,
D.P.
Harkin
, and
P.G.
Johnston
.
2003
.
5-Fluorouracil: Mechanisms of action and clinical strategies
.
Nat. Rev. Cancer
3
:
330
338
.
Lu
,
X.-J.
, and
W.K.
Olson
.
2003
.
3DNA: A software package for the analysis, rebuilding and visualization of three-dimensional nucleic acid structures
.
Nucleic Acids Res.
31
:
5108
5121
.
Maul
,
R.W.
,
Z.
Cao
,
L.
Venkataraman
,
C.A.
Giorgetti
,
J.L.
Press
,
Y.
Denizot
,
H.
Du
,
R.
Sen
, and
P.J.
Gearhart
.
2014
.
Spt5 accumulation at variable genes distinguishes somatic hypermutation in germinal center B cells from ex vivo-activated cells
.
J. Exp. Med.
211
:
2297
2306
.
Mayer
,
C.T.
,
A.
Gazumyan
,
E.E.
Kara
,
A.D.
Gitlin
,
J.
Golijanin
,
C.
Viant
,
J.
Pai
,
T.Y.
Oliveira
,
Q.
Wang
,
A.
Escolano
, et al
.
2017
.
The microanatomic segregation of selection by apoptosis in the germinal center
.
Science
.
358
:eaao2602.
Meng
,
F.-L.
,
Z.
Du
,
A.
Federation
,
J.
Hu
,
Q.
Wang
,
K.R.
Kieffer-Kwon
,
R.M.
Meyers
,
C.
Amor
,
C.R.
Wasserman
,
D.
Neuberg
, et al
.
2014
.
Convergent transcription at intragenic super-enhancers targets AID-initiated genomic instability
.
Cell
.
159
:
1538
1548
.
Methot
,
S.P.
, and
J.M.
Di Noia
.
2017
.
Molecular mechanisms of somatic hypermutation and class switch recombination
.
Adv. Immunol.
133
:
37
87
.
Meyers
,
G.
,
Y.S.
Ng
,
J.M.
Bannock
,
A.
Lavoie
,
J.E.
Walter
,
L.D.
Notarangelo
,
S.S.
Kilic
,
G.
Aksu
,
M.
Debré
,
F.
Rieux-Laucat
, et al
.
2011
.
Activation-induced cytidine deaminase (AID) is required for B-cell tolerance in humans
.
Proc. Natl. Acad. Sci. USA
.
108
:
11554
11559
.
Morgan
,
H.D.
,
W.
Dean
,
H.a
Coker
,
W.
Reik
, and
S.K.
Petersen-Mahrt
.
2004
.
Activation-induced cytidine deaminase deaminates 5-methylcytosine in DNA and is expressed in pluripotent tissues: Implications for epigenetic reprogramming
.
J. Biol. Chem.
279
:
52353
52360
.
Muramatsu
,
M.
,
K.
Kinoshita
,
S.
Fagarasan
,
S.
Yamada
,
Y.
Shinkai
, and
T.
Honjo
.
2000
.
Class switch recombination and hypermutation require activation-induced cytidine deaminase (AID), a potential RNA editing enzyme
.
Cell
.
102
:
553
563
.
Muramatsu
,
M.
,
V.S.
Sankaranand
,
S.
Anant
,
M.
Sugai
,
K.
Kinoshita
,
N.O.
Davidson
, and
T.
Honjo
.
1999
.
Specific expression of activation-induced cytidine deaminase (AID), a novel member of the RNA-editing deaminase family in germinal center B cells
.
J. Biol. Chem.
274
:
18470
18476
.
Nambu
,
Y.
,
M.
Sugai
,
H.
Gonda
,
C.-G.
Lee
,
T.
Katakai
,
Y.
Agata
,
Y.
Yokota
, and
A.
Shimizu
.
2003
.
Transcription-coupled events associating with immunoglobulin switch region chromatin
.
Science
.
302
:
2137
2140
.
Nera
,
K.-P.
,
P.
Kohonen
,
E.
Narvi
,
A.
Peippo
,
L.
Mustonen
,
P.
Terho
,
K.
Koskela
,
J.M.
Buerstedde
, and
O.
Lassila
.
2006
.
Loss of Pax5 promotes plasma cell differentiation
.
Immunity
.
24
:
283
293
.
Nojima
,
T.
,
K.
Haniuda
,
T.
Moutai
,
M.
Matsudaira
,
S.
Mizokawa
,
I.
Shiratori
,
T.
Azuma
, and
D.
Kitamura
.
2011
.
In-vitro derived germinal centre B cells differentially generate memory B or plasma cells in vivo
.
Nat. Commun.
2
:
465
.
Nordin
,
A.
,
G.
Zambanini
,
P.
Pagella
, and
C.
Cantù
.
2023
.
The CUT&RUN suspect list of problematic regions of the genome
.
Genome Biol.
24
:
185
.
Nutt
,
S.L.
,
P.D.
Hodgkin
,
D.M.
Tarlinton
, and
L.M.
Corcoran
.
2015
.
The generation of antibody-secreting plasma cells
.
Nat. Rev. Immunol.
15
:
160
171
.
Omori
,
S.A.
,
M.H.
Cato
,
A.
Anzelon-Mills
,
K.D.
Puri
,
M.
Shapiro-Shelef
,
K.
Calame
, and
R.C.
Rickert
.
2006
.
Regulation of class-switch recombination and plasma cell differentiation by phosphatidylinositol 3-kinase signaling
.
Immunity
.
25
:
545
557
.
Papin
,
A.
,
E.
Cesarman
, and
A.
Melnick
.
2022
.
3D chromosomal architecture in germinal center B cells and its alterations in lymphomagenesis
.
Curr. Opin. Genet. Dev.
74
:
101915
.
Pastor
,
W.A.
,
L.
Aravind
, and
A.
Rao
.
2013
.
TETonic shift: Biological roles of TET proteins in DNA demethylation and transcription
.
Nat. Rev. Mol. Cell Biol.
14
:
341
356
.
Pavri
,
R.
,
A.
Gazumyan
,
M.
Jankovic
,
M.
Di Virgilio
,
I.
Klein
,
C.
Ansarah-Sobrinho
,
W.
Resch
,
A.
Yamane
,
B.
Reina San-Martin
,
V.
Barreto
, et al
.
2010
.
Activation-induced cytidine deaminase targets DNA at sites of RNA polymerase II stalling by interaction with Spt5
.
Cell
.
143
:
122
133
.
Pefanis
,
E.
,
J.
Wang
,
G.
Rothschild
,
J.
Lim
,
J.
Chao
,
R.
Rabadan
,
A.N.
Economides
, and
U.
Basu
.
2014
.
Noncoding RNA transcription targets AID to divergently transcribed loci in B cells
.
Nature
.
514
:
389
393
.
Phan
,
R.T.
,
M.
Saito
,
Y.
Kitagawa
,
A.R.
Means
, and
R.
Dalla-Favera
.
2007
.
Genotoxic stress regulates expression of the proto-oncogene Bcl6 in germinal center B cells
.
Nat. Immunol.
8
:
1132
1139
.
Prochnow
,
C.
,
R.
Bransteitter
,
M.G.
Klein
,
M.F.
Goodman
, and
X.S.
Chen
.
2007
.
The APOBEC-2 crystal structure and functional implications for the deaminase AID
.
Nature
.
445
:
447
451
.
Qian
,
J.
,
Q.
Wang
,
M.
Dose
,
N.
Pruett
,
K.R.
Kieffer-Kwon
,
W.
Resch
,
G.
Liang
,
Z.
Tang
,
E.
Mathé
,
C.
Benner
, et al
.
2014
.
B cell super-enhancers and regulatory clusters recruit AID tumorigenic activity
.
Cell
.
159
:
1524
1537
.
Qiao
,
Q.
,
L.
Wang
,
F.L.
Meng
,
J.K.
Hwang
,
F.W.
Alt
, and
H.
Wu
.
2017
.
AID recognizes structured DNA for class switch recombination
.
Mol. Cell
.
67
:
361
373.e4
.
Quinlan
,
A.R.
, and
I.M.
Hall
.
2010
.
BEDTools: A flexible suite of utilities for comparing genomic features
.
Bioinformatics
.
26
:
841
842
.
Rada
,
C.
,
J.M.
Di Noia
, and
M.S.
Neuberger
.
2004
.
Mismatch recognition and uracil excision provide complementary paths to both Ig switching and the A/T-focused phase of somatic mutation
.
Mol. Cell
.
16
:
163
171
.
Ramírez
,
F.
,
D.P.
Ryan
,
B.
Grüning
,
V.
Bhardwaj
,
F.
Kilpert
,
A.S.
Richter
,
S.
Heyne
,
F.
Dündar
, and
T.
Manke
.
2016
.
deepTools2: a next generation web server for deep-sequencing data analysis
.
Nucleic Acids Res.
44
:
W160
W165
.
Ramiro
,
A.R.
, and
V.M.
Barreto
.
2015
.
Activation-induced cytidine deaminase and active DNA demethylation
.
Trends Biochem. Sci.
40
:
172
181
.
Revy
,
P.
,
T.
Muto
,
Y.
Levy
,
F.
Geissmann
,
A.
Plebani
,
O.
Sanal
,
N.
Catalan
,
M.
Forveille
,
R.
Dufourcq-Labelouse
,
A.
Gennery
, et al
.
2000
.
Activation-induced cytidine deaminase (AID) deficiency causes the autosomal recessive form of the Hyper-IgM syndrome (HIGM2)
.
Cell
.
102
:
565
575
.
Rosikiewicz
,
W.
,
X.
Chen
,
P.M.
Dominguez
,
H.
Ghamlouch
,
S.
Aoufouchi
,
O.A.
Bernard
,
A.
Melnick
, and
S.
Li
.
2020
.
TET2 deficiency reprograms the germinal center B cell epigenome and silences genes linked to lymphomagenesis
.
Sci. Adv.
6
:eaay5872.
Sander
,
S.
,
V.T.
Chu
,
T.
Yasuda
,
A.
Franklin
,
R.
Graf
,
D.P.
Calado
,
S.
Li
,
K.
Imami
,
M.
Selbach
,
M.
Di Virgilio
, et al
.
2015
.
PI3 kinase and FOXO1 transcription factor activity differentially control B cells in the germinal center light and dark zones
.
Immunity
.
43
:
1075
1086
.
Schoeler
,
K.
,
A.
Aufschnaiter
,
S.
Messner
,
E.
Derudder
,
S.
Herzog
,
A.
Villunger
,
K.
Rajewsky
, and
V.
Labi
.
2019
.
TET enzymes control antibody production and shape the mutational landscape in germinal centre B cells
.
FEBS J.
286
:
3566
3581
.
Shaknovich
,
R.
,
L.
Cerchietti
,
L.
Tsikitas
,
M.
Kormaksson
,
S.
De
,
M.E.
Figueroa
,
G.
Ballon
,
S.N.
Yang
,
N.
Weinhold
,
M.
Reimers
, et al
.
2011
.
DNA methyltransferase 1 and DNA methylation patterning contribute to germinal center B-cell differentiation
.
Blood
.
118
:
3559
3569
.
Shapiro-Shelef
,
M.
, and
K.
Calame
.
2005
.
Regulation of plasma-cell development
.
Nat. Rev. Immunol.
5
:
230
242
. .
Shih
,
T.-A.Y.
,
M.
Roederer
, and
M.C.
Nussenzweig
.
2002
.
Role of antigen receptor affinity in T cell-independent antibody responses in vivo
.
Nat. Immunol.
3
:
399
406
.
Shinnakasu
,
R.
,
T.
Inoue
,
K.
Kometani
,
S.
Moriyama
,
Y.
Adachi
,
M.
Nakayama
,
Y.
Takahashi
,
H.
Fukuyama
,
T.
Okada
, and
T.
Kurosaki
.
2016
.
Regulated selection of germinal-center cells into the memory B cell compartment
.
Nat. Immunol.
17
:
861
869
.
Shlomchik
,
M.J.
, and
F.
Weisel
.
2012
.
Germinal center selection and the development of memory B and plasma cells
.
Immunol. Rev.
247
:
52
63
.
Stavnezer
,
J.
,
J.E.J.
Guikema
, and
C.E.
Schrader
.
2008
.
Mechanism and regulation of class switch recombination
.
Annu. Rev. Immunol.
26
:
261
292
.
Stewart
,
I.
,
D.
Radtke
,
B.
Phillips
,
S.J.
McGowan
, and
O.
Bannard
.
2018
.
Germinal center B cells replace their antigen receptors in dark zones and fail light zone entry when immunoglobulin gene mutations are damaging
.
Immunity
.
49
:
477
489.e7
.
Termote
,
M.
,
R.C.
Marques
,
E.
Hyllner
,
M.V.
Guryleva
,
M.
Henskens
,
A.
Brutscher
,
I.J.L.
Baken
,
X.C.
Dopico
,
A.D.
Gasull
,
B.
Murrell
, et al
.
2025
.
Antigen affinity and site of immunization dictate B cell recall responses
.
Cell Rep.
44
:
115221
.
Tunyaplin
,
C.
,
A.L.
Shaffer
,
C.D.
Angelin-Duclos
,
X.
Yu
,
L.M.
Staudt
, and
K.L.
Calame
.
2004
.
Direct repression of prdm1 by Bcl-6 inhibits Plasmacytic differentiation
.
J. Immunol.
173
:
1158
1165
.
van Dijk
,
M.
,
K.M.
Visscher
,
P.L.
Kastritis
, and
A.M.J.J.
Bonvin
.
2013
.
Solvated protein-DNA docking using HADDOCK
.
J. Biomol. NMR
.
56
:
51
63
.
Venturutti
,
L.
, and
A.M.
Melnick
.
2021
.
The role of epigenetic mechanisms in B cell lymphoma pathogenesis
.
Annu. Rev. Cancer Biol.
5
:
311
330
.
Victora
,
G.D.
, and
M.C.
Nussenzweig
.
2012
.
Germinal centers
.
Annu. Rev. Immunol.
30
:
429
457
.
Victora
,
G.D.
,
T.A.
Schwickert
,
D.R.
Fooksman
,
A.O.
Kamphorst
,
M.
Meyer-Hermann
,
M.L.
Dustin
, and
M.C.
Nussenzweig
.
2010
.
Germinal center dynamics revealed by multiphoton microscopy with a photoactivatable fluorescent reporter
.
Cell
.
143
:
592
605
.
Wang
,
M.
,
C.
Rada
, and
M.S.
Neuberger
.
2010
.
Altering the spectrum of immunoglobulin V gene somatic hypermutation by modifying the active site of AID
.
J. Exp. Med.
207
:
141
153
.
Wang
,
X.
,
M.
Fan
,
S.
Kalis
,
L.
Wei
, and
M.D.
Scharff
.
2014
.
A source of the single-stranded DNA substrate for activation-induced deaminase during somatic hypermutation
.
Nat. Commun.
5
:
4137
.
Wu
,
S.
,
Y.
Yin
, and
X.
Wang
.
2022
.
The epigenetic regulation of the germinal center response
.
Biochim. Biophys. Acta Gene Regul. Mech.
1865
:
194828
.
Wu
,
X.
, and
Y.
Zhang
.
2017
.
TET-mediated active DNA demethylation: Mechanism, function and beyond
.
Nat. Rev. Genet.
18
:
517
534
.
Yamane
,
A.
,
W.
Resch
,
N.
Kuo
,
S.
Kuchen
,
Z.
Li
,
H.
Sun
,
D.F.
Robbiani
,
K.
McBride
,
M.C.
Nussenzweig
, and
R.
Casellas
.
2011
.
Deep-sequencing identification of the genomic targets of the cytidine deaminase AID and its cofactor RPA in B lymphocytes
.
Nat. Immunol.
12
:
62
69
.
Yan
,
C.T.
,
C.
Boboila
,
E.K.
Souza
,
S.
Franco
,
T.R.
Hickernell
,
M.
Murphy
,
S.
Gumaste
,
M.
Geyer
,
A.A.
Zarrin
,
J.P.
Manis
, et al
.
2007
.
IgH class switching and translocations use a robust non-classical end-joining pathway
.
Nature
.
449
:
478
482
.
Zaheen
,
A.
,
B.
Boulianne
,
J.Y.
Parsa
,
S.
Ramachandran
,
J.L.
Gommerman
, and
A.
Martin
.
2009
.
AID constrains germinal center size by rendering B cells susceptible to apoptosis
.
Blood
.
114
:
547
554
.
Zhang
,
Y.
,
M.
Meyer-Hermann
,
L.
a George
,
M.T.
Figge
,
M.
Khan
,
M.
Goodall
,
S.P.
Young
,
A.
Reynolds
,
F.
Falciani
,
A.
Waisman
, et al
.
2013
.
Germinal center B cells govern their own fate via antibody feedback
.
J. Exp. Med.
210
:
457
464
.
Zhou
,
Y.
,
Q.
Pan
,
D.E.V.
Pires
,
C.H.M.
Rodrigues
, and
D.B.
Ascher
.
2023
.
DDMut: Predicting effects of mutations on protein stability using deep learning
.
Nucleic Acids Res.
51
:
W122
W128
.

Author notes

Disclosures: S. Sedimbi is currently employed by Moderna Therapeutics (Cambridge, MA, USA). The work described in this manuscript was completed prior to this employment. The author declares no competing financial interests related to this study. No other disclosures were reported.

This article is available under a Creative Commons License (Attribution 4.0 International, as described at https://creativecommons.org/licenses/by/4.0/).

Data & Figures

Figure 1.
A multi-part image depicts B cell development and differentiation in AIDR112H mice and bone marrow chimeric mice. Panel A: The panel shows a series of flow cytometry plots and bar graphs. The flow cytometry plots illustrate the gating strategy for identifying different stages of B cell development in the bone marrow. The bar graphs display the total cell number in the bone marrow and the percentage of cells at different developmental stages (FrA, FrB plus C, FrD plus E). Panel B: This panel includes flow cytometry plots and bar graphs showing B cell development in the spleen. The flow cytometry plots depict the gating strategy for identifying various B cell subsets, while the bar graphs quantify the total number of spleen cells, B220 plus cells, and the percentage of cells at different transitional stages (T1, T2 MZP, MZB, FoB). Panel C: The panel presents immunofluorescence images of spleen sections on day 7 post-SRBC immunization, stained for IgD, GL7, and CD21/35. A bar graph quantifies the number of germinal centers (GCs). Panel D: This panel includes flow cytometry plots and bar graphs showing the GC response on day 7 post-SRBC immunization. The flow cytometry plots illustrate the gating strategy for GC, dark zone (DZ), and light zone (LZ) cells, while the bar graphs quantify the percentage of GC, DZ, and LZ cells and the DZ/LZ ratio. Panel E: The panel shows flow cytometry plots and a bar graph quantifying active Caspase3 plus apoptotic cells in GCs. Panel F: This panel includes flow cytometry plots and a bar graph quantifying memory B cell differentiation in the spleen. Panel G: The panel presents a schematic of the experimental setup for bone marrow chimeric mice, flow cytometry plots of splenic plasma cells (PB) and plasma cells (PCs), and a bar graph quantifying the log2 ratio of AIDR112H/WT in different B cell subsets (GC, DZ, LZ, PC, MB). Panel H: This panel includes flow cytometry plots and bar graphs showing the GC response in bone marrow chimeric mice, with quantifications of GC, DZ, LZ, and the DZ slash LZ ratio.

B cell development and differentiation in AID R112H mice and bone marrow chimeric mice. (A) B cell development in bone marrow by the Hardy classification. Upper panels: Representative FACS plots for gating strategy. Lower panels: Total cell number of bone marrow, P = 0.032, WT versus AIDR112H, unpaired t test (n = 5, one experiment); % of FrA (fraction A), FrB + C (fraction B + C), FrD + E (fraction D + E), nonsignificant when comparing WT versus AIDR112H in all groups. (B) B cell development in the spleen. Upper panels: Representative FACS plots for gating. Lower panels: Quantifications, total spleen cells, nonsignificant; total B220+ cells, P = 0.044, unpaired t test (n = 5, one experiment); % of T1, T2 MZP; B220+, MZB, FoB, nonsignificant for all groups, WT versus AIDR112H, unpaired t test (n = 5, one experiment). (C) GC in spleen section on day 7 upon SRBC immunization. Blue: IgD; green: GL7; red: CD21/35. Scale bar, 200 µm. (D) GC response on day 7 upon SRBC immunization. Left panels: representative FACS plot for GC, DZ, and LZ; Right panels: quantification, WT versus AIDR112H; GC, P < 0.0001; DZ, P = 0.137; LZ, P = 0.0037. DZ/LZ ratio, P = 0.0097, unpaired t test (n = 13, three experiments). (E) Active caspase 3+ apoptotic cells in GC. FACS plots and quantification, WT versus AIDR112H, P < 0.01, t test (n = 19–21, four experiments). (F) Memory B cell differentiation in the spleen. FACS plot and quantification, P < 0.01, unpaired t test (n = 13, three experiments). (G) Antigen-dependent B cell differentiation in the spleen of bone marrow chimeric mice. Upper panel: Experiment scheme. Middle panel: FACS plot of splenic PB and PCs in the chimeric mice. Lower panel: Quantification, y axis: log2 of measured AIDR112H/WT-to-grafted AIDR112H/WT ratio; GC, DZ, and LZ: P < 0.0001; PC: P < 0.001; MB: P < 0.01, one-sample t test (n = 14–22, three experiments). (H) GC response in the bone marrow chimeric mice. Left panels: Representative FACS plot; right: quantification, CD45.1 WT versus CD45.2 AIDR112H; GC, P < 0.0001, paired t test (n = 33, four experiments); DZ, P < 0.0001; LZ, P < 0.0001, two-way ANOVA (n = 14, three experiments); DZ/LZ ratio, P < 0.0001, paired t test (n = 14, three experiments). Value and error bar: mean ± SD. MB, memory B cell; T1, transitional 1; T2 MZP, transitional 2 marginal zone progenitor; MZB, marginal zone B cells; FoB, follicular B cells. *P < 0.05, **P < 0.01, ***P < 0.001.

Close modal
+ Expand view − Collapse view
Figure S1
B cell development and differentiation in bone marrow chimeric mice. (A) B cell development in the bone marrow chimeric mice. y axis: log2 of measured AIDR112H/WT-to-grafted AIDR112H/WT ratio, value 1 = twofold advantage, −1 = twofold disadvantage of AIDR112H; B220+, transitional 1: P < 0.0001; T2 MZP, P < 0.01. one-sample t test (n = 14–22, three experiments). (B) PC differentiation in the spleen. FACS plot and quantification: PB and PC, P > 0.05, unpaired t test (n = 9, two experiments). (C) Tfh cells in the spleen. FACS plot and quantification, nonsignificant. ANOVA (n = 5, two experiments). (D) Gating strategy to identify PB and PC in GC and GL7lo/−CD95+ cell population from CD45.1 WT cells and CD45.2 AIDR112H cells. PB: B220+CD138+, PC: B220−CD138+, representative FACS plots. (E) Quantification for D, CD138+ cells (PB + PC) in DZ and LZ. DZ: P = 0.0024; LZ: nonsignificant, two-way ANOVA (n = 6, two experiments); GL7lo/−CD95+ cells in CD45.1 WT cells and CD45.2 AIDR112H cells, P < 0.001, paired t test (n = 15, three experiments); CD138+ cells in different subsets from GL7lo/−CD95+ cell population: CXCR4hi: P = 0.0014; CD83/86+: P = 0.225, two-way ANOVA (n = 6, two experiments). (F) Immunohistochemistry of GC from full spleen sections of WT and AIDR112H mouse 7 days after SRBC immunization. Red: CD21/35; green: GL7; blue: IgD. Scale bar, 500 µm. (G) RNA-sequencing heatmap for the top 50 DEGs comparing GL7lo/−CD95+ versus GL7+CD95+. T2 MZP, transitional 2 marginal zone progenitor; DEGs, differentially expressed genes. *P < 0.05, **P < 0.01, ***P < 0.001. Refer to the image caption for details. Panel A: A scatter plot shows B cell development in bone marrow chimeric mice. The y-axis represents the log2 of the measured AIDR112H slash WT ratio, with values indicating the advantage or disadvantage of AIDR112H. Different B cell stages are compared, with significant differences noted in Transitional 1 and T2 MZP stages. Panel B: Flow cytometry plots and bar graphs show total plasma cell differentiation in the spleen, with no significant differences between WT and AIDR112H mice. Panel C: Flow cytometry plots and bar graph depict T follicular helper cells in the spleen, showing non-significant differences between WT and AIDR112H mice. Panel D: Flow cytometry plots illustrate the gating strategy to identify plasma cells and other B cell populations in germinal centers and GL7lo-CD95 positive cell populations from WT and AIDR112H cells. Panel E: Bar graphs quantify the data from Panel D, showing significant differences in CD138 positive cells in the dark zone and GL7lo-CD95 positive cells between WT and AIDR112H mice. Panel F: Immunohistochemistry images of germinal centers from spleen sections of WT and AIDR112H mice, stained for CD21 slash 35, GL7, and IgD, with a scale bar of 500 micrometers. Panel G: A heatmap displays the top 50 differentially expressed genes comparing GL7lo-CD95 positive vs GL7 plus CD95 positive cells.

B cell development and differentiation in bone marrow chimeric mice. (A) B cell development in the bone marrow chimeric mice. y axis: log2 of measured AIDR112H/WT-to-grafted AIDR112H/WT ratio, value 1 = twofold advantage, −1 = twofold disadvantage of AIDR112H; B220+, transitional 1: P < 0.0001; T2 MZP, P < 0.01. one-sample t test (n = 14–22, three experiments). (B) PC differentiation in the spleen. FACS plot and quantification: PB and PC, P > 0.05, unpaired t test (n = 9, two experiments). (C) Tfh cells in the spleen. FACS plot and quantification, nonsignificant. ANOVA (n = 5, two experiments). (D) Gating strategy to identify PB and PC in GC and GL7lo/−CD95+ cell population from CD45.1 WT cells and CD45.2 AIDR112H cells. PB: B220+CD138+, PC: B220CD138+, representative FACS plots. (E) Quantification for D, CD138+ cells (PB + PC) in DZ and LZ. DZ: P = 0.0024; LZ: nonsignificant, two-way ANOVA (n = 6, two experiments); GL7lo/−CD95+ cells in CD45.1 WT cells and CD45.2 AIDR112H cells, P < 0.001, paired t test (n = 15, three experiments); CD138+ cells in different subsets from GL7lo/−CD95+ cell population: CXCR4hi: P = 0.0014; CD83/86+: P = 0.225, two-way ANOVA (n = 6, two experiments). (F) Immunohistochemistry of GC from full spleen sections of WT and AIDR112H mouse 7 days after SRBC immunization. Red: CD21/35; green: GL7; blue: IgD. Scale bar, 500 µm. (G) RNA-sequencing heatmap for the top 50 DEGs comparing GL7lo/−CD95+ versus GL7+CD95+. T2 MZP, transitional 2 marginal zone progenitor; DEGs, differentially expressed genes. *P < 0.05, **P < 0.01, ***P < 0.001.

Figure S1.
A multi-part image depicts B cell development and differentiation in bone marrow chimeric mice, comparing wildtype and AIDR112H mice. Panel A: A scatter plot shows B cell development in bone marrow chimeric mice. The y-axis represents the log2 of the measured AIDR112H slash WT ratio, with values indicating the advantage or disadvantage of AIDR112H. Different B cell stages are compared, with significant differences noted in Transitional 1 and T2 MZP stages. Panel B: Flow cytometry plots and bar graphs show total plasma cell differentiation in the spleen, with no significant differences between WT and AIDR112H mice. Panel C: Flow cytometry plots and bar graph depict T follicular helper cells in the spleen, showing non-significant differences between WT and AIDR112H mice. Panel D: Flow cytometry plots illustrate the gating strategy to identify plasma cells and other B cell populations in germinal centers and GL7lo-CD95 positive cell populations from WT and AIDR112H cells. Panel E: Bar graphs quantify the data from Panel D, showing significant differences in CD138 positive cells in the dark zone and GL7lo-CD95 positive cells between WT and AIDR112H mice. Panel F: Immunohistochemistry images of germinal centers from spleen sections of WT and AIDR112H mice, stained for CD21 slash 35, GL7, and IgD, with a scale bar of 500 micrometers. Panel G: A heatmap displays the top 50 differentially expressed genes comparing GL7lo-CD95 positive vs GL7 plus CD95 positive cells.

B cell development and differentiation in bone marrow chimeric mice. (A) B cell development in the bone marrow chimeric mice. y axis: log2 of measured AIDR112H/WT-to-grafted AIDR112H/WT ratio, value 1 = twofold advantage, −1 = twofold disadvantage of AIDR112H; B220+, transitional 1: P < 0.0001; T2 MZP, P < 0.01. one-sample t test (n = 14–22, three experiments). (B) PC differentiation in the spleen. FACS plot and quantification: PB and PC, P > 0.05, unpaired t test (n = 9, two experiments). (C) Tfh cells in the spleen. FACS plot and quantification, nonsignificant. ANOVA (n = 5, two experiments). (D) Gating strategy to identify PB and PC in GC and GL7lo/−CD95+ cell population from CD45.1 WT cells and CD45.2 AIDR112H cells. PB: B220+CD138+, PC: B220CD138+, representative FACS plots. (E) Quantification for D, CD138+ cells (PB + PC) in DZ and LZ. DZ: P = 0.0024; LZ: nonsignificant, two-way ANOVA (n = 6, two experiments); GL7lo/−CD95+ cells in CD45.1 WT cells and CD45.2 AIDR112H cells, P < 0.001, paired t test (n = 15, three experiments); CD138+ cells in different subsets from GL7lo/−CD95+ cell population: CXCR4hi: P = 0.0014; CD83/86+: P = 0.225, two-way ANOVA (n = 6, two experiments). (F) Immunohistochemistry of GC from full spleen sections of WT and AIDR112H mouse 7 days after SRBC immunization. Red: CD21/35; green: GL7; blue: IgD. Scale bar, 500 µm. (G) RNA-sequencing heatmap for the top 50 DEGs comparing GL7lo/−CD95+ versus GL7+CD95+. T2 MZP, transitional 2 marginal zone progenitor; DEGs, differentially expressed genes. *P < 0.05, **P < 0.01, ***P < 0.001.

Close modal
Figure 2.
A multi-part image depicts cell cycle analysis in mice and iGB cells. Panel A: The panel shows a combination of flow cytometry plots and bar graphs. The flow cytometry plots display BrdU incorporation in different cell populations (Non-Act FoB, GC, DZ, LZ) from WT and AIDR112H mice. The bar graphs quantify the percentage of BrdU positive cells and cell cycle distribution in GC B cells. The x-axis of the bar graphs represents different cell cycle phases (G1, early S, late S, G2 slash M), and the y-axis represents the percentage of cells. The data show significant differences in BrdU positive cells and cell cycle distribution between WT and AIDR112H mice. Panel B: The panel shows a combination of flow cytometry plots and bar graphs. The flow cytometry plots display EdU and BrdU double labeling in iGB cells at different time points (5 min, 1h, 2h, 4h). The bar graphs quantify the percentage of BrdU single positive cells and cell cycle distribution. The x-axis of the bar graphs represents different time points and cell cycle phases, and the y-axis represents the percentage of cells. The data shows significant differences in BrdU single positive cells and cell cycle distribution between WT and AIDR112H iGB cells. Panel C: The panel shows a combination of histogram overlays and line graphs. The histogram overlays display the proliferation rate of iGB cells measured by dilution of Cell Trace Violet (CTV) on day 3 and day 4. The line graphs quantify the percentage of cells in each division. The x-axis of the line graphs represents different cell divisions, and the y-axis represents the percentage of cells. The data shows the proliferation rate of WT and AIDR112H iGB cells over time.

Reduced G1/S transition of AID R112H iGB cells and GC B cells. (A) In vivo BrdU labeling of GC B cells on day 7 upon SRBC immunization. Schematics of experimental setup and representative FACS plots. Quantification: BrdU+ cells in GC: P = 0.0035; DZ: P = 0.0014; LZ: P = 0.0294, two-way ANOVA (n = 10–11, two experiments). Cell cycle distribution, G1: P = 0.0027; early S: P = 0.0002; two-way ANOVA (n = 5–6, one experiment). 7-AAD on a linear scale to reflect the amount of the DNA content. (B) EdU and BrdU double labeling in iGB cells. Schematics for experimental setup and representative FACS plots and quantification, BrdU single-positive cells at 4 h: ****P < 0.0001. Cell cycle distribution: G1, ****P < 0.0001; early S, ****P < 0.0001; late S, **P < 0.01; 7-AAD on a linear scale to reflect the amount of the DNA content (n = 4, two experiments). (C) iGB cell proliferation rate measured by dilution of CTV. Left: Histogram overlay of WT and AIDR112H cells on day 3 and day 4. Right: Quantification of the percentage of cells in each division. Value and error bar: mean ± SD. MFI, mean fluorescence intensity.

Close modal
Figure 3.
A multi-part image depicts the analysis of B cells and plasma cells in wild-type and AIDR112H mice. Panel A: Flow cytometry plots show the gating strategy for identifying plasmablasts (PB, antibody-secreting precursor cells) and plasma cells (PC, terminally differentiated antibody-secreting cells) in germinal centers (GC) and GL7 low or negative CD95 positive cell populations. The plots are divided into wild-type (WT) and AIDR112H mice, with markers for B220 (B cell marker), CD138 (plasma cell marker), GL7 (germinal center marker), CD95 (Fas receptor), CD83/86 (activation markers CD83 and CD86), and CXCR4 (chemokine receptor C-X-C motif receptor 4). Panel B: Bar graphs quantify the percentages of CD138 positive (plasma cell marker expressing) cells in dark zone (DZ), light zone (LZ), GL7 low or negative CD95 positive cells, CD138 positive in CXCR4 high (high CXCR4 expressing) cells, and CD138 positive in CD83/86 positive (activation marker expressing) populations, comparing WT and AIDR112H mice. Panel C: Immunohistochemistry images of spleen germinal centers (GCs) stained for CD21/35 (complement receptors CD21 and CD35, shown in red), GL7 (germinal center marker, green), and IgD (Immunoglobulin D, blue). A bar graph quantifies the percentage of IgD negative GL7 negative CD21/35 positive germinal centers among total IgD negative CD21/35 positive germinal centers in WT and AIDR112H mice. Panel D: Flow cytometry plots and bar graphs show the NP-specific (nitrophenyl antigen-specific) response of germinal center (GC) and GL7 low or negative CD95 positive B cells in WT mice, with quantifications for NP positive (antigen-binding) cells and NP positive CD138 positive (antigen-specific plasma cell marker expressing) cells. Panel E: RNA sequencing (RNA-seq, transcriptome profiling) analysis comparing GL7 high versus GL7 low germinal center B cells. The left panel shows gene set enrichment analysis (GSEA) using defined gene signatures, and the right panel shows a GSEA network analysis highlighting gene sets positively enriched in GL7 high versus GL7 low cells.

AID R112H mice have reduced PC differentiation in GCs and accumulate GL7 lo/− tGC B cells. (A) Gating strategy of PB and PC in GC and GL7lo/−CD95+ cell population. PB: B220+CD138+; PC: B220CD138+. FACS plot for GC and GL7lo/−CD95+ gating used in Fig. S2 E to display other surface markers stained on the same samples. (B) Quantifications for A, WT versus AIDR112H; CD138+ cells in DZ, **P = 0.0019; CD138+ cells in LZ, nonsignificant. GL7lo/−CD95+ cells: ****P < 0.0001; CD138+ in CXCR4hi: ****P < 0.0001; CD138+ in CD83/86+: P = 0.044, unpaired t test (n = 8, two experiments). (C) Immunohistochemistry of spleen GCs. Red, CD21/35; green, GL7; blue, IgD. Quantification of IgDGL7CD21/35+ GCs among total IgDCD21/35+ GCs, P = 0.0051, unpaired t test (n = 6, two experiments). Scale bar, 80 µm. (D) NP-specific response of GC and GL7lo/−CD95+ B cells in WT mice. FACS plots and quantification, GC versus GL7lo/−CD95+. NP+: P = 0.0028; NP+CD138+: P = 0.0002, unpaired t test (n = 10, two experiments). (E) RNA sequencing comparing GL7hi versus GL7lo GC B cells. Left panel: GSEA using gene signature defined in work (Gómez-Escolar et al., 2022; Glaros et al., 2021); right panel: GSEA network analysis showing gene sets positively enriched in GL7.hi versus GL7.lo. Value and error bar: mean ± SD.

Close modal
+ Expand view − Collapse view
Figure S2
Fate mapping of GC-experienced B cells in WT mice and impaired IRF4 upregulation and CXCR5 downregulation of GC B cells in AIDR112Hmice. (A) Proportion of GC-derived B cells in GL7+CD95+ and GL7lo/−CD95+ cell populations in S1PR2ERT2Cre-RS-loxStoplox-tdTomato mouse model. Gating strategy and quantification of cells with GC identity or GC-derived (BCL6+ and tdTomato+) (n = 6, one experiment). (B) GO-term enrichment treeplot for GL7+CD95+(GL7.hi.) cells and GL7lo/−CD95+(GL7.lo.) cells. (C) GC-derived IRF4hiPAX5lo cells in GL7+CD95+ and GL7lo/−CD95+ cell populations in S1PR2ERT2Cre-RS-loxStoplox-tdTomato mouse model. Representative FACS plots and gating strategy. Quantification of tdTomato+ cells among the IRF4hiPAX5lo cells (n = 6, one experiment). (D) PC differentiation in vivo during the GC response upon BI-3802 treatment for 24 h. Left: Representative FACS plots. Right: Quantification of BCL6lo: WT versus AIDR112H, P < 0.0001; WT + BI-3802 versus AIDR112H + BI-3802: P < 0.01; AIDR112H versus AIDR112H + BI-3802: P < 0.01; IRF4hiPAX5lo cells: WT versus AIDR112H, P < 0.001; WT + BI-3802 versus AIDR112H + BI-3802: P < 0.0001; AIDR112H versus AIDR112H + BI-3802: nonsignificant; IRF4hi within the BCL6lo population: WT versus AIDR112H, P < 0.01; WT + BI-3802 versus AIDR112H + BI-3802: P < 0.01; nonsignificant difference in treated versus nontreated, two-way ANOVA (n = 4–5, one experiment). (E) Impaired CXCR5 downregulation in AIDR112H GL7loCD95+ cells. FACS plots and quantification. Same FACS plot on column 1 and column 4 in each row is displayed to show gating strategy for GC and GL7loCD95+ population, respectively. FACS plot for GC and GL7lo/−CD95+ gating used here from the same samples is shown in Fig. 3 A. GL7loCD95+: P < 0.01; CXCR4hi: P < 0.0001; CD83/86+: P < 0.05, one-way ANOVA (n = 8, two experiments). (F) Upregulation of IRF4 versus cell division in iGB cells. Representative FACS plot and quantification, IRF4 MFI versus cell division, data from two experiments. (G) Overexpression of IRF4 in iGB cells by retroviral transfection. Left: Representative FACS plots. Right: Quantification of IRF4hiPAX5lo cells in control and IRF4-transfected cultures. Ctrl-IRES-GFP: no significant changes between WT GFP− versus WT GFP+; no significant changes between AIDR112H GFP− versus AIDR112H GFP+; IRF4-IRES-GFP: P < 0.0001, WT GFP− versus WT GFP+; P < 0.0001, AIDR112H GFP− versus AIDR112H GFP+, two-way ANOVA (n = 5–6, two experiments). (H) Increased Ig production of IRF4hiPAX5lo cells in WT iGB cultured B cells. Representative FACS plot, IgG1hi cells overlaid with total B220+ iGB cells. MFI, mean fluorescence intensity. *P < 0.05, **P < 0.01, ***P < 0.001, ****P < 0.0001. Refer to the image caption for details. Panel A: Flow cytometry plots show the gating strategy for identifying plasmablasts (PB, proliferating antibody-secreting precursor cells) and plasma cells (PC, terminally differentiated antibody-secreting cells) within germinal center (GC) and GL7 low or negative CD95 positive cell populations. The plots are gated on B220 (pan B cell marker) and CD138 (plasma cell marker) markers. A bar graph quantifies the proportion of GC-derived B cells in GL7 positive CD95 positive and GL7 low or negative CD95 positive populations in the S1PR2ERT2Cre-RS-loxStoplox-tdTomato mouse model (tamoxifen-inducible Cre recombinase under S1PR2 promoter with tdTomato reporter). Panel B: A Gene Ontology (GO) term enrichment TreePlot displays the enriched biological processes in GL7 positive CD95 positive (GL7 high) and GL7 low or negative CD95 positive (GL7 low) cells. Panel C: Flow cytometry plots and a bar graph illustrate the gating strategy and quantification of GC-derived IRF4 high PAX5 low cells (Interferon Regulatory Factor 4 high, Paired Box Protein 5 low; indicative of plasma cell differentiation) in GL7 positive CD95 positive and GL7 low or negative CD95 positive populations. Panel D: Flow cytometry plots and bar graphs show the effect of BI3802 treatment (BCL6 degrader compound) on plasma cell differentiation in wild-type (WT) and AIDR112H mice, with quantifications of BCL6 low (B cell lymphoma 6 low), IRF4 high PAX5 low cells, and IRF4 high cells within the BCL6 low population. Panel E: Flow cytometry plots and a bar graph depict the impaired CXCR5 downregulation (C-X-C motif chemokine receptor 5) in AIDR112H GL7 low CD95 positive cells, with quantifications of GL7 low CD95 positive, CXCR4 high (C-X-C motif chemokine receptor 4 high), and CD83 slash 86 positive (activation markers CD83 and CD86 expressing) cells. Panel F: A flow cytometry plot and a line graph show the upregulation of IRF4 (Interferon Regulatory Factor 4) versus cell division in iGB cells (in vitro generated germinal center B cells), with data from two experiments. Panel G: Flow cytometry plots and bar graphs illustrate the overexpression of IRF4 (Interferon Regulatory Factor 4) in iGB cells by retroviral transfection, with quantifications of IRF4 high PAX5 low cells in control and IRF4-transfected cultures. Panel H: A flow cytometry plot shows increased immunoglobulin (Ig) production of IRF4 high PAX5 low cells in WT iGB cultured B cells, with IgG1 high (Immunoglobulin G1 high expressing) cells overlaid with total B220 positive iGB cells.

Fate mapping of GC-experienced B cells in WT mice and impaired IRF4 upregulation and CXCR5 downregulation of GC B cells in AID R112H mice. (A) Proportion of GC-derived B cells in GL7+CD95+ and GL7lo/−CD95+ cell populations in S1PR2ERT2Cre-RS-loxStoplox-tdTomato mouse model. Gating strategy and quantification of cells with GC identity or GC-derived (BCL6+ and tdTomato+) (n = 6, one experiment). (B) GO-term enrichment treeplot for GL7+CD95+(GL7.hi.) cells and GL7lo/−CD95+(GL7.lo.) cells. (C) GC-derived IRF4hiPAX5lo cells in GL7+CD95+ and GL7lo/−CD95+ cell populations in S1PR2ERT2Cre-RS-loxStoplox-tdTomato mouse model. Representative FACS plots and gating strategy. Quantification of tdTomato+ cells among the IRF4hiPAX5lo cells (n = 6, one experiment). (D) PC differentiation in vivo during the GC response upon BI-3802 treatment for 24 h. Left: Representative FACS plots. Right: Quantification of BCL6lo: WT versus AIDR112H, P < 0.0001; WT + BI-3802 versus AIDR112H + BI-3802: P < 0.01; AIDR112H versus AIDR112H + BI-3802: P < 0.01; IRF4hiPAX5lo cells: WT versus AIDR112H, P < 0.001; WT + BI-3802 versus AIDR112H + BI-3802: P < 0.0001; AIDR112H versus AIDR112H + BI-3802: nonsignificant; IRF4hi within the BCL6lo population: WT versus AIDR112H, P < 0.01; WT + BI-3802 versus AIDR112H + BI-3802: P < 0.01; nonsignificant difference in treated versus nontreated, two-way ANOVA (n = 4–5, one experiment). (E) Impaired CXCR5 downregulation in AIDR112H GL7loCD95+ cells. FACS plots and quantification. Same FACS plot on column 1 and column 4 in each row is displayed to show gating strategy for GC and GL7loCD95+ population, respectively. FACS plot for GC and GL7lo/−CD95+ gating used here from the same samples is shown in Fig. 3 A. GL7loCD95+: P < 0.01; CXCR4hi: P < 0.0001; CD83/86+: P < 0.05, one-way ANOVA (n = 8, two experiments). (F) Upregulation of IRF4 versus cell division in iGB cells. Representative FACS plot and quantification, IRF4 MFI versus cell division, data from two experiments. (G) Overexpression of IRF4 in iGB cells by retroviral transfection. Left: Representative FACS plots. Right: Quantification of IRF4hiPAX5lo cells in control and IRF4-transfected cultures. Ctrl-IRES-GFP: no significant changes between WT GFP versus WT GFP+; no significant changes between AIDR112H GFP versus AIDR112H GFP+; IRF4-IRES-GFP: P < 0.0001, WT GFP versus WT GFP+; P < 0.0001, AIDR112H GFP− versus AIDR112H GFP+, two-way ANOVA (n = 5–6, two experiments). (H) Increased Ig production of IRF4hiPAX5lo cells in WT iGB cultured B cells. Representative FACS plot, IgG1hi cells overlaid with total B220+ iGB cells. MFI, mean fluorescence intensity. *P < 0.05, **P < 0.01, ***P < 0.001, ****P < 0.0001.

Figure S2.
A multi-part image depicts the analysis of B cell populations and gene expression in wild-type and AIDR112H mice. Panel A: Flow cytometry plots show the gating strategy for identifying plasmablasts (PB, proliferating antibody-secreting precursor cells) and plasma cells (PC, terminally differentiated antibody-secreting cells) within germinal center (GC) and GL7 low or negative CD95 positive cell populations. The plots are gated on B220 (pan B cell marker) and CD138 (plasma cell marker) markers. A bar graph quantifies the proportion of GC-derived B cells in GL7 positive CD95 positive and GL7 low or negative CD95 positive populations in the S1PR2ERT2Cre-RS-loxStoplox-tdTomato mouse model (tamoxifen-inducible Cre recombinase under S1PR2 promoter with tdTomato reporter). Panel B: A Gene Ontology (GO) term enrichment TreePlot displays the enriched biological processes in GL7 positive CD95 positive (GL7 high) and GL7 low or negative CD95 positive (GL7 low) cells. Panel C: Flow cytometry plots and a bar graph illustrate the gating strategy and quantification of GC-derived IRF4 high PAX5 low cells (Interferon Regulatory Factor 4 high, Paired Box Protein 5 low; indicative of plasma cell differentiation) in GL7 positive CD95 positive and GL7 low or negative CD95 positive populations. Panel D: Flow cytometry plots and bar graphs show the effect of BI3802 treatment (BCL6 degrader compound) on plasma cell differentiation in wild-type (WT) and AIDR112H mice, with quantifications of BCL6 low (B cell lymphoma 6 low), IRF4 high PAX5 low cells, and IRF4 high cells within the BCL6 low population. Panel E: Flow cytometry plots and a bar graph depict the impaired CXCR5 downregulation (C-X-C motif chemokine receptor 5) in AIDR112H GL7 low CD95 positive cells, with quantifications of GL7 low CD95 positive, CXCR4 high (C-X-C motif chemokine receptor 4 high), and CD83 slash 86 positive (activation markers CD83 and CD86 expressing) cells. Panel F: A flow cytometry plot and a line graph show the upregulation of IRF4 (Interferon Regulatory Factor 4) versus cell division in iGB cells (in vitro generated germinal center B cells), with data from two experiments. Panel G: Flow cytometry plots and bar graphs illustrate the overexpression of IRF4 (Interferon Regulatory Factor 4) in iGB cells by retroviral transfection, with quantifications of IRF4 high PAX5 low cells in control and IRF4-transfected cultures. Panel H: A flow cytometry plot shows increased immunoglobulin (Ig) production of IRF4 high PAX5 low cells in WT iGB cultured B cells, with IgG1 high (Immunoglobulin G1 high expressing) cells overlaid with total B220 positive iGB cells.

Fate mapping of GC-experienced B cells in WT mice and impaired IRF4 upregulation and CXCR5 downregulation of GC B cells in AID R112H mice. (A) Proportion of GC-derived B cells in GL7+CD95+ and GL7lo/−CD95+ cell populations in S1PR2ERT2Cre-RS-loxStoplox-tdTomato mouse model. Gating strategy and quantification of cells with GC identity or GC-derived (BCL6+ and tdTomato+) (n = 6, one experiment). (B) GO-term enrichment treeplot for GL7+CD95+(GL7.hi.) cells and GL7lo/−CD95+(GL7.lo.) cells. (C) GC-derived IRF4hiPAX5lo cells in GL7+CD95+ and GL7lo/−CD95+ cell populations in S1PR2ERT2Cre-RS-loxStoplox-tdTomato mouse model. Representative FACS plots and gating strategy. Quantification of tdTomato+ cells among the IRF4hiPAX5lo cells (n = 6, one experiment). (D) PC differentiation in vivo during the GC response upon BI-3802 treatment for 24 h. Left: Representative FACS plots. Right: Quantification of BCL6lo: WT versus AIDR112H, P < 0.0001; WT + BI-3802 versus AIDR112H + BI-3802: P < 0.01; AIDR112H versus AIDR112H + BI-3802: P < 0.01; IRF4hiPAX5lo cells: WT versus AIDR112H, P < 0.001; WT + BI-3802 versus AIDR112H + BI-3802: P < 0.0001; AIDR112H versus AIDR112H + BI-3802: nonsignificant; IRF4hi within the BCL6lo population: WT versus AIDR112H, P < 0.01; WT + BI-3802 versus AIDR112H + BI-3802: P < 0.01; nonsignificant difference in treated versus nontreated, two-way ANOVA (n = 4–5, one experiment). (E) Impaired CXCR5 downregulation in AIDR112H GL7loCD95+ cells. FACS plots and quantification. Same FACS plot on column 1 and column 4 in each row is displayed to show gating strategy for GC and GL7loCD95+ population, respectively. FACS plot for GC and GL7lo/−CD95+ gating used here from the same samples is shown in Fig. 3 A. GL7loCD95+: P < 0.01; CXCR4hi: P < 0.0001; CD83/86+: P < 0.05, one-way ANOVA (n = 8, two experiments). (F) Upregulation of IRF4 versus cell division in iGB cells. Representative FACS plot and quantification, IRF4 MFI versus cell division, data from two experiments. (G) Overexpression of IRF4 in iGB cells by retroviral transfection. Left: Representative FACS plots. Right: Quantification of IRF4hiPAX5lo cells in control and IRF4-transfected cultures. Ctrl-IRES-GFP: no significant changes between WT GFP versus WT GFP+; no significant changes between AIDR112H GFP versus AIDR112H GFP+; IRF4-IRES-GFP: P < 0.0001, WT GFP versus WT GFP+; P < 0.0001, AIDR112H GFP− versus AIDR112H GFP+, two-way ANOVA (n = 5–6, two experiments). (H) Increased Ig production of IRF4hiPAX5lo cells in WT iGB cultured B cells. Representative FACS plot, IgG1hi cells overlaid with total B220+ iGB cells. MFI, mean fluorescence intensity. *P < 0.05, **P < 0.01, ***P < 0.001, ****P < 0.0001.

Close modal
Figure 4.
A two-part image depicts the expression of transcription factors in GC B cells. Panel A: Multiple flow cytometry plots and bar graphs depict the gating strategy and quantification of transcription factors BCL6 (B cell lymphoma 6), IRF4 (Interferon Regulatory Factor 4), and PAX5 (Paired Box Protein 5) in germinal center (GC) and GL7 low CD95 positive B cells. The flow cytometry plots show the gating strategy for identifying different cell populations based on markers such as B220 (pan B cell marker), CD38 (B cell activation marker), CD95 (Fas receptor), GL7 (germinal center marker), and IRF4 (Interferon Regulatory Factor 4). The bar graphs compare the percentage of GC B cells, GL7 low or negative CD95 positive B cells, IRF4 high PAX5 low cells (Interferon Regulatory Factor 4 high, Paired Box Protein 5 low) in GC, IRF4 high PAX5 low cells in GL7 low or negative CD95 positive cells, IRF4 high in BCL6 low (B cell lymphoma 6 low) GC cells, BCL6 high in GL7 low CD95 positive cells, and IRF4 high in BCL6 low GL7 low CD95 positive cells between WT (wild-type) and AIDR112H mice. Significant differences are indicated with p-values. Panel B: Overlaid histograms and bar graphs show the expression levels of IRF4 (Interferon Regulatory Factor 4) and PAX5 (Paired Box Protein 5) in GC B cells. The histograms compare the mean fluorescence intensity (MFI, average signal intensity per cell) of IRF4 and PAX5 between WT and AIDR112H mice. The bar graphs quantify these differences, with a significant reduction in IRF4 MFI in AIDR112H mice compared to WT, while PAX5 MFI shows no significant difference.

AID R112H GC B cells have reduced capacity to upregulate IRF4. (A) Gating strategy for expression of transcription factors BCL6, IRF4, and PAX5 in GC and GL7loCD95+ B cells. FACS plots and quantification, WT versus AIDR112H, GC: P < 0.0001; GL7lo/−CD95+, P < 0.0001; IRF4hiPAX5lo in GC: P < 0.0001; IRF4hiPAX5lo in GL7lo/−CD95+, P < 0.0001; IRF4hi in BCL6lo (GC): P < 0.0001; BCL6hi in GL7loCD95+: P < 0.0001; IRF4hi in BCL6lo (GL7loCD95+): P < 0.0001, unpaired t test (n = 9–10, three experiments). ***P < 0.001, ****P < 0.0001. (B) Expression level of IRF4 and PAX5 in GC B cells. Overlay of histogram of IRF4 and PAX5 acquired by flow cytometry and quantification, WT versus AIDR112H, IRF4 MFI: P = 0.0006, unpaired t test (n = 4, two experiments). Nonsignificant differences for PAX5 MFI. Value and error bar: mean ± SD. Value and error bar: mean ± SD.

Close modal
Figure 5.
A multi-part image depicts the differentiation of plasma cells in iGB cultures, comparing wild-type and AIDR112H mice. Panel A: A schematic diagram shows the process of B cell culture and differentiation into plasmablasts. Flow cytometry plots illustrate the differentiation of plasmablasts (CD138 positive and IRF4hiPAX5lo cell population). Panel B: Flow cytometry plots and a bar graph show the percentage of CD138 positive plasmablasts from day 0 to day 7 in wild-type (WT) and AIDR112H mice. The bar graph quantifies these percentages, indicating significant differences at day 0, day 4, day 5, and day 7. Panel C: Flow cytometry plots and a bar graph display the percentage of IRF4hiPAX5lo cells from day 0 to day 7 in WT and AIDR112H mice. The bar graph quantifies these percentages, showing significant differences at day 4, day 5, and day 7. Panel D: Overlaid histograms show the expression of IRF4 and PAX5 in iGB cells, with a bar graph quantifying the mean fluorescence intensity (MFI) of IRF4 and PAX5, indicating a significant difference in IRF4 MFI. Panel E: Images from Imagestream analysis show the expression of IRF4, PAX5, and FOXO1 in iGB cells on day 7, with representative images of PAX5 positive and IRF4hiPAX5lo cells.

Reduced AID R112H PC formation from in vitro iGB cells. (A) PC differentiation in iGB cultures. Schematics of B cells cultured on 40LB cells and representative FACS plots for PB differentiation (CD138+ and IRF4hiPAX5lo cell population). (B) CD138+ PB cells from day 0 to day 7. FACS plots and quantification, day 4 (P < 0.0001), day 5 (P < 0.0001), and day 7 (P = 0.0009) (n = 9–11, four experiments). (C) IRF4hiPAX5lo cells from day 0 to day 7. FACS plots and quantification, day 4 (P = 0.016), day 5 (P = 0.033), and day 7 (P = 0.0001) (n = 13–22, five experiments). (D) Expression of IRF4 and PAX5 of iGB cells. Overlay of histograms of IRF4 and PAX5 acquired by flow cytometry. Quantification, IRF4 MFI: P = 0.00082, nonsignificant difference for PAX5 MFI, unpaired t test (n = 4, one representative experiment). (E) ImageStream analysis of IRF4, PAX5, and FOXO1 in iGB cells on day 7. Representative images of PAX5+ and IRF4hiPAX5lo cells from the iGB culture. Images were acquired with ImageStream flow cytometry (10,000 cells acquired, two experiments). ND, nondetectable (no cells could be detected). Value and error bar: mean ± SD. *P < 0.05, ***P < 0.001, ****P < 0.0001.

Close modal
Figure 6.
A multi-part image depicts plasma cell differentiation and NP binding capacity in B cells. Panel A: The experiment scheme shows the adoptive transfer of B1-8hiWT and B1-8hiAIDR112H cells into a host, followed by analysis after immunization. The middle section displays flow cytometry plots for gating strategies to analyze germinal center (GC) response and plasma cell differentiation. The right section quantifies IRF4hiCTVlo cells in adoptively transferred WT and AIDR112H cells, showing significant differences. Panel B: The flowchart shows B cells adoptive transfer and the gating strategies to detect NP binding capacity of B1-8hi B cells in GC by flow cytometry plots. The bar graphs compares surface NP-PE MFI in GC and GL7loCD95 positive cells, and the fraction of NP-PE positive and NP-PE- GC B cells among host B, B1-8hiWT, and B1-8hiAID B cells. The bar graph also quantifies IgM plus B1-8hiWT and B1-8hiAID cells that lost NP-binding in GC and GL7loCD95 positive cells, and the fraction of NP-PE positive and NP-PE- GL7loCD95 positive B cells among host B, B1-8hiWT, and B1-8hiAID B cells.

High-affinity BCR is unable to rescue PC differentiation in AID R112H B cells. (A) PC differentiation of B1-8hiWT and B1-8hiAIDR112H cells in vivo. Left: Experiment scheme. Middle: gating strategy to analyze GC response and PC differentiation from adoptively transferred B1-8hiWT and B1-8hiAIDR112H cells. Right: Quantification, IRF4hiCTVlo in the adoptive transferred WT and AIDR112H cells: **P = 0.005; B1-8hiAIDR112H/B1-8hiWT ratio in GC: ***P = 0.0009; paired t test (n = 6, two experiments). (B) NP binding capacity of B1-8hi GC B cells. Upper: Gating strategy to detect the NP binding capacity of B1-8hi B cells in GC by FACS. Middle: Left, surface NP-PE MFI in GC and GL7loCD95+, B1-8hiWT versus B1-8hiAID cells: *P < 0.05, one-way ANOVA (n = 5, two experiments). Right: Fraction of GC B cells that were NP-PE+ and NP-PE among the host B, B1-8hiWT and B1-8hiAID B cells; fraction of BCR (IgMa)-expressing GC B cells that were NP-PE+ and NP-PE among B1-8hiWT and B1-8hiAID B cells. Lower: Left, quantification of IgM+ B1-8hiWT and B1-8hiAID cells that lost NP binding in GC and GL7loCD95+ cells, ****P < 0.0001 for GC, nonsignificant for GL7loCD95+, one-way ANOVA (n = 5, two experiments). Right: Fraction of GL7loCD95+ B cells that were NP-PE+ and NP-PE among the host B, B1-8hiWT, and B1-8hiAID B cells; fraction of BCR (IgM)-expressing GL7loCD95+ B cells that were NP-PE+ and NP-PE among B1-8hiWT and B1-8hiAID B cells.

Close modal
+ Expand view − Collapse view
Figure S3
High-affinity BCR failed to rescue PC differentiation and involvement of UNG and TET2 for IRF4 upregulation in GC B cells. (A) In vivo generation of IRF4hiNP+ cells from B1-8hiWT and B1-8hiAID cells. Left: Gating strategy to detect NP-specific (surface staining) IRF4hi cells by flow cytometry. Right: Quantification, P < 0.01, t test (n = 5, two experiments). (B) Schematics of in vivo experimental setup and gating strategy to analyze PC differentiation capacity of B1-8hiAIDR112H (green), AIDR112H (red), and CD45.1 WT (black) cells. Representative FACS plots for GC B cells and GL7lo/−CD95+ B cells. (C) Quantification of CD138+, IRF4+, NP+CD138+, and NP+IRF4+ cells in GC and GL7lo/−CD95+ cells. CD45.1 WT versus CD45.2 AIDR112H: P < 0.0001 for all groups; CD45.1 WT versus CD45.2 B1-8hiAIDR112H: P < 0.0001 for all groups, one-way ANOVA (n = 9, two experiments). Value and error bar: mean ± SD. (D) Reduced Ig class switching to IgG1 upon UGI-IRES-GFP retroviral transfection of iGB cells. Upper: Representative FACS plots for control plasmid and UGI-expressing plasmid transfection and Ig switching. Lower: Quantification of Ig switching to IgG1 among the control plasmid and UGI plasmid–transfected and nontransfected cells. (E) iGB cell proliferation rate upon UNG inhibition by UGI. Upper: Histogram overlay for nontransfected (gray) versus transfected (green) iGB cells (left: control plasmid; right: UGI plasmid). Lower: Quantification of the percentage of cells in each division in the transfected and nontransfected cells for both WT and AIDR112H iGB. Data are from one representative experiment with replicates. (F) CpG DNA methylation status at the Irf4 locus in naive B cells from WT and AIDR112H mice. Top: Schematics for the Irf4 gene locus and the region examined for DNA methylation using bisulfite sequencing. DNA methylation level at CpG sites, number above the graph shows the CpG position relative to first exon. For each CpG site, 15–30 clones were analyzed; data are from two independent experiments. (G) Ig class switching of WT and TET2 KO iGB cells on day 3 and day 6. Upper: representative FACS plots; lower: quantification, nonsignificant, ANOVA (n = 3, one experiment). **P < 0.01, ****P < 0.0001. Refer to the image caption for details. Panel A: The left side shows a flow cytometry gating strategy to detect NP-specific IRF4 high cells (nitrophenyl antigen-specific Interferon Regulatory Factor 4 high expressing cells). The right side presents a bar graph quantifying the percentage of IRF4 high cells among B1-8 high wild-type (B1-8hiWT) and B1-8 high AID mutant (B1-8hiAID) cells, with a significant difference indicated (p less than 0.01). Panel B: A schematic illustrates the experimental setup for analyzing plasma cell differentiation. Flow cytometry plots show the gating strategy for germinal center B cells (GC B cells) and GL7 low or negative CD95 positive B cells. Panel C: Bar graphs quantify CD138 positive (plasma cell marker expressing), IRF4 positive (Interferon Regulatory Factor 4 expressing), NP positive CD138 positive (nitrophenyl-specific plasma cells), and NP positive IRF4 positive cells in GC and GL7 low or negative CD95 positive cells, with significant differences noted (p less than 0.0001). Panel D: Flow cytometry plots compare immunoglobulin class switching to IgG1 (Immunoglobulin G1) upon UGI-IRES-GFP retroviral transfection (Uracil Glycosylase Inhibitor linked via Internal Ribosome Entry Site to Green Fluorescent Protein). A bar graph quantifies immunoglobulin switching to IgG1 among control and UGI plasmid-transfected cells. Panel E: Histograms overlay non-transfected and transfected iGB cells (in vitro generated germinal center B cells), showing cell proliferation rates. A line graph quantifies the percentage of cells in each division for WT (wild-type) and AIDR112H iGB cells. Panel F: A schematic of the Irf4 gene locus and a scatter plot show CpG DNA methylation status (cytosine–phosphate–guanine dinucleotide methylation) at the Irf4 locus in naive B cells from WT and AIDR112H mice. Panel G: Flow cytometry plots and a bar graph compare immunoglobulin class switching of WT (wild-type) and TET2 knockout (TET2KO, Ten-Eleven Translocation methylcytosine dioxygenase 2 deficient) iGB cells on day 3 and day 6, with no significant difference noted (analysis of variance, ANOVA).

High-affinity BCR failed to rescue PC differentiation and involvement of UNG and TET2 for IRF4 upregulation in GC B cells. (A) In vivo generation of IRF4hiNP+ cells from B1-8hiWT and B1-8hiAID cells. Left: Gating strategy to detect NP-specific (surface staining) IRF4hi cells by flow cytometry. Right: Quantification, P < 0.01, t test (n = 5, two experiments). (B) Schematics of in vivo experimental setup and gating strategy to analyze PC differentiation capacity of B1-8hiAIDR112H (green), AIDR112H (red), and CD45.1 WT (black) cells. Representative FACS plots for GC B cells and GL7lo/−CD95+ B cells. (C) Quantification of CD138+, IRF4+, NP+CD138+, and NP+IRF4+ cells in GC and GL7lo/−CD95+ cells. CD45.1 WT versus CD45.2 AIDR112H: P < 0.0001 for all groups; CD45.1 WT versus CD45.2 B1-8hiAIDR112H: P < 0.0001 for all groups, one-way ANOVA (n = 9, two experiments). Value and error bar: mean ± SD. (D) Reduced Ig class switching to IgG1 upon UGI-IRES-GFP retroviral transfection of iGB cells. Upper: Representative FACS plots for control plasmid and UGI-expressing plasmid transfection and Ig switching. Lower: Quantification of Ig switching to IgG1 among the control plasmid and UGI plasmid–transfected and nontransfected cells. (E) iGB cell proliferation rate upon UNG inhibition by UGI. Upper: Histogram overlay for nontransfected (gray) versus transfected (green) iGB cells (left: control plasmid; right: UGI plasmid). Lower: Quantification of the percentage of cells in each division in the transfected and nontransfected cells for both WT and AIDR112H iGB. Data are from one representative experiment with replicates. (F) CpG DNA methylation status at the Irf4 locus in naive B cells from WT and AIDR112H mice. Top: Schematics for the Irf4 gene locus and the region examined for DNA methylation using bisulfite sequencing. DNA methylation level at CpG sites, number above the graph shows the CpG position relative to first exon. For each CpG site, 15–30 clones were analyzed; data are from two independent experiments. (G) Ig class switching of WT and TET2 KO iGB cells on day 3 and day 6. Upper: representative FACS plots; lower: quantification, nonsignificant, ANOVA (n = 3, one experiment). **P < 0.01, ****P < 0.0001.

Figure S3.
A multi-part image depicts data on B cell differentiation and IRF4 expression. Panel A: The left side shows a flow cytometry gating strategy to detect NP-specific IRF4 high cells (nitrophenyl antigen-specific Interferon Regulatory Factor 4 high expressing cells). The right side presents a bar graph quantifying the percentage of IRF4 high cells among B1-8 high wild-type (B1-8hiWT) and B1-8 high AID mutant (B1-8hiAID) cells, with a significant difference indicated (p less than 0.01). Panel B: A schematic illustrates the experimental setup for analyzing plasma cell differentiation. Flow cytometry plots show the gating strategy for germinal center B cells (GC B cells) and GL7 low or negative CD95 positive B cells. Panel C: Bar graphs quantify CD138 positive (plasma cell marker expressing), IRF4 positive (Interferon Regulatory Factor 4 expressing), NP positive CD138 positive (nitrophenyl-specific plasma cells), and NP positive IRF4 positive cells in GC and GL7 low or negative CD95 positive cells, with significant differences noted (p less than 0.0001). Panel D: Flow cytometry plots compare immunoglobulin class switching to IgG1 (Immunoglobulin G1) upon UGI-IRES-GFP retroviral transfection (Uracil Glycosylase Inhibitor linked via Internal Ribosome Entry Site to Green Fluorescent Protein). A bar graph quantifies immunoglobulin switching to IgG1 among control and UGI plasmid-transfected cells. Panel E: Histograms overlay non-transfected and transfected iGB cells (in vitro generated germinal center B cells), showing cell proliferation rates. A line graph quantifies the percentage of cells in each division for WT (wild-type) and AIDR112H iGB cells. Panel F: A schematic of the Irf4 gene locus and a scatter plot show CpG DNA methylation status (cytosine–phosphate–guanine dinucleotide methylation) at the Irf4 locus in naive B cells from WT and AIDR112H mice. Panel G: Flow cytometry plots and a bar graph compare immunoglobulin class switching of WT (wild-type) and TET2 knockout (TET2KO, Ten-Eleven Translocation methylcytosine dioxygenase 2 deficient) iGB cells on day 3 and day 6, with no significant difference noted (analysis of variance, ANOVA).

High-affinity BCR failed to rescue PC differentiation and involvement of UNG and TET2 for IRF4 upregulation in GC B cells. (A) In vivo generation of IRF4hiNP+ cells from B1-8hiWT and B1-8hiAID cells. Left: Gating strategy to detect NP-specific (surface staining) IRF4hi cells by flow cytometry. Right: Quantification, P < 0.01, t test (n = 5, two experiments). (B) Schematics of in vivo experimental setup and gating strategy to analyze PC differentiation capacity of B1-8hiAIDR112H (green), AIDR112H (red), and CD45.1 WT (black) cells. Representative FACS plots for GC B cells and GL7lo/−CD95+ B cells. (C) Quantification of CD138+, IRF4+, NP+CD138+, and NP+IRF4+ cells in GC and GL7lo/−CD95+ cells. CD45.1 WT versus CD45.2 AIDR112H: P < 0.0001 for all groups; CD45.1 WT versus CD45.2 B1-8hiAIDR112H: P < 0.0001 for all groups, one-way ANOVA (n = 9, two experiments). Value and error bar: mean ± SD. (D) Reduced Ig class switching to IgG1 upon UGI-IRES-GFP retroviral transfection of iGB cells. Upper: Representative FACS plots for control plasmid and UGI-expressing plasmid transfection and Ig switching. Lower: Quantification of Ig switching to IgG1 among the control plasmid and UGI plasmid–transfected and nontransfected cells. (E) iGB cell proliferation rate upon UNG inhibition by UGI. Upper: Histogram overlay for nontransfected (gray) versus transfected (green) iGB cells (left: control plasmid; right: UGI plasmid). Lower: Quantification of the percentage of cells in each division in the transfected and nontransfected cells for both WT and AIDR112H iGB. Data are from one representative experiment with replicates. (F) CpG DNA methylation status at the Irf4 locus in naive B cells from WT and AIDR112H mice. Top: Schematics for the Irf4 gene locus and the region examined for DNA methylation using bisulfite sequencing. DNA methylation level at CpG sites, number above the graph shows the CpG position relative to first exon. For each CpG site, 15–30 clones were analyzed; data are from two independent experiments. (G) Ig class switching of WT and TET2 KO iGB cells on day 3 and day 6. Upper: representative FACS plots; lower: quantification, nonsignificant, ANOVA (n = 3, one experiment). **P < 0.01, ****P < 0.0001.

Close modal
Figure 7.
A multi-part image analyzes plasma cell differentiation, BCR signaling, and c-MYC expression in wildtype and AIDR112H GC B cells. Panel A: Flow cytometry plots and a bar graph show plasma cell differentiation capacity of switched (IgM negative, Immunoglobulin M non-expressing) and non-switched (IgM positive, Immunoglobulin M expressing) germinal center (GC) B cells. The bar graph compares the percentage of plasmablasts (PB, proliferating antibody-secreting precursor cells) in IgM positive and IgM negative GC B cells from wild-type (WT) and AIDR112H mice. Panel B: Histograms and line graphs depict B cell receptor (BCR) signaling in WT and AIDR112H GC B cells at different time points upon anti-BCR challenge. The line graphs quantify the levels of phosphorylated Syk (Spleen Tyrosine Kinase), Btk (Bruton’s Tyrosine Kinase), and Erk (Extracellular signal-Regulated Kinase). Panel C: Histograms and a bar graph show c-MYC (cellular Myelocytomatosis oncogene) mean fluorescence intensity (MFI, average fluorescence signal per cell) in GC B cells from WT and AIDR112H mice. Panel D: Histograms and a bar graph illustrate the up-regulation of c-MYC (cellular Myelocytomatosis oncogene) upon stimulation for 2 hours in GC B cells. The bar graph quantifies c-MYC MFI under different stimulation conditions. Panel E: Flow cytometry plots and a bar graph demonstrate the rescue of plasmablast differentiation by expressing wild-type AID protein (Activation-Induced Cytidine Deaminase) in AIDR112H iGB cells (in vitro generated germinal center B cells). The bar graph quantifies the percentage of IRF4 positive PAX5 low cells (Interferon Regulatory Factor 4 positive, Paired Box Protein 5 low; indicative of plasma cell differentiation). Panel F: Flow cytometry plots and a bar graph show the rescue of plasmablast differentiation upon treatment with 5-fluorouracil (5-FU, a thymidylate synthase inhibitor chemotherapeutic) and pemetrexed (PEM, antifolate chemotherapeutic) in iGB culture. The bar graph quantifies the percentage of IRF4 positive PAX5 low cells. Panel G: Flow cytometry plots and a bar graph illustrate the inhibition of plasmablast differentiation by expressing Ugi peptide (Uracil DNA glycosylase inhibitor peptide) in WT iGB cells. The bar graph quantifies the percentage of IRF4 positive PAX5 low cells.

PC differentiation requires WT AID protein. (A) PC differentiation capacity of switched (IgM) and nonswitched (IgM+) GC B cells. Left: Representative FACS plots. Right: Quantification, WT versus AIDR112H, PB in IgM+, *P = 0.0102; IgM+ versus IgM PB in WT GC, nonsignificant, unpaired t test (n = 3–5, one experiment). (B) BCR signaling in WT and AIDR112H GC B cells. Left: FACS plot histogram overlay at different time points upon anti-BCR challenge. Right: Quantification, WT versus AIDR112H, nonsignificant, unpaired t test (n = 4, two experiments). (C) c-MYC MFI in GC B cells. Right: Histogram overlays to show WT (black, solid and dotted line) and AIDR112H (red, solid and dotted line) cells, t test (n = 9, three experiments). (D) Upregulation of c-MYC upon stimulation for 2 h in GC B cells. Left: Histogram overlay of unstimulated and stimulated GC B cells. Right: Quantification of c-MYC MFI, anti-BCR versus unstimulated, nonsignificant; anti-CD40 versus unstimulated, ***P < 0.001 for both WT and AIDR112H; anti-CD40+anti-BCR versus unstimulated, ****P < 0.0001 for both WT and AIDR112H; nonsignificant between WT and AIDR112H for corresponding stimulation conditions. Two-way ANOVA (n = 4 mice per condition, two experiments). (E) Rescue of PB differentiation by expressing WT AID protein in AIDR112H iGB cells. FACS plots and quantification, Ctrl-IRES-GFP: no changes between GFP+ versus GFP in WT and AIDR112H iGB cells; AID-IRES-GFP: nonsignificant between WT GFP versus WT GFP+; **P = 0.0085 between AIDR112H GFP versus AIDR112H GFP+, two-way ANOVA (one representative experiment from three). (F) Rescue of PB differentiation upon 5-FU and PEM treatment in iGB culture. FACS plots and quantification, ****P < 0.0001, WT versus AIDR112H; *P = 0.0133, AIDR112H versus AIDR112H+5-FU; *P = 0.012, AIDR112H versus AIDR112H + PEM, one-way ANOVA (n = 6, three experiments). (G) Inhibition of PB differentiation by expressing Ugi peptide in WT iGB cells. FACS plots and quantification, Ctrl-IRES-GFP: no changes between WT GFP versus WT GFP+; Ugi-IRES-GFP: P < 0.0001 between WT GFP versus WT GFP+, unpaired t test (n = 18, two experiments).

Close modal
Figure 8.
A multi-part image analyze the regulation of IRF4 in wild-type and AIDR112H GC B cells, showing differences in IRF4 expression and DNA methylation.Panel A: Flow cytometry plots show the percentage of IRF4hiPAX5lo cells in GC B cells at day 7 and upon stimulation for 2 hours. The left side displays representative flow cytometry plots pre-gated on GC B cells, while the right side quantifies the data. Wild-type (WT) cells up-regulate IRF4hiPAX5lo cells upon BCR activation, whereas AIDR112H cells do not. Panel B: Flow cytometry plots and bar graphs show the mRNA levels of Bcl6 and Irf4 in purified GC B cells. The upper panels display GC purity by flow cytometry, and the lower panels quantify mRNA levels by RT-PCR. Bcl6 mRNA levels are not significantly different between WT and AIDR112H, but Irf4 mRNA levels are significantly lower in AIDR112H cells. Panel C: The top schematic shows the Irf4 gene locus and the region examined. DNA methylation levels at CpG sites are significantly higher in AIDR112H cells and a scatter plot shows the CpG DNA methylation status at the Irf4 locus in iGB cells. Panel D: Flow cytometry plots and a bar graph show the differentiation of IRF4hiPAX5lo cells in TET2 KO iGB cells. Representative FACS plots for day 0, day 3, and day 6 are shown, with quantification indicating a significant reduction in IRF4hiPAX5lo cells in TET2 KO cells on day 6. Panel E: A co-immunoprecipitation (Co-IP) experiment shows the interaction between endogenous AID and TET2 proteins in iGB cells. Immunoblots detect TET2 and AID. Panel F: Line graphs show the global chromatin association of AID, TET2, and H3K4me3 in iGB cells on day 3, with average enrichment profiles near the transcription start site (TSS). Panel G: Bar graphs show the association of AID, TET2, and H3K4me3 with the Irf4 locus in iGB cells on day 3, detected by Cut and Run and q-PCR. Significant differences are observed between WT and AIDR112H cells. Panel H: Bar graphs show the association of AID with the Switch mu region and the Irf4 enhancer/promoter in TET2 KO iGB cells on day 3, detected by Cut and Run and q-PCR. Significant differences are observed between WT and TET2 KO cells.

AID cooperates with TET2 for efficient Irf4 enhancer/promoter demethylation in GC B cells. (A) Percentage of IRF4hiPAX5lo cells in GC at day 7 and upon stimulation for 2 h. Left: Representative FACS plots (pregated on GC B cells). Right: Quantification, WT, anti-BCR versus unstimulated, P < 0.05 (t test), nonsignificant for other stimulations; AIDR112H, anti-BCR versus unstimulated, P < 0.01 (t test), nonsignificant for other stimulations. Two-way ANOVA between genotypes (n = 4 per condition, two experiments). (B)Bcl6 and Irf4 mRNA level in purified GC B cells. Upper panels: GC purity by flow cytometry. Lower panels: Quantification of Bcl6 and Irf4 mRNA level by RT-PCR; each dot represents an average value from an individual animal (technical triplicates for each animal), Bcl6 mRNA, WT versus AIDR112H, nonsignificant; Irf4 mRNA, WT versus AIDR112H, P < 0.05, ratio-paired t test (n = 3–4, two experiments). Value and error bar: mean ± SD. (C) CpG DNA methylation status at the Irf4 locus in iGB cells derived from WT and AIDR112H cells on day 7. Top: Schematics for Irf4 gene locus and the region examined for DNA methylation using bisulfite sequencing. DNA methylation level at CpG sites; number above the graph shows the CpG position relative to the first exon. For each CpG site, 15–30 clones were analyzed, WT versus AIDR112H, P < 0.0001, paired t test, data from two independent experiments. (D) IRF4hiPAX5lo cell differentiation in TET2 KO iGB cells. Representative FACS for day 0, day 3, and day 6. Quantification, day 6, WT versus TET2 KO, P < 0.01, two-way ANOVA (n = 3, one experiment). (E) Co-immunoprecipitation of endogenous AID and TET2 protein from iGB cells. Anti-TET2 pulldown and immunoblot to detect TET2 (upper panel) and AID (lower panel, uncropped blot image in Fig. S4 B in the same order). One representative blot from four independent experiments. (F) CUT&RUN sequencing to detect global chromatin association of AID, TET2, and H3K4me3 in iGB cells on day 3. Upper: Average enrichment profiles near TSS (−1.5 to +1.5 kb). (G) CUT&RUN and qPCR to detect association of AID, TET2, and H3K4me3 with the Irf4 locus in iGB cells on day 3. CUT&RUN detection region Irf4-3, Irf4-4, and Irf4-5 as indicated in the bottom of C. Black column: WT; red column: AIDR112H; y axis: % relative to WT, *P < 0.05, **P < 0.01, anti-AID (Active Motif and eBioscience), anti-TET2, anti-DNMT1 and anti-H3K4me3, two-way ANOVA (n = 4, four experiments). (H) CUT&RUN and qPCR to detect association of AID with the Switch mu region and the Irf4 enhancer/promoter in TET2 KO iGB cells on day 3. Black column: WT; blue column: TET2 KO; y axis: % relative to WT, ***P < 0.001, ****P < 0.0001, two-way ANOVA (n = 3, three experiments). Source data are available for this figure: SourceData F8.

Close modal
+ Expand view− Collapse view
Figure S4
Co-immunoprecipitation of AID, TET2, and DNMT1 in iGB cells. (A) Validation of TET2 antibody by western blot in TET2-transduced and nontransduced cells. Upper: FACS plot for the control and TET2-Flag–transduced HEK293T cells. Lower: Western blot to detect TET2. Lane 1: Nontransduced HEK293T cells; lanes 3–6: WT and AIDR112H iGB cells underwent TET2 transfection by AMAXA electroporation; Lane 7: protein ladder. (B) TET2 immunoprecipitation on day 3 and day 6. Immunoblot for TET2 (Abcam, upper panel) and AID (Active Motif, lower panel), cropped blot images shown in Fig. 8 E. (C) Repeat of TET2 immunoprecipitation on day 3 and day 6. Immunoblot for AID. (D) AID immunoprecipitation on day 3 and day 6 using anti-AID antibody (Active Motif). Immunoblot for AID (Active Motif, upper panel) and TET2 (Abcam, lower panel). (E) AID immunoprecipitation on day 3 and day 6 using anti-AID antibody (eBioscience). Immunoblot for AID (Active Motif, left panel) and TET2 (Abcam, right panel). (F) DNMT1 immunoprecipitation on day 3 and day 6. Immunoblot for AID (Active Motif) and DNMT1 (Merck). Source data are available for this figure: SourceData FS4. Refer to the image caption for details.Panel A: Western blot analysis validating the TET2 antibody in transduced and non-transduced HEK293T cells. The upper section shows flow cytometry plots for control and TET2-Flag–transduced cells, while the lower section presents western blot results with lanes corresponding to different cell conditions alongside a protein ladder. Panel B: TET2 immunoprecipitation performed on day 3 and day 6 samples, followed by immunoblot detection of TET2 and AID (Activation-Induced Cytidine Deaminase). Panel C: Repeat TET2 immunoprecipitation on day 3 and day 6 samples, with immunoblot analysis for AID. Panel D: AID immunoprecipitation on day 3 and day 6 using an anti-AID antibody, followed by immunoblot detection of AID and TET2 (Ten-Eleven Translocation methylcytosine dioxygenase 2). Panel E: AID immunoprecipitation on day 3 and day 6 using an alternative anti-AID antibody, with immunoblot detection of AID and TET2. Panel F: DNMT1 (DNA methyltransferase 1) immunoprecipitation on day 3 and day 6 samples, followed by immunoblot detection of AID and DNMT1.

Co-immunoprecipitation of AID, TET2, and DNMT1 in iGB cells. (A) Validation of TET2 antibody by western blot in TET2-transduced and nontransduced cells. Upper: FACS plot for the control and TET2-Flag–transduced HEK293T cells. Lower: Western blot to detect TET2. Lane 1: Nontransduced HEK293T cells; lanes 3–6: WT and AIDR112H iGB cells underwent TET2 transfection by AMAXA electroporation; Lane 7: protein ladder. (B) TET2 immunoprecipitation on day 3 and day 6. Immunoblot for TET2 (Abcam, upper panel) and AID (Active Motif, lower panel), cropped blot images shown in Fig. 8 E. (C) Repeat of TET2 immunoprecipitation on day 3 and day 6. Immunoblot for AID. (D) AID immunoprecipitation on day 3 and day 6 using anti-AID antibody (Active Motif). Immunoblot for AID (Active Motif, upper panel) and TET2 (Abcam, lower panel). (E) AID immunoprecipitation on day 3 and day 6 using anti-AID antibody (eBioscience). Immunoblot for AID (Active Motif, left panel) and TET2 (Abcam, right panel). (F) DNMT1 immunoprecipitation on day 3 and day 6. Immunoblot for AID (Active Motif) and DNMT1 (Merck). Source data are available for this figure: SourceData FS4.

Figure S4.
Western blots and immunoprecipitation results showing protein interactions in iGB cells.Panel A: Western blot analysis validating the TET2 antibody in transduced and non-transduced HEK293T cells. The upper section shows flow cytometry plots for control and TET2-Flag–transduced cells, while the lower section presents western blot results with lanes corresponding to different cell conditions alongside a protein ladder. Panel B: TET2 immunoprecipitation performed on day 3 and day 6 samples, followed by immunoblot detection of TET2 and AID (Activation-Induced Cytidine Deaminase). Panel C: Repeat TET2 immunoprecipitation on day 3 and day 6 samples, with immunoblot analysis for AID. Panel D: AID immunoprecipitation on day 3 and day 6 using an anti-AID antibody, followed by immunoblot detection of AID and TET2 (Ten-Eleven Translocation methylcytosine dioxygenase 2). Panel E: AID immunoprecipitation on day 3 and day 6 using an alternative anti-AID antibody, with immunoblot detection of AID and TET2. Panel F: DNMT1 (DNA methyltransferase 1) immunoprecipitation on day 3 and day 6 samples, followed by immunoblot detection of AID and DNMT1.

Co-immunoprecipitation of AID, TET2, and DNMT1 in iGB cells. (A) Validation of TET2 antibody by western blot in TET2-transduced and nontransduced cells. Upper: FACS plot for the control and TET2-Flag–transduced HEK293T cells. Lower: Western blot to detect TET2. Lane 1: Nontransduced HEK293T cells; lanes 3–6: WT and AIDR112H iGB cells underwent TET2 transfection by AMAXA electroporation; Lane 7: protein ladder. (B) TET2 immunoprecipitation on day 3 and day 6. Immunoblot for TET2 (Abcam, upper panel) and AID (Active Motif, lower panel), cropped blot images shown in Fig. 8 E. (C) Repeat of TET2 immunoprecipitation on day 3 and day 6. Immunoblot for AID. (D) AID immunoprecipitation on day 3 and day 6 using anti-AID antibody (Active Motif). Immunoblot for AID (Active Motif, upper panel) and TET2 (Abcam, lower panel). (E) AID immunoprecipitation on day 3 and day 6 using anti-AID antibody (eBioscience). Immunoblot for AID (Active Motif, left panel) and TET2 (Abcam, right panel). (F) DNMT1 immunoprecipitation on day 3 and day 6. Immunoblot for AID (Active Motif) and DNMT1 (Merck). Source data are available for this figure: SourceData FS4.

Close modal
+ Expand view − Collapse view
Figure S5
Association of AID, TET2, and histone mark H3K4me3 with AID off-target genes. (A) CUT&RUN-sequencing peak profiles of genes involved in the GC response including Cd83, Pim1, Bcl6, and Pax5.(B) CUT&RUN-sequencing peak profiles for genes involved in PC differentiation including Irf4, Xbp1, and Prdm1. The enrichment profiles represent the mean of two separate experiments sequenced at the same time. (C)Irf4 probe binding to AID active-site cleft. Left upper: Irf4 probe binding to WT and R112H AID protein. Left lower: Zoomed views of the simulated docked complex. The AGCT motif is displayed as licorice representation, and cytosine is colored in green (carbon atoms). Right: The values for the top-ranked structures. The values were obtained from HADDOCK software. a, HADDOCK score. b, RMSD (Å) value from the overall lowest-energy structure. c, van der Waals energy (kcal/mol). d, electrostatic energy (kcal/mol). Refer to the image caption for details. Panel A: Trace line graphs showing Cut and Run-sequencing peak profiles for genes involved in the germinal center response, including Cd83, Pim1, Bcl6, and Pax5. The x-axis represents genomic coordinates, and the y-axis represents signal intensity. The graphs compare wild-type (WT) and AID R112H mutant profiles. Panel B: Trace line graphs showing Cut and Run-sequencing peak profiles for genes involved in plasma cell differentiation, including Irf4, Xbp1, and Prdm1. The x-axis represents genomic coordinates, and the y-axis represents signal intensity. The graphs compare wild-type (WT) and AID R112H mutant profiles. Panel C: Structural analysis of Irf4 probe binding to AID active-site cleft. The upper part shows the binding to WT and R112H AID protein. The left lower part shows zoomed views of the simulated docked complex with the AGCT motif displayed. The bottom lists the values for the top-ranked structures, including HADDOCK score, RMSD value, Van der Waals energy, and Electrostatic energy.

Association of AID, TET2, and histone mark H3K4me3 with AID off-target genes. (A) CUT&RUN-sequencing peak profiles of genes involved in the GC response including Cd83, Pim1, Bcl6, and Pax5.(B) CUT&RUN-sequencing peak profiles for genes involved in PC differentiation including Irf4, Xbp1, and Prdm1. The enrichment profiles represent the mean of two separate experiments sequenced at the same time. (C)Irf4 probe binding to AID active-site cleft. Left upper: Irf4 probe binding to WT and R112H AID protein. Left lower: Zoomed views of the simulated docked complex. The AGCT motif is displayed as licorice representation, and cytosine is colored in green (carbon atoms). Right: The values for the top-ranked structures. The values were obtained from HADDOCK software. a, HADDOCK score. b, RMSD (Å) value from the overall lowest-energy structure. c, van der Waals energy (kcal/mol). d, electrostatic energy (kcal/mol).

Figure S5.
Trace line graphs and structural model showing gene association and protein binding analysis. Panel A: Trace line graphs showing Cut and Run-sequencing peak profiles for genes involved in the germinal center response, including Cd83, Pim1, Bcl6, and Pax5. The x-axis represents genomic coordinates, and the y-axis represents signal intensity. The graphs compare wild-type (WT) and AID R112H mutant profiles. Panel B: Trace line graphs showing Cut and Run-sequencing peak profiles for genes involved in plasma cell differentiation, including Irf4, Xbp1, and Prdm1. The x-axis represents genomic coordinates, and the y-axis represents signal intensity. The graphs compare wild-type (WT) and AID R112H mutant profiles. Panel C: Structural analysis of Irf4 probe binding to AID active-site cleft. The upper part shows the binding to WT and R112H AID protein. The left lower part shows zoomed views of the simulated docked complex with the AGCT motif displayed. The bottom lists the values for the top-ranked structures, including HADDOCK score, RMSD value, Van der Waals energy, and Electrostatic energy.

Association of AID, TET2, and histone mark H3K4me3 with AID off-target genes. (A) CUT&RUN-sequencing peak profiles of genes involved in the GC response including Cd83, Pim1, Bcl6, and Pax5.(B) CUT&RUN-sequencing peak profiles for genes involved in PC differentiation including Irf4, Xbp1, and Prdm1. The enrichment profiles represent the mean of two separate experiments sequenced at the same time. (C)Irf4 probe binding to AID active-site cleft. Left upper: Irf4 probe binding to WT and R112H AID protein. Left lower: Zoomed views of the simulated docked complex. The AGCT motif is displayed as licorice representation, and cytosine is colored in green (carbon atoms). Right: The values for the top-ranked structures. The values were obtained from HADDOCK software. a, HADDOCK score. b, RMSD (Å) value from the overall lowest-energy structure. c, van der Waals energy (kcal/mol). d, electrostatic energy (kcal/mol).

Close modal
Figure 9.
Graphs and models showing the impact of AID mutations on protein structure and activity. Panel A: A bar graph comparing Gibbs Free Energy (delta G) values for selected mutations in AID. The horizontal axis lists different mutations, and the vertical axis shows Gibbs Free Energy values. The R112H mutation is marked in red, while other mutations are marked in black. Panel B: 3D models of wild type and mutated AID aligned together. The models show the structural changes due to mutations C87S, W80R, M139T, and R112H. Panel C: Structure of AID from RoseTTAFold aligned to AID crystal bound to dCMP. Catalytic residues H56, E58, C87, C90, and the residue R112 are highlighted. Panel D: Electrostatic surface potentials of wildtype AID and AIDR112H. The upper part shows the whole protein, and the lower part zooms in on the catalytic pocket. Blue indicates positively charged residues, white indicates neutral residues, and red indicates negatively charged residues. The positions of primary catalytic residues H56, E58, C87, C90, and R112 are highlighted. Panel E: Interatomic interactions of affected residues in wild type AID and AIDR112H. Panel F: Interaction distance between W84 and H56 in wild type AID and AIDR112H. Amino acids W84 and H56 are highlighted in purple. Green arrows highlight the interaction distance between the two highlighted amino acids. Wildtype interaction distance is 5.4 to 5.9, and AIDR112H interaction distance is 3.7 to 3.9.

Structure analysis of AID mutations reveals altered substrate binding pocket of AID R112H . (A) DDMut scores of selected mutations in AID. Red marks R112H mutation; black marks other AID mutations. (B) 3D models of WT and mutated AID (predicted) aligned together. (C) Structure of AID from RoseTTAFold aligned to AID crystal bound to dCMP (PDB: 5W0U). Catalytic residues H56, E58, C87, and C90, and the residue R112 highlighted. (D) Electrostatic surface potentials of WT AID and AIDR112H. Upper: whole protein; lower: catalytic pocket is zoomed in. Blue: positively charged residues; white: neutral residues; red: negatively charged residues. Position of primary catalytic residues H56, E58, C87, C90 together with R112 are highlighted. (E) Interatomic interactions of affected residues in WT AID and AIDR112H. (F) Interaction distance between W84 and H56 in WT AID and AIDR112H. Amino acids W84 and H56 are highlighted in purple. Green arrowheads highlight the interaction distance between the two highlighted amino acids. WT: 5.4–5.9 Å; AIDR112H: 3.7–3.9 Å.

Close modal

References

Álvarez-Prado
,
Á.F.
,
P.
Pérez-Durán
,
A.
Pérez-García
,
A.
Benguria
,
C.
Torroja
,
V.G.
de Yébenes
, and
A.R.
Ramiro
.
2018
.
A broad atlas of somatic hypermutation allows prediction of activation-induced deaminase targets
.
J. Exp. Med.
215
:
761
771
.
Baek
,
M.
,
F.
DiMaio
,
I.
Anishchenko
,
J.
Dauparas
,
S.
Ovchinnikov
,
G.R.
Lee
,
J.
Wang
,
Q.
Cong
,
L.N.
Kinch
,
R.
Dustin Schaeffer
, et al
.
2021
.
Accurate prediction of protein structures and interactions using a three-track neural network
.
Science
.
373
:
871
876
.
Barwick
,
B.G.
,
C.D.
Scharer
,
A.P.R.
Bally
, and
J.M.
Boss
.
2016
.
Plasma cell differentiation is coupled to division-dependent DNA hypomethylation and gene regulation
.
Nat. Immunol.
17
:
1216
1225
.
Carpenter
,
M.A.
,
E.
Rajagurubandara
,
P.
Wijesinghe
, and
A.S.
Bhagwat
.
2010
.
Determinants of sequence-specificity within human AID and APOBEC3G
.
DNA Repair
.
9
:
579
587
.
Casellas
,
R.
,
U.
Basu
,
W.T.
Yewdell
,
J.
Chaudhuri
,
D.F.
Robbiani
, and
J.M.
Di Noia
.
2016
.
Mutations, kataegis and translocations in B cells: Understanding AID promiscuous activity
.
Nat. Rev. Immunol.
16
:
164
176
.
Català-Moll
,
F.
,
A.G.
Ferreté-Bonastre
,
T.
Li
,
D.
Weichenhan
,
P.
Lutsik
,
L.
Ciudad
,
Á.F.
Álvarez-Prado
,
J.
Rodríguez-Ubreva
,
C.
Klemann
,
C.
Speckmann
, et al
.
2021
.
Activation-induced deaminase is critical for the establishment of DNA methylation patterns prior to the germinal center reaction
.
Nucleic Acids Res.
49
:
5057
5073
.
Chiarle
,
R.
,
Y.
Zhang
,
R.L.
Frock
,
S.M.
Lewis
,
B.
Molinie
,
Y.-J.
Ho
,
D.R.
Myers
,
V.W.
Choi
,
M.
Compagno
,
D.J.
Malkin
, et al
.
2011
.
Genome-wide translocation sequencing reveals mechanisms of chromosome breaks and rearrangements in B cells
.
Cell
.
147
:
107
119
.
Dahlberg
,
C.I.M.
,
M.
He
,
T.
Visnes
,
M.L.
Torres
,
E.M.
Cortizas
,
R.E.
Verdun
,
L.S.
Westerberg
,
E.
Severinson
, and
L.
Ström
.
2014
.
A novel mouse model for the hyper-IgM syndrome: A spontaneous activation-induced cytidine deaminase mutation leading to complete loss of Ig class switching and reduced somatic hypermutation
.
J. Immunol.
193
:
4732
4738
.
Daniel
,
J.A.
, and
A.
Nussenzweig
.
2013
.
The AID-induced DNA damage response in chromatin
.
Mol. Cell
.
50
:
309
321
.
Di Noia
,
J.
, and
M.S.
Neuberger
.
2002
.
Altering the pathway of immunoglobulin hypermutation by inhibiting uracil-DNA glycosylase
.
Nature
.
419
:
43
48
.
Di Noia
,
J.M.
, and
M.S.
Neuberger
.
2007
.
Molecular mechanisms of antibody somatic hypermutation
.
Annu. Rev. Biochem.
76
:
1
22
.
Dominguez
,
P.M.
,
H.
Ghamlouch
,
W.
Rosikiewicz
,
P.
Kumar
,
W.
Béguelin
,
L.
Fontán
,
M.A.
Rivas
,
P.
Pawlikowska
,
M.
Armand
,
E.
Mouly
, et al
.
2018
.
TET2 deficiency causes germinal center hyperplasia, impairs plasma cell differentiation, and promotes b-cell lymphomagenesis
.
Cancer Discov.
8
:
1633
1653
.
Dominguez
,
P.M.
,
M.
Teater
,
N.
Chambwe
,
M.
Kormaksson
,
D.
Redmond
,
J.
Ishii
,
B.
Vuong
,
J.
Chaudhuri
,
A.
Melnick
,
A.
Vasanthakumar
, et al
.
2015
.
DNA methylation dynamics of germinal center B cells are mediated by AID
.
Cell Rep.
12
:
2086
2098
.
Dominguez-Sola
,
D.
,
J.
Kung
,
A.B.
Holmes
,
V.A.
Wells
,
T.
Mo
,
K.
Basso
, and
R.
Dalla-Favera
.
2015
.
The FOXO1 transcription factor instructs the germinal center dark zone program
.
Immunity
.
43
:
1064
1074
.
Fujii
,
K.
,
S.
Tanaka
,
T.
Hasegawa
,
M.
Narazaki
,
A.
Kumanogoh
,
H.
Koseki
,
T.
Kurosaki
, and
W.
Ise
.
2020
.
Tet DNA demethylase is required for plasma cell differentiation by controlling expression levels of IRF4
.
Int. Immunol.
32
:
683
690
.
Gitlin
,
A.D.
,
Z.
Shulman
, and
M.C.
Nussenzweig
.
2014
.
Clonal selection in the germinal centre by regulated proliferation and hypermutation
.
Nature
.
509
:
637
640
.
Glaros
,
V.
,
R.
Rauschmeier
,
A.V.
Artemov
,
A.
Reinhardt
,
S.
Ols
,
A.
Emmanouilidi
,
C.
Gustafsson
,
Y.
You
,
C.
Mirabello
,
Å.K.
Björklund
, et al
.
2021
.
Limited access to antigen drives generation of early B cell memory while restraining the plasmablast response
.
Immunity
.
54
:
2005
2023.e10
.
Gómez‐Escolar
,
C.
,
A.
Serrano‐Navarro
,
A.
Benguria
,
A.
Dopazo
,
F.
Sánchez‐Cabo
, and
A.R.
Ramiro
.
2022
.
Single cell clonal analysis identifies an AID-dependent pathway of plasma cell differentiation
.
EMBO Rep.
23
:e55000.
Jubb
,
H.C.
,
A.P.
Higueruelo
,
B.
Ochoa-Montaño
,
W.R.
Pitt
,
D.B.
Ascher
, and
T.L.
Blundell
.
2017
.
Arpeggio: A web server for calculating and visualising interatomic interactions in protein structures
.
J. Mol. Biol.
429
:
365
371
.
Jurrus
,
E.
,
D.
Engel
,
K.
Star
,
K.
Monson
,
J.
Brandi
,
L.E.
Felberg
,
D.H.
Brookes
,
L.
Wilson
,
J.
Chen
,
K.
Liles
, et al
.
2018
.
Improvements to the APBS biomolecular solvation software suite
.
Protein Sci.
27
:
112
128
.
Kent
,
W.J.
,
A.S.
Zweig
,
G.
Barber
,
A.S.
Hinrichs
, and
D.
Karolchik
.
2010
.
BigWig and BigBed: Enabling browsing of large distributed datasets
.
Bioinformatics
.
26
:
2204
2207
.
King
,
J.J.
,
C.A.
Manuel
,
C.V.
Barrett
,
S.
Raber
,
H.
Lucas
,
P.
Sutter
, and
M.
Larijani
.
2015
.
Catalytic pocket inaccessibility of activation-induced cytidine deaminase is a safeguard against excessive mutagenic activity
.
Structure
.
23
:
615
627
.
Klein
,
U.
, and
R.
Dalla-Favera
.
2008
.
Germinal centres: Role in B-cell physiology and malignancy
.
Nat. Rev. Immunol.
8
:
22
33
.
Kodgire
,
P.
,
P.
Mukkawar
,
S.
Ratnam
,
T.E.
Martin
, and
U.
Storb
.
2013
.
Changes in RNA polymerase II progression influence somatic hypermutation of Ig-related genes by AID
.
J. Exp. Med.
210
:
1481
1492
.
Kohli
,
R.M.
,
S.R.
Abrams
,
K.S.
Gajula
,
R.W.
Maul
,
P.J.
Gearhart
, and
J.T.
Stivers
.
2009
.
A portable hot spot recognition loop transfers sequence preferences from APOBEC family members to activation-induced cytidine deaminase
.
J. Biol. Chem.
284
:
22898
22904
.
Kuraoka
,
M.
,
T.M.
Holl
,
D.
Liao
,
M.
Womble
,
D.W.
Cain
,
A.E.
Reynolds
, and
G.
Kelsoe
.
2011
.
Activation-induced cytidine deaminase mediates central tolerance in B cells
.
Proc. Natl. Acad. Sci. USA
.
108
:
11560
11565
.
Langmead
,
B.
, and
S.L.
Salzberg
.
2012
.
Fast gapped-read alignment with Bowtie 2
.
Nat. Methods
9
:
357
359
.
Li
,
X.
,
A.
Gadzinsky
,
L.
Gong
,
H.
Tong
,
V.
Calderon
,
Y.
Li
,
D.
Kitamura
,
U.
Klein
,
W.Y.
Langdon
,
F.
Hou
, et al
.
2018
.
Cbl ubiquitin ligases control B cell exit from the germinal-center reaction
.
Immunity
.
48
:
530
541.e6
.
Lio
,
C.-W.J.
,
V.
Shukla
,
D.
Samaniego-Castruita
,
E.
González-Avalos
,
A.
Chakraborty
,
X.
Yue
,
D.G.
Schatz
,
F.
Ay
, and
A.
Rao
.
2019
.
TET enzymes augment activation-induced deaminase (AID) expression via 5-hydroxymethylcytosine modifications at the Aicda superenhancer
.
Sci. Immunol.
4
:eaau7523.
Liu
,
M.
,
J.L.
Duke
,
D.J.
Richter
,
C.G.
Vinuesa
,
C.C.
Goodnow
,
S.H.
Kleinstein
, and
D.G.
Schatz
.
2008
.
Two levels of protection for the B cell genome during somatic hypermutation
.
Nature
.
451
:
841
845
.
Longley
,
D.B.
,
D.P.
Harkin
, and
P.G.
Johnston
.
2003
.
5-Fluorouracil: Mechanisms of action and clinical strategies
.
Nat. Rev. Cancer
3
:
330
338
.
Lu
,
X.-J.
, and
W.K.
Olson
.
2003
.
3DNA: A software package for the analysis, rebuilding and visualization of three-dimensional nucleic acid structures
.
Nucleic Acids Res.
31
:
5108
5121
.
Maul
,
R.W.
,
Z.
Cao
,
L.
Venkataraman
,
C.A.
Giorgetti
,
J.L.
Press
,
Y.
Denizot
,
H.
Du
,
R.
Sen
, and
P.J.
Gearhart
.
2014
.
Spt5 accumulation at variable genes distinguishes somatic hypermutation in germinal center B cells from ex vivo-activated cells
.
J. Exp. Med.
211
:
2297
2306
.
Mayer
,
C.T.
,
A.
Gazumyan
,
E.E.
Kara
,
A.D.
Gitlin
,
J.
Golijanin
,
C.
Viant
,
J.
Pai
,
T.Y.
Oliveira
,
Q.
Wang
,
A.
Escolano
, et al
.
2017
.
The microanatomic segregation of selection by apoptosis in the germinal center
.
Science
.
358
:eaao2602.
Meng
,
F.-L.
,
Z.
Du
,
A.
Federation
,
J.
Hu
,
Q.
Wang
,
K.R.
Kieffer-Kwon
,
R.M.
Meyers
,
C.
Amor
,
C.R.
Wasserman
,
D.
Neuberg
, et al
.
2014
.
Convergent transcription at intragenic super-enhancers targets AID-initiated genomic instability
.
Cell
.
159
:
1538
1548
.
Methot
,
S.P.
, and
J.M.
Di Noia
.
2017
.
Molecular mechanisms of somatic hypermutation and class switch recombination
.
Adv. Immunol.
133
:
37
87
.
Meyers
,
G.
,
Y.S.
Ng
,
J.M.
Bannock
,
A.
Lavoie
,
J.E.
Walter
,
L.D.
Notarangelo
,
S.S.
Kilic
,
G.
Aksu
,
M.
Debré
,
F.
Rieux-Laucat
, et al
.
2011
.
Activation-induced cytidine deaminase (AID) is required for B-cell tolerance in humans
.
Proc. Natl. Acad. Sci. USA
.
108
:
11554
11559
.
Morgan
,
H.D.
,
W.
Dean
,
H.a
Coker
,
W.
Reik
, and
S.K.
Petersen-Mahrt
.
2004
.
Activation-induced cytidine deaminase deaminates 5-methylcytosine in DNA and is expressed in pluripotent tissues: Implications for epigenetic reprogramming
.
J. Biol. Chem.
279
:
52353
52360
.
Muramatsu
,
M.
,
K.
Kinoshita
,
S.
Fagarasan
,
S.
Yamada
,
Y.
Shinkai
, and
T.
Honjo
.
2000
.
Class switch recombination and hypermutation require activation-induced cytidine deaminase (AID), a potential RNA editing enzyme
.
Cell
.
102
:
553
563
.
Muramatsu
,
M.
,
V.S.
Sankaranand
,
S.
Anant
,
M.
Sugai
,
K.
Kinoshita
,
N.O.
Davidson
, and
T.
Honjo
.
1999
.
Specific expression of activation-induced cytidine deaminase (AID), a novel member of the RNA-editing deaminase family in germinal center B cells
.
J. Biol. Chem.
274
:
18470
18476
.
Nambu
,
Y.
,
M.
Sugai
,
H.
Gonda
,
C.-G.
Lee
,
T.
Katakai
,
Y.
Agata
,
Y.
Yokota
, and
A.
Shimizu
.
2003
.
Transcription-coupled events associating with immunoglobulin switch region chromatin
.
Science
.
302
:
2137
2140
.
Nera
,
K.-P.
,
P.
Kohonen
,
E.
Narvi
,
A.
Peippo
,
L.
Mustonen
,
P.
Terho
,
K.
Koskela
,
J.M.
Buerstedde
, and
O.
Lassila
.
2006
.
Loss of Pax5 promotes plasma cell differentiation
.
Immunity
.
24
:
283
293
.
Nojima
,
T.
,
K.
Haniuda
,
T.
Moutai
,
M.
Matsudaira
,
S.
Mizokawa
,
I.
Shiratori
,
T.
Azuma
, and
D.
Kitamura
.
2011
.
In-vitro derived germinal centre B cells differentially generate memory B or plasma cells in vivo
.
Nat. Commun.
2
:
465
.
Nordin
,
A.
,
G.
Zambanini
,
P.
Pagella
, and
C.
Cantù
.
2023
.
The CUT&RUN suspect list of problematic regions of the genome
.
Genome Biol.
24
:
185
.
Nutt
,
S.L.
,
P.D.
Hodgkin
,
D.M.
Tarlinton
, and
L.M.
Corcoran
.
2015
.
The generation of antibody-secreting plasma cells
.
Nat. Rev. Immunol.
15
:
160
171
.
Omori
,
S.A.
,
M.H.
Cato
,
A.
Anzelon-Mills
,
K.D.
Puri
,
M.
Shapiro-Shelef
,
K.
Calame
, and
R.C.
Rickert
.
2006
.
Regulation of class-switch recombination and plasma cell differentiation by phosphatidylinositol 3-kinase signaling
.
Immunity
.
25
:
545
557
.
Papin
,
A.
,
E.
Cesarman
, and
A.
Melnick
.
2022
.
3D chromosomal architecture in germinal center B cells and its alterations in lymphomagenesis
.
Curr. Opin. Genet. Dev.
74
:
101915
.
Pastor
,
W.A.
,
L.
Aravind
, and
A.
Rao
.
2013
.
TETonic shift: Biological roles of TET proteins in DNA demethylation and transcription
.
Nat. Rev. Mol. Cell Biol.
14
:
341
356
.
Pavri
,
R.
,
A.
Gazumyan
,
M.
Jankovic
,
M.
Di Virgilio
,
I.
Klein
,
C.
Ansarah-Sobrinho
,
W.
Resch
,
A.
Yamane
,
B.
Reina San-Martin
,
V.
Barreto
, et al
.
2010
.
Activation-induced cytidine deaminase targets DNA at sites of RNA polymerase II stalling by interaction with Spt5
.
Cell
.
143
:
122
133
.
Pefanis
,
E.
,
J.
Wang
,
G.
Rothschild
,
J.
Lim
,
J.
Chao
,
R.
Rabadan
,
A.N.
Economides
, and
U.
Basu
.
2014
.
Noncoding RNA transcription targets AID to divergently transcribed loci in B cells
.
Nature
.
514
:
389
393
.
Phan
,
R.T.
,
M.
Saito
,
Y.
Kitagawa
,
A.R.
Means
, and
R.
Dalla-Favera
.
2007
.
Genotoxic stress regulates expression of the proto-oncogene Bcl6 in germinal center B cells
.
Nat. Immunol.
8
:
1132
1139
.
Prochnow
,
C.
,
R.
Bransteitter
,
M.G.
Klein
,
M.F.
Goodman
, and
X.S.
Chen
.
2007
.
The APOBEC-2 crystal structure and functional implications for the deaminase AID
.
Nature
.
445
:
447
451
.
Qian
,
J.
,
Q.
Wang
,
M.
Dose
,
N.
Pruett
,
K.R.
Kieffer-Kwon
,
W.
Resch
,
G.
Liang
,
Z.
Tang
,
E.
Mathé
,
C.
Benner
, et al
.
2014
.
B cell super-enhancers and regulatory clusters recruit AID tumorigenic activity
.
Cell
.
159
:
1524
1537
.
Qiao
,
Q.
,
L.
Wang
,
F.L.
Meng
,
J.K.
Hwang
,
F.W.
Alt
, and
H.
Wu
.
2017
.
AID recognizes structured DNA for class switch recombination
.
Mol. Cell
.
67
:
361
373.e4
.
Quinlan
,
A.R.
, and
I.M.
Hall
.
2010
.
BEDTools: A flexible suite of utilities for comparing genomic features
.
Bioinformatics
.
26
:
841
842
.
Rada
,
C.
,
J.M.
Di Noia
, and
M.S.
Neuberger
.
2004
.
Mismatch recognition and uracil excision provide complementary paths to both Ig switching and the A/T-focused phase of somatic mutation
.
Mol. Cell
.
16
:
163
171
.
Ramírez
,
F.
,
D.P.
Ryan
,
B.
Grüning
,
V.
Bhardwaj
,
F.
Kilpert
,
A.S.
Richter
,
S.
Heyne
,
F.
Dündar
, and
T.
Manke
.
2016
.
deepTools2: a next generation web server for deep-sequencing data analysis
.
Nucleic Acids Res.
44
:
W160
W165
.
Ramiro
,
A.R.
, and
V.M.
Barreto
.
2015
.
Activation-induced cytidine deaminase and active DNA demethylation
.
Trends Biochem. Sci.
40
:
172
181
.
Revy
,
P.
,
T.
Muto
,
Y.
Levy
,
F.
Geissmann
,
A.
Plebani
,
O.
Sanal
,
N.
Catalan
,
M.
Forveille
,
R.
Dufourcq-Labelouse
,
A.
Gennery
, et al
.
2000
.
Activation-induced cytidine deaminase (AID) deficiency causes the autosomal recessive form of the Hyper-IgM syndrome (HIGM2)
.
Cell
.
102
:
565
575
.
Rosikiewicz
,
W.
,
X.
Chen
,
P.M.
Dominguez
,
H.
Ghamlouch
,
S.
Aoufouchi
,
O.A.
Bernard
,
A.
Melnick
, and
S.
Li
.
2020
.
TET2 deficiency reprograms the germinal center B cell epigenome and silences genes linked to lymphomagenesis
.
Sci. Adv.
6
:eaay5872.
Sander
,
S.
,
V.T.
Chu
,
T.
Yasuda
,
A.
Franklin
,
R.
Graf
,
D.P.
Calado
,
S.
Li
,
K.
Imami
,
M.
Selbach
,
M.
Di Virgilio
, et al
.
2015
.
PI3 kinase and FOXO1 transcription factor activity differentially control B cells in the germinal center light and dark zones
.
Immunity
.
43
:
1075
1086
.
Schoeler
,
K.
,
A.
Aufschnaiter
,
S.
Messner
,
E.
Derudder
,
S.
Herzog
,
A.
Villunger
,
K.
Rajewsky
, and
V.
Labi
.
2019
.
TET enzymes control antibody production and shape the mutational landscape in germinal centre B cells
.
FEBS J.
286
:
3566
3581
.
Shaknovich
,
R.
,
L.
Cerchietti
,
L.
Tsikitas
,
M.
Kormaksson
,
S.
De
,
M.E.
Figueroa
,
G.
Ballon
,
S.N.
Yang
,
N.
Weinhold
,
M.
Reimers
, et al
.
2011
.
DNA methyltransferase 1 and DNA methylation patterning contribute to germinal center B-cell differentiation
.
Blood
.
118
:
3559
3569
.
Shapiro-Shelef
,
M.
, and
K.
Calame
.
2005
.
Regulation of plasma-cell development
.
Nat. Rev. Immunol.
5
:
230
242
. .
Shih
,
T.-A.Y.
,
M.
Roederer
, and
M.C.
Nussenzweig
.
2002
.
Role of antigen receptor affinity in T cell-independent antibody responses in vivo
.
Nat. Immunol.
3
:
399
406
.
Shinnakasu
,
R.
,
T.
Inoue
,
K.
Kometani
,
S.
Moriyama
,
Y.
Adachi
,
M.
Nakayama
,
Y.
Takahashi
,
H.
Fukuyama
,
T.
Okada
, and
T.
Kurosaki
.
2016
.
Regulated selection of germinal-center cells into the memory B cell compartment
.
Nat. Immunol.
17
:
861
869
.
Shlomchik
,
M.J.
, and
F.
Weisel
.
2012
.
Germinal center selection and the development of memory B and plasma cells
.
Immunol. Rev.
247
:
52
63
.
Stavnezer
,
J.
,
J.E.J.
Guikema
, and
C.E.
Schrader
.
2008
.
Mechanism and regulation of class switch recombination
.
Annu. Rev. Immunol.
26
:
261
292
.
Stewart
,
I.
,
D.
Radtke
,
B.
Phillips
,
S.J.
McGowan
, and
O.
Bannard
.
2018
.
Germinal center B cells replace their antigen receptors in dark zones and fail light zone entry when immunoglobulin gene mutations are damaging
.
Immunity
.
49
:
477
489.e7
.
Termote
,
M.
,
R.C.
Marques
,
E.
Hyllner
,
M.V.
Guryleva
,
M.
Henskens
,
A.
Brutscher
,
I.J.L.
Baken
,
X.C.
Dopico
,
A.D.
Gasull
,
B.
Murrell
, et al
.
2025
.
Antigen affinity and site of immunization dictate B cell recall responses
.
Cell Rep.
44
:
115221
.
Tunyaplin
,
C.
,
A.L.
Shaffer
,
C.D.
Angelin-Duclos
,
X.
Yu
,
L.M.
Staudt
, and
K.L.
Calame
.
2004
.
Direct repression of prdm1 by Bcl-6 inhibits Plasmacytic differentiation
.
J. Immunol.
173
:
1158
1165
.
van Dijk
,
M.
,
K.M.
Visscher
,
P.L.
Kastritis
, and
A.M.J.J.
Bonvin
.
2013
.
Solvated protein-DNA docking using HADDOCK
.
J. Biomol. NMR
.
56
:
51
63
.
Venturutti
,
L.
, and
A.M.
Melnick
.
2021
.
The role of epigenetic mechanisms in B cell lymphoma pathogenesis
.
Annu. Rev. Cancer Biol.
5
:
311
330
.
Victora
,
G.D.
, and
M.C.
Nussenzweig
.
2012
.
Germinal centers
.
Annu. Rev. Immunol.
30
:
429
457
.
Victora
,
G.D.
,
T.A.
Schwickert
,
D.R.
Fooksman
,
A.O.
Kamphorst
,
M.
Meyer-Hermann
,
M.L.
Dustin
, and
M.C.
Nussenzweig
.
2010
.
Germinal center dynamics revealed by multiphoton microscopy with a photoactivatable fluorescent reporter
.
Cell
.
143
:
592
605
.
Wang
,
M.
,
C.
Rada
, and
M.S.
Neuberger
.
2010
.
Altering the spectrum of immunoglobulin V gene somatic hypermutation by modifying the active site of AID
.
J. Exp. Med.
207
:
141
153
.
Wang
,
X.
,
M.
Fan
,
S.
Kalis
,
L.
Wei
, and
M.D.
Scharff
.
2014
.
A source of the single-stranded DNA substrate for activation-induced deaminase during somatic hypermutation
.
Nat. Commun.
5
:
4137
.
Wu
,
S.
,
Y.
Yin
, and
X.
Wang
.
2022
.
The epigenetic regulation of the germinal center response
.
Biochim. Biophys. Acta Gene Regul. Mech.
1865
:
194828
.
Wu
,
X.
, and
Y.
Zhang
.
2017
.
TET-mediated active DNA demethylation: Mechanism, function and beyond
.
Nat. Rev. Genet.
18
:
517
534
.
Yamane
,
A.
,
W.
Resch
,
N.
Kuo
,
S.
Kuchen
,
Z.
Li
,
H.
Sun
,
D.F.
Robbiani
,
K.
McBride
,
M.C.
Nussenzweig
, and
R.
Casellas
.
2011
.
Deep-sequencing identification of the genomic targets of the cytidine deaminase AID and its cofactor RPA in B lymphocytes
.
Nat. Immunol.
12
:
62
69
.
Yan
,
C.T.
,
C.
Boboila
,
E.K.
Souza
,
S.
Franco
,
T.R.
Hickernell
,
M.
Murphy
,
S.
Gumaste
,
M.
Geyer
,
A.A.
Zarrin
,
J.P.
Manis
, et al
.
2007
.
IgH class switching and translocations use a robust non-classical end-joining pathway
.
Nature
.
449
:
478
482
.
Zaheen
,
A.
,
B.
Boulianne
,
J.Y.
Parsa
,
S.
Ramachandran
,
J.L.
Gommerman
, and
A.
Martin
.
2009
.
AID constrains germinal center size by rendering B cells susceptible to apoptosis
.
Blood
.
114
:
547
554
.
Zhang
,
Y.
,
M.
Meyer-Hermann
,
L.
a George
,
M.T.
Figge
,
M.
Khan
,
M.
Goodall
,
S.P.
Young
,
A.
Reynolds
,
F.
Falciani
,
A.
Waisman
, et al
.
2013
.
Germinal center B cells govern their own fate via antibody feedback
.
J. Exp. Med.
210
:
457
464
.
Zhou
,
Y.
,
Q.
Pan
,
D.E.V.
Pires
,
C.H.M.
Rodrigues
, and
D.B.
Ascher
.
2023
.
DDMut: Predicting effects of mutations on protein stability using deep learning
.
Nucleic Acids Res.
51
:
W122
W128
.

or Create an Account

Close Modal
Close Modal