


Selective autophagy plays a crucial role in maintaining cellular homeostasis by specifically targeting unwanted cargo labeled with “autophagy cues” signals for autophagic degradation. In this study, we identify Rab GTPases as a class of such autophagy cues signals involved in selective autophagy. Through biochemical and imaging screens, we reveal that human Rab GTPases are common autophagy substrates. Importantly, we confirm the conservation of Rab GTPase autophagic degradation in different model organisms. Rab GTPases translocate to damaged mitochondria, lipid droplets, and invading Salmonella-containing vacuoles (SCVs) to serve as degradation signals. Furthermore, they facilitate mitophagy, lipophagy, and xenophagy, respectively, by recruiting receptors. This interplay between Rab GTPases and receptors may ensure the de novo synthesis of isolation membranes around Rab-GTPase-labeled cargo, thereby mediating selective autophagy. These processes are further influenced by upstream regulators such as LRRK2, GDIs, and RabGGTase. In conclusion, this study unveils a conserved mechanism involving Rab GTPases as autophagy cues signals and proposes a model for the spatiotemporal control of selective autophagy.
Introduction
Macroautophagy, often referred to as autophagy, is a lysosomal degradative pathway crucial for development of and maintaining cellular homeostasis (He and Klionsky, 2009; Nakatogawa et al., 2009). Dysfunction in autophagy is closely linked to various human diseases (Levine and Kroemer, 2019; Mizushima et al., 2008). Originally perceived as a non-selective process to manage environmental stressors like nutrient deprivation, it is now evident that autophagy selectively clears cytosolic components such as damaged or surplus organelles, invading pathogens, and protein aggregates. This specificity is conferred by an expanding array of cargo receptors (Anding and Baehrecke, 2017; Farré and Subramani, 2016; Gatica et al., 2018; Khaminets et al., 2016; Kirkin, 2020; Rogov et al., 2014; Weidberg et al., 2011; Zaffagnini and Martens, 2016).
The prevailing model for selective autophagy posits that receptors facilitate the bridging of cargoes with autophagosomal membranes by simultaneously binding to cargoes and the Atg8/LC3-family proteins on the inner sheath of autophagosomes (Gatica et al., 2018; Khaminets et al., 2016). The pivotal step in selective autophagy is cargo recognition, which can occur through autophagy receptors directly anchoring onto designated cargoes or through poly-ubiquitination (poly-ub), serving as “eat-me” signals that recruit soluble autophagy receptors from the cytosol (Grumati and Dikic, 2018; Harper et al., 2018; Khaminets et al., 2016; Kirkin et al., 2009; Shaid et al., 2013). Further investigations have revealed additional members of eat-me signals, including β-galactoside–containing glycans exposed on damaged vesicles (Boyle and Randow, 2013), NIPSNAP1 and NIPSNAP2 (Princely Abudu et al., 2019), and cardiolipin (Chu et al., 2013).
Rab GTPases are ubiquitous within intracellular membrane compartments and are pivotal in facilitating interorganelle communication across diverse cellular processes (Pfeffer and Aivazian, 2004; Stenmark, 2009). While traditionally recognized for their roles in nonselective autophagy through various mechanisms (Ao et al., 2014; Bento et al., 2013; Szatmári and Sass, 2014), emerging evidence suggests that Rab GTPases may also directly participate in selective autophagy (Jimenez-Orgaz et al., 2018; Lipatova et al., 2012; Minowa-Nozawa et al., 2017; Yamano et al., 2014, 2018). However, the precise mechanisms underlying this involvement remain poorly understood.
In this study, we identify Rab GTPases as evolutionarily conserved “autophagy cues” signals for selective autophagy across different model systems. We propose that Rab GTPases interact with distinct selective autophagy receptors to ensure precise spatiotemporal control of selective autophagy initiation.
Results
Rab2 GTPase is degraded via macroautophagy
Recent studies have identified Rab2 as a positive regulator in both autophagy and endocytosis (Ding et al., 2019; Fujita et al., 2017; Lőrincz et al., 2017; Lund et al., 2018; Tian et al., 2024). Unexpectedly, we observed a progressive reduction in the levels of endogenous Rab2 as the autophagy substrate p62/SQSTM1 accumulated (Fig. 1, A–D). Importantly, the reduction of Rab2 was partially restored upon inhibition of lysosomal activity using Bafilomycin A1 (Fig. 1, C and D), suggesting that a fraction of cellular Rab2 undergoes lysosomal degradation. This conclusion was further supported by GFP cleavage assays, where ectopic expression of GFP–Rab2 or GFP–LC3 resulted in the production of free GFP (Fig. 1, E and F). Notably, GFP cleavage was enhanced by treatment with Torin1, a potent autophagy inducer that blocks mTOR kinase activity. The specificity of lysosomal degradation was confirmed by assays showing that expression of GFP-Rab2 WT and GFP-Rab2 Q65L (mimicking GTP-bound form) but not GFP-Rab2 N119I (mimicking GDP-bound form) generated free GFP (Fig. 1, G and H). We next investigated how Rab2 is delivered into lysosomes. Ablating cellular autophagy activity by Atg7 knockout (KO) abolished the appearance of free GFP in GFP–Rab2 expressing cells (Fig. 1, I and J). Mutational analysis revealed that Rab2 degradation depended on prenylation, a prerequisite for its membrane anchoring (Fig. 1, K and L). Furthermore, we observed that expression of the dual fluorescent fusion protein, mCherry-GFP-Rab2, generated mCherry-positive and GFP-negative (mCherry+GFP−) signals in WT cells, but not in Atg7 KO cells, under both unstressed and autophagy-induced conditions (Fig. 1, M and N). Importantly, these mCherry+GFP− signals colocalized with lysosomes labeled by a lysotracker, indicating their lysosomal localization (Fig. 1, O and P). Consistently, upon autophagy stimulation, endogenous Rab2 levels were reduced in WT cells, but not in Atg7 KO cells (Fig. 1, Q and R). These findings demonstrate that Rab2 is an autophagy substrate.

Rab2 is degraded via autophagy pathway. (A and B) U2OS cells were starved in EBSS medium for (0, 1, 2, 3, 4, or 5 h), and the levels of endogenous Rab2 and p62 were measured by western blot (A) and quantified in B. Data are shown as means ± SEM and analyzed with one-way ANOVA. *P < 0.05, **P < 0.01, ***P < 0.001. (C and D) Rab2 wild type (WT) cells, Rab2 knockout (KO) U2OS cells, and Rab2 KO U2OS cells that transiently expressing 1 µg GFP-Rab2, cells were treated with EBSS or EBSS and Bafilomycin A1 for 2 h. Quantification of cleavage GFP is shown in D. Data are shown as means ± SEM and analyzed with one-way ANOVA. ***P < 0.001. (E and F) HEK293T cells transiently expressing GFP-Rab2 or GFP-LC3 were treated with Torin1 for 0, 2, or 4 h. Quantification of cleavage GFP is shown in F. Data are shown as means ± SEM and analyzed with one-way ANOVA. *P < 0.05, ***P < 0.001. (G and H) HEK293T cells transiently expressing GFP-Rab2 WT, GFP-Rab2 Q65L, or GFP-Rab2 N119I were treated with Torin1 for 0, 2, or 4 h. Quantification of cleavage GFP is shown in H. Data are shown as means ± SEM and analyzed with one-way ANOVA. ***P < 0.001. (I and J) Atg7 WT or Atg7 KO HEK293 cells transiently expressing GFP-Rab2 were treated by Torin1 for 0, 2, or 4 h. Quantification of cleavage GFP is shown in J. Data are shown as means ± SEM and analyzed with one-way ANOVA. ***P < 0.001. (K and L) HEK293T cells transiently expressing GFP-Rab2 WT, GFP-Rab2 mutant (Cys211, 212Ser) were treated with Torin1 for 0, 2, or 4 h. Quantification of cleavage GFP is shown in L (n = 3 experimental replicates). Data are shown as means ± SEM and analyzed with one-way ANOVA. ***P < 0.001. (M and N) Atg7 WT or Atg7 KO U2OS cells transiently expressing mCherry-GFP-Rab2 were treated with Torin1 for 2 h and were analyzed by confocal microscopy for mCherry+GFP− puncta. mCherry+GFP− puncta were quantified in N (n = 30 cells per group). Scale bars, 10 μm. The scale bars in the magnification boxes are 2 µm. Data are shown as means ± SEM, and analyzed with Student’s t test (two-tailed, unpaired). ***P < 0.001. (O and P) U2OS cells transiently expressing mCherry-GFP-Rab2 or mCherry-GFP-LC3B, cells were treated with Torin1 for 2 h, staining with LysoTracker Blue DND-22, analyzed by confocal microscopy for mCherry+GFP−LysoTracker+ puncta and quantified in P (n = 30 cells per group). Scale bars, 10 μm. The scale bars in the magnification boxes are 2 µm. Data are shown as means ± SEM and analyzed with Student’s t test (two-tailed, unpaired). ***P < 0.001. (Q and R) Atg7 WT or Atg7 KO HEK293 cells were treated with Torin1 for 0, 2, 4, 6 h and the levels of endogenous Rab2, p62, LC3 and Atg7 were detected by western blot and quantified in R. Data are shown as means ± SEM and analyzed with one-way ANOVA. ***P < 0.001. Molecular weight measurements are in kD. Source data are available for this figure: SourceData F1.
Rab2 is degraded via autophagy pathway. (A and B) U2OS cells were starved in EBSS medium for (0, 1, 2, 3, 4, or 5 h), and the levels of endogenous Rab2 and p62 were measured by western blot (A) and quantified in B. Data are shown as means ± SEM and analyzed with one-way ANOVA. *P < 0.05, **P < 0.01, ***P < 0.001. (C and D) Rab2 wild type (WT) cells, Rab2 knockout (KO) U2OS cells, and Rab2 KO U2OS cells that transiently expressing 1 µg GFP-Rab2, cells were treated with EBSS or EBSS and Bafilomycin A1 for 2 h. Quantification of cleavage GFP is shown in D. Data are shown as means ± SEM and analyzed with one-way ANOVA. ***P < 0.001. (E and F) HEK293T cells transiently expressing GFP-Rab2 or GFP-LC3 were treated with Torin1 for 0, 2, or 4 h. Quantification of cleavage GFP is shown in F. Data are shown as means ± SEM and analyzed with one-way ANOVA. *P < 0.05, ***P < 0.001. (G and H) HEK293T cells transiently expressing GFP-Rab2 WT, GFP-Rab2 Q65L, or GFP-Rab2 N119I were treated with Torin1 for 0, 2, or 4 h. Quantification of cleavage GFP is shown in H. Data are shown as means ± SEM and analyzed with one-way ANOVA. ***P < 0.001. (I and J) Atg7 WT or Atg7 KO HEK293 cells transiently expressing GFP-Rab2 were treated by Torin1 for 0, 2, or 4 h. Quantification of cleavage GFP is shown in J. Data are shown as means ± SEM and analyzed with one-way ANOVA. ***P < 0.001. (K and L) HEK293T cells transiently expressing GFP-Rab2 WT, GFP-Rab2 mutant (Cys211, 212Ser) were treated with Torin1 for 0, 2, or 4 h. Quantification of cleavage GFP is shown in L (n = 3 experimental replicates). Data are shown as means ± SEM and analyzed with one-way ANOVA. ***P < 0.001. (M and N) Atg7 WT or Atg7 KO U2OS cells transiently expressing mCherry-GFP-Rab2 were treated with Torin1 for 2 h and were analyzed by confocal microscopy for mCherry+GFP− puncta. mCherry+GFP− puncta were quantified in N (n = 30 cells per group). Scale bars, 10 μm. The scale bars in the magnification boxes are 2 µm. Data are shown as means ± SEM, and analyzed with Student’s t test (two-tailed, unpaired). ***P < 0.001. (O and P) U2OS cells transiently expressing mCherry-GFP-Rab2 or mCherry-GFP-LC3B, cells were treated with Torin1 for 2 h, staining with LysoTracker Blue DND-22, analyzed by confocal microscopy for mCherry+GFP−LysoTracker+ puncta and quantified in P (n = 30 cells per group). Scale bars, 10 μm. The scale bars in the magnification boxes are 2 µm. Data are shown as means ± SEM and analyzed with Student’s t test (two-tailed, unpaired). ***P < 0.001. (Q and R) Atg7 WT or Atg7 KO HEK293 cells were treated with Torin1 for 0, 2, 4, 6 h and the levels of endogenous Rab2, p62, LC3 and Atg7 were detected by western blot and quantified in R. Data are shown as means ± SEM and analyzed with one-way ANOVA. ***P < 0.001. Molecular weight measurements are in kD. Source data are available for this figure: SourceData F1.
Human Rab GTPases are common substrates of autophagy
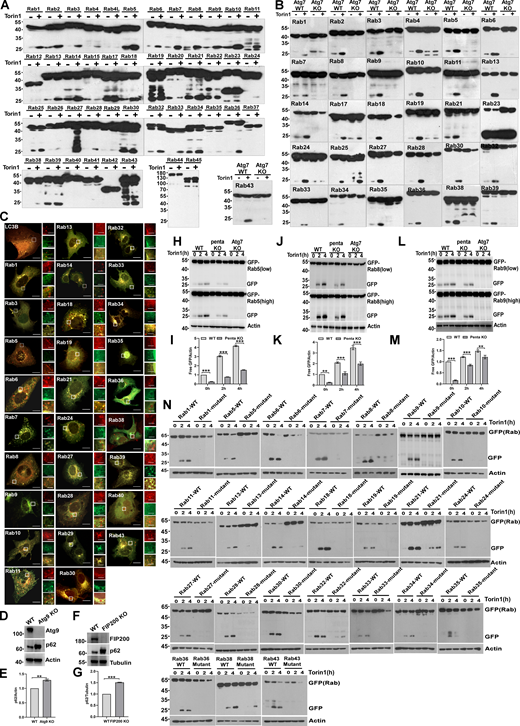
To assess whether the autophagic degradation phenotype extends to other Rab GTPases, we assembled a panel of human Rab GTPases representing the family (Fig. 2 A). Subsequently, we conducted a screen to assess their GFP cleavage activity, identifying 31 distinct Rab GTPases subjected to lysosomal degradation (Fig. 2, B and C; and Fig. S1 A). Torin1 was added during the screen to mimic nutrient deprivation by blocking mTOR activity. In a second-round screen, Atg7 KO cells were employed to select Rab GTPases degraded through the canonical autophagy pathway. Rab GTPases that produced equivalent amounts of free GFP in Atg7 KO cells were excluded from the list (Fig. 2, D and E; and Fig. S1 B), indicating their lysosomal degradation was independent of autophagy. Furthermore, tandem mCherry-GFP-tagged Rab GTPases were analyzed microscopically, leading to the exclusion of Rab3, 25, and 39 as they failed to form mCherry+GFP− puncta (Fig. 2, F and G; and Fig. S1 C). In Atg9 KO or FIP200 KO cells, we observed a similar pattern of the accumulation of endogenous Rab2, Rab8, and Rab9 (Fig. 2, H and I; and Fig. S1, D–F). Next, we showed that the degradation of Rab2, Rab5, Rab8, and Rab9 was attenuated by simultaneous knockout of NDP52, p62, OPTN, TAX1BP1, and NBR1 in Penta-KO HeLa cells (Lazarou et al., 2015) (Fig. 2, J and K; and Fig. S1, H–M). Mutating prenylation sites to abolish their membrane anchoring prevented the degradation of all 25 Rab GTPases (Fig. 2 L and Fig. S1 N), and their degradation induced by Torin1 treatment could be blocked or impaired by Bafilomycin A1 treatment (Fig. 2 M). Furthermore, we purified lysosomes and performed a protease protection assay, revealing that the lysosome-associated protein VAMP8 was completely digested, while the lysosome luminal protease cathepsin D remained intact. Conversely, Rab GTPases 2, 5, 8, and 21 were only partially eliminated by trypsin digestion, indicating that a fraction of these Rab GTPases reside inside the lysosome lumen (Fig. 2 N). These results demonstrate that membrane-bound Rab GTPases in human cells undergo degradation via autolysosomes.

Identification of a set of Rab GTPases subjected to autophagic degradation. (A) The collection of human Rab GTPases. If there are multiple isoforms for one Rab GTPase, only isoform A was chosen on the screen. (B and C) HEK293T cells transiently expressing GFP-Rab GTPases were treated with DMSO or Torin1 for 4 h. Free GFP was detected by western blot. Summary of Rab GTPases screened by GFP cleavage assay. Note that Rab1, Rab2, Rab3, Rab4, Rab4L, and Rab5 in Fig. 2 B and Fig. S1 A are for repeated use. (D and E) Atg7 KO HEK293 cells transiently expressing GFP-Rab GTPases were treated with DMSO or Torin1 for 4 h. Free GFP was detected by western blot. Summary of Rab GTPases screened by GFP cleavage assay. Note that Rab1, Rab2, and Rab3 in Fig. 2 D and Fig. S1 B are for repeated use. (F and G) U2OS cells transiently expressing mCherry-GFP-LC3B or mCherry-GFP-Rab GTPases were treated by DMSO or Torin1 for 4 h, mCherry+GFP− puncta indicated lysosomal degradation, mCherry+GFP− puncta were included for quantification (N = 20 cells per group). Scale bars, 10 µm. Data are shown as means ± SEM and analyzed with Student’s t test (two-tailed, unpaired). ***P < 0.001. (H) HeLa and Atg9 KO HeLa cells were treated by Torin1 or Torin1 and Bafilomycin A1 for 0, 2, or 4 h, and the levels of endogenous Rab2, Rab8, Rab9, and p62 were measured by western blot. (I) HeLa and FIP200 KO HeLa cells were treated by Torin1 or Torin1and Bafilomycin A1 for 0, 2, or 4 h, and the levels of endogenous Rab2, Rab8, Rab9, and p62 were measured by western blot. (J and K) HeLa WT, Penta KO HeLa, and Atg7 KO HeLa cells transiently expressing GFP-Rab2, were treated by Torin1 or Torin1 and Bafilomycin A1 for 0, 2, or 4 h, and quantification of cleavage GFP is shown in K. Data are shown as means ± SEM and analyzed with one-way ANOVA. ***P < 0.001. (L) HEK293T cells transiently expressing GFP-Rab GTPases or the prenylation-deficient mutants, were treated by Torin1 for 0, 2, or 4 h, and the cleavage of GFP-Rab GTPases was analyzed by western blot. Spot size correlates to band intensity (in Fig. S2 N). Followed by quantification of the band intensity using ImageJ software. (M) HEK293T cells were treated with Torin1 or Torin1 and Bafilomycin A1 for 0, 2, or 4 h, the levels of endogenous Rab1, 5, 8, 9, 18, 21, 27, 34 were measured by western blot. (N) Lysosome purification using the lysoIP method. Immunoblotting for protein markers of various subcellular compartments in whole-cell lysates, purified lysosomes, or Rab GTPases. Lysates were prepared from cells expressing 3 × HA-tagged TMEM192, treated with Torin1, Torin1, and Bafilomycin A1 or Torin1+Bafilomycin A1+Proteinase K. The protein levels of Rab2, 5, 8, 21, VAMP8, CSTD, GM130, CLIMP63, Lamin B1, TOMM20, and actin were analyzed by western blot. Molecular weight measurements are in kD. Source data are available for this figure: SourceData F2.
Identification of a set of Rab GTPases subjected to autophagic degradation. (A) The collection of human Rab GTPases. If there are multiple isoforms for one Rab GTPase, only isoform A was chosen on the screen. (B and C) HEK293T cells transiently expressing GFP-Rab GTPases were treated with DMSO or Torin1 for 4 h. Free GFP was detected by western blot. Summary of Rab GTPases screened by GFP cleavage assay. Note that Rab1, Rab2, Rab3, Rab4, Rab4L, and Rab5 in Fig. 2 B and Fig. S1 A are for repeated use. (D and E) Atg7 KO HEK293 cells transiently expressing GFP-Rab GTPases were treated with DMSO or Torin1 for 4 h. Free GFP was detected by western blot. Summary of Rab GTPases screened by GFP cleavage assay. Note that Rab1, Rab2, and Rab3 in Fig. 2 D and Fig. S1 B are for repeated use. (F and G) U2OS cells transiently expressing mCherry-GFP-LC3B or mCherry-GFP-Rab GTPases were treated by DMSO or Torin1 for 4 h, mCherry+GFP− puncta indicated lysosomal degradation, mCherry+GFP− puncta were included for quantification (N = 20 cells per group). Scale bars, 10 µm. Data are shown as means ± SEM and analyzed with Student’s t test (two-tailed, unpaired). ***P < 0.001. (H) HeLa and Atg9 KO HeLa cells were treated by Torin1 or Torin1 and Bafilomycin A1 for 0, 2, or 4 h, and the levels of endogenous Rab2, Rab8, Rab9, and p62 were measured by western blot. (I) HeLa and FIP200 KO HeLa cells were treated by Torin1 or Torin1and Bafilomycin A1 for 0, 2, or 4 h, and the levels of endogenous Rab2, Rab8, Rab9, and p62 were measured by western blot. (J and K) HeLa WT, Penta KO HeLa, and Atg7 KO HeLa cells transiently expressing GFP-Rab2, were treated by Torin1 or Torin1 and Bafilomycin A1 for 0, 2, or 4 h, and quantification of cleavage GFP is shown in K. Data are shown as means ± SEM and analyzed with one-way ANOVA. ***P < 0.001. (L) HEK293T cells transiently expressing GFP-Rab GTPases or the prenylation-deficient mutants, were treated by Torin1 for 0, 2, or 4 h, and the cleavage of GFP-Rab GTPases was analyzed by western blot. Spot size correlates to band intensity (in Fig. S2 N). Followed by quantification of the band intensity using ImageJ software. (M) HEK293T cells were treated with Torin1 or Torin1 and Bafilomycin A1 for 0, 2, or 4 h, the levels of endogenous Rab1, 5, 8, 9, 18, 21, 27, 34 were measured by western blot. (N) Lysosome purification using the lysoIP method. Immunoblotting for protein markers of various subcellular compartments in whole-cell lysates, purified lysosomes, or Rab GTPases. Lysates were prepared from cells expressing 3 × HA-tagged TMEM192, treated with Torin1, Torin1, and Bafilomycin A1 or Torin1+Bafilomycin A1+Proteinase K. The protein levels of Rab2, 5, 8, 21, VAMP8, CSTD, GM130, CLIMP63, Lamin B1, TOMM20, and actin were analyzed by western blot. Molecular weight measurements are in kD. Source data are available for this figure: SourceData F2.
Identification of a set of Rab GTPases is degraded via macroautophagy. (A) HEK293T cells transiently expressing HA-GFP-Rab GTPases were treated by DMSO or Torin1 for 4 h, and the lysosomal cleavage of GFP-Rab GTPases was analyzed by western blot. Note that Rab1, Rab2, Rab3, Rab4, Rab4L, and Rab5 in Fig. 2 B and Fig. S1 A are for repeated use. (B) HEK293 or HEK293 Atg7 KO cells transiently expressing GFP-Rab GTPases were treated by DMSO or Torin1 for 4 h, and the cleavage of GFP-Rab GTPases was analyzed by western blot. Note that Rab1, Rab2, and Rab3 in Fig. 2 D and Fig. S1 B are for repeated use. (C) U2OS cells transiently expressing mCherry-GFP-Rab GTPases or mCherry-GFP-LC3B were treated by Torin1 for 2 h, mCherry+GFP− puncta indicate lysosomal degradation of GFP-Rab GTPases or GFP-LC3B. Scale bars, 10 µm. The scale bars in the magnification boxes are 2 µm. (D and E) The levels of endogenous p62 in HeLa WT or Atg9 KO HeLa were measured by western blot and quantified in B. Data are shown as means ± SEM and analyzed with Student’s t test (two-tailed, unpaired). **P < 0.01. (F and G) The levels of endogenous p62 in HeLa WT or FIP200 KO HeLa were measured by western blot and quantified in D. Data are shown as means ± SEM and analyzed with Student’s t test (two-tailed, unpaired). ***P < 0.001. (H and I) HeLa WT, Penta KO HeLa, and Atg7 KO HeLa cells transiently expressing GFP-Rab5, were treated by Torin1 or Torin1 and Bafilomycin A1 for 0, 2 or 4 h, and quantification of cleavage GFP is shown in I. Data are shown as means ± SEM and analyzed with one-way ANOVA. ***P < 0.001. (J and K) HeLa WT, Penta KO HeLa, and Atg7 KO HeLa cells transiently expressing GFP-Rab8, were treated by Torin1 or Torin1 and Bafilomycin A1 for 0, 2, or 4 h, and quantification of cleavage GFP is shown in K. Data are shown as means ± SEM and analyzed with one-way ANOVA. **P < 0.01, ***P < 0.001. (L and M) HeLa WT, Penta KO HeLa and Atg7 KO HeLa cells transiently expressing GFP-Rab9, were treated by Torin1 or Torin1 and Bafilomycin A1 for 0, 2 or 4 h, and Quantification of cleavage GFP is shown in M. Data are shown as means ± SEM and analyzed with one-way ANOVA. **P < 0.01, ***P < 0.001. (N) HEK293T cells transiently expressing HA-GFP-Rab GTPases WT or HA-GFP-Rab GTPases mutant (Cys→Ser), Rab1(204, 205); Rab5(212, 213); Rab6(206, 208); Rab7(205, 207); Rab8(204); Rab9(200, 201); Rab10(199, 200); Rab11(212, 213); Rab13(200); Rab14(213, 215); Rab18 (199, 203); Rab19(215, 217); Rab21(221, 222); Rab24(200, 201); Rab27(219, 221); Rab28(218); Rab30(199, 200); Rab32(224, 225); Rab33(235, 237); Rab34(257, 258); Rab35(200, 201); Rab36(332, 333); Rab38(205, 208); Rab43(210, 212) were treated by Torin1 for 0, 2, or 4 h, and the cleavage of GFP-Rab GTPases was analyzed by western blot. Molecular weight measurements are in kD. Source data are available for this figure: SourceData FS1.

Identification of a set of Rab GTPases is degraded via macroautophagy. (A) HEK293T cells transiently expressing HA-GFP-Rab GTPases were treated by DMSO or Torin1 for 4 h, and the lysosomal cleavage of GFP-Rab GTPases was analyzed by western blot. Note that Rab1, Rab2, Rab3, Rab4, Rab4L, and Rab5 in Fig. 2 B and Fig. S1 A are for repeated use. (B) HEK293 or HEK293 Atg7 KO cells transiently expressing GFP-Rab GTPases were treated by DMSO or Torin1 for 4 h, and the cleavage of GFP-Rab GTPases was analyzed by western blot. Note that Rab1, Rab2, and Rab3 in Fig. 2 D and Fig. S1 B are for repeated use. (C) U2OS cells transiently expressing mCherry-GFP-Rab GTPases or mCherry-GFP-LC3B were treated by Torin1 for 2 h, mCherry+GFP− puncta indicate lysosomal degradation of GFP-Rab GTPases or GFP-LC3B. Scale bars, 10 µm. The scale bars in the magnification boxes are 2 µm. (D and E) The levels of endogenous p62 in HeLa WT or Atg9 KO HeLa were measured by western blot and quantified in B. Data are shown as means ± SEM and analyzed with Student’s t test (two-tailed, unpaired). **P < 0.01. (F and G) The levels of endogenous p62 in HeLa WT or FIP200 KO HeLa were measured by western blot and quantified in D. Data are shown as means ± SEM and analyzed with Student’s t test (two-tailed, unpaired). ***P < 0.001. (H and I) HeLa WT, Penta KO HeLa, and Atg7 KO HeLa cells transiently expressing GFP-Rab5, were treated by Torin1 or Torin1 and Bafilomycin A1 for 0, 2 or 4 h, and quantification of cleavage GFP is shown in I. Data are shown as means ± SEM and analyzed with one-way ANOVA. ***P < 0.001. (J and K) HeLa WT, Penta KO HeLa, and Atg7 KO HeLa cells transiently expressing GFP-Rab8, were treated by Torin1 or Torin1 and Bafilomycin A1 for 0, 2, or 4 h, and quantification of cleavage GFP is shown in K. Data are shown as means ± SEM and analyzed with one-way ANOVA. **P < 0.01, ***P < 0.001. (L and M) HeLa WT, Penta KO HeLa and Atg7 KO HeLa cells transiently expressing GFP-Rab9, were treated by Torin1 or Torin1 and Bafilomycin A1 for 0, 2 or 4 h, and Quantification of cleavage GFP is shown in M. Data are shown as means ± SEM and analyzed with one-way ANOVA. **P < 0.01, ***P < 0.001. (N) HEK293T cells transiently expressing HA-GFP-Rab GTPases WT or HA-GFP-Rab GTPases mutant (Cys→Ser), Rab1(204, 205); Rab5(212, 213); Rab6(206, 208); Rab7(205, 207); Rab8(204); Rab9(200, 201); Rab10(199, 200); Rab11(212, 213); Rab13(200); Rab14(213, 215); Rab18 (199, 203); Rab19(215, 217); Rab21(221, 222); Rab24(200, 201); Rab27(219, 221); Rab28(218); Rab30(199, 200); Rab32(224, 225); Rab33(235, 237); Rab34(257, 258); Rab35(200, 201); Rab36(332, 333); Rab38(205, 208); Rab43(210, 212) were treated by Torin1 for 0, 2, or 4 h, and the cleavage of GFP-Rab GTPases was analyzed by western blot. Molecular weight measurements are in kD. Source data are available for this figure: SourceData FS1.
Autophagic degradation of Rab GTPases is conserved across Saccharomyces cerevisiae and Caenorhabditis elegans
Given the largely conserved essential cellular roles of Rab GTPases from yeasts to humans, we investigated whether the autophagic degradation of Rab GTPases also occurs in other model organisms. We initially generated knock-in (KI) strains in yeast by tagging GFP to the N-terminus of endogenous Ypt GTPases in S. cerevisiae. Subsequently, we knocked out the essential autophagy gene Atg1 to abolish autophagy flux. Under both basal and nitrogen starvation conditions, all GFP-Ypt GTPase KI strains exhibited GFP cleavage signals, which were either abolished or attenuated by atg1 KO (Fig. 3, A–F). These findings indicate that Rab GTPases in yeast are degraded via canonical autophagy. To further confirm the conservation of autophagic degradation of Rab GTPases in multicellular organisms, we generated a series of GFP KI lines in C. elegans. These KI lines were crossed with epg-5 (Tian et al., 2010) or atg-3 (Zhang et al., 2009) KO strains to inhibit autophagic flux. Subsequent starvation induction revealed that endogenous RAB-1, RAB-2, RAB-3, RAB-7, RAB-8, RAB-11.1, RAB-21, GLO-1, and RAB-39 were subjected to autophagy degradation in vivo (Fig. 3, G–O). These results provide compelling evidence that the autophagic degradation of Rab GTPases is conserved from yeast to humans.

Autophagic degradation of Rab GTPases is conserved in S. cerevisiae and C. elegans. (A–F) GFP-Ypt1(Ypt7, Ypt31, Ypt32, Ypt51, Ypt52) or GFP-Ypt1(Ypt7, Ypt31, Ypt32, Ypt51, Ypt52) atg1∆yeast GFP-KI strains were cultured in SD-N medium for 0, 3, 6, 9, 12 h. The cleavage of GFP-Ypt1 (Ypt7, etc.) was analyzed by western blot. Pgk1 served as a loading control. (G–O) GFP-KI C. elegans strains: GFP::Tev::2×flag::RABs (1, 2, etc.), GFP::Tev::2×flag:: RABs with epg-5(tm3425) and GFP::Tev::2×flag:: RABs with atg-3(bp412) were maintained on nematode growth medium plates without E. coli OP50. Lysosomal cleavage of GFP of C. elegans strains was analyzed by western blot. Molecular weight measurements are in kD. Source data are available for this figure: SourceData F3.
Autophagic degradation of Rab GTPases is conserved in S. cerevisiae and C. elegans. (A–F) GFP-Ypt1(Ypt7, Ypt31, Ypt32, Ypt51, Ypt52) or GFP-Ypt1(Ypt7, Ypt31, Ypt32, Ypt51, Ypt52) atg1∆yeast GFP-KI strains were cultured in SD-N medium for 0, 3, 6, 9, 12 h. The cleavage of GFP-Ypt1 (Ypt7, etc.) was analyzed by western blot. Pgk1 served as a loading control. (G–O) GFP-KI C. elegans strains: GFP::Tev::2×flag::RABs (1, 2, etc.), GFP::Tev::2×flag:: RABs with epg-5(tm3425) and GFP::Tev::2×flag:: RABs with atg-3(bp412) were maintained on nematode growth medium plates without E. coli OP50. Lysosomal cleavage of GFP of C. elegans strains was analyzed by western blot. Molecular weight measurements are in kD. Source data are available for this figure: SourceData F3.
Rab GTPases interact with cargo receptors for autophagic degradation
For autophagic turnover, Rab GTPases require recognition and binding by autophagy receptors, which facilitate the linking of autophagy cargoes with the Atg8/LC3-family molecules on the inner leaflet of autophagosomes (Gatica et al., 2018; Khaminets et al., 2016) (Fig. S2 A). To investigate this concept, we assembled a panel of selective autophagy receptors and conducted an interaction screen through coimmunoprecipitation analysis (Fig. 4 A; and Fig. S2, B and C). The receptors evaluated in this study can be categorized into two groups: Group 1 comprises cytosolic soluble proteins, including Optineurin (OPTN) (Korac et al., 2013; Wild et al., 2011; Wong and Holzbaur, 2014), CALCOCO1 (Nthiga et al., 2020), TAX1BP1 (Newman et al., 2012), NDP52/CALCOCO2 (Heo et al., 2015; Thurston et al., 2009), BAG3 (Gamerdinger et al., 2011), TOLLIP (Lu et al., 2014), TECPR1 (Ogawa et al., 2011), NCOA4 (Mancias et al., 2014), TRIM5 (Mandell et al., 2014), TRIM21 (Kimura et al., 2015), ZNHIT3 (Wyant et al., 2018), NUFIP1 (Wyant et al., 2018), p62 (Bjørkøy et al., 2005; Geisler et al., 2010; Tatsumi et al., 2018; Zheng et al., 2009), and LGALS8 (Thurston et al., 2012). These receptors recognize either unmodified or ubiquitinated autophagy substrates. Group 2 consists of integral membrane proteins, including PHB2 (Wei et al., 2017), FAM134B (Khaminets et al., 2015), FUNDC1 (Liu et al., 2012), and BNIP3L/NIX (Schweers et al., 2007), which can directly anchor to their designated cargoes. All other receptors, except for BAG3, TAX1BP1, FUNDC1, and BNIP3L, interacted with at least one Rab GTPase (Fig. 4 A; and Fig. S2, B and C). NDP52, crucial for mitophagy and xenophagy, was found to associate with at least 16 different Rab GTPases. TOLLIP, a receptor in aggrephagy for protein aggregate clearance, bound to Rab2, 5, 7, 8, 18, 19, 21, 30, 32, 36, and 43. Conversely, all Rab GTPases undergoing autophagic degradation bound to at least one receptor, except for Rab13, Rab33, and Rab38. The interactions between Rab GTPases and receptors are summarized (Fig. 4, A and B). In a pilot biochemical investigation, we demonstrated that Rab8, 9, 14, 19, and 35 directly bound to NDP52 in vitro, the ZN motif of NDP52 is required and sufficient for their interaction (Fig. 4, C and D; and Fig. S2 D). Furthermore, GTP binding of Rab2, 8, 9, and 35 facilitated their interaction with receptors (Fig. 4 E; and Fig. S2, E–I). These findings highlight the broad association of Rab GTPases with selective autophagy receptors for signal propagation, albeit at the cost of their degradation.
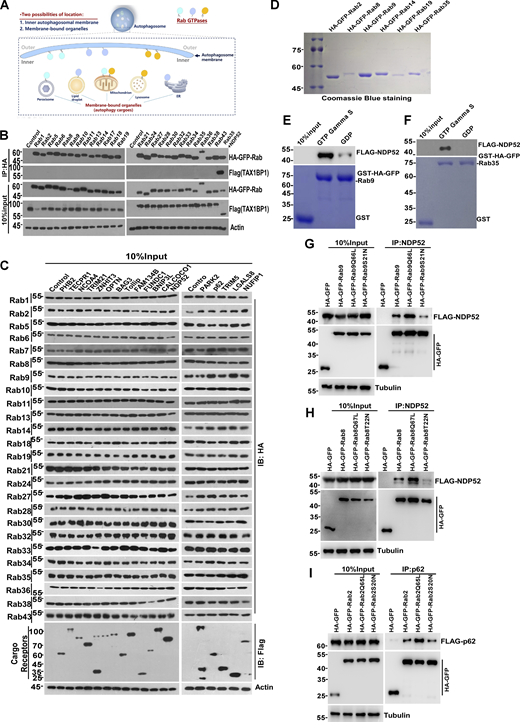
Identification of binary interactions between Rab GTPases and receptors. (A) Schematic representation of hypothesized localization of Rab GTPases. (B) HEK293T cells transiently expressing HA-GFP-Rab GTPases and Flag-TAX1BP1, cell lysates were collected and analyzed for the interaction by coimmunoprecipitation. (C) HEK293T cells transiently expressing HA-GFP-Rab GTPases and Flag-receptors, cell lysates were collected and analyzed by coimmunoprecipitation. (D) Expression and purification recombinant proteins of HA-GFP-Rab GTPases (2, 8, 9, 14, 19, and 35). (E) Recombinant protein of FLAG-NDP52 was incubated with immobilized GST-Rab9 loaded with GDP or GTP-γ-S for GST pull-down assay. The beads were washed and analyzed by western blot for FLAG (NDP52). The amounts of GST proteins were indicated by Coomassie blue staining. (F) Recombinant protein of FLAG-NDP52 was incubated with immobilized GST-Rab35 loaded with GDP or GTP-γ-S for GST pull-down assay. The beads were washed and analyzed by western blot. The GST proteins were indicated by Coomassie blue staining. (G) HEK293T cells transiently expressing HA-GFP-Rab9 (WT, Q66L, and S21N) and FLAG-NDP52. IP was performed with anti-HA beads, which was followed by western blot for FLAG-NDP52. (H) HEK293T cells transiently expressing HA-GFP-Rab8 (WT, Q67L, and T22N) and FLAG-NDP52. IP was performed with anti-HA beads, which was followed by western blot for FLAG-NDP52. (I) HEK293T cells transiently expressing HA-GFP-Rab2 (WT, Q65L, and S20N) and FLAG-p62. IP was performed with anti-HA beads, which was followed by western blot for FLAG-p62. Molecular weight measurements are in kD. Source data are available for this figure: SourceData FS2.

Identification of binary interactions between Rab GTPases and receptors. (A) Schematic representation of hypothesized localization of Rab GTPases. (B) HEK293T cells transiently expressing HA-GFP-Rab GTPases and Flag-TAX1BP1, cell lysates were collected and analyzed for the interaction by coimmunoprecipitation. (C) HEK293T cells transiently expressing HA-GFP-Rab GTPases and Flag-receptors, cell lysates were collected and analyzed by coimmunoprecipitation. (D) Expression and purification recombinant proteins of HA-GFP-Rab GTPases (2, 8, 9, 14, 19, and 35). (E) Recombinant protein of FLAG-NDP52 was incubated with immobilized GST-Rab9 loaded with GDP or GTP-γ-S for GST pull-down assay. The beads were washed and analyzed by western blot for FLAG (NDP52). The amounts of GST proteins were indicated by Coomassie blue staining. (F) Recombinant protein of FLAG-NDP52 was incubated with immobilized GST-Rab35 loaded with GDP or GTP-γ-S for GST pull-down assay. The beads were washed and analyzed by western blot. The GST proteins were indicated by Coomassie blue staining. (G) HEK293T cells transiently expressing HA-GFP-Rab9 (WT, Q66L, and S21N) and FLAG-NDP52. IP was performed with anti-HA beads, which was followed by western blot for FLAG-NDP52. (H) HEK293T cells transiently expressing HA-GFP-Rab8 (WT, Q67L, and T22N) and FLAG-NDP52. IP was performed with anti-HA beads, which was followed by western blot for FLAG-NDP52. (I) HEK293T cells transiently expressing HA-GFP-Rab2 (WT, Q65L, and S20N) and FLAG-p62. IP was performed with anti-HA beads, which was followed by western blot for FLAG-p62. Molecular weight measurements are in kD. Source data are available for this figure: SourceData FS2.

Rab GTPases interact with cargo receptors for autophagic degradation. (A) The interaction of Rab GTPases with selective autophagy receptors. Flag-tagged selective autophagy receptors were expressed individually in HEK293T cells, which simultaneously expressed HA-GFP-Rab GTPases. IP was performed with anti-HA beads, which was followed by western blot for Flag-tagged selective autophagy receptors. (B) Summary of interactions between Rab GTPases and selective autophagy receptors. (C) In vitro interaction between GST-NDP52 WT, GST-NDP52 mutants, and the Rab GTPases were analyzed by GST pulldown assay using purified recombinant proteins (in Fig. S2, E and F). (D) Illustration of NDP52 domain interacting with Rab GTPases. (E) Recombinant protein of FLAG-NDP52 was incubated with immobilized GST-Rab8 loaded with GDP or GTP-γ-S for GST pull-down assay. The beads were washed and analyzed by western blot for FLAG (NDP52). The amounts of GST proteins were indicated by Coomassie blue staining. Molecular weight measurements are in kD. Source data are available for this figure: SourceData F4.
Rab GTPases interact with cargo receptors for autophagic degradation. (A) The interaction of Rab GTPases with selective autophagy receptors. Flag-tagged selective autophagy receptors were expressed individually in HEK293T cells, which simultaneously expressed HA-GFP-Rab GTPases. IP was performed with anti-HA beads, which was followed by western blot for Flag-tagged selective autophagy receptors. (B) Summary of interactions between Rab GTPases and selective autophagy receptors. (C) In vitro interaction between GST-NDP52 WT, GST-NDP52 mutants, and the Rab GTPases were analyzed by GST pulldown assay using purified recombinant proteins (in Fig. S2, E and F). (D) Illustration of NDP52 domain interacting with Rab GTPases. (E) Recombinant protein of FLAG-NDP52 was incubated with immobilized GST-Rab8 loaded with GDP or GTP-γ-S for GST pull-down assay. The beads were washed and analyzed by western blot for FLAG (NDP52). The amounts of GST proteins were indicated by Coomassie blue staining. Molecular weight measurements are in kD. Source data are available for this figure: SourceData F4.
Mitophagy induction triggers mitochondria-targeting of Rab GTPases
The requirement of prenylation for the autophagic degradation of Rab GTPases suggests their localization to membrane-associated organelles inside autophagosomes (Fig. S2 A). Hence, they may function as autophagy cues signals by lipidating onto membrane-bound organelles destined for autophagic clearance. To investigate the biological significance of Rab GTPase degradation, we selected mitophagy as the initial proof-of-concept model. If Rab GTPases mediate mitophagy as autophagy cues signals, they should undergo degradation under mitophagy induction conditions. Indeed, endogenous Rab1, 2, 5, 8, 9, 18, 21, 24, 27, and 34 were degraded in wild-type cells but not in autophagy-deficient Atg7 KO HEK293 cells upon CCCP treatment-induced mitophagy (Fig. 5 A). Furthermore, if Rab GTPases are involved in mitophagy, they should localize to mitochondria under mitochondrial stress conditions. Indeed, Rab1, 2, 5, 7, 8, 9, 13, 14, 18, 19, 21, 27, 28, 30, 32, 34, and 35 redistributed to depolarized mitochondria in a CCCP-inducible manner in U2OS cells, while Rab24 and 43 did not accumulate on mitochondria under the same conditions (Fig. 5, B and C; and Fig. S3 A). We selected Rab8 for detailed investigation due to its high responsiveness to autophagy stimuli and its significant conservation from yeast to humans. Moreover, we observed mitochondrial enrichment of Rab8 under various mitophagy-inducing conditions, including hypoxia stress and treatment with oligomycin/antimycin A (Fig. S3, B–E). Additionally, we confirmed Rab8’s localization on the mitochondrial outer membrane through both immunoelectron microscopy (immuno-EM) and live-cell imaging (Fig. 5, D–G; Videos 1; and 2). Given that the Parkin-PINK1 pathway generates polyubiquitination on the mitochondrial outer membrane as an autophagy cues signal for mitophagy, we investigated whether the membrane targeting of Rab GTPases is dependent on this pathway. Surprisingly, the knockout of PINK1 did not reduce the mitochondria-targeting of Rab8 in confocal microscopic analysis (Fig. S3, F and G), consistent with the findings in U2OS cells, which are considered Parkin-deficient (Heo et al., 2015). Thus, the relocation of Rab GTPases to mitochondria for mitophagy appears to be independent of the Parkin–PINK1 pathway. However, prenylation of Rab GTPases is essential for their mitochondria targeting, as the Rab8 mutant defective in lipidation failed to associate with mitochondria under basal or CCCP-treated conditions (Fig. S3, H and I), consistent with the observation that Rab GTPases rely on prenylation for autophagic degradation (Fig. 1 K, Fig. 2 L, and Fig. S1 N). Additionally, we confirmed that endogenous Rab GTPases tagged with GFP relocated to mitochondria and were degraded under mitophagy-induced conditions in C. elegans (Fig. 5, H–N). These findings collectively suggest that Rab GTPases serve as potential autophagy cues signals for mitophagy.

Mitophagy induction triggers mitochondria-targeting of Rab GTPases. (A) Atg7 WT or Atg7 KO HEK293 cells were treated by 10 µM CCCP for 0, 2, or 4 h, whole cell lysates were collected, and the levels of endogenous Rab GTPases were measured by western blot. (B and C) U2OS cells transiently expressing GFP-Rab GTPases. 24 h after transfection, cells were treated by DMSO as control or 10 µM CCCP for 4 h. The colocalization of Rab GTPases and endogenous TOMM20 were analyzed by confocal microscopy, cells were included for quantification in C (n = 20 cells per group). Scale bars, 10 µm. The scale bars in the magnification boxes are 2 µm. Data are shown as means ± SEM. (D and E) PINK1 KO HEK293 cells transiently expressing HA-GFP-Rab8, 24 h after transfection, cells were treated with DMSO, 10 µM CCCP, or 10 µM CCCP and Bafilomycin A1 for 4 h, and labeled with anti-GFP antibodies followed by gold particles. Scale bars, 500 nm. The colocalization of HA-GFP-Rab8 and mitochondria membrane was analyzed by the number of gold particles of HA-GFP-Rab8 per mitochondria, and quantified in E. For DMSO, n = 27 cells; for CCCP, n = 35 cells; CCCP and Bafilomycin A, n = 37 cells. Data are shown as mean ± SEM and analyzed with Kruskal–Wallis test. ***P < 0.001. (F) U2OS cells transiently expressing mNeonGreen-Rab8, 24 h after transfection, cells were incubated with mitochondrial dye (PK Mito Orange, PKMO-2, Genvivo) for 30 min at 37°C. After washing cells two to three times with warm culture medium, the culture dish was mounted on the microscope (NanoInsights, Multi-SIM) to maintain incubation conditions at 37°C and 5% CO2. Time-lapse images were taken immediately after CCCP treatment (10 µM). Scale bar, 1 µm. (G) U2OS cells transiently expressing mNeonGreen-Rab8, 24 h after transfection, cells were treated with Nocodazole (10 µM) for 4 h, then incubated with mitochondrial dye (PK Mito Orange, PKMO-2, Genvivo) for 30 min at 37°C. After washing cells two to three times with a warm culture medium, the culture dish was mounted on the microscope (NanoInsights, Multi-SIM) to maintain incubation conditions at 37°C and 5% CO2. Time-lapse images were taken immediately after CCCP (10 µM) + Nocodazole (10 µM) treatment. Scale bar, 1 µm. (H–L) GFP-KI C. elegans strains: GFP::Tev::2×flag::RAB-1 (RAB-2, RAB-7, RAB-8, RAB-21), were treated with DMSO, Paraquat (8 mM) or CCCP (15 µM) for 4 h. The cleavage of GFP::Tev::2×flag::RAB-1(RAB-2, RAB-7, RAB-8, RAB-21) was analyzed by western blot. (M and N) GFP-KI C. elegans strains (GFP::Tev::2×flag::RAB-1) were treated with DMSO, Paraquat (8 mM), or CCCP (15 µM) for 2 h, staining with MitoTracker Red, and analyzed by confocal microscopy for GFP::RAB-1+ MtioTracker+ puncta, and quantified in N (n = 64 animals per group). Scale bars, 10 µm. The scale bars in the magnification boxes are 2 µm. Data are shown as mean ± SEM and analyzed with Kruskal–Wallis test. **P < 0.01, ***P < 0.001. Molecular weight measurements are in kD. Source data are available for this figure: SourceData F5.
Mitophagy induction triggers mitochondria-targeting of Rab GTPases. (A) Atg7 WT or Atg7 KO HEK293 cells were treated by 10 µM CCCP for 0, 2, or 4 h, whole cell lysates were collected, and the levels of endogenous Rab GTPases were measured by western blot. (B and C) U2OS cells transiently expressing GFP-Rab GTPases. 24 h after transfection, cells were treated by DMSO as control or 10 µM CCCP for 4 h. The colocalization of Rab GTPases and endogenous TOMM20 were analyzed by confocal microscopy, cells were included for quantification in C (n = 20 cells per group). Scale bars, 10 µm. The scale bars in the magnification boxes are 2 µm. Data are shown as means ± SEM. (D and E) PINK1 KO HEK293 cells transiently expressing HA-GFP-Rab8, 24 h after transfection, cells were treated with DMSO, 10 µM CCCP, or 10 µM CCCP and Bafilomycin A1 for 4 h, and labeled with anti-GFP antibodies followed by gold particles. Scale bars, 500 nm. The colocalization of HA-GFP-Rab8 and mitochondria membrane was analyzed by the number of gold particles of HA-GFP-Rab8 per mitochondria, and quantified in E. For DMSO, n = 27 cells; for CCCP, n = 35 cells; CCCP and Bafilomycin A, n = 37 cells. Data are shown as mean ± SEM and analyzed with Kruskal–Wallis test. ***P < 0.001. (F) U2OS cells transiently expressing mNeonGreen-Rab8, 24 h after transfection, cells were incubated with mitochondrial dye (PK Mito Orange, PKMO-2, Genvivo) for 30 min at 37°C. After washing cells two to three times with warm culture medium, the culture dish was mounted on the microscope (NanoInsights, Multi-SIM) to maintain incubation conditions at 37°C and 5% CO2. Time-lapse images were taken immediately after CCCP treatment (10 µM). Scale bar, 1 µm. (G) U2OS cells transiently expressing mNeonGreen-Rab8, 24 h after transfection, cells were treated with Nocodazole (10 µM) for 4 h, then incubated with mitochondrial dye (PK Mito Orange, PKMO-2, Genvivo) for 30 min at 37°C. After washing cells two to three times with a warm culture medium, the culture dish was mounted on the microscope (NanoInsights, Multi-SIM) to maintain incubation conditions at 37°C and 5% CO2. Time-lapse images were taken immediately after CCCP (10 µM) + Nocodazole (10 µM) treatment. Scale bar, 1 µm. (H–L) GFP-KI C. elegans strains: GFP::Tev::2×flag::RAB-1 (RAB-2, RAB-7, RAB-8, RAB-21), were treated with DMSO, Paraquat (8 mM) or CCCP (15 µM) for 4 h. The cleavage of GFP::Tev::2×flag::RAB-1(RAB-2, RAB-7, RAB-8, RAB-21) was analyzed by western blot. (M and N) GFP-KI C. elegans strains (GFP::Tev::2×flag::RAB-1) were treated with DMSO, Paraquat (8 mM), or CCCP (15 µM) for 2 h, staining with MitoTracker Red, and analyzed by confocal microscopy for GFP::RAB-1+ MtioTracker+ puncta, and quantified in N (n = 64 animals per group). Scale bars, 10 µm. The scale bars in the magnification boxes are 2 µm. Data are shown as mean ± SEM and analyzed with Kruskal–Wallis test. **P < 0.01, ***P < 0.001. Molecular weight measurements are in kD. Source data are available for this figure: SourceData F5.

The colocalization of Rab GTPases and endogenous TOMM20 with different treatment conditions. (A) U2OS cells transiently expressing HA-GFP-Rab GTPases were treated with DMSO or CCCP (10 µM) for 4 h, stained with anti-TOMM20, and the colocalization of Rab GTPases and endogenous TOMM20 were analyzed by confocal microscopy. Scale bars, 10 µm. The scale bars in the magnification boxes are 2 µm. (B and D) U2OS cells transiently expressing GFP-Rab2 or GFP-Rab8 were treated with hypoxia for 48 h, the colocalization was analyzed by Pearson’s R value in D (n = 20 cells per group). Scale bars, 10 µm. The scale bars in the magnification boxes are 2 µm. Data are shown as means ± SEM and analyzed with Student’s t test (two-tailed, unpaired). ***P < 0.001. (C and E) U2OS cells transiently expressing GFP-Rab2 or GFP-Rab8, were treated with OA (10 mM oligomycin, 4 mM antimycin A) for 4 h. The colocalization was analyzed by Pearson’s R-value in ED (n = 20 cells per group). Scale bars, 10 µm. The scale bars in the magnification boxes are 2 µm. Data are shown as means ± SEM and analyzed with Student’s t test (two-tailed, unpaired). ***P < 0.001. (F and G) PINK1 WT or PINK1 KO HeLa cells transiently expressing GFP-Rab8. 24 h after transfection, cells were treated by DMSO or 10 µM CCCP for 4 h, the colocalization of GFP-Rab8 and endogenous TOMM20 was analyzed by Pearson’s correlation coefficient in G (n = 20 cells per group). Scale bars, 10 µm. The scale bars in the magnification boxes are 2 µm. Data are shown as mean ± SEM and analyzed with Kruskal–Wallis test. *P < 0.05, ***P < 0.001. (H and I) U2OS cells transiently expressing HA-GFP-Rab8 or HA-GFP-Rab8 (C204S), 24 h after transfection, cells were treated with DMSO, 10 µM CCCP for 4 h, the colocalization of HA-GFP-Rab8 or HA-GFP-Rab8 (C204S) and endogenous TOMM20 were analyzed by Pearson’s R value in I (n = 20 cells per group). Scale bars, 10 µm. The scale bars in the magnification boxes are 2 µm. Data are shown as mean ± SEM and analyzed with one-way ANOVA. ***P < 0.001. Molecular weight measurements are in kD.
The colocalization of Rab GTPases and endogenous TOMM20 with different treatment conditions. (A) U2OS cells transiently expressing HA-GFP-Rab GTPases were treated with DMSO or CCCP (10 µM) for 4 h, stained with anti-TOMM20, and the colocalization of Rab GTPases and endogenous TOMM20 were analyzed by confocal microscopy. Scale bars, 10 µm. The scale bars in the magnification boxes are 2 µm. (B and D) U2OS cells transiently expressing GFP-Rab2 or GFP-Rab8 were treated with hypoxia for 48 h, the colocalization was analyzed by Pearson’s R value in D (n = 20 cells per group). Scale bars, 10 µm. The scale bars in the magnification boxes are 2 µm. Data are shown as means ± SEM and analyzed with Student’s t test (two-tailed, unpaired). ***P < 0.001. (C and E) U2OS cells transiently expressing GFP-Rab2 or GFP-Rab8, were treated with OA (10 mM oligomycin, 4 mM antimycin A) for 4 h. The colocalization was analyzed by Pearson’s R-value in ED (n = 20 cells per group). Scale bars, 10 µm. The scale bars in the magnification boxes are 2 µm. Data are shown as means ± SEM and analyzed with Student’s t test (two-tailed, unpaired). ***P < 0.001. (F and G) PINK1 WT or PINK1 KO HeLa cells transiently expressing GFP-Rab8. 24 h after transfection, cells were treated by DMSO or 10 µM CCCP for 4 h, the colocalization of GFP-Rab8 and endogenous TOMM20 was analyzed by Pearson’s correlation coefficient in G (n = 20 cells per group). Scale bars, 10 µm. The scale bars in the magnification boxes are 2 µm. Data are shown as mean ± SEM and analyzed with Kruskal–Wallis test. *P < 0.05, ***P < 0.001. (H and I) U2OS cells transiently expressing HA-GFP-Rab8 or HA-GFP-Rab8 (C204S), 24 h after transfection, cells were treated with DMSO, 10 µM CCCP for 4 h, the colocalization of HA-GFP-Rab8 or HA-GFP-Rab8 (C204S) and endogenous TOMM20 were analyzed by Pearson’s R value in I (n = 20 cells per group). Scale bars, 10 µm. The scale bars in the magnification boxes are 2 µm. Data are shown as mean ± SEM and analyzed with one-way ANOVA. ***P < 0.001. Molecular weight measurements are in kD.
Rab8 is recruited to damaged mitochondria upon mitophagy induction, related to Fig. 5. Total time 45 min. Acquired using TIRF microscopy with 20s interval between frames. 270x sped up.
Rab8 is recruited to damaged mitochondria upon mitophagy induction, related to Fig. 5. Total time 45 min. Acquired using TIRF microscopy with 20s interval between frames. 270x sped up.
Rab8 is recruited to damaged mitochondria upon mitophagy induction, related to Fig. 5. Total time 45 min. Acquired using TIRF microscopy with 20s interval between frames. 270x sped up.
Rab8 is recruited to damaged mitochondria upon mitophagy induction, related to Fig. 5. Total time 45 min. Acquired using TIRF microscopy with 20s interval between frames. 270x sped up.
Rab GTPases promotes mitophagy by recruiting mitophagy receptor
Consistently, the depletion of Rab8 impaired mitophagy, as evidenced by the delayed degradation of cytochrome c oxidase subunit 2 (COXII), a key component of the respiratory chain, following mitochondrial damage with CCCP (Fig. 6, A and B) or oligomycin and antimycin A (OA) (Fig. S4, A and B). Conversely, Rab8 overexpression accelerated mitophagy. Furthermore, a rescue experiment solidified the critical role of Rab8 in mitophagy (Fig. S4, C and D). In yeast, individual knockout of Ypt1, 7, 31, 32, 51, and 52 blocked the degradation of mitochondria labeled by OM45-GFP (Fig. S4, E–G). Additionally, a rescue experiment further confirmed the crucial role of Ypt1 or Ypt7 in mitophagy (Fig. 6 C and Fig. S4 H). Similarly, knockdown of rab-1, rab-2, rab-7, rab-8, rab-11.1, rab-21, or rab-39 reduced mitophagy in C. elegans under mitophagy-induced conditions by Paraquat (Fig. 6, D and E; and Fig. S4 I). These results suggest that Rab GTPases act as positive regulators of mitophagy. Next, we demonstrated that the mitochondrial enrichment of Rab8 was independent of mitophagy receptors, as simultaneous knockout of NDP52, p62, OPTN, TAX1BP1, and NBR1 in Penta-KO HeLa cells (Lazarou et al., 2015) unexpectedly increased Rab8’s mitochondrial association (Fig. 6 F). In addition, the knockout of PINK1 did not reduce the mitochondria-targeting of Rab8 (Fig. S4 J). Confocal microscopy analysis revealed that these Rab GTPases colocalized with LC3 around damaged mitochondria under CCCP-treated conditions in U2OS cells (Fig. S5 A). Additionally, these Rab GTPases colocalized and associated with mitophagy receptors on damaged mitochondria under CCCP-treated conditions in U2OS cells (Fig. 6, G and H; and Fig. S5 B). To further substantiate the role of Rab GTPases as autophagy cues signals, we conducted live-cell imaging analysis using Grazing Incidence Structured Illumination Microscopy (GI-SIM) (Guo et al., 2018) to demonstrate the recruitment of Rab8 to fragmented mitochondria prior to the recruitment of the receptor NDP52 (Fig. 6 I and Video 3). Furthermore, NDP52WT, but not NDP52ΔZN, a mutant losing Rab-binding activity (Fig. 4, C and D), was able to rescue the mitophagy defects in NDP52 KO HeLa cells (Xu et al., 2019) (Fig. 6 J). Concentrating early autophagy machinery on targeted autophagy cargo is a hallmark of the autophagy initiation process (Ravenhill et al., 2019; Shi et al., 2020; Vargas et al., 2019). Indeed, we showed that ULK1 or ATG9 colocalized with Rab8 and NDP52 on damaged mitochondria in the ATG7 KO cell (Fig. S4, K and L), excluding the possibility that their colocalization was due to the formation of autophagic vacuoles. In addition, Rab8 knockout resulted in the abolishment of NDP52 and ATG9 recruitment to the fragmented mitochondria (Fig. S4, M and N). These results demonstrate that Rab GTPases redistribute to damaged mitochondria to recruit mitophagy receptors for mitophagy initiation.

Rab GTPases promotes mitophagy by recruiting mitophagy receptor. (A and B) HEK293T cells transiently expressing shRNA of Rab8 (Rab8 KD) or HA-GFP-Rab8 (Rab8 OE), were treated with DMSO or CCCP (10 µM) for 0, 2, or 4 h, and endogenous Rab8 or COXII were measured by western blot. Quantification is shown in B. Data are shown as means ± SEM and analyzed with one-way ANOVA. *P < 0.05, **P < 0.01, ***P < 0.001. (C) OM45-GFP, OM45-GFP-atg5∆, OM45-GFP-Ypt1 KD, OM45-GFP-Ypt1 KD (FLAG-Ypt1) yeast strains were cultured in SD-N medium for 0, 4, 8 h. The cleavage of OM45-GFP was analyzed by western blot. Pgk1 served as a loading control. (D and E) Representative confocal images of Pcol-19-mRFP::GFP::FIS1(zjuSi374) transgenic animals treated with rab-1, rab-2, rab-7, rab-8, rab-11.1, rab-21, rab-39, and control L4440 (empty vector) RNAi for 4 h at Paraquat treatment, and quantified in E, C. elegans (n = 40) were counted for each pair of analyses. Scale bars, 10 µm. The scale bars in the magnification boxes are 2 µm. Data are shown as mean ± SEM and analyzed with one-way ANOVA. ***P < 0.001. (F) HeLa WT and Penta KO HeLa cells were treated with 10 µM CCCP or 10 µM CCCP and Bafilomycin A1 for 2 h, and fractions were isolated. The Input group represents the total proteins, the Cyto group represents the cytoplasmic component, and the Mito group represents the mitochondrial component proteins, which were collected and analyzed by western blot. (G and H) U2OS cells transiently expressing GFP-Rab8 and mCherry-NDP52, cells were treated with 10 µM CCCP for 4 h, the colocalization of Rab8, NDP52 and endogenous TOMM20 was analyzed by confocal microscopy in H. For GFP-Rab8, mCherry-NDP52, and TOMM20 (DMSO), n = 30; for GFP-Rab8, mCherry-NDP52, and TOMM20 (CCCP), n = 30. Scale bars, 10 µm. The scale bars in the magnification boxes are 2 µm. Data are shown as mean ± SEM and analyzed with Student’s t test (two-tailed, unpaired). ***P < 0.001. (I) NDP52 KO U2OS cells transiently expressing mNeonGreen-Rab8 and mTagBFP2-NDP52, 24 h after transfection, cells were incubated with mitochondrial dye (PK Mito Orange, PKMO-2, Genvivo) for 30 min at 37°C. After washing cells two to three times with a warm culture medium, the culture dish was mounted on the microscope (NanoInsights, Multi-SIM) to maintain incubation conditions at 37°C and 5% CO2. Time-lapse images were taken after CCCP treatment (10 µM) for 10 min. Scale bar, 1 µm. (J) NDP52 KO HeLa cells expressing mCherry-Parkin were transfected with Vector, Flag-NDP52WT, or Flag-NDP52∆ZN were treated with 10 µM CCCP for 0, 2, or 4 h, whole cell lysates were collected and analyzed by western blot. Molecular weight measurements are in kD. Source data are available for this figure: SourceData F6.
Rab GTPases promotes mitophagy by recruiting mitophagy receptor. (A and B) HEK293T cells transiently expressing shRNA of Rab8 (Rab8 KD) or HA-GFP-Rab8 (Rab8 OE), were treated with DMSO or CCCP (10 µM) for 0, 2, or 4 h, and endogenous Rab8 or COXII were measured by western blot. Quantification is shown in B. Data are shown as means ± SEM and analyzed with one-way ANOVA. *P < 0.05, **P < 0.01, ***P < 0.001. (C) OM45-GFP, OM45-GFP-atg5∆, OM45-GFP-Ypt1 KD, OM45-GFP-Ypt1 KD (FLAG-Ypt1) yeast strains were cultured in SD-N medium for 0, 4, 8 h. The cleavage of OM45-GFP was analyzed by western blot. Pgk1 served as a loading control. (D and E) Representative confocal images of Pcol-19-mRFP::GFP::FIS1(zjuSi374) transgenic animals treated with rab-1, rab-2, rab-7, rab-8, rab-11.1, rab-21, rab-39, and control L4440 (empty vector) RNAi for 4 h at Paraquat treatment, and quantified in E, C. elegans (n = 40) were counted for each pair of analyses. Scale bars, 10 µm. The scale bars in the magnification boxes are 2 µm. Data are shown as mean ± SEM and analyzed with one-way ANOVA. ***P < 0.001. (F) HeLa WT and Penta KO HeLa cells were treated with 10 µM CCCP or 10 µM CCCP and Bafilomycin A1 for 2 h, and fractions were isolated. The Input group represents the total proteins, the Cyto group represents the cytoplasmic component, and the Mito group represents the mitochondrial component proteins, which were collected and analyzed by western blot. (G and H) U2OS cells transiently expressing GFP-Rab8 and mCherry-NDP52, cells were treated with 10 µM CCCP for 4 h, the colocalization of Rab8, NDP52 and endogenous TOMM20 was analyzed by confocal microscopy in H. For GFP-Rab8, mCherry-NDP52, and TOMM20 (DMSO), n = 30; for GFP-Rab8, mCherry-NDP52, and TOMM20 (CCCP), n = 30. Scale bars, 10 µm. The scale bars in the magnification boxes are 2 µm. Data are shown as mean ± SEM and analyzed with Student’s t test (two-tailed, unpaired). ***P < 0.001. (I) NDP52 KO U2OS cells transiently expressing mNeonGreen-Rab8 and mTagBFP2-NDP52, 24 h after transfection, cells were incubated with mitochondrial dye (PK Mito Orange, PKMO-2, Genvivo) for 30 min at 37°C. After washing cells two to three times with a warm culture medium, the culture dish was mounted on the microscope (NanoInsights, Multi-SIM) to maintain incubation conditions at 37°C and 5% CO2. Time-lapse images were taken after CCCP treatment (10 µM) for 10 min. Scale bar, 1 µm. (J) NDP52 KO HeLa cells expressing mCherry-Parkin were transfected with Vector, Flag-NDP52WT, or Flag-NDP52∆ZN were treated with 10 µM CCCP for 0, 2, or 4 h, whole cell lysates were collected and analyzed by western blot. Molecular weight measurements are in kD. Source data are available for this figure: SourceData F6.
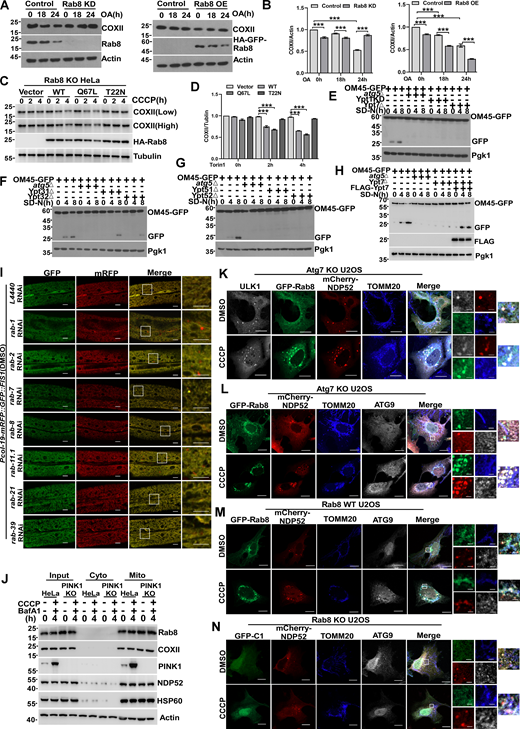
Knockout or knockdown of Rab GTPase impaired mitophagy. (A and B) HEK293T cells transiently expressing shRNA of Rab8 (Rab8 KD) or HA-GFP-Rab8 (Rab8 OE), cells were treated with DMSO or OA (10 mM oligomycin, 4 mM antimycin A) for 0, 18, or 24 h, respectively. The endogenous Rab8 or COXII were measured by western blot. Quantification is shown in B (n = 3 experimental replicates). Data are shown as means ± SEM and analyzed with one-way ANOVA. ***P < 0.001. (C and D) Rab8 KO HeLa cells transiently expressing HA-Vector, HA-Rab8, HA-Rab8 Q67L, and HA-Rab8 T22N, 24 h after transfection, were treated by 10 µM CCCP for 0, 2, or 4 h, whole cell lysates were collected and the levels of endogenous COXII was measured by western blot. Quantification is shown in D (n = 3 experimental replicates). Data are shown as means ± SEM and analyzed with one-way ANOVA. ***P < 0.001. (E) GFP, OM45-GFP-atg5∆, OM45-GFP-Ypt1KD, and OM45-GFP-Ypt7∆yeast strains were cultured in SD-N medium for 0, 4, and 8 h. The cleavage of OM45-GFP was analyzed by western blot. Pgk1 served as a loading control. (F) OM45-GFP, OM45-GFP-atg5∆, OM45-GFP-Ypt31∆, and OM45-GFP-Yp32∆yeast strains were cultured in SD-N medium for 0, 4, and 8 h. The cleavage of OM45-GFP was analyzed by western blot. Pgk1 served as a loading control. (G) OM45-GFP, OM45-GFP-atg5∆, OM45-GFP-Ypt51∆, and OM45-GFP-Yp52∆yeast strains were cultured in SD-N medium for 0, 4, and 8 h. The cleavage of OM45-GFP was analyzed by western blot. Pgk1 served as a loading control. (H) OM45-GFP, OM45-GFP-atg5∆, OM45-GFP-Ypt7∆, and OM45-GFP-Ypt7∆ (FLAG-Ypt7) yeast strains were cultured in SD-N medium for 0, 4, 8 h. The cleavage of OM45-GFP was analyzed by western blot. Pgk1 served as a loading control. (I) Representative confocal images of Pcol-19-mRFP::GFP::FIS1(zjuSi374) transgenic animals treated with rab-1, rab-2, rab-7, rab-8, rab-11.1, rab-21, rab-39, and control L4440 (empty vector) RNAi for 4 h at DMSO treatment. Scale bars, 10 µm. The scale bars in the magnification boxes are 2 µm. (J) PINK1 WT and PINK1 KO HEK293 cells were treated with 10 µM CCCP or 10 µM CCCP and Bafilomycin A1 for 2 h, and fractions were isolated. The Input group represents the total proteins, the Cyto group represents the cytoplasmic component, and the Mito group represents the mitochondrial component proteins, which were collected and analyzed by western blot. (K) Atg7 KO U2OS cells transiently expressing HA-ULK1, GFP-Rab8, and mCherry-NDP52 were treated with DMSO or CCCP for 4 h, the colocalization of Rab8, ULK1, NDP52, and endogenous TOMM20 were analyzed by confocal microscopy. Scale bars, 10 µm. The scale bars in the magnification boxes are 2 µm. (L) Atg7 KO U2OS cells transiently expressing GFP-Rab8 and mCherry-NDP52, were treated with DMSO or CCCP for 4 h, the colocalization of Rab8, ATG9, NDP52, and endogenous TOMM20 was analyzed by confocal microscopy. Scale bars, 10 µm. The scale bars in the magnification boxes are 2 µm. (M) Rab8 WT U2OS cells transiently expressing GFP-Rab8 and mCherry-NDP52, were treated with DMSO or CCCP for 4 h, the colocalization of GFP-Rab8, ATG9, NDP52, and endogenous TOMM20 was analyzed by confocal microscopy. Scale bars, 10 µm. The scale bars in the magnification boxes are 2 µm. (N) Rab8 KO U2OS cells transiently expressing GFP-C1 and mCherry-NDP52, were treated with DMSO or CCCP for 4 h, the colocalization of GFP-C1, ATG9, NDP52, and endogenous TOMM20 was analyzed by confocal microscopy. Scale bars, 10 µm. The scale bars in the magnification boxes are 2 µm. Molecular weight measurements are in kD. Source data are available for this figure: SourceData FS4.

Knockout or knockdown of Rab GTPase impaired mitophagy. (A and B) HEK293T cells transiently expressing shRNA of Rab8 (Rab8 KD) or HA-GFP-Rab8 (Rab8 OE), cells were treated with DMSO or OA (10 mM oligomycin, 4 mM antimycin A) for 0, 18, or 24 h, respectively. The endogenous Rab8 or COXII were measured by western blot. Quantification is shown in B (n = 3 experimental replicates). Data are shown as means ± SEM and analyzed with one-way ANOVA. ***P < 0.001. (C and D) Rab8 KO HeLa cells transiently expressing HA-Vector, HA-Rab8, HA-Rab8 Q67L, and HA-Rab8 T22N, 24 h after transfection, were treated by 10 µM CCCP for 0, 2, or 4 h, whole cell lysates were collected and the levels of endogenous COXII was measured by western blot. Quantification is shown in D (n = 3 experimental replicates). Data are shown as means ± SEM and analyzed with one-way ANOVA. ***P < 0.001. (E) GFP, OM45-GFP-atg5∆, OM45-GFP-Ypt1KD, and OM45-GFP-Ypt7∆yeast strains were cultured in SD-N medium for 0, 4, and 8 h. The cleavage of OM45-GFP was analyzed by western blot. Pgk1 served as a loading control. (F) OM45-GFP, OM45-GFP-atg5∆, OM45-GFP-Ypt31∆, and OM45-GFP-Yp32∆yeast strains were cultured in SD-N medium for 0, 4, and 8 h. The cleavage of OM45-GFP was analyzed by western blot. Pgk1 served as a loading control. (G) OM45-GFP, OM45-GFP-atg5∆, OM45-GFP-Ypt51∆, and OM45-GFP-Yp52∆yeast strains were cultured in SD-N medium for 0, 4, and 8 h. The cleavage of OM45-GFP was analyzed by western blot. Pgk1 served as a loading control. (H) OM45-GFP, OM45-GFP-atg5∆, OM45-GFP-Ypt7∆, and OM45-GFP-Ypt7∆ (FLAG-Ypt7) yeast strains were cultured in SD-N medium for 0, 4, 8 h. The cleavage of OM45-GFP was analyzed by western blot. Pgk1 served as a loading control. (I) Representative confocal images of Pcol-19-mRFP::GFP::FIS1(zjuSi374) transgenic animals treated with rab-1, rab-2, rab-7, rab-8, rab-11.1, rab-21, rab-39, and control L4440 (empty vector) RNAi for 4 h at DMSO treatment. Scale bars, 10 µm. The scale bars in the magnification boxes are 2 µm. (J) PINK1 WT and PINK1 KO HEK293 cells were treated with 10 µM CCCP or 10 µM CCCP and Bafilomycin A1 for 2 h, and fractions were isolated. The Input group represents the total proteins, the Cyto group represents the cytoplasmic component, and the Mito group represents the mitochondrial component proteins, which were collected and analyzed by western blot. (K) Atg7 KO U2OS cells transiently expressing HA-ULK1, GFP-Rab8, and mCherry-NDP52 were treated with DMSO or CCCP for 4 h, the colocalization of Rab8, ULK1, NDP52, and endogenous TOMM20 were analyzed by confocal microscopy. Scale bars, 10 µm. The scale bars in the magnification boxes are 2 µm. (L) Atg7 KO U2OS cells transiently expressing GFP-Rab8 and mCherry-NDP52, were treated with DMSO or CCCP for 4 h, the colocalization of Rab8, ATG9, NDP52, and endogenous TOMM20 was analyzed by confocal microscopy. Scale bars, 10 µm. The scale bars in the magnification boxes are 2 µm. (M) Rab8 WT U2OS cells transiently expressing GFP-Rab8 and mCherry-NDP52, were treated with DMSO or CCCP for 4 h, the colocalization of GFP-Rab8, ATG9, NDP52, and endogenous TOMM20 was analyzed by confocal microscopy. Scale bars, 10 µm. The scale bars in the magnification boxes are 2 µm. (N) Rab8 KO U2OS cells transiently expressing GFP-C1 and mCherry-NDP52, were treated with DMSO or CCCP for 4 h, the colocalization of GFP-C1, ATG9, NDP52, and endogenous TOMM20 was analyzed by confocal microscopy. Scale bars, 10 µm. The scale bars in the magnification boxes are 2 µm. Molecular weight measurements are in kD. Source data are available for this figure: SourceData FS4.

Rab GTPases colocalize with LC3 or mitophagy receptors around damaged mitochondria under CCCP-treated conditions. (A) U2OS cells transiently expressing HA-GFP-Rab GTPases, were treated with DMSO or CCCP 10 µM for 4 h, stained with anti-TOMM20and anti-LC3, the colocalization of Rab GTPases, endogenous TOMM20 and LC3 was analyzed by confocal microscopy. Scale bars, 10 µm. The scale bars in the magnification boxes are 2 µm. (B) U2OS cells transiently expressing HA-GFP-Rab GTPases and mCherry-NDP52 (mCherry-OPTN), were treated with DMSO or CCCP for 4 h, stained with anti-TOMM20, the colocalization of Rab GTPases, mCherry-NDP52, mCherry-OPTN, or endogenous p62 and TOMM20 was analyzed by confocal microscopy. Scale bars, 10 µm. The scale bars in the magnification boxes are 2 µm. Molecular weight measurements are in kD.

Rab GTPases colocalize with LC3 or mitophagy receptors around damaged mitochondria under CCCP-treated conditions. (A) U2OS cells transiently expressing HA-GFP-Rab GTPases, were treated with DMSO or CCCP 10 µM for 4 h, stained with anti-TOMM20and anti-LC3, the colocalization of Rab GTPases, endogenous TOMM20 and LC3 was analyzed by confocal microscopy. Scale bars, 10 µm. The scale bars in the magnification boxes are 2 µm. (B) U2OS cells transiently expressing HA-GFP-Rab GTPases and mCherry-NDP52 (mCherry-OPTN), were treated with DMSO or CCCP for 4 h, stained with anti-TOMM20, the colocalization of Rab GTPases, mCherry-NDP52, mCherry-OPTN, or endogenous p62 and TOMM20 was analyzed by confocal microscopy. Scale bars, 10 µm. The scale bars in the magnification boxes are 2 µm. Molecular weight measurements are in kD.
The recruitment of Rab8 to fragmented mitochondria precedes the recruitment of the receptor NDP52, related toFig. 6. Total time 45 min. Acquired using TIRF microscopy with 20s interval between frames. 270x sped up.
The recruitment of Rab8 to fragmented mitochondria precedes the recruitment of the receptor NDP52, related toFig. 6. Total time 45 min. Acquired using TIRF microscopy with 20s interval between frames. 270x sped up.
Rab GTPases mediate lipophagy and xenophagy in mammalian cells
Previous studies have indicated that Rab GTPases are enriched on lipid droplets (Bersuker et al., 2018) and Salmonella-containing vacuoles (SCV) (Smith et al., 2007); however, the reasons behind these observations are poorly understood. Both lipid droplets and invading bacterial pathogens are targeted by selective autophagy processes known as lipophagy and xenophagy, respectively (Gatica et al., 2018). We hypothesized that Rab GTPases may serve as autophagy cues signals in these pathways. Previous studies suggested that p62 may mediate the autophagic degradation of lipid droplets (Lam et al., 2016), although the mechanism is unclear. We chose Rab2 and Rab18 for further investigation because they interact with p62 (Fig. 4 A), and we demonstrated that Rab GTPases localized on lipid droplets, which depended on their prenylation but not on the key selective autophagy receptors (Fig. 7 A–D). Using an established assay for lipophagy flux measurement (Pu et al., 2023), we showed that Rab2 KO or p62 KO significantly attenuated lipophagy flux (Fig. 7, E–I). Importantly, we found that the defect of lipophagy in p62 KO cells could be rescued by reintroducing p62WT but not by the mutant p62ΔZZ, which lacks Rab2-binding activity (Fig. 7, E–I). Mechanistically, Rab2 or Rab18 may recruit p62 to lipid droplets through their direct interaction to facilitate lipophagy because either deleting the Rab-interaction domain of p62 or eliminating membrane anchoring of Rab2 or Rab18 abolished their colocalization on lipid droplets (Fig. 7, J–N). We chose Rab9 and Rab14 for further investigation because of their interaction with the xenophagy receptor NDP52 and their accumulation on SCV (Fig. 8, A and B). Mutation of their prenylation sites abrogated their SCV-targeting, which was not altered by the depletion of the autophagy receptors (Fig. 8, C and D). NDP52WT but not the Rab-binding defective mutant∆(CC+ZN) was recruited to Rab-labeled SCV (Fig. 8, E–I). Consequently, NDP52 WT but not the mutant was able to rescue the xenophagy defect in NDP52 KO cells (Fig. 8, J–N). These results confirm that Rab GTPases serve as autophagy cues signals in both lipophagy and xenophagy.

Rab GTPases mediate lipophagy in mammalian cells. (A and B) Penta KO HeLa cells transiently expressing HA-GFP-Rab2 WT, HA-GFP-Rab2 (C211, 213S), HA-GFP-Rab18 WT, HA-GFP-Rab18 (C203S), cells were treated with 200 µM/liter OA for 6 h. Cells were stained with Bodipy, quantified in B (n = 25 cells per group). Scale bars, 10 µm. The scale bars in the magnification boxes are 2 µm. Data are shown as mean ± SEM and analyzed with Student’s t test (two-tailed, unpaired). ***P < 0.001. (C and D) HeLa WT or Penta KO HeLa cells were transfected with HA-GFP-Rab2, HA-GFP-Rab18, treated with 200 µM/liter OA for 6 h. Cells were stained with Bodipy, quantified in D (n = 30 cells per group). Scale bars, 10 µm. The scale bars in the magnification boxes are 2 µm. Data are shown as mean ± SEM and analyzed with Student’s t test (two-tailed, unpaired). (E and F) Representative FACS scatterplots of GFP and mCherry fluorescence in WT or Rab2 KO U2OS cells. Cells expressing mCherry-GFP-livedrop were serum-starved for 24 h, quantified in F, data was obtained from three independent replicates. Data are shown as means ± SEM and analyzed with Student’s t test (two-tailed, unpaired). **P < 0.01. (G and H) Representative FACS scatterplots of GFP and mCherry fluorescence in HEK293 WT, p62 KO HEK293, p62 KO HEK293 (p62WT), or p62 KO HEK293(p62∆ZZ) cells. Cells expressing mCherry-GFP-livedrop were serum-starved for 24 h, quantified in H. Data are shown as means ± SEM and analyzed with one-way ANOVA. *P < 0.05, ***P < 0.001. (I and J) HEK 293T cells were co-transfected with FLAG-p62 constructs and HA-GFP-Rab2 or HA-GFP-Rab18, cell lysates were collected, coimmunoprecipitation was performed and analyzed by western blot. (K and L) Penta KO HeLa cells transiently expressing HA-GFP-Rab2 and mCherry-p62, HA-GFP-Rab2 (C211, 213S) and mCherry-p62, HA-GFP-Rab2 and mCherry-p62∆ZZ, were treated with 200 µM/l OA for 6 h. Cells were stained with Bodipy, quantified in L (n = 20 cells per group). Scale bars, 10 µm. The scale bars in the magnification boxes are 2 µm. Data are shown as mean ± SEM and analyzed with Kruskal–Wallis test. ***P < 0.001. (M and N) Penta KO HeLa cells were transfected with HA-GFP-Rab18 and mCherry-p62, HA-GFP-Rab18 (C203S), and mCherry-p62, HA-GFP-Rab18 and mCherry-p62∆ZZ, treated with 200 µM/liter OA for 6 h. Cells were stained with Bodipy, quantified in N (n = 20 cells per group). Scale bars, 10 µm. The scale bars in the magnification boxes are 2 µm. Data are shown as mean ± SEM and analyzed with Kruskal–Wallis test. **P < 0.01, ***P < 0.001. Molecular weight measurements are in kD. Source data are available for this figure: SourceData F7.
Rab GTPases mediate lipophagy in mammalian cells. (A and B) Penta KO HeLa cells transiently expressing HA-GFP-Rab2 WT, HA-GFP-Rab2 (C211, 213S), HA-GFP-Rab18 WT, HA-GFP-Rab18 (C203S), cells were treated with 200 µM/liter OA for 6 h. Cells were stained with Bodipy, quantified in B (n = 25 cells per group). Scale bars, 10 µm. The scale bars in the magnification boxes are 2 µm. Data are shown as mean ± SEM and analyzed with Student’s t test (two-tailed, unpaired). ***P < 0.001. (C and D) HeLa WT or Penta KO HeLa cells were transfected with HA-GFP-Rab2, HA-GFP-Rab18, treated with 200 µM/liter OA for 6 h. Cells were stained with Bodipy, quantified in D (n = 30 cells per group). Scale bars, 10 µm. The scale bars in the magnification boxes are 2 µm. Data are shown as mean ± SEM and analyzed with Student’s t test (two-tailed, unpaired). (E and F) Representative FACS scatterplots of GFP and mCherry fluorescence in WT or Rab2 KO U2OS cells. Cells expressing mCherry-GFP-livedrop were serum-starved for 24 h, quantified in F, data was obtained from three independent replicates. Data are shown as means ± SEM and analyzed with Student’s t test (two-tailed, unpaired). **P < 0.01. (G and H) Representative FACS scatterplots of GFP and mCherry fluorescence in HEK293 WT, p62 KO HEK293, p62 KO HEK293 (p62WT), or p62 KO HEK293(p62∆ZZ) cells. Cells expressing mCherry-GFP-livedrop were serum-starved for 24 h, quantified in H. Data are shown as means ± SEM and analyzed with one-way ANOVA. *P < 0.05, ***P < 0.001. (I and J) HEK 293T cells were co-transfected with FLAG-p62 constructs and HA-GFP-Rab2 or HA-GFP-Rab18, cell lysates were collected, coimmunoprecipitation was performed and analyzed by western blot. (K and L) Penta KO HeLa cells transiently expressing HA-GFP-Rab2 and mCherry-p62, HA-GFP-Rab2 (C211, 213S) and mCherry-p62, HA-GFP-Rab2 and mCherry-p62∆ZZ, were treated with 200 µM/l OA for 6 h. Cells were stained with Bodipy, quantified in L (n = 20 cells per group). Scale bars, 10 µm. The scale bars in the magnification boxes are 2 µm. Data are shown as mean ± SEM and analyzed with Kruskal–Wallis test. ***P < 0.001. (M and N) Penta KO HeLa cells were transfected with HA-GFP-Rab18 and mCherry-p62, HA-GFP-Rab18 (C203S), and mCherry-p62, HA-GFP-Rab18 and mCherry-p62∆ZZ, treated with 200 µM/liter OA for 6 h. Cells were stained with Bodipy, quantified in N (n = 20 cells per group). Scale bars, 10 µm. The scale bars in the magnification boxes are 2 µm. Data are shown as mean ± SEM and analyzed with Kruskal–Wallis test. **P < 0.01, ***P < 0.001. Molecular weight measurements are in kD. Source data are available for this figure: SourceData F7.

Rab GTPases mediate xenophagy in mammalian cells. (A and B) HeLa WT or Penta KO HeLa cells were transfected with HA-GFP-Rab9, HA-GFP-Rab14, infected WT-RFP-marked S. typhimuriun (Samonella) for 4 h and analyzed by confocal microscopy. Quantified in B (n = 20 cells per group). Scale bars, 10 μm. The scale bars in the magnification boxes are 2 µm. Data are shown as mean ± SEM analyzed with Student’s t test (two-tailed, unpaired). (C and D) Penta KO HeLa cells transiently expressing HA-GFP-Rab9 WT, HA-GFP-Rab9 (C200, 201S), HA-GFP-Rab14 WT, HA-GFP-Rab14 (C213, 215S), were infected WT-RFP-marked S. typhimuriun (Salmonella) for 4 h and analyzed by confocal microscopy. Quantified in D (n = 25 cells per group). Scale bars, 10 µm. The scale bars in the magnification boxes are 2 µm. Data are shown as mean ± SEM and analyzed with Student’s t test (two-tailed, unpaired). ***P < 0.001. (E) HEK 293T cells were co-transfected with HA-GFP-Rab18 and FLAG-NDP52 constructs, cell lysates were collected, coimmunoprecipitation were performed and analyzed by western blot. (F and H) Penta KO HeLa cells transiently expressing HA-GFP-Rab9 and BFP-NDP52 WT or HA-GFP-Rab9 and BFP-NDP52∆(CC+ZN), were infected WT-RFP-marked S. typhimuriun (Salmonella) for 4 h and analyzed by confocal microscopy. Quantified in H (n = 25 cells per group). Scale bars, 10 µm. The scale bars in the magnification boxes are 2 µm. Data are shown as mean ± SEM and analyzed with Student’s t test (two-tailed, unpaired). ***P < 0.001. (G and I) Penta KO HeLa cells were transfected with HA-GFP-Rab14 and BFP-NDP52 WT or HA-GFP-Rab14 and BFP-NDP52∆(CC+ZN), infected WT-RFP-marked S. typhimuriun (Samonella) for 4 h and analyzed by confocal microscopy. Quantified in I (n = 20 cells per group). Scale bars, 10 µm. The scale bars in the magnification boxes are 2 µm. Data are shown as mean ± SEM and analyzed with Student’s t test (two-tailed, unpaired). ***P < 0.001. (J and K) Invasion in J and viability in K of WT-RFP-marked S. typhimuriun (Salmonella) in HeLa, Atg7 KO HeLa, NDP52 KO HeLa, NDP52 KO HeLa rescued with NDP52WT, or NDP52 KO HeLa rescued with NDP52∆(CC+ZN). Quantitative data were obtained from six independent replicates. Data are shown as mean ± SEM and analyzed with one-way ANOVA. *P < 0.05, ***P < 0.001. (L and M) Invasion in L and viability in M of WT-RFP-marked S. typhimuriun (Salmonella) in Rab14 KD HEK23T rescued with Rab14 WT or Rab14 (C213, 215S). Quantitative data were obtained from six independent replicates. Data are shown as mean ± SEM and analyzed with one-way ANOVA. *P < 0.05, ***P < 0.001. Molecular weight measurements are in kD. Source data are available for this figure: SourceData F8.
Rab GTPases mediate xenophagy in mammalian cells. (A and B) HeLa WT or Penta KO HeLa cells were transfected with HA-GFP-Rab9, HA-GFP-Rab14, infected WT-RFP-marked S. typhimuriun (Samonella) for 4 h and analyzed by confocal microscopy. Quantified in B (n = 20 cells per group). Scale bars, 10 μm. The scale bars in the magnification boxes are 2 µm. Data are shown as mean ± SEM analyzed with Student’s t test (two-tailed, unpaired). (C and D) Penta KO HeLa cells transiently expressing HA-GFP-Rab9 WT, HA-GFP-Rab9 (C200, 201S), HA-GFP-Rab14 WT, HA-GFP-Rab14 (C213, 215S), were infected WT-RFP-marked S. typhimuriun (Salmonella) for 4 h and analyzed by confocal microscopy. Quantified in D (n = 25 cells per group). Scale bars, 10 µm. The scale bars in the magnification boxes are 2 µm. Data are shown as mean ± SEM and analyzed with Student’s t test (two-tailed, unpaired). ***P < 0.001. (E) HEK 293T cells were co-transfected with HA-GFP-Rab18 and FLAG-NDP52 constructs, cell lysates were collected, coimmunoprecipitation were performed and analyzed by western blot. (F and H) Penta KO HeLa cells transiently expressing HA-GFP-Rab9 and BFP-NDP52 WT or HA-GFP-Rab9 and BFP-NDP52∆(CC+ZN), were infected WT-RFP-marked S. typhimuriun (Salmonella) for 4 h and analyzed by confocal microscopy. Quantified in H (n = 25 cells per group). Scale bars, 10 µm. The scale bars in the magnification boxes are 2 µm. Data are shown as mean ± SEM and analyzed with Student’s t test (two-tailed, unpaired). ***P < 0.001. (G and I) Penta KO HeLa cells were transfected with HA-GFP-Rab14 and BFP-NDP52 WT or HA-GFP-Rab14 and BFP-NDP52∆(CC+ZN), infected WT-RFP-marked S. typhimuriun (Samonella) for 4 h and analyzed by confocal microscopy. Quantified in I (n = 20 cells per group). Scale bars, 10 µm. The scale bars in the magnification boxes are 2 µm. Data are shown as mean ± SEM and analyzed with Student’s t test (two-tailed, unpaired). ***P < 0.001. (J and K) Invasion in J and viability in K of WT-RFP-marked S. typhimuriun (Salmonella) in HeLa, Atg7 KO HeLa, NDP52 KO HeLa, NDP52 KO HeLa rescued with NDP52WT, or NDP52 KO HeLa rescued with NDP52∆(CC+ZN). Quantitative data were obtained from six independent replicates. Data are shown as mean ± SEM and analyzed with one-way ANOVA. *P < 0.05, ***P < 0.001. (L and M) Invasion in L and viability in M of WT-RFP-marked S. typhimuriun (Salmonella) in Rab14 KD HEK23T rescued with Rab14 WT or Rab14 (C213, 215S). Quantitative data were obtained from six independent replicates. Data are shown as mean ± SEM and analyzed with one-way ANOVA. *P < 0.05, ***P < 0.001. Molecular weight measurements are in kD. Source data are available for this figure: SourceData F8.
RabGGTase, GDI, and LRRK2 are regulators of Rab GTPase as autophagy cues signals
We have illustrated the critical role of prenylation-mediated membrane targeting in the degradation and function of Rab GTPases. It is plausible that the primary regulators of Rab GTPase prenylation and membrane association may act as upstream autophagy cues signal molecules in the context of Rab GTPase-mediated selective autophagy. This regulation involves the orchestrated actions of several key proteins such as RabGGTase and Rab GDI (GDP Dissociation Inhibitor). We hypothesize that RabGGTase catalyzes Rab prenylation as one of the upstream signals to engage Rab GTPases as autophagy cues signals under certain conditions. RABGGTA, RABGGTB, and CHM (component A) form a heterotrimer, where RABGGTA and RABGGTB constitute the catalytic component B, while CHM mediates Rab binding. Knockdown of either catalytic component of RabGGTase reduced the autolysosomal degradation of Rab8 (Fig. 9, A–D; and Fig. S6 A and B), indicating that the enzyme indeed plays a positive role in Rab autophagy cues signaling. Subsequently, we employed the knockdown of GDIs to demonstrate the existence of negative signals for the recruitment of Rab GTPases. The human genome encodes two GDIs, and knockdown of either GDI1 or GDI2 facilitated the degradation of Rab2, Rab8, and Rab9, as evidenced by GFP cleavage assays (Fig. 9, E and F; and Fig. S6, C–H). Furthermore, a phosphoproteomics study revealed that the Parkinson’s disease kinase LRRK2 may inhibit a subset of Rab GTPases by phosphorylation. We investigated the upstream signaling governed by LRRK2. Initially, knockdown of the LRRK2 homolog, lrk-1, in C. elegans enhanced the degradation of Rab1 and Rab8 (Fig. 9, G and H; and Fig. S6, I and J), while overexpression of LRRK2 WT or the gain-of-function mutant LRRK2 G2019S mitigated their degradation in worms (Fig. 9, I and J). In mammalian cells, inhibiting LRRK2 activity through the inhibitor PF-06447475 or shRNA knockdown amplified Rab8 degradation (Fig. 9, K–M; and Fig. S6 K). Additionally, Rab8 T72E or Rab35 T72E mutants, mimicking LRRK2-mediated phosphorylation, exhibited reduced interaction with NDP52, and consequently decreased degradation. These findings suggest that LRRK2 phosphorylates Rab GTPases, preventing their interaction with selective autophagy receptors like NDP52 (Fig. 9, N–P; and Fig. S6, L–N). It was shown that RABGGTB interacts with the non-phosphorylated form of Rab8. Phosphorylation of Rab8 at “Thr-72” disrupts this interaction, impairing Rab8 prenylation (Steger et al., 2016). Hence, it is likely that LRRK2-mediated Rab phosphorylation regulates both their prenylation by RabGGTase and their interaction with downstream autophagy receptors such as NDP52.

RabGGTase, GDI, and LRRK2 are regulators of Rab GTPase as autophagy cues signals. (A and B) RabGGTA KD HEK293T cells transiently expressing GFP-Rab8, were treated with Torin1 or Torin1 + Bafilomycin A1 for 0 or 4 h, Quantification of cleavage GFP is shown in B (n = 3 experimental replicates). Data are shown as means ± SEM and analyzed with one-way ANOVA. ***P < 0.001. (C and D) RabGGTB KD HEK293T cells transiently expressing GFP-Rab8, were treated with Torin1 or Torin1 + Bafilomycin A1 for 0 or 4 h, Quantification of cleavage GFP is shown in D (n = 3 experimental replicates). Data are shown as means ± SEM and analyzed with one-way ANOVA. ***P < 0.001. (E and F) GDI1 KD HEK293T, GDI2 KD HEK293T cells transiently expressing GFP-Rab8, were treated with Torin1 or Torin1 + Bafilomycin A1 for 0 or 4 h, Quantification of cleavage GFP is shown in F (n = 3 experimental replicates). Data are shown as means ± SEM and analyzed with one-way ANOVA. ***P < 0.001. (G and H) GFP::Tev::2×flag::RAB-8 C. elegans strains were treated with lrk-1 RNAi were maintained on nematode growth medium plates without E. coli OP50 for 4 h. Quantified in H. Data are shown as mean ± SEM and analyzed with one-way ANOVA. ***P < 0.001. (I and J) GFP::Tev::2×flag::RAB-8 C. elegans strains were overexpression of LRRK2 WT or the gain-of-function mutant LRRK2 G2019S, maintained on nematode growth medium plates without E. coli OP50 for 4 h. Quantified in J, data are shown as mean ± SEM and analyzed with one-way ANOVA. ***P < 0.001. (K) A549 cells were treated with PF-06447475 or CCCP for 0, 4, and 6 h. The endogenous Rab8 was measured by western blot. (L and M) LRRK2 KD HEK293T cells were treated with Torin1 or Torin1 and Bafilomycin A1 for 0, 4 h. Quantification of cleavage GFP is shown in M (n = 3 experimental replicates). Data are shown as means ± SEM and analyzed with one-way ANOVA. *P < 0.05, **P < 0.01, ***P < 0.001. (N) HEK293T cells transiently expressing HA-GFP-Rab8, HA-GFP-Rab8 T72A, HA-GFP-Rab8 T72E, and FLAG-NDP52. IP was performed with anti-HA beads, which was followed by western blot for Flag-NDP52. (O and P) HEK293T cells transiently expressing HA-GFP-Rab8, HA-GFP-Rab8 T72A, and HA-GFP-Rab8 T72E were treated with Torin1 or Torin1 and Bafilomycin A1 for 0, 4 h, Quantification of cleavage GFP is shown in P (n = 3 experimental replicates). Data are shown as means ± SEM and analyzed with Student’s t test (two-tailed, unpaired). ***P < 0.001. Molecular weight measurements are in kD. KD, knockdown. Source data are available for this figure: SourceData F9.
RabGGTase, GDI, and LRRK2 are regulators of Rab GTPase as autophagy cues signals. (A and B) RabGGTA KD HEK293T cells transiently expressing GFP-Rab8, were treated with Torin1 or Torin1 + Bafilomycin A1 for 0 or 4 h, Quantification of cleavage GFP is shown in B (n = 3 experimental replicates). Data are shown as means ± SEM and analyzed with one-way ANOVA. ***P < 0.001. (C and D) RabGGTB KD HEK293T cells transiently expressing GFP-Rab8, were treated with Torin1 or Torin1 + Bafilomycin A1 for 0 or 4 h, Quantification of cleavage GFP is shown in D (n = 3 experimental replicates). Data are shown as means ± SEM and analyzed with one-way ANOVA. ***P < 0.001. (E and F) GDI1 KD HEK293T, GDI2 KD HEK293T cells transiently expressing GFP-Rab8, were treated with Torin1 or Torin1 + Bafilomycin A1 for 0 or 4 h, Quantification of cleavage GFP is shown in F (n = 3 experimental replicates). Data are shown as means ± SEM and analyzed with one-way ANOVA. ***P < 0.001. (G and H) GFP::Tev::2×flag::RAB-8 C. elegans strains were treated with lrk-1 RNAi were maintained on nematode growth medium plates without E. coli OP50 for 4 h. Quantified in H. Data are shown as mean ± SEM and analyzed with one-way ANOVA. ***P < 0.001. (I and J) GFP::Tev::2×flag::RAB-8 C. elegans strains were overexpression of LRRK2 WT or the gain-of-function mutant LRRK2 G2019S, maintained on nematode growth medium plates without E. coli OP50 for 4 h. Quantified in J, data are shown as mean ± SEM and analyzed with one-way ANOVA. ***P < 0.001. (K) A549 cells were treated with PF-06447475 or CCCP for 0, 4, and 6 h. The endogenous Rab8 was measured by western blot. (L and M) LRRK2 KD HEK293T cells were treated with Torin1 or Torin1 and Bafilomycin A1 for 0, 4 h. Quantification of cleavage GFP is shown in M (n = 3 experimental replicates). Data are shown as means ± SEM and analyzed with one-way ANOVA. *P < 0.05, **P < 0.01, ***P < 0.001. (N) HEK293T cells transiently expressing HA-GFP-Rab8, HA-GFP-Rab8 T72A, HA-GFP-Rab8 T72E, and FLAG-NDP52. IP was performed with anti-HA beads, which was followed by western blot for Flag-NDP52. (O and P) HEK293T cells transiently expressing HA-GFP-Rab8, HA-GFP-Rab8 T72A, and HA-GFP-Rab8 T72E were treated with Torin1 or Torin1 and Bafilomycin A1 for 0, 4 h, Quantification of cleavage GFP is shown in P (n = 3 experimental replicates). Data are shown as means ± SEM and analyzed with Student’s t test (two-tailed, unpaired). ***P < 0.001. Molecular weight measurements are in kD. KD, knockdown. Source data are available for this figure: SourceData F9.
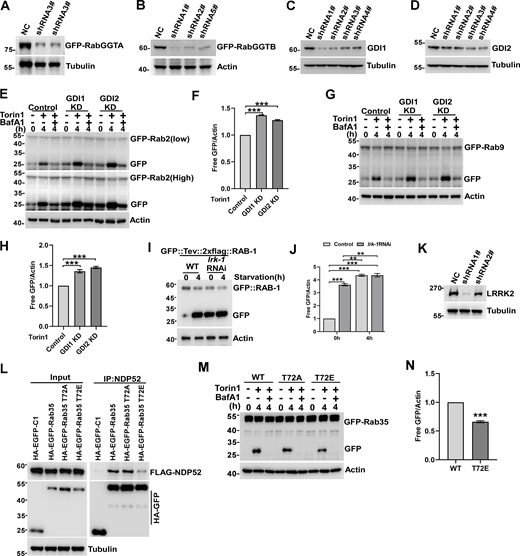
Regulators of Rab GTPase as autophagy cues signals. (A) HEK293T cells transiently expressing GFP-RabGGTA and shRNA of RabGGTA. The whole cell lysates were collected and the levels of GFP-RabGGTA were measured by western blot. (B) HEK293T cells transiently expressing GFP-RabGGTB and shRNA of RabGGTB. The whole cell lysates were collected and the levels of GFP-RabGGTB were measured by western blot. (C) HEK293T cells transiently expressing shRNA of GDI1. The whole cell lysates were collected and the endogenous levels of GDI1 were measured by western blot. (D) HEK293T cells transiently expressing shRNA of GDI2. The whole cell lysates were collected and the endogenous levels of GDI2 were measured by western blot. (E and F) GDI1 KD HEK293T, GDI2 KD HEK293T cells transiently expressing GFP-Rab2 were treated with Torin1 or Torin1 and Bafilomycin A1 for 0 or 4 h, and quantification of cleavage GFP is shown in F. Data are shown as means ± SEM and analyzed with one-way ANOVA. **P < 0.001. (G and H) GDI1 KD HEK293T, GDI2 KD HEK293T cells transiently expressing GFP-Rab9 were treated with Torin1 or Torin1 and Bafilomycin A1 for 0 or 4 h, quantification of cleavage GFP is shown in H. Data are shown as means ± SEM and analyzed with one-way ANOVA. ***P < 0.001. (I and J) GFP::Tev::2×flag::RAB-1 C. elegans strains were treated with lrk-1 RNAi were maintained on nematode growth medium plates without E. coli OP50 for 4 h. Quantified in J, Data are shown as mean ± SEM and analyzed with one-way ANOVA. **P < 0.01, ***P < 0.001. (K) HEK293T cells transiently expressing shRNA of LRRK2. The whole cell lysates were collected and the endogenous levels of LRRK2 were measured by western blot. (L) HEK293T cells transiently expressing HA-GFP-Rab35, HA-GFP-Rab35 T72A, HA-GFP-Rab35 T72E, and FLAG-NDP52. IP was performed with anti-HA beads, which was followed by western blot for FLAG-NDP52. (M and N) HEK293T cells transiently expressing HA-GFP-Rab35, HA-GFP-Rab35 T72A, HA-GFP-Rab35 T72E, were treated with Torin1 or Torin1 and Bafilomycin A1 for 0 or 4 h, Quantification of cleavage GFP is shown in N. Data are shown as means ± SEM and analyzed with Student’s t test (two-tailed, unpaired). ***P < 0.001. Molecular weight measurements are in kD. Source data are available for this figure: SourceData FS6.

Regulators of Rab GTPase as autophagy cues signals. (A) HEK293T cells transiently expressing GFP-RabGGTA and shRNA of RabGGTA. The whole cell lysates were collected and the levels of GFP-RabGGTA were measured by western blot. (B) HEK293T cells transiently expressing GFP-RabGGTB and shRNA of RabGGTB. The whole cell lysates were collected and the levels of GFP-RabGGTB were measured by western blot. (C) HEK293T cells transiently expressing shRNA of GDI1. The whole cell lysates were collected and the endogenous levels of GDI1 were measured by western blot. (D) HEK293T cells transiently expressing shRNA of GDI2. The whole cell lysates were collected and the endogenous levels of GDI2 were measured by western blot. (E and F) GDI1 KD HEK293T, GDI2 KD HEK293T cells transiently expressing GFP-Rab2 were treated with Torin1 or Torin1 and Bafilomycin A1 for 0 or 4 h, and quantification of cleavage GFP is shown in F. Data are shown as means ± SEM and analyzed with one-way ANOVA. **P < 0.001. (G and H) GDI1 KD HEK293T, GDI2 KD HEK293T cells transiently expressing GFP-Rab9 were treated with Torin1 or Torin1 and Bafilomycin A1 for 0 or 4 h, quantification of cleavage GFP is shown in H. Data are shown as means ± SEM and analyzed with one-way ANOVA. ***P < 0.001. (I and J) GFP::Tev::2×flag::RAB-1 C. elegans strains were treated with lrk-1 RNAi were maintained on nematode growth medium plates without E. coli OP50 for 4 h. Quantified in J, Data are shown as mean ± SEM and analyzed with one-way ANOVA. **P < 0.01, ***P < 0.001. (K) HEK293T cells transiently expressing shRNA of LRRK2. The whole cell lysates were collected and the endogenous levels of LRRK2 were measured by western blot. (L) HEK293T cells transiently expressing HA-GFP-Rab35, HA-GFP-Rab35 T72A, HA-GFP-Rab35 T72E, and FLAG-NDP52. IP was performed with anti-HA beads, which was followed by western blot for FLAG-NDP52. (M and N) HEK293T cells transiently expressing HA-GFP-Rab35, HA-GFP-Rab35 T72A, HA-GFP-Rab35 T72E, were treated with Torin1 or Torin1 and Bafilomycin A1 for 0 or 4 h, Quantification of cleavage GFP is shown in N. Data are shown as means ± SEM and analyzed with Student’s t test (two-tailed, unpaired). ***P < 0.001. Molecular weight measurements are in kD. Source data are available for this figure: SourceData FS6.
Discussion
A recent proteomics study identified a group of Rab GTPases as potential autophagy substrates (Zellner et al., 2021). However, the mechanisms underlying their envelopment by autophagosomes remain unclear. We believe that our work provides a timely mechanistic explanation. It remains unknown how Rab GTPases perceive the signals that trigger their translocation to designated autophagy cargoes. Future studies should address whether canonical regulators of Rab GTPases, such as GEF and GAP, are responsible for transducing upstream signals to engage Rab GTPases in the autophagy pathway as autophagy cues signals. Additionally, investigating how selective autophagy processes mediated by Rab GTPases are negatively regulated is essential. One candidate in this perspective is LRRK2. Previous studies have established that LRRK2-mediated phosphorylation of Rab GTPases profoundly affects organelle homeostatic pathways, and overactivation of LRRK2 signaling is tightly linked to neuronal disorders such as Parkinson’s disease (PD) (Eguchi et al., 2018; Härtlova et al., 2018; Jeong et al., 2018; Purlyte et al., 2018; Roosen and Cookson, 2016; Seol et al., 2019; Tolosa et al., 2020; Wauters et al., 2020). Coincidentally, many Rab GTPases have been implicated in the pathogenesis of PD (Gao et al., 2018; Kiral et al., 2018; Shi et al., 2017), yet the underlying mechanisms remain unclear. The identification of LRRK2 as an inhibitor disengaging Rab GTPases as autophagy cues signals in this work may help unravel these puzzles.
The coordination of different types of autophagy cues signals in triggering selective autophagy remains unclear. In the model of PINK1/Parkin-dependent mitophagy, PINK1 and Parkin collaboratively generate poly-ub signals on damaged mitochondria, which are then recognized by mitophagy receptors for autophagic clearance. Recent studies have suggested the importance of PINK1/Parkin-independent mitophagy, although the underlying mechanism remains elusive (Allen et al., 2013; McWilliams et al., 2018; Villa et al., 2017). The identification of Rab GTPases as another type of autophagy cues signal in mitophagy in this work may provide an opportunity to address this question. In our study, we observed that neither PINK1 nor Parkin was required for the relocation of Rab GTPases to depolarized mitochondria. Additionally, the colocalization of these Rab GTPases with mitophagy receptors and LC3 on mitochondria was readily observed in Parkin-deficient U2OS cells. These observations suggest that the signals derived from Rab GTPases may partially compensate for the loss of poly-ub in PINK1/Parkin-deficient cells to ensure mitophagy. Indeed, the mitochondrial accumulation of Rab GTPases in PINK1 KO cells was significantly increased compared with that in wild-type cells (Fig. S3, F and G; and Fig. S4 J). In this study, we propose a cooperative model in which different types of autophagy cues signals work together to trigger selective autophagy initiation.
Further investigation is needed to elucidate whether similar mechanisms are utilized in other organelle-phagy pathways. Equally important is the question of whether the redistribution and degradation of Rab GTPases impact other trafficking pathways, such as secretion and endocytosis, in which Rab GTPases typically play crucial roles. Specifically, it is essential to understand how Rab GTPases avoid being eliminated when they are involved in non-autophagy pathways. One possibility is that Rab GTPases become engaged with other interactors, thus preventing their binding to selective autophagy receptors. Alternatively, both Rab GTPases and receptors may undergo posttranslational modifications mediated by upstream signaling molecules, such as LRRK2, TBK1, AMPK, or mTOR, under different cellular conditions. These modifications could modulate the interaction between these molecules, either enhancing or inhibiting their association. Further exploration of these possibilities will provide valuable insights into the regulation of selective autophagy and its coordination with other cellular processes.
While we propose that Rab GTPases are degraded via autophagy as autophagy cues signals, an alternative possibility is that these Rab GTPases may function similarly to LC3 family molecules. LC3 proteins can reside on both the inner and outer leaflets of autophagosomal membranes (Gatica et al., 2018; Khaminets et al., 2016). The current model for selective autophagy suggests that receptors bind to cargoes and lipidated Atg8/LC3-family proteins on the inner leaflet of autophagosomal membranes. However, this model does not fully explain how cargoes are initially recognized before LC3 lipidation, which is both a hallmark and a requirement for autophagosomal membrane expansion. Indeed, the recruitment of early autophagy proteins to cargoes, such as depolarized mitochondria or bacteria-containing vacuoles, occurs independently of LC3 lipidation (Fujita et al., 2013; Itakura et al., 2012; Lazarou et al., 2015; Ravenhill et al., 2019; Turco et al., 2019; Vargas et al., 2019). During PINK1/Parkin-mediated mitophagy, LC3/GABARAP proteins are not essential for autophagosome formation, and mitochondria are still selectively sequestered by autophagosomes even in the absence of LC3/GABARAPs (Martens, 2016; Nguyen et al., 2016; Vargas et al., 2019). Blocking LC3/GABARAP lipidation slows down isolation membrane elongation and closure but does not abolish autophagosome formation (Tsuboyama et al., 2016). These findings suggest that receptors may function with other early autophagy protein machineries for directional autophagosome biosynthesis. Therefore, it is conceivable that Rab GTPases located inside the autophagosome membrane could substitute for LC3 family proteins to interact with autophagy cues signal-independent selective autophagy receptors (e.g., FAM134B for ER-phagy), which can directly anchor the cargoes as transmembrane proteins. However, further investigation is required to explore this hypothesis in detail.
Materials and methods
Cell culture
U2OS, HEK293T, HeLa, HEK293, ATG7 KO U2OS, ATG7 KO HeLa, ATG7 KO HEK293, ATG9 KO HeLa, FIP200 KO HeLa, Rab2 KO U2OS, Rab8A KO HeLa, Rab8A KO U2OS, PINK1 KO HeLa, PINK1 KO HEK293, Penta KO HeLa, and NDP52 KO HeLa were cultured in DMEM supplemented with 10% FBS, 2 mM L-glutamine, 1% penicillin–streptomycin in a humidified incubator at 37°C with 5% CO2.
Antibodies and reagents
Anti-p62/SQSTM1 (PM045; MBL), anti-p62/SQSTM1 (18420-1-AP; Proteintech), anti-TOMM20 (D8T4N; CST), anti-MTCO2 (55070-1-AP; Proteintech), anti-TOMM20 (sc-17764; Santa Cruz Biotechnology), anti-PINK1 (D8G3; CST), anti-Rab1a (11671-1-AP; Proteintech), anti-Rab2 (D122959-0200; BBI Life Sciences), anti-RAB2 (15420-1-AP; Proteintech), anti-Rab5 (A1180; ABclonal), anti-Rab8A (D22D8; CST), anti-Rab9 (A7041; ABclonal), anti-Rab14 (sc-271401; Santa Cruz Biotechnology), anti-Rab18 (A2812; ABclonal), anti-Rab21 (sc-81917; Santa Cruz Biotechnology), anti-Rab24 (ab154824; Abcam), anti-Rab27 (D7Z9Q; CST), anti-Rab34 (sc-376710; Santa Cruz Biotechnology), anti-NDP52 (ab151256; Abcam), anti-HSP60 (EM00704; HuaBio), anti-Tubulin (11224-1-AP; Proteintech), anti-β-actin (M1210-2; HuaBio), anti-LC3 (PM036; MBL), anti-HA-Tag-HRP (M180-7; MBL), anti-Flag-Tag-HRP (M185-7; MBL), anti-GFP (M048-3; Santa Cruz Biotechnology), anti-MYC (sc-4084; Santa Cruz Biotechnology), anti-ATG9A (PD042; MBL), anti-FLAG (AE004; ABclonal), anti-FLAG (F1804; Sigma-Aldrich), anti-ATG7 (ab52472; Abcam), anti-Pgk1 (17811-1-AP; Proteintech), anti-GDI1 (A5462; ABclonal), anti-GDI2 (A8615; ABclonal), anti-LRRK2 (A22759; ABclonal), Cathepsin D (A13292; ABclonal), anti-GAPDH (60004-1-1g; Proteintech), Lamin B1(12987-1-AP; Proteintech), CKAP4 (CLIMP63,16686-1-AP; Proteintech), GM130 (11308-1-AP; Proteintech), VAMP8 (ab76021; Abcam), Alexa Fluor 405 (A31556; Thermo Fisher Scientific), Alexa Fluor 405 (A81553; Thermo Fisher Scientific), Alexa Fluor 488 (A11008; Thermo Fisher Scientific), Alexa Fluor 488 (A11001; Thermo Fisher Scientific), Alexa Fluor 633 (A21050; Thermo Fisher Scientific), Alexa Fluor 546 (A11003; Thermo Fisher Scientific), and Alexa Fluor 546 (A11010; Thermo Fisher Scientific). HRP-conjugated secondary antibodies were purchased from Invitrogen.
Torin1 (S2827) and Bafilomycin A1 (BafA1, S1413) were purchased from Selleck Chemicals. Nocodazole (M1404) and puromycin (P7255) were purchased from Sigma-Aldrich. Lipofectamine 2000 (11668019), Earle’s basic salt solution (1816327), Mito Tracker Red (M7512), LysoTracker Blue DND-22 (L7525), and restriction enzymes were purchased from Thermo Fisher Scientific. Anti-Flag Affinity Gel (B23102) and anti-HA Affinity Gel (B26202) were purchased from Bimake. GST agarose (PC014) was purchased from Probegene. Phosphatase Inhibitor Cocktail (100×) (B15001) and protease Inhibitor Cocktail (100×) (B14001) were purchased from Selleck Chemicals. ClonExpress II One Step Cloning Kit (C112-01) and 2 × Phanta Master Mix (P511) were purchased from Vazyme Biotech. CCCP (C6700) and mitochondrial extraction kit (SM0020) were purchased from Solarbio. GTP-γ-S (ab146662) and Paraquat (856177) were purchased from Sigma-Aldrich. All antibodies and reagents used in this study are listed in Table S1.
C. elegans strains and culture
C. elegans strains were maintained on nematode growth medium (NGM) plates seeded with Escherichia coli OP50 at 20°C. GFP::2 × flag::RAB (1, 2 etc.) knock-in worms were crossed with autophagy defective mutant strain epg-5 (tm3425) or atg-3 (bp412). Homozygous mutations were isolated using either PCR-based genotyping (for deletion mutation) or Sanger sequencing (for point mutation). The single copy transgene zjuSi374 (Pcol-19-mRFP-GFP::human FIS1) was generated by following a CRISPR/Cas9-based protocol as described previously (Xu et al., 2016). This transgene was inserted into the ttTi4348 genome locus on Chromosome I (Frøkjær-Jensen et al., 2012).
C. elegans fasting treatment
Approximately 40 1-day-old adult worms were transferred into a 6-cm NGM plate seeded with OP50 (Brenner, 1974). Worms were divided into control and fasting groups. 10 6-cm NGM plates were prepared for each group. After 3 days, the control group worms were collected and washed with M9 buffer three times and then quickly frozen in liquid nitrogen and stored at −80°C. For the fasting group, worms were washed off the OP50-seeded plates and washed for additional four times with M9 buffer. Worms were then transferred into empty NGM plates (without OP50 as food), fasted for the indicated time, and collected as described above.
DNA manipulation and CRIPSR/Cas9-mediated genome editing
To generate a repair template to insert GFP::Tev::2xflag::degron sequence into the endogenous loci of RAB GTPases coding genes, the GFP coding sequence was amplified from pMLS252. Notably, a floxed unc-119(+) expressing cassette was embedded in one of the introns of gfp, which serves as a positive selection marker for CRISPR/Cas9-mediated knock-in (Schwartz and Jorgensen, 2016). Backbone pSM delta plasmid was digested with AscI and SpeI. Then, these three fragments were ligated together using the Gibson assembly method (Gibson et al., 2009). Next, ∼600 bp homology arms for each RAB GTPase gfp knock-in and gfp::Tev::2xflag::degron sequence were amplified using PCR from N2 genomic DNA and the above-mentioned plasmid, respectively. AscI and SpeI digested pSM delta plasmid was used as the backbone, and the four fragments were ligated using the Gibson assembly protocol. Notably, silent mutations were introduced into the repair template DNA to avoid cutting by the Cas9 endonuclease.
To generate plasmid DNA to express sgRNA of the gene of interest, a PCR-based quick-change protocol was used. Briefly, PP61[pU6 (GB)-spacer for LacO-sgRNA E+F scaffold] was used as the PCR template (Chen et al., 2013; Ward, 2015). A reverse primer with 5′ phosphate was added, and a forward primer with the target sequence and part of the sgRNA scaffold were used to amplify the entire sgRNA template plasmid. The template DNA used in the PCR reaction was as low as 0.25 ng/µl. 2 µl PCR product was used for ligation by the T4 DNA ligase. The ligation product was transformed into competent cells and correct sgRNA plasmids were identified via Sanger sequencing.
To insert GFP::Tev::2xflag::degron sequence into the N-terminus of the endogenous loci of RAB GTPase coding genes, repair template plasmid (50 ng/µl), Peft-3::cas9 (50 ng/µl) (Dickinson et al., 2013), one to three independent sgRNAs (40 ng/µl for each), and negative selection marker Pmyo-2::mCherry (2 ng/µl), Pmyo-3::mCherry (5 ng/µl), and Podr-1::rfp (30 ng/µl) were mixed and injected into unc-119(ed4) worms at the young adult stage. Potential knock-in worms were selected by normal movement and without any negative selection marker expression. The insertion sequence was amplified by PCR and confirmed without any extra mutation by the Sanger sequence. C. elegans strains, plasmids, and primers used in this study are shown in Tables S2, S3, and S4, respectively.
Yeast strains and growth conditions
Yeast cells were grown at 30°C in synthetic medium (SD: 0.17% yeast nitrogen base without amino acids and ammonium sulfate, 0.5% ammonium sulfate, 2% glucose, and corresponding auxotrophic amino acids and vitamins) or YPD (1% yeast extract, 2% peptone, and 2% glucose). For autophagy induction, the cells were grown to mid-log phase in the corresponding selective medium and then were subjected to starvation at 30°C in nitrogen starvation medium (SD-N: 0.17% yeast nitrogen base without amino acids and ammonium sulfate, 2% glucose) for the indicated time durations (0, 3, 6, 9, 12 h). Yeast strains used in this study are shown in Table S5.
ShRNA knockdown
Rab-annealed oligonucleotides were cloned into pLV3-shRNA-Puro using BamHI and EcoRI cloning sites, and annealed oligonucleotides were cloned into pLKO-shRNA-Puro using AgeI and EcoRI cloning sites. The target sequences are respectively as follows: Rab8 shRNA1 (5′-CTCGATGGCAAGAGAATTAAA-3′), Rab8 shRNA3 (5′-CGAGAAGTCCTTCGACAACAT-3′), GDI1 shRNA1 (5′-CCCATATTTATACCCGCTCTA-3′), GDI1 shRNA2 (5′-CGCCAACTCCTGCCAAATAAT-3′), GDI2 shRNA3 (5′-CGCAAGAAGAATGACATCTAT-3′), GDI2 shRNA4 (5′-CCCAAGTTCCTTATGGCTAAT-3′), LRRK2 shRNA1 (5′-CCACAAATTCAACGGAAAGAA-3′), RabGGTA shRNA3 (5′-GTCCAGAAAGAATGCGTGCTT-3′), RabGGTB shRNA1 (5′-GCACAGGATTTCTGGCTATTA-3′), RabGGTB shRNA3 (5′-GCCAACATGAATGTGGTGGAA-3′), RabGGTB shRNA5 (5′-CCGGAGAAGTTACCAGATGTA-3′), and LRRK2 shRNA1 (5′-CCACAAATTCAACGGAAAGAA-3′). Scrambled shRNA knockdown HEK293T cells were obtained by lentivirus infection and selected with 1 µg/ml of puromycin. Recombinant lentiviruses were produced following the lentiviral packaging protocol.
Rab8A KO cells
PX330-cas9-Rab8A sgRNA vector was constructed with a target sequence 5′-CAGCTTGAACAGGTAATCGT-3′. U2OS and HeLa cells were seeded in a 6-well plate with 40% confluency 1 day before transfection. Cells were transfected with 2 µg PX330-cas9-Rab8A sgRNA vector by Lipofectamine 2000. 24 h later, the regular medium was replaced with a medium containing 1 µg/ml puromycin. After a 2-day incubation, cells were seeded into 96-well plates by flow cytometry. WB was performed to screen single-cell clones with anti-Rab8A antibody.
Immunoprecipitation and western blot
Cell for protein analysis was homogenized in TAP buffer (20 mM Tris-HCl, pH 7.4, 150 mM NaCl, 0.5% NP-40, 1 mM NaF, 1 mM Na3VO4, 1 mM EDTA, 10 nM MG132, Protease cocktail, and Phosphatase cocktail inhibitors) and incubated on ice for 30 min. The cell lysate was cleared by centrifugation at 14,000 rpm for 15 min. The supernatant was incubated with antibody-conjugated beads and rotated for 4 h at 4°C. After incubation, the beads were washed three times with TAP buffer and eluted with 1 × SDS loading buffer. Samples were separated with SDS-PAGE, transferred to polyvinylidene fluoride membrane, and probed with the corresponding antibody.
For immunoprecipitation in C. elegans, we performed immunoprecipitation and western blot as previously described with some modifications (Allen et al., 2013). Briefly, the worms from the control and experimental groups were collected separately, washed with 3 ml M9 buffer three times, packed by centrifugation, and quickly frozen in liquid nitrogen. The animals were solubilized in 150 µl TAP lysis buffer. The mixture was lysed using a homogenizer for 5 min on ice. Worm lysates were then cleared by centrifugation at 14,000 × g for 10 min at 4°C. Equal amounts of total protein were used for experimental and control groups, and western blot was performed following standard procedures.
Yeast was collected, 100 µl of 0.2 M NaOH was added to each sample, 30°C for 15 min, and centrifuged at 13,300 rpm for 1 min at room temperature, 2 × SDS loading buffer was added, boiled at 95°C for 5 min, and analyzed by western blot.
Immunopurification of lysosomes (LysoIP)
LysoIP was performed largely as previously described with a few modifications (Abu-Remaileh et al., 2017). Briefly, ∼35 million cells in 15-cm plates were used for each replicate. Cells were rinsed twice with prechilled KPBS (136 mM KCl, 10 mM KH2PO4, pH = 7.25 was adjusted with KOH) and then scraped in 1 ml of KPBS containing protease and phosphatase inhibitors and pelleted at 1,000 × g for 2 min at 4°C. Cells were then resuspended in 950 μl of the same buffer, and 25 µl (equivalent to 2.5% of the total number cells) was reserved for further processing to generate the whole-cell sample. The remaining cells were gently homogenized with 30 strokes of a 2-ml dounce-type homogenizer. The homogenate was then centrifuged at 1,000 × g for 2 min at 4°C to pellet the cell debris and intact cells while cellular organelles including lysosomes remained in the supernatant, which was incubated with 150 µl of anti-HA beads prewashed with KPBS on a rotator shaker for 1 h.
Immunoprecipitates were then gently washed three times with KPBS. Beads with bound lysosomes were resuspended and divided into three fractions (control, Torin1 + BafA1, and Torin1 + BafA1 + proteinase K [50 µg/ml]) 50 µl per fraction. The reactions were performed on ice for 15 min and stopped by 2 × SDS loading buffer. The samples were immediately heated at 100°C for 10 min, and immunoblot was performed with the indicated antibodies.
In vitro GTP/GDP loading and binding assay
GST-HA-GFP-Rab (8, 9, 35) was bound to a Glutathione Sepharose 4 Fast Flow column (GE Healthcare Life Sciences) for 2 h at 4°C. The beads were washed three times with nucleotide depletion buffer (20 mM Tris pH 7.5, 1 mM DTT, 20 mM EDTA, 50 mM NaCl, 5% glycerol, and 0.1% Triton X-100) and incubated for 20 min at room temperature to deplete the GTPases of GDP and GTP. To load GST-HA-Rab (8, 9, 35) with GDP or GTP, aliquots were washed three times with GDP loading buffer: 20 mM Tris, 1 mM DTT, 10 mM MgCl2, 50 mM NaCl, 5% glycerol, 0.1% Triton X-100, 20 µM GDP (Rab9),100 µM GDP (Rab8, 35), or GTP loading buffer (20 mM Tris, 1 mM DTT, 10 mM MgCl2, 50 mM NaCl, 5% glycerol, 0.1% Triton X-100, 20 µM GTP [Rab8, 35], and 100 µM GDP [Rab9]) and incubated for 25 min at room temperature. The beads were incubated with FLAG-NDP52 protein for 2 h at 4°C. Beads were washed three times with lysis buffer and analyzed by immunoblotting.
Immunofluorescence
Cells grown on coverslips were transfected with different plasmids and then fixed in 4% paraformaldehyde in PBS for 20 min at room temperature and permeabilized with 0.1% Triton X-100 in PBS for 20 min. Cells were treated with block buffer (5% BSA, 0.1% Triton X-100 in PBS) for 1 h at room temperature. Cells were incubated with primary antibodies diluted in block buffer overnight at 4°C. Cells were washed three times with PBS, each for 10 min, followed by incubation with Alexa Fluor-conjugated secondary antibody diluted in block buffer for 1 h at room temperature. Slides were examined by using a laser scanning confocal microscope (LSM 800; Zeiss).
Recombinant protein expression and purification
Wild-type HA-GFP-Rab (2, 8, 9, 14, 19, and 35) were cloned into pGEX6P-1 and expressed as glutathione-S-transferase (GST) fusion proteins with a TEV protease cleavage site in between. Wild-type NDP52 was cloned into pGEX6P-1 and expressed as GST fusion proteins. NDP52 mutants were generated by site-directed mutagenesis based on pGEX6P-1-FLAG-NDP52 WT. GST fusion proteins were expressed in E. coli Rosetta (DE3) at 16°C to achieve maximal soluble expression. Cells were collected by centrifugation and washed three times with cold PBS. The cells were lysed by sonication in lysis buffer (20 mM Tris-HCl, pH 7.5, 500 mM NaCl, 1 mM EDTA, 0.5% Triton X-100, and protease inhibitor cocktail from Roche) and centrifuged at 12,000 × g for 15 min. 0.3 ml GST-Sepharose resin pre-equilibrated with 20 ml TEV protease cleavage buffer (10 mM Tris-HCl, pH 8.0; 150 mM NaCl; 0.1% NP-40; and 1 mM DTT) was added to the supernatant and rotated at 4°C for 2 h. Next, the beads were washed three times with TEV protease cleavage buffer, and then the recombinant protein was eluted from the resin by incubating at 4°C overnight with 10 µg/ml of TEV protease to cleave off the desired protein from the GST tag, which was still bound to the GST-Sepharose resin after the overnight cleavage reaction. Purified untagged recombinant proteins were further fractionated using a Mono-Q column, followed by dialysis against PBS. Proteins were quantified by the Bradford method and analyzed by SDS–PAGE and Coomassie-blue staining.
Pull-down assay
The purified GST fusion proteins (GST-FLAG-NDP52 and GST-FLAG-NDP52 mutant) and HA-GFP-Rab (2, 8, 9, 14, 19, and 35) were prepared with TAP buffer in a 300 µl system and then slowly shaken at 4°C, incubated for 3 h, and then centrifuged 800 rpm for 3 min at 4°C. The supernatant was discarded and the GST-sepharose resin beads were re-hung and cleaned three times with 1 ml TAP buffer. After adding 1× SDS loading buffer and boiling the sample at 100°C for 10 min, they were analyzed by western blot.
GFP-cleavage assay
HEK293T, HEK293, and ATG7 KO HEK293 cells were transiently cotransfected with 1.5 µg HA-GFP-Rab or HA-GFP-Rab-C-terminal CaaX motif mutants. Cell lysates were immunoblotted with antibodies against GFP and β-actin.
Mitochondrial isolation and purification
HeLa, Penta KO HeLa, and PINK1 KO HeLa cells were transiently cotransfected with 10 µg HA-GFP-Rab. CCCP treatment was carried out after 24 h transfection. After treatment with 10 µM/ml CCCP for 0, 2, and 4 h or 10 µM/ml CCCP and Bafilomycin A1 for 2 h, cells were digested with trypsin, collected in a 15 ml centrifuge tube, washed with 1 × PBS, transferred to a 1.5 ml-EP tube, and centrifuged at 4°C for 800 × g for 5 min. The supernatant was discarded. 1 ml ice lysis buffer (add 100 × protease inhibitor and 5,000 × MG132) was added to resuscitate the cells, 80 µl was taken into the new EP tube, 20 µl of 5 × SDS loading Buffer was added, and boiled at 100°C for 10 min. The remaining cell suspension was transferred to a 2-ml glass homogenizer and ground in an ice bath 45 times. The homogenate was transferred to a new EP tube and centrifuged at 4°C for 1,000 × g for 5 min. The supernatant was removed, transferred to a new EP tube, and centrifuged again at 4°C for 1,000 × g for 5 min. The supernatant was taken and transferred to the new EP tube and centrifuged for 12,000 × g for 10 min at 4°C. Subsequently, 80 µl supernatant was aliquoted into the new EP tube and mixed with 5 × SDS loading buffer. The remaining supernatant was discarded. The mitochondria pellet was resuspended in 0.5 ml of Wash Buffer (containing 100 × protease inhibitor and 5,000 × MG132), followed by centrifugation at 1,000 × g for 5 min at 4°C. Then the supernatant was taken and transferred to the new EP tube and centrifuged at 4°C for 12,000 × g for 10 min. The supernatant was discarded, and the high purity mitochondria were deposited at the bottom of the tube. 100 µl of 1 × SDS loading buffer was added, the sample was boiled at 100°C for 10 min, and was analyzed by western blot.
Immuno-EM
PINK1 KO HEK293 cells were transiently transfected with 15 µg HA-GFP-Rab8. CCCP, DMSO, and Bafilomycin A1 treatment were carried out after 24 h transfection. CCCP (10 µM), DMSO or CCCP (10 µM), and Bafilomycin A1 (10 nM) were respectively treated for 4 h, fixed with immuno-EM fixing buffer (4% paraformaldehyde and 0.1% glutaraldehyde in 0.1 M PB) overnight at 4°C. The fixed cells were washed three times with 0.1 M PB and terminated with 50 mM glycine, then followed by permeabilization for 40 min with 0.1% saponin and 5% fetal bovine serum in 1 × PBS. Cells were incubated with anti-GFP antibody (ab6556, 1:500; abcam) overnight at 4°C, followed by nanogold-labeled Fab’ goat anti-mouse IgG(H+L) antibody (34C918, 1:50; Nanoprobes) overnight at 4°C. Cells were silver enhanced for 2 min and then fixed with 1% aqueous osmium tetraoxide for 40 min. Cells were dyed with 2% uranyl acetate for 40 min and dehydrated through graded alcohols (50–100%) and 100% acetone twice each for 15–20 min. Samples were embedded in EPON 812 resin. Ultrathin (90 nm) sections were obtained by an ultrathin slicer machine. Electron microscopy images of the samples were taken using Tecnai G2 Spirit 120V freezing transmission electron microscope (Thermo FEI Company).
Bacterial infection assay
RFP-expressing Salmonella typhimurium was grown overnight in LB at 37°C and diluted 20-fold in LB containing 0.2 M NaCl, and sub-cultured at 37°C for 3 h before use. Cells were incubated for 1 h with Salmonella in fresh medium without any antibiotics at an MOI of 1:100; wash three times with medium with 100 µg/ml gentamicin for 1 h to kill extracellular bacteria, and medium with 25 µg/ml gentamycin was added to avoid cycles of reinfection. The infection time for each Rab experimental group ranged from 0 to 60 min.
Bacterial invasion and viability assay
HeLa, ATG7 KO HeLa, NDP52 KO HeLa cells were infected with S. typhimurium carrying an RFP in triplicate wells of 24-well plate. After 1 h, cells were treated with gentamicin for 1 or 7 h. Cells were lysed in PBS buffer containing 0.1% Triton X-100, and serial dilutions of lysates were plated on LB agar plates. Bacterial invasion efficiency was determined as the ratio of intracellular live S. typhimurium recovered at 2 h to total intracellular and adherent S. typhimurium recovered at 1 h. Surviving bacteria were quantified as the ratio of bacteria recovered at 8 h to those recovered at 2 h.
Flow cytometry analysis of lipophagy flux
Flow cytometry analysis of lipophagy flux was performed according to the previously reported protocol (Pu et al., 2023). Briefly, analysis of lipophagy flux was using a CytoFLEX LX Flow Cytometer (Beckman) and subsequent analysis was performed using the FlowJo software. To prevent GFP quenching, the intensities of GFP and mCherry signal of WT cells expressing mCherry-GFP-livedrop treated with CQ for 12 h at fed conditions were used as a reference to define the gate for zero lipophagy. The measurement of lipophagy flux was based on the shift of cell population into the lipophagy positive gate (mCherry signal > GFP signal). An average of 10,000 cells were analyzed under each condition.
Live-cell imaging
Cells grown on a glass bottom culture dish (SAINING, 1051000) were transfected with different plasmids. After transfection for 24 h, cells were incubated with mitochondrial dye (PK Mito Orange, PKMO-2; Genvivo) for 30 min at 37°C. After washing cells two to three times with warm culture medium, the culture dish was mounted on the microscope (NanoInsights, Multi-SIM) to maintain incubation conditions at 37°C and 5% CO2. Images or videos were recorded using a confocal laser microscope system, and then further processed and analyzed using ImageJ.
Quantification and statistical analysis
All the images were analyzed using Zeiss Zen Blue imaging analysis software and ImageJ (https://imagej.nih.gov/ij/). Statistical analyses were performed using GraphPad Prism (GraphPad Software 8.0.2). Student’s t test (two-tailed, unpaired) was performed for comparisons between the two groups. For multiple comparisons, one-way ANOVA followed by Tukey’s post-hoc test was performed. Data are presented as mean ± SEM of at least three independent experiments, unless otherwise noted. Data distribution was assumed to be normal, but this was not formally tested. The levels of statistical significance are indicated by asterisks. P value <0.05 was considered statistically significant.
Online supplemental material
Fig. S1 shows that a set of Rab GTPases is degraded via macroautophagy, related to Fig. 2. Fig. S2 shows identification of binary interactions between Rab GTPases and receptors, related to Fig. 4. Fig. S3 shows the colocalization of Rab GTPases and endogenous TOMM20 with different treatment conditions, related to Fig. 5. Fig. S4 shows that knockout or knockdown of Rab GTPase impaired mitophagy, related to Fig. 6. Fig. S5 shows Rab GTPases colocalize with LC3 or mitophagy receptors around damaged mitochondria under CCCP-treated conditions, related to Fig. 6. Fig. S6 shows regulators of Rab GTPase as autophagy cues signals, related to Fig. 9. Video 1 and Video 2 show Rab8 is recruited to damaged mitochondria upon mitophagy induction, related to Fig. 5. Video 3 shows the recruitment of Rab8 to fragmented mitochondria precedes the recruitment of the receptor NDP52, related to Fig. 6. Table S1 lists reagents and resources used in this study. Table S2 lists C. elegans strains used in this study. Table S3 lists DNA manipulation and CRIPSR/Cas9-mediated genome editing plasmids in C. elegans used in this study. Table S4 lists DNA manipulation and CRIPSR/Cas9-mediated genome editing primers in C. elegans used in this study. Table S5 lists the yeast strains used in this work.
Data availability
Further information and requests for reagents may be directed to and will be fulfilled by the Lead Contact, Q. Sun (qmsun@zju.).
Acknowledgments
We sincerely appreciate Prof. Li Yu from Tsinghua University for his advice. We are grateful to Prof. Michael Lazarou from Monash University; Prof. Hong Zhang from the Institute of Biophysics, Chinese Academy of Sciences; Prof. Feng Shao from the National Institute of Biological Sciences, Beijing; Prof. Quan Chen from Nankai University; Prof. Liang Ge from Tsinghua University; Prof. Jieqiong Tan Central South University; Prof. Hanming Shen from The University of Macau for their generous offers of reagents. We thank Qin Han and Chenyu Yang from the Center of Cryo-Electron Microscopy Zhejiang University for their technical support.
This study was supported by the National Natural Science Foundation of China under grants 92254307 and 32025012 to Q. Sun, and 31970919 to W. Zou 31900530 to P. Zhao; and by the Ministry of Science and Technology of the People’s Republic of China under grant 2024YFA1803003 (to Q. Sun).
Author contributions: P. Zhao: Conceptualization, Data curation, Formal analysis, Funding acquisition, Investigation, Methodology, Project administration, Resources, Software, Supervision, Validation, Visualization, Writing - original draft, R. Tian: Data curation, Formal analysis, Investigation, Resources, Software, D. Song: Data curation, Formal analysis, Resources, Software, Q. Zhu: Data curation, Formal analysis, X. Ding: Conceptualization, Data curation, Formal analysis, Investigation, Methodology, Resources, J. Zhang: Methodology, Resources, B. Cao: Investigation, Methodology, Resources, M. Zhang: Resources, Software, Y. Xu: Software, J. Fang: Investigation, Methodology, Resources, Validation, Visualization, J. Tan: Resources, C. Yi: Data curation, Resources, Supervision, H. Xia: Writing - original draft, W. Liu: Supervision, Writing - review & editing, W. Zou: Conceptualization, Funding acquisition, Project administration, Resources, Supervision, Writing - original draft, Writing - review & editing, Q. Sun: Conceptualization, Funding acquisition, Project administration, Supervision, Writing - original draft, Writing - review & editing.

