


TBC1D20 deficiency causes Warburg Micro Syndrome in humans, characterized by multiple eye abnormalities, severe intellectual disability, and abnormal sexual development, but the molecular mechanisms remain unknown. Here, we identify TBC1D20 as a novel Rab11 GTPase-activating protein that coordinates vesicle transport and actin remodeling to regulate ciliogenesis. Depletion of TBC1D20 promotes Rab11 vesicle accumulation and actin deconstruction around the centrosome, facilitating the initiation of ciliogenesis even in cycling cells. Further investigations reveal enhanced Rab11–MICAL1 interaction upon TBC1D20 loss, activating the monooxygenase domain of MICAL1 and inducing F-actin depolymerization around the centrosome. This actin network reorganization facilitates vesicle trafficking and docking, ultimately promoting ciliogenesis. In summary, our work uncovers a coordinated ciliogenesis initiation mechanism via Rab11 activation. These findings underscore a pivotal role for TBC1D20 in early ciliogenesis, advancing our understanding of its spatiotemporal regulation and offering insights into the disease pathogenesis associated with TBC1D20 mutations.
Introduction
Warburg Micro Syndrome (WARBM) is a rare autosomal recessive disorder characterized by severe intellectual disability, microcephaly, cataracts, and various other abnormalities, first described by Warburg in 1993 (Dursun et al., 2012; Warburg et al., 1993). The underlying cause of WARBM is linked to mutations in Rab GTPases, positioning it as a monogenic disorder (Mitra et al., 2011). Mutations resulting in the loss of function of Rab18, Rab3GAP1, Rab3GAP2, or TBC1D20 are known to cause the condition (Aligianis et al., 2005; Bem et al., 2011; Borck et al., 2011; Liegel et al., 2013). TBC1D20 contains a TBC (Tre-2, Bub2, and Cdc16) domain and functions as a GAP for Rab proteins, enhancing the hydrolysis of GTP. A screening of 77 families diagnosed with WARBM identified five homozygous mutations in TBC1D20, leading to its functional loss. Patients with TBC1D20 mutations commonly present with congenital cataracts, microphthalmia, glaucoma, postnatal microcephaly, micropenis, cryptorchidism, and other facial abnormalities. These features overlap with those seen in ciliopathies, a group of disorders caused by defects in cilia formation or function. The phenotypic similarities between WARBM and ciliopathies prompted us to investigate the role of TBC1D20 in ciliogenesis.
The primary cilium is a critical cellular structure that serves as a signaling hub for numerous pathways, essential for maintaining cellular homeostasis (Singla and Reiter, 2006). Ciliogenesis, the process of cilium formation, involves multiple steps, including membrane trafficking, basal body transition, transition zone assembly, and axoneme extension. Proper ciliogenesis is vital for cell signaling, sensory perception, and developmental processes. Disruptions in ciliogenesis or ciliary function lead to ciliopathies, which are characterized by a range of clinical features affecting organs such as the kidneys, heart, eyes, central nervous system, and reproductive system, underscoring the essential role of cilia in human health (Reiter and Leroux, 2017).
A key aspect of ciliogenesis is the transport of proteins and membranes to the basal body, as cilia lack the ability to synthesize the components needed for their growth. This complex process is tightly regulated by various factors, with Rab GTPases playing a central role. Rab GTPases are localized to vesicles and membrane surfaces, regulating critical steps in membrane trafficking, such as vesicle formation, attachment, transport, and fusion, through interactions with SNARE proteins (Homma et al., 2021; Pfeffer, 2017). The activity of Rab GTPases is dynamically controlled by guanine nucleotide exchange factors (GEFs) and GTPase-activating proteins (GAPs), which modulate Rab activation by facilitating GTP binding or hydrolysis (Bos et al., 2007). In the context of ciliogenesis, Rab11–Rab8 emerges as a crucial player. Rab11 interacts with Rabin8, facilitating the transport of pre-ciliary vesicles (PCVs) to the mother centriole and subsequent Rab8 activation for ciliary membrane growth (Lu et al., 2015; Nachury et al., 2007; Westlake et al., 2011). Additionally, FIP3 and Rab11–Rabin8 collaborate to govern PCV transportation (Vetter et al., 2015; Walia et al., 2019).
The actin cytoskeleton also plays a pivotal role in ciliogenesis by facilitating membrane dynamics during cellular processes like vesicle trafficking. Recent studies emphasize the importance of the actin cytoskeleton in both ciliogenesis and the maintenance of ciliary function (Kim et al., 2010, 2015). Interestingly, polymerized and branched F-actin networks have been shown to inhibit ciliogenesis (Drummond et al., 2018; Kim et al., 2010; Pitaval et al., 2017). This multifaceted interplay extends to the dynamics of the actin network during mitosis, where Rab11 vesicles drive the process by recruiting Myosin-Vb and regulating actin network density through the sequestration and clustering of actin nucleators (Holubcova et al., 2013; Wu et al., 2018). Furthermore, Rab11 is known to interact with βPS integrin and modulate the actin cytoskeleton during Drosophila wing morphogenesis (Bhuin and Roy, 2011). Nevertheless, the precise nature of the relationship between Rab11 and the actin network at the centrosome in ciliogenesis remains an area of ongoing investigation, warranting further exploration.
Although both human and mouse TBC1D20 are involved in regulating Rab1 and Rab2, the screening scope was expanded to include Rab1a, Rab1b, and Rab2, but no disease-causing mutations related to the condition were identified. This implies that WARBM caused by TBC1D20 mutations may not be directly associated with the involvement of Rab1 and Rab2 (Liegel et al., 2013). Our research unveiled TBC1D20 as a novel GAP for Rab11, disrupting Rab11 vesicular localization when overexpressed. TBC1D20 depletion leads to Rab11 accumulation at the centrosome, causing F-actin network depolymerization and ciliary vesicle formation in cycling cells. Further examination revealed that Rab11 could interact with MICAL1, activating its N-terminal monooxygenase (MO) domain and inducing F-actin depolymerization, thus promoting ciliogenesis. Overall, this work sheds light on a novel mechanism involving coordinated vesicle trafficking and F-actin remodeling to facilitate ciliogenesis through Rab11 activation. Furthermore, these findings offer insights into the potential pathogenesis of WARBM.
Results
TBC1D20 regulates vesicle trafficking and ciliogenesis
Previous studies have linked TBC1D20 mutations to WARBM, which shares symptoms with ciliopathies, such as blindness, brain edema, limb deformities, and severe intellectual disabilities (Liegel et al., 2013). To investigate TBC1D20’s role in ciliogenesis, we depleted TBC1D20 in RPE1 cells using small interfering RNAs (siRNAs). Cilia formation was assessed using acetylated α-tubulin and Arl13b antibodies. Immunoblotting and immunofluorescence confirmed efficient knockdown of TBC1D20 (Fig. 1 A and Fig. S1 A). TBC1D20 depletion significantly increased the percentage of ciliated cells after 24 h of serum starvation without altering the average cilium length (Fig. 1, B–D). Surprisingly, numerous short cilia were observed in serum-fed, TBC1D20-depleted cells (Fig. 1, E and F), suggesting that TBC1D20 depletion promotes ciliogenesis initiation.
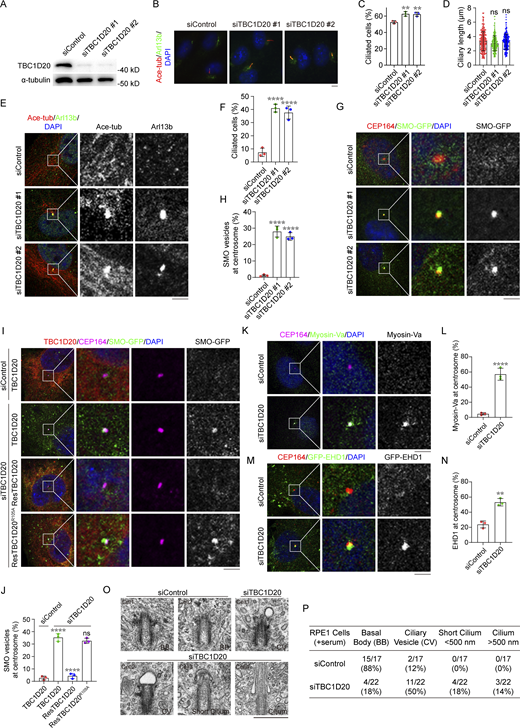
TBC1D20 regulates vesicle transport and ciliogenesis. (A) Immunoblot analysis of TBC1D20 and α-tubulin in 293T cells stably expressing TBC1D20, transfected with control or TBC1D20 siRNAs, and cultured in serum medium for 48 h. (B–D) Immunofluorescence images (B) and quantification of the percentage of ciliated cells (C) and ciliary length (D) for RPE1 cells transfected with control or TBC1D20 siRNAs, cultured in serum-free medium, and stained with antibodies against acetylated α-tubulin and Arl13b. n > 100 cells. (E and F) Immunofluorescence images (E) and quantification of the percentage of cells with short cilium (F) for RPE1 cells transfected with control or TBC1D20 siRNAs, cultured in serum medium, and stained with antibodies against acetylated α-tubulin and Arl13b. n = 3 independent experiments. (G and H) Immunofluorescence images (G) and quantification of the percentage of cells with SMO vesicle at M-centriole (H) for RPE1 SMO-GFP cells transfected with control or TBC1D20 siRNAs, cultured in serum medium, and stained with antibodies against CEP164. n = 3 independent experiments. (I and J) Immunofluorescence images (I) and quantification of the percentage of cells with SMO vesicles at M-centriole (J) for RPE1 SMO-GFP cells stably expressing WT TBC1D20, ResTBC1D20 (siRNA resistant) or ResTBC1D20R105A. n = 3 independent experiments. The cells were transfected with control or TBC1D20 siRNAs, cultured in serum medium, and stained with the antibodies against CEP164 and TBC1D20. (K and L) Immunofluorescence images (K) and quantification of the fluorescence intensity of Myosin-Va at the centrosome (L) for RPE1 cells transfected with control or TBC1D20 siRNAs, cultured in serum medium, and stained with antibody against Myosin-Va. n = 3 independent experiments. (M and N) Immunofluorescence images (M) and quantification of the percentage of cells with EHD1 at the centrosome (N) for GFP-EHD1 RPE1 cells transfected with control or TBC1D20 siRNAs, cultured in serum medium, and stained with antibody against CEP164. n = 3 independent experiments. (O and P) Representative electron micrographs (O) and quantification of basal body (BB) and ciliary structures (P) of RPE1 cell treated with control or siTBC1D20, and cultured in serum medium. Scale bar, 500 nm. All experiments were repeated at least three times. Data are presented as mean ± SEM. **P < 0.01, ****P < 0.0001; ns, not significant. Scale bar, O, 500 nm, others, 5 µm. Source data are available for this figure: SourceData F1.
TBC1D20 regulates vesicle transport and ciliogenesis. (A) Immunoblot analysis of TBC1D20 and α-tubulin in 293T cells stably expressing TBC1D20, transfected with control or TBC1D20 siRNAs, and cultured in serum medium for 48 h. (B–D) Immunofluorescence images (B) and quantification of the percentage of ciliated cells (C) and ciliary length (D) for RPE1 cells transfected with control or TBC1D20 siRNAs, cultured in serum-free medium, and stained with antibodies against acetylated α-tubulin and Arl13b. n > 100 cells. (E and F) Immunofluorescence images (E) and quantification of the percentage of cells with short cilium (F) for RPE1 cells transfected with control or TBC1D20 siRNAs, cultured in serum medium, and stained with antibodies against acetylated α-tubulin and Arl13b. n = 3 independent experiments. (G and H) Immunofluorescence images (G) and quantification of the percentage of cells with SMO vesicle at M-centriole (H) for RPE1 SMO-GFP cells transfected with control or TBC1D20 siRNAs, cultured in serum medium, and stained with antibodies against CEP164. n = 3 independent experiments. (I and J) Immunofluorescence images (I) and quantification of the percentage of cells with SMO vesicles at M-centriole (J) for RPE1 SMO-GFP cells stably expressing WT TBC1D20, ResTBC1D20 (siRNA resistant) or ResTBC1D20R105A. n = 3 independent experiments. The cells were transfected with control or TBC1D20 siRNAs, cultured in serum medium, and stained with the antibodies against CEP164 and TBC1D20. (K and L) Immunofluorescence images (K) and quantification of the fluorescence intensity of Myosin-Va at the centrosome (L) for RPE1 cells transfected with control or TBC1D20 siRNAs, cultured in serum medium, and stained with antibody against Myosin-Va. n = 3 independent experiments. (M and N) Immunofluorescence images (M) and quantification of the percentage of cells with EHD1 at the centrosome (N) for GFP-EHD1 RPE1 cells transfected with control or TBC1D20 siRNAs, cultured in serum medium, and stained with antibody against CEP164. n = 3 independent experiments. (O and P) Representative electron micrographs (O) and quantification of basal body (BB) and ciliary structures (P) of RPE1 cell treated with control or siTBC1D20, and cultured in serum medium. Scale bar, 500 nm. All experiments were repeated at least three times. Data are presented as mean ± SEM. **P < 0.01, ****P < 0.0001; ns, not significant. Scale bar, O, 500 nm, others, 5 µm. Source data are available for this figure: SourceData F1.
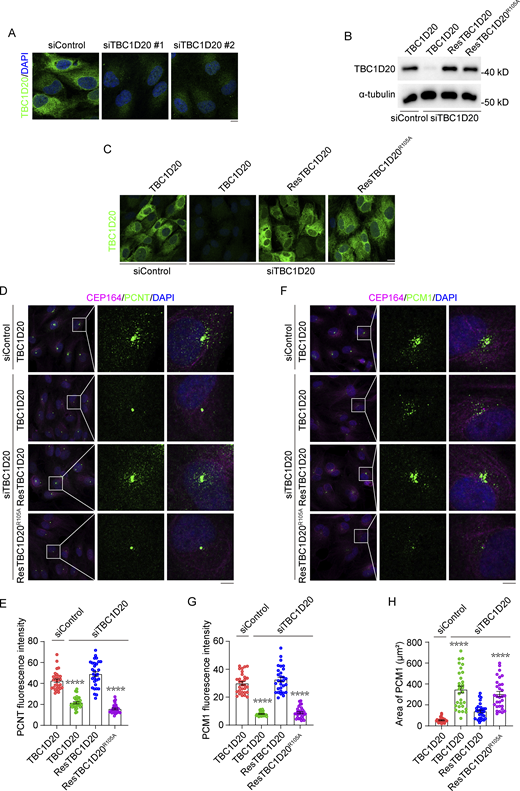
TBC1D20 regulates the localization of ciliary proteins. (A) Immunofluorescence images for RPE1 cells transfected with control or TBC1D20 siRNAs, cultured in serum medium, and stained with the antibody against TBC1D20. (B) Immunoblot analysis of TBC1D20 and α-tubulin in 293T cells stably expressing WT TBC1D20, ResTBC1D20, or ResTBC1D20R105A. The cells were transfected with control or TBC1D20 siRNAs, cultured in serum medium, and stained with the antibody against TBC1D20. (C) Immunofluorescence images for RPE1 cells stably expressing WT TBC1D20, ResTBC1D20, or ResTBC1D20R105A. The cells were transfected with control or TBC1D20 siRNAs, cultured in serum medium, and stained with the antibody against TBC1D20. (D and E) Immunofluorescence images (D) and quantification of the fluorescence intensity of PCNT at the centrosome (E) for RPE1 cells stably expressing WT TBC1D20, ResTBC1D20, ResTBC1D20R105A. The cells were transfected with control or TBC1D20 siRNAs, cultured in serum medium, and stained with the antibodies against PCNT and CEP164. n > 30 cells. (F–H) Immunofluorescence images (F), quantification of the fluorescence intensity of PCM1 at the centrosome (G), and analysis of PCM1 distribution area (H) for RPE1 cells stably expressing WT TBC1D20, ResTBC1D20, or ResTBC1D20R105A. The cells were transfected with control or TBC1D20 siRNAs, cultured in serum medium, and stained with the antibodies against PCM1 and CEP164. n > 30 cells. All experiments were repeated at least three times. Data are presented as mean ± SEM. ****P < 0.0001. Scale bar, 5 μm. Source data are available for this figure: SourceData FS1.
TBC1D20 regulates the localization of ciliary proteins. (A) Immunofluorescence images for RPE1 cells transfected with control or TBC1D20 siRNAs, cultured in serum medium, and stained with the antibody against TBC1D20. (B) Immunoblot analysis of TBC1D20 and α-tubulin in 293T cells stably expressing WT TBC1D20, ResTBC1D20, or ResTBC1D20R105A. The cells were transfected with control or TBC1D20 siRNAs, cultured in serum medium, and stained with the antibody against TBC1D20. (C) Immunofluorescence images for RPE1 cells stably expressing WT TBC1D20, ResTBC1D20, or ResTBC1D20R105A. The cells were transfected with control or TBC1D20 siRNAs, cultured in serum medium, and stained with the antibody against TBC1D20. (D and E) Immunofluorescence images (D) and quantification of the fluorescence intensity of PCNT at the centrosome (E) for RPE1 cells stably expressing WT TBC1D20, ResTBC1D20, ResTBC1D20R105A. The cells were transfected with control or TBC1D20 siRNAs, cultured in serum medium, and stained with the antibodies against PCNT and CEP164. n > 30 cells. (F–H) Immunofluorescence images (F), quantification of the fluorescence intensity of PCM1 at the centrosome (G), and analysis of PCM1 distribution area (H) for RPE1 cells stably expressing WT TBC1D20, ResTBC1D20, or ResTBC1D20R105A. The cells were transfected with control or TBC1D20 siRNAs, cultured in serum medium, and stained with the antibodies against PCM1 and CEP164. n > 30 cells. All experiments were repeated at least three times. Data are presented as mean ± SEM. ****P < 0.0001. Scale bar, 5 μm. Source data are available for this figure: SourceData FS1.
To elucidate how TBC1D20 regulates ciliogenesis, we focused on early ciliogenesis processes, such as pre-ciliary vesicle docking at the mother centriole and conversion of distal appendage vesicles into ciliary vesicles (Lu et al., 2015; Schmidt et al., 2012; Tanos et al., 2013). Remarkably, serum-fed, TBC1D20-depleted cells showed accumulation of smoothened-GFP (SMO-GFP) vesicles at the mother centriole (Fig. 1, G and H). This accumulation was rescued by exogenous expression of siRNA-resistant wild-type (WT) TBC1D20 but not by its catalytically inactive mutant TBC1D20R105A (Fig. 1, I and J; and Fig. S1, B and C). Markers for PCVs Myosin-Va (Wu et al., 2018) and ciliary vesicle formation EHD1 (Lu et al., 2015) also accumulated at the basal body of TBC1D20-depleted cells in serum-fed conditions (Fig. 1, K–N). To further investigate the vesicles congregating at the mother centriole, we performed transmission electron microscopy (TEM) analysis. The results revealed enhanced pre-ciliary vesicle docking and ciliary vesicle formation, with many cells exhibiting short cilia in serum-fed TBC1D20-depleted cells (Fig. 1, O and P). Collectively, these findings suggest that TBC1D20 regulates early ciliogenesis events through its GAP activity, and its depletion facilitates pre-ciliary vesicle docking and ciliary vesicle formation.
TBC1D20 functions in early steps of ciliogenesis and centrosome integrity
To further elucidate TBC1D20’s role in ciliogenesis, we investigated the effect of TBC1D20 depletion on subsequent ciliogenesis steps. The CP110–CEP97 protein complex is known to cap the distal end of the mother centriole and inhibit the extension of the ciliary axoneme. The removal of CP110 from the mother centriole plays a crucial role in initiating ciliogenesis (Spektor et al., 2007; Yadav et al., 2016). In the presence of serum, CP110 localized on both mother and daughter centrioles in control RPE1 cells. Depleting TBC1D20 significantly reduced CP110 localization at the mother centriole in serum-fed cells (Fig. 2, A and B), implicating TBC1D20 in maintaining CP110 in cycling cells. Subsequently, we examined the transition zone assembly and IFT recruitment in TBC1D20 knockdown cells. TBC1D20 depletion also increased the localization of transition zone protein MKS3 (TMEM67) at the mother centriole (Fig. 2, C and D) and promoted IFT88 and IFT140 recruitment to the mother centriole (Fig. 2, E–H). These results indicate that TBC1D20 regulates transition zone assembly and IFT recruitment during early ciliogenesis.

TBC1D20 regulates the localization of ciliary proteins. (A and B) Immunofluorescence images (A) and quantification of the percentage of cells with one CP110 dot (B) for RPE1 cells transfected with control or TBC1D20 siRNAs, cultured in serum medium, and stained with the antibodies against CP110 and γ-tubulin. n = 3 independent experiments. (C and D) Immunofluorescence images (C) and quantification of the percentage of cells with MKS3 at the centrosome (D) for RPE1 cells transfected with control or TBC1D20 siRNAs, cultured in serum medium, and stained with the antibodies against MKS3 and γ-tubulin. n = 3 independent experiments. (E and F) Immunofluorescence images (E) and quantification of the fluorescence intensity of IFT88 at the centrosome (F) for RPE1 cells transfected with control or TBC1D20 siRNAs, cultured in serum medium, and stained with the antibodies against IFT88 and CEP164. n = 3 independent experiments. (G and H) Immunofluorescence images (G) and quantification of the fluorescence intensity of IFT140 at the centrosome (H) for RPE1 cells transfected with control or TBC1D20 siRNAs, cultured in serum medium, and stained with the antibodies against IFT140 and CEP164. n = 3 independent experiments. (I and J) Immunofluorescence images (I) and quantification of the fluorescence intensity of PCNT (J) for RPE1 cells transfected with control or TBC1D20 siRNAs, cultured in serum medium, and stained with antibody against PCNT. Bottom panels depict three-dimensional surface plot of the intensities portrayed in top panels. n > 30 cells. (K–M) Immunofluorescence images (K), the distribution area of PCM1 (L), and the quantification of the fluorescence intensity of PCM1 (M) for RPE1 cells transfected with control or TBC1D20 siRNAs, cultured in serum medium, and stained with antibody against PCM1. Bottom panels depict three-dimensional surface plot of the intensities portrayed in top panels. n > 30 cells. (N and O) Immunofluorescence images of the fluorescence intensity of IFT88 and IFT140 at the centrosome for RPE1 cells transfected with control or TBC1D20 siRNAs, cultured without serum medium, and stained with the antibodies against IFT88 and CEP164. All experiments were repeated at least three times. Data are presented as mean ± SEM. ***P < 0.001, ****P < 0.0001; ns, not significant. Scale bar, 5 µm.
TBC1D20 regulates the localization of ciliary proteins. (A and B) Immunofluorescence images (A) and quantification of the percentage of cells with one CP110 dot (B) for RPE1 cells transfected with control or TBC1D20 siRNAs, cultured in serum medium, and stained with the antibodies against CP110 and γ-tubulin. n = 3 independent experiments. (C and D) Immunofluorescence images (C) and quantification of the percentage of cells with MKS3 at the centrosome (D) for RPE1 cells transfected with control or TBC1D20 siRNAs, cultured in serum medium, and stained with the antibodies against MKS3 and γ-tubulin. n = 3 independent experiments. (E and F) Immunofluorescence images (E) and quantification of the fluorescence intensity of IFT88 at the centrosome (F) for RPE1 cells transfected with control or TBC1D20 siRNAs, cultured in serum medium, and stained with the antibodies against IFT88 and CEP164. n = 3 independent experiments. (G and H) Immunofluorescence images (G) and quantification of the fluorescence intensity of IFT140 at the centrosome (H) for RPE1 cells transfected with control or TBC1D20 siRNAs, cultured in serum medium, and stained with the antibodies against IFT140 and CEP164. n = 3 independent experiments. (I and J) Immunofluorescence images (I) and quantification of the fluorescence intensity of PCNT (J) for RPE1 cells transfected with control or TBC1D20 siRNAs, cultured in serum medium, and stained with antibody against PCNT. Bottom panels depict three-dimensional surface plot of the intensities portrayed in top panels. n > 30 cells. (K–M) Immunofluorescence images (K), the distribution area of PCM1 (L), and the quantification of the fluorescence intensity of PCM1 (M) for RPE1 cells transfected with control or TBC1D20 siRNAs, cultured in serum medium, and stained with antibody against PCM1. Bottom panels depict three-dimensional surface plot of the intensities portrayed in top panels. n > 30 cells. (N and O) Immunofluorescence images of the fluorescence intensity of IFT88 and IFT140 at the centrosome for RPE1 cells transfected with control or TBC1D20 siRNAs, cultured without serum medium, and stained with the antibodies against IFT88 and CEP164. All experiments were repeated at least three times. Data are presented as mean ± SEM. ***P < 0.001, ****P < 0.0001; ns, not significant. Scale bar, 5 µm.
The dynamics of centriolar satellites play a critical role in regulating the trafficking of ciliary proteins, maintaining centrosome organization, and initiating ciliogenesis (Galati et al., 2018; Jewett et al., 2023; McCurdy et al., 2022). Therefore, we examined the centrosome structure and centriolar satellite integrity in TBC1D20-knockdown cells. While γ-tubulin localization at the centrosome was maintained in TBC1D20-depleted cells (Fig. 2, A and C), the centriolar satellite pools of pericentriolar material 1 (PCM1) and pericentrin (PCNT) showed weakening and dispersion under serum-fed conditions (Fig. 2, I–M), similar to control cells under serum starvation conditions (Fig. 2, I and K), suggesting that the reduction of satellite proteins accumulation at the centrosome is a crucial step in ciliogenesis. Notably, TBC1D20 expression rescued the satellite protein dispersion, whereas TBC1D20R105A failed to do so (Fig. S1, D–H). We further examined the localization of IFT components in TBC1D20-depleted cells following serum starvation. IFT88 and IFT140 properly localized to mother centrioles and along the cilia, suggesting that depletion of TBC1D20 did not affect the IFT components of mature cilia (Fig. 2, N and O). Together, these results indicate that the deletion of TBC1D20 promotes early events in ciliary assembly while inhibiting the localization of centriolar satellite proteins to the centrosome.
TBC1D20 is a GTPase-activating protein (GAP) for Rab11
We sought to elucidate the substrates of TBC1D20 in regulating vesicle transport and ciliogenesis. To identify the molecular pathways involving TBC1D20, we conducted TurboID analysis in 293T cells to detect its proximal interactors (Fig. 3 A). This analysis revealed interactions between TBC1D20 and other WARBM-associated genes, such as Rab3GAP1 and Rab3GAP2, suggesting a potential functional link between these genes in human diseases. Additionally, TBC1D20 was found to interact with ciliogenesis-related proteins, including Rab11 and EHD1. To validate the interaction between TBC1D20 and Rab11, we generated GFP-TBC1D20, GFP-TBC1D20R105A, and HA-Rab11Q70L constructs and co-transfected them into 293T cells. Co-immunoprecipitation assays confirmed the interaction between TBC1D20 and Rab11Q70L, an interaction that persisted even when the catalytic site of TBC1D20 was mutated (Fig. 3 B and Fig. S2 A). To determine whether this interaction was direct, we purified His-TBC1D20 and GST-Rab11 proteins in Escherichia coli and performed GST pulldown assays. These assays showed that purified His-TBC1D20 directly interacted with purified GST-Rab11 (Fig. 3 C and Fig. S2 B). This interaction was also observed in 293T cells (Fig. S2 C).
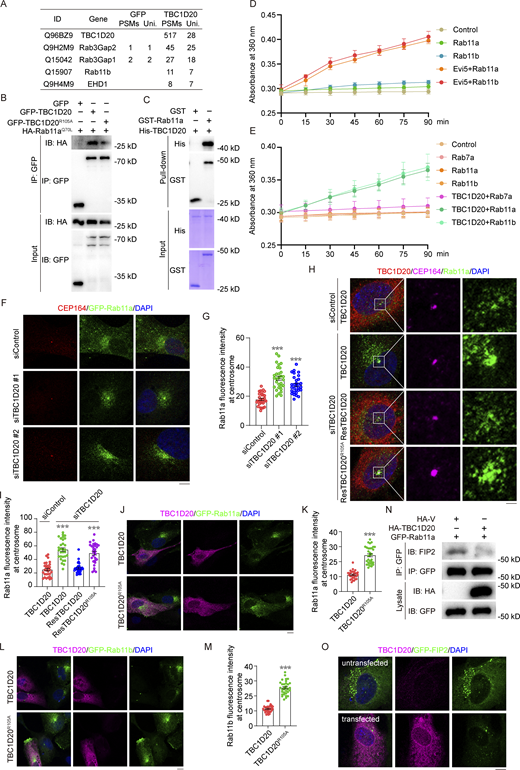
TBC1D20 regulates Rab11-mediated vesicle transport. (A) Peptide count from mass spectrometry analysis of TBC1D20-binding proteins was obtained from 293T cells stably expressing TurboID-GFP or TurboID-TBC1D20. (B) 293T cells were transfected with the indicated plasmids and subjected to immunoprecipitation. (C) GST pull-down showing the interaction between purified GST-Rab11a and purified His-TBC1D20 protein. (D and E) GAP activity about TBC1D20 toward Rab11. The GTPase activity of Rab11, catalyzed by TBC1D20, was measured by adding the proteins to a reaction solution in a 96-well plate. GTP with a final concentration of 400 μM was added to the reaction, and the absorbance at 360 nm was measured over time to assess enzymatic activity. Positive control, Evi5; Negative control, Rab7a. n = 3 independent experiments. (F and G) Immunofluorescence images (F) and quantification of the fluorescence intensity of Rab11a at the centrosome (G) for RPE1 GFP-Rab11a cells transfected with control or TBC1D20 siRNAs, cultured in serum medium, and stained with antibody against CEP164. n > 30 cells. (H and I) Immunofluorescence images (H) and quantification of the percentage of Rab11a at the centrosome (I) for RPE1 cells stably expressing WT TBC1D20, ResTBC1D20, or ResTBC1D20R105A, transfected with control or TBC1D20 siRNAs, and cultured in serum medium and stained with the antibodies against TBC1D20, CEP164, and Rab11. n > 30 cells. (J and K) Immunofluorescence images (J) and quantification of the fluorescence intensity of Rab11a at the centrosome (K) for RPE1 GFP-Rab11a cells transfected with HA-TBC1D20 or HA-TBC1D20R105A, cultured in serum medium, and stained with the antibody against HA-tag. n > 30 cells. (L and M) Immunofluorescence images (L) and quantification of the fluorescence intensity of Rab11b at the centrosome (M) for RPE1 GFP-Rab11B cells transfected with HA-TBC1D20 or HA-TBC1D20R105A, cultured in serum medium, and stained with the antibody against HA-tag. n > 30 cells. (N) Immunoprecipitation and immunoblotting showing the interaction between GFP-Rab11a or GFP-Rab11b and endogenous FIP2 in 293T cells. (O) Immunofluorescence images for RPE1 GFP-FIP2 cells transfected with HA-TBC1D20, cultured in serum medium, and stained with the antibody against HA-tag. The top row shows a cell untransfected with HA-TBC1D20, and the bottom row shows a cell transfected with HA-TBC1D20. All experiments were repeated at least three times. Data are presented as mean ± SEM. ***P < 0.001; ns, not significant. Scale bar, 5 µm. Source data are available for this figure: SourceData F3.
TBC1D20 regulates Rab11-mediated vesicle transport. (A) Peptide count from mass spectrometry analysis of TBC1D20-binding proteins was obtained from 293T cells stably expressing TurboID-GFP or TurboID-TBC1D20. (B) 293T cells were transfected with the indicated plasmids and subjected to immunoprecipitation. (C) GST pull-down showing the interaction between purified GST-Rab11a and purified His-TBC1D20 protein. (D and E) GAP activity about TBC1D20 toward Rab11. The GTPase activity of Rab11, catalyzed by TBC1D20, was measured by adding the proteins to a reaction solution in a 96-well plate. GTP with a final concentration of 400 μM was added to the reaction, and the absorbance at 360 nm was measured over time to assess enzymatic activity. Positive control, Evi5; Negative control, Rab7a. n = 3 independent experiments. (F and G) Immunofluorescence images (F) and quantification of the fluorescence intensity of Rab11a at the centrosome (G) for RPE1 GFP-Rab11a cells transfected with control or TBC1D20 siRNAs, cultured in serum medium, and stained with antibody against CEP164. n > 30 cells. (H and I) Immunofluorescence images (H) and quantification of the percentage of Rab11a at the centrosome (I) for RPE1 cells stably expressing WT TBC1D20, ResTBC1D20, or ResTBC1D20R105A, transfected with control or TBC1D20 siRNAs, and cultured in serum medium and stained with the antibodies against TBC1D20, CEP164, and Rab11. n > 30 cells. (J and K) Immunofluorescence images (J) and quantification of the fluorescence intensity of Rab11a at the centrosome (K) for RPE1 GFP-Rab11a cells transfected with HA-TBC1D20 or HA-TBC1D20R105A, cultured in serum medium, and stained with the antibody against HA-tag. n > 30 cells. (L and M) Immunofluorescence images (L) and quantification of the fluorescence intensity of Rab11b at the centrosome (M) for RPE1 GFP-Rab11B cells transfected with HA-TBC1D20 or HA-TBC1D20R105A, cultured in serum medium, and stained with the antibody against HA-tag. n > 30 cells. (N) Immunoprecipitation and immunoblotting showing the interaction between GFP-Rab11a or GFP-Rab11b and endogenous FIP2 in 293T cells. (O) Immunofluorescence images for RPE1 GFP-FIP2 cells transfected with HA-TBC1D20, cultured in serum medium, and stained with the antibody against HA-tag. The top row shows a cell untransfected with HA-TBC1D20, and the bottom row shows a cell transfected with HA-TBC1D20. All experiments were repeated at least three times. Data are presented as mean ± SEM. ***P < 0.001; ns, not significant. Scale bar, 5 µm. Source data are available for this figure: SourceData F3.
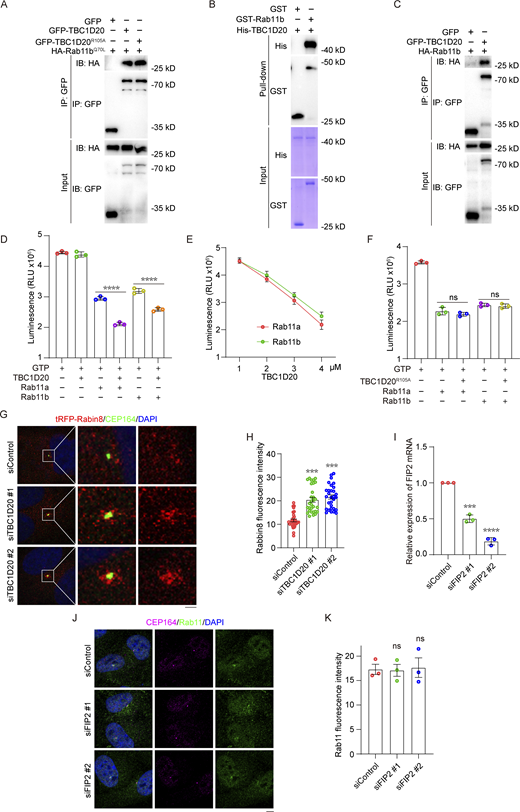
TBC1D20 regulates Rab11-mediated vesicle transport. (A) 293T cells were transfected with the indicated plasmids and subjected to immunoprecipitation. (B) GST pull-down showing the interaction between purified GST-Rab11a and purified His-TBC1D20 protein. (C) Immunoprecipitation and immunoblotting showing the interaction between GFP-TBC1D20 and HA-Rab11b in 293T cells. (D–F) GTP hydrolysis was determined with purified TBC1D20, TBC1D20R105A, Rab11a, and Rab11b. n = 3 independent experiments. (G and H) Immunofluorescence images (G) and quantification of the fluorescence intensity of Rabin8 at the centrosome (H) for RPE1 tRFP-Rabin8 cells transfected with control or TBC1D20 siRNAs, cultured in serum medium, and stained with the antibody against CEP164. n > 30 cells. (I) RPE1 cells transfected with the indicated FIP2 siRNAs for 48 h and then subjected to qPCR analysis. (J and K) Immunofluorescence images (J) and quantification of the fluorescence intensity of Rab11 at the centrosome (K) for RPE1 cells transfected with control or FIP2 siRNAs, cultured in serum-fed medium, and stained with antibodies against Rab11 and CEP164. n = 3 independent experiments. All experiments were repeated at least three times. Data are presented as mean ± SEM. ***P < 0.001, ****P < 0.0001; ns, not significant. Scale bar, 5 µm. Source data are available for this figure: SourceData FS2.
TBC1D20 regulates Rab11-mediated vesicle transport. (A) 293T cells were transfected with the indicated plasmids and subjected to immunoprecipitation. (B) GST pull-down showing the interaction between purified GST-Rab11a and purified His-TBC1D20 protein. (C) Immunoprecipitation and immunoblotting showing the interaction between GFP-TBC1D20 and HA-Rab11b in 293T cells. (D–F) GTP hydrolysis was determined with purified TBC1D20, TBC1D20R105A, Rab11a, and Rab11b. n = 3 independent experiments. (G and H) Immunofluorescence images (G) and quantification of the fluorescence intensity of Rabin8 at the centrosome (H) for RPE1 tRFP-Rabin8 cells transfected with control or TBC1D20 siRNAs, cultured in serum medium, and stained with the antibody against CEP164. n > 30 cells. (I) RPE1 cells transfected with the indicated FIP2 siRNAs for 48 h and then subjected to qPCR analysis. (J and K) Immunofluorescence images (J) and quantification of the fluorescence intensity of Rab11 at the centrosome (K) for RPE1 cells transfected with control or FIP2 siRNAs, cultured in serum-fed medium, and stained with antibodies against Rab11 and CEP164. n = 3 independent experiments. All experiments were repeated at least three times. Data are presented as mean ± SEM. ***P < 0.001, ****P < 0.0001; ns, not significant. Scale bar, 5 µm. Source data are available for this figure: SourceData FS2.
Given the presence of a TBC domain in TBC1D20, which facilitates GTP hydrolysis in Rab proteins, we hypothesized that TBC1D20 might catalyze GTP hydrolysis in Rab11. To test this, we purified human His-TBC1D20, His-TBC1D20R105A, GST-Rab11a, and GST-Rab11b proteins using an E. coli expression system and conducted in vitro GAP assays. The results demonstrated that TBC1D20 significantly enhanced Rab11’s GTP hydrolysis efficiency (Fig. 3, D and E; and Fig. S2 D). This catalytic efficiency increased with higher TBC1D20 concentrations (Fig. S2 E). However, the catalytically inactive mutant TBC1D20R105A did not enhance Rab11’s hydrolysis efficiency (Fig. S2 F).
Importantly, TBC1D20 depletion could promote the accumulation of Rab11-positive vesicles around the centrosome in serum-fed cells (Fig. 3, F and G). TBC1D20 depletion also promoted centrosomal accumulation of tRFP-Rabin8, a cargo of Rab11 for ciliogenesis (Fig. S2, G and H). Notably, this accumulation of Rab11-positive vesicles caused by TBC1D20 depletion was reversed by the exogenous expression of a siRNA-resistant WT TBC1D20 but not its catalytically inactive mutant, TBC1D20R105A (Fig. 3, H and I). We further investigated the effect of TBC1D20 overexpression on Rab11 localization. Transient overexpression of TBC1D20 in cell lines stably expressing Rab11a and Rab11b significantly reduced the accumulation of Rab11a and Rab11b vesicles at the centrosome. In contrast, overexpression of the catalytically inactive TBC1D20R105A had no such effect (Fig. 3, J–M). Importantly, GFP-Rab11a and GFP-Rab11b proteins in cells overexpressing TBC1D20 were largely released from membrane structures and dispersed throughout the cytoplasm, indicating effective inactivation of Rab11a and Rab11b by TBC1D20.
Rab11 associates with FIP2 in a GTP-dependent manner, forming a complex that regulates recycling vesicle transport and plasma membrane cycling in cooperation with Myosin-Vb (Schafer et al., 2014). Co-immunoprecipitation experiments revealed that TBC1D20 overexpression significantly disrupted the interaction between GFP–Rab11 and endogenous FIP2 (Fig. 3 N). Immunofluorescence analysis further showed that transient overexpression of TBC1D20 in stable GFP-FIP2 RPE1 cells substantially reduced the localization of FIP2 on vesicles (Fig. 3 O). To evaluate the role of the Rab11–FIP2 interaction in vesicle docking, FIP2 was depleted using siRNA, and it was found that FIP2 was not required for Rab11 vesicle docking (Fig. S2, I–K). These results indicate that TBC1D20 functions as a GAP for Rab11, influencing Rab11-mediated membrane transport and ciliogenesis.
Loss of TBC1D20 disrupts the F-actin network around the centrosome
Previous studies have demonstrated that actin polymerization, F-actin branching, and stress fiber formation suppress ciliogenesis while inhibiting actin assembly or branched F-actin formation enhances it (Smith et al., 2020). Given that TBC1D20 depletion promotes ciliogenesis initiation, we investigated if F-actin network remodeling contributes to this process. To test this, we examined the morphology of F-actin networks in serum-fed TBC1D20-depleted cells and observed a significant depolymerization of F-actin around the centrosome (Fig. 4, A and B). Live cell imaging of RPE1 cells co-expressing Lifeact-mScarlet and GFP-CEP83 revealed that TBC1D20 knockdown also led to F-actin disassembly (Fig. 4, C and D). Consistent results were observed in the fixed Lifeact-GFP RPE1 cells and the live cell imaging of tRFP-CEP83 RPE1 cells incubated with the actin-specific dyes (Fig. S3, A–D). A 3D reconstruction of the centrosome region supported these findings (Fig. 4 E). Rescue experiments demonstrated that re-expression of WT TBC1D20 restored the F-actin network, whereas the catalytically inactive TBC1D20R105A mutant failed to do so (Fig. 4, F and G). These results suggest that TBC1D20’s GAP activity plays a critical role in maintaining the F-actin network around the centrosome.

Rab11 regulates F-actin depolymerization at the centrosome. (A and B) Immunofluorescence images (A) and quantification of the fluorescence intensity of phalloidin at the centrosome (B) for RPE1 cells transfected with control or TBC1D20 siRNAs, cultured in serum medium, and stained with the antibodies against rhodamine-conjugated phalloidin and CEP164. n > 30 cells. (C and D) Live-cell fluorescence images (C) and quantification of the fluorescence intensity of Lifeact-mScarlet at the centrosome (D) for RPE1 cells stably co-expressing GFP-CEP83 and Lifeact-mScarlet, transfected with control or TBC1D20 siRNAs, and cultured in serum medium. n > 30 cells. (E) Representative imaging of endogenous CEP164 (green) and F-actin (phalloidin, red) in RPE1 cells transiently transfected with control or TBC1D20 siRNA for 48 h. These images are presented as projections of z-stacks encompassing the entire cell. 3D projection of the zoom images (step size: 500 nm) were performed using ImageJ software. (F and G) Immunofluorescence images (F) and quantification of the percentage of phalloidin (G) at the centrosome for RPE1 cells stably expressing WT TBC1D20, ResTBC1D20, or ResTBC1D20R105A. The cells were transfected with control or TBC1D20 siRNAs, cultured in serum medium, and stained with the antibodies against rhodamine-conjugated phalloidin and CEP164. n > 30 cells. (H) RPE1 cells were transfected with GFP-Rab11aQ70L, cultured in serum medium, and stained with antibodies against CEP164 and rhodamine-conjugated phalloidin. The top row represents cells transfected, and the bottom row shows cells that were not transfected. (I and J) Immunofluorescence images (I) and quantification of the fluorescence intensity of phalloidin at the centrosome (J) for RPE1 GFP-Rab11a or GFP-Rab11B cells transfected with TBC1D20 siRNA, cultured in serum medium with JAK (50 nM), and stained with the antibody against CEP164. n > 30 cells. (K and L) Immunofluorescence images (K) and quantification of the fluorescence intensity of MKS3 at the centrosome (L) for RPE1 cells transfected with TBC1D20 siRNA, cultured in serum medium with DMSO or JAK (50 nM), and stained with the antibodies against CEP164 and MKS3. n = 3 independent experiments. (M and N) Immunofluorescence images (M) and quantification of the fluorescence intensity of ARP2 at the centrosome (N) for RPE1 cells transfected with control or TBC1D20 siRNAs, cultured in serum medium, and stained with the antibodies against ARP2 and CEP164. n = 3 independent experiments. All experiments were repeated at least three times. Data are presented as mean ± SEM. ***P < 0.001, ****P < 0.0001; ns, not significant. Scale bars, 5 µm.
Rab11 regulates F-actin depolymerization at the centrosome. (A and B) Immunofluorescence images (A) and quantification of the fluorescence intensity of phalloidin at the centrosome (B) for RPE1 cells transfected with control or TBC1D20 siRNAs, cultured in serum medium, and stained with the antibodies against rhodamine-conjugated phalloidin and CEP164. n > 30 cells. (C and D) Live-cell fluorescence images (C) and quantification of the fluorescence intensity of Lifeact-mScarlet at the centrosome (D) for RPE1 cells stably co-expressing GFP-CEP83 and Lifeact-mScarlet, transfected with control or TBC1D20 siRNAs, and cultured in serum medium. n > 30 cells. (E) Representative imaging of endogenous CEP164 (green) and F-actin (phalloidin, red) in RPE1 cells transiently transfected with control or TBC1D20 siRNA for 48 h. These images are presented as projections of z-stacks encompassing the entire cell. 3D projection of the zoom images (step size: 500 nm) were performed using ImageJ software. (F and G) Immunofluorescence images (F) and quantification of the percentage of phalloidin (G) at the centrosome for RPE1 cells stably expressing WT TBC1D20, ResTBC1D20, or ResTBC1D20R105A. The cells were transfected with control or TBC1D20 siRNAs, cultured in serum medium, and stained with the antibodies against rhodamine-conjugated phalloidin and CEP164. n > 30 cells. (H) RPE1 cells were transfected with GFP-Rab11aQ70L, cultured in serum medium, and stained with antibodies against CEP164 and rhodamine-conjugated phalloidin. The top row represents cells transfected, and the bottom row shows cells that were not transfected. (I and J) Immunofluorescence images (I) and quantification of the fluorescence intensity of phalloidin at the centrosome (J) for RPE1 GFP-Rab11a or GFP-Rab11B cells transfected with TBC1D20 siRNA, cultured in serum medium with JAK (50 nM), and stained with the antibody against CEP164. n > 30 cells. (K and L) Immunofluorescence images (K) and quantification of the fluorescence intensity of MKS3 at the centrosome (L) for RPE1 cells transfected with TBC1D20 siRNA, cultured in serum medium with DMSO or JAK (50 nM), and stained with the antibodies against CEP164 and MKS3. n = 3 independent experiments. (M and N) Immunofluorescence images (M) and quantification of the fluorescence intensity of ARP2 at the centrosome (N) for RPE1 cells transfected with control or TBC1D20 siRNAs, cultured in serum medium, and stained with the antibodies against ARP2 and CEP164. n = 3 independent experiments. All experiments were repeated at least three times. Data are presented as mean ± SEM. ***P < 0.001, ****P < 0.0001; ns, not significant. Scale bars, 5 µm.

Rab11 regulates F-actin depolymerization at the centrosome. (A and B) Immunofluorescence images (A) and quantification of the fluorescence intensity of F-actin at the centrosome (B) for RPE1 Lifeact-GFP cells transfected with control or TBC1D20 siRNAs, cultured in serum medium, and stained with the antibody against CEP164. n > 30 cells. (C and D) Live-cell fluorescence images (C) and quantification of the fluorescence intensity of F-actin at the centrosome (D) for RPE1 tRFP-CEP83 cells transfected with control or TBC1D20 siRNAs, cultured in serum medium, and incubated with CellMask Deep Red Actin Tracking Stains (1× concentration) for 1 h. n > 30 cells. (E and F) Immunofluorescence images (E) and quantification of the fluorescence intensity of PCNT at the centrosome (F) for RPE1 cells treated with Cyto D (100 nM) or JAK (50 nM), cultured in serum medium, and stained with the antibodies against CEP164 and PCNT. n > 30 cells. (G and H) Immunofluorescence images (G) and quantification of the fluorescence intensity of PCM1 at the centrosome (H) for RPE1 cells treated with Cyto D (100 nM) or JAK (50 nM), cultured in serum medium, and stained with the antibodies against CEP164 and PCM1. n > 30 cells. (I) Immunofluorescence images for RPE1 cells transfected with HA-Rab11aQ70L, cultured in serum medium, and stained with the antibodies against HA-tag and PCNT. The top row represents cells transfected, and the bottom row shows cells that were not transfected. (J) Immunofluorescence images for RPE1 cells transfected with HA-Rab11aQ70L, cultured in serum medium, and stained with the antibodies against HA-tag and PCM1. The top row represents cells transfected, and the bottom row shows cells that were not transfected. (K–M) Immunofluorescence images of the colocalization between SMO-GFP and Rab11 in RPE1 SMO-GFP cells transfected with control or TBC1D20 siRNAs, cultured in serum medium, and stained with the antibodies against Rab11 and CEP164. (L and M) The fluorescence intensity of SMO and Rab11 across the cell along the white arrow in K was assessed using ImageJ. (N and O) Immunofluorescence images (N) and quantification of the fluorescence intensity of Rab11 at the centrosome (O) for RPE1 GFP-Rab11Q70L or GFP-Rab11S25N cells, cultured in serum medium, and stained with the antibody against CEP164. n > 30 cells. All experiments were repeated at least three times. Scale bar, 5 µm.
Rab11 regulates F-actin depolymerization at the centrosome. (A and B) Immunofluorescence images (A) and quantification of the fluorescence intensity of F-actin at the centrosome (B) for RPE1 Lifeact-GFP cells transfected with control or TBC1D20 siRNAs, cultured in serum medium, and stained with the antibody against CEP164. n > 30 cells. (C and D) Live-cell fluorescence images (C) and quantification of the fluorescence intensity of F-actin at the centrosome (D) for RPE1 tRFP-CEP83 cells transfected with control or TBC1D20 siRNAs, cultured in serum medium, and incubated with CellMask Deep Red Actin Tracking Stains (1× concentration) for 1 h. n > 30 cells. (E and F) Immunofluorescence images (E) and quantification of the fluorescence intensity of PCNT at the centrosome (F) for RPE1 cells treated with Cyto D (100 nM) or JAK (50 nM), cultured in serum medium, and stained with the antibodies against CEP164 and PCNT. n > 30 cells. (G and H) Immunofluorescence images (G) and quantification of the fluorescence intensity of PCM1 at the centrosome (H) for RPE1 cells treated with Cyto D (100 nM) or JAK (50 nM), cultured in serum medium, and stained with the antibodies against CEP164 and PCM1. n > 30 cells. (I) Immunofluorescence images for RPE1 cells transfected with HA-Rab11aQ70L, cultured in serum medium, and stained with the antibodies against HA-tag and PCNT. The top row represents cells transfected, and the bottom row shows cells that were not transfected. (J) Immunofluorescence images for RPE1 cells transfected with HA-Rab11aQ70L, cultured in serum medium, and stained with the antibodies against HA-tag and PCM1. The top row represents cells transfected, and the bottom row shows cells that were not transfected. (K–M) Immunofluorescence images of the colocalization between SMO-GFP and Rab11 in RPE1 SMO-GFP cells transfected with control or TBC1D20 siRNAs, cultured in serum medium, and stained with the antibodies against Rab11 and CEP164. (L and M) The fluorescence intensity of SMO and Rab11 across the cell along the white arrow in K was assessed using ImageJ. (N and O) Immunofluorescence images (N) and quantification of the fluorescence intensity of Rab11 at the centrosome (O) for RPE1 GFP-Rab11Q70L or GFP-Rab11S25N cells, cultured in serum medium, and stained with the antibody against CEP164. n > 30 cells. All experiments were repeated at least three times. Scale bar, 5 µm.
Our findings indicate that TBC1D20 downregulation not only promotes the accumulation of SMO-GFP and Rab11-positive vesicles at the centrosome but also remodels the F-actin network to facilitate ciliogenesis. Previous studies have shown that Rab11-positive vesicles can influence actin distribution and clustering in mouse oocytes (Holubcova et al., 2013) and that aberrant Rab11 activity disrupts the F-actin network in Drosophila cells (Bhuin and Roy, 2011). To determine if Rab11 directly affects the F-actin network near the basal body, we overexpressed GFP-Rab11Q70L in RPE1 cells. This led to significant depolymerization of the F-actin network around the centrosome compared with control cells (Fig. 4 H).
Treatment with jasplakinolide (JAK), a compound that promotes actin polymerization and stabilizes filaments, significantly reduced the accumulation of GFP–Rab11 vesicles around the centrosome caused by TBC1D20 depletion under serum-fed condition (Fig. 4, I and J). Additionally, JAK treatment inhibited the recruitment of MKS3 to the mother centriole in TBC1D20-depleted cells (Fig. 4, K and L). To clarify the relationship between centrosomal satellite proteins and F-actin dynamics, we treated cells with either cytochalasin D (Cyto D, to promote actin depolymerization) or JAK. Neither treatment affected the localization of centrosomal satellite proteins, as evidenced by unchanged PCNT and PCM1 levels (Fig. S3, E–H). These results suggest that the transport of satellite proteins to the centrosome is independent of actin polymerization but is likely modulated by the accumulation of GTP-Rab11 caused by TBC1D20 knockdown, which triggers microfilament depolymerization. Given that active or inactive Rab11 mutants reduce the centrosomal satellite localization of PCNT (Krishnan et al., 2022), we hypothesized that the loss of TBC1D20 may cause centrosomal accumulation of GTP-bound Rab11, leading to reduced PCNT and PCM1 levels. Indeed, cells overexpressing Rab11Q70L mutants exhibited lower centrosomal levels of PCNT and PCM1 compared to controls (Fig. S3, I and J). These findings suggest that activated Rab11 reduces the accumulation of centrosomal satellite proteins, thereby promoting ciliogenesis.
We also observed partial co-localization between Rab11 vesicles and SMO-positive vesicles, indicating that these vesicles share similarities during ciliogenesis (Fig. S3, K–M). Further experiments demonstrated that GTP-bound Rab11 vesicles accumulated around the centrosome and anchored to the distal appendage of the mother centriole, while GDP-bound Rab11 diffused throughout the cytoplasm (Fig. S3, N and O). These findings underscore the importance of GTP–Rab11 in vesicle trafficking and anchoring during ciliogenesis.
Furthermore, we observed a reduction in the localization of the actin nucleator ARP2 at the centrosome in TBC1D20-deficient cells, indicating that TBC1D20 depletion impairs the nucleation and formation of branched F-actin (Fig. 4, M and N). These results align with previous studies indicating that the centrosome F-actin network acts as a barrier to vesicle transport and ciliogenesis. Collectively, our findings suggest that TBC1D20 regulates dynamic actin remodeling via Rab11 activation and vesicle transport, ultimately facilitating cilia formation.
Myosin-Va interacts with MICAL1 to mediate the unloading of Rab11 at the centrosome
Myosin-Va interacts with MICAL1 to promote F-actin depolymerization at the midbody, facilitating the unloading of Rab11-positive vesicles and mitotic progression (Niu et al., 2020). MICAL1 contains an MO domain and a Rab-binding domain (RBD), which interact to maintain MICAL1 in an autoinhibited state, thereby suppressing MO domain activity and preventing F-actin depolymerization (Fig. 5 A). To determine whether MICAL1 also contributes to the centrosomal accumulation of Myosin-Va and GTP-Rab11-positive vesicles observed during TBC1D20 depletion (Fig. 1 K and Fig. 3 F), we assessed the interaction between MICAL1 and Myosin-Va following TBC1D20 knockdown. Immunoprecipitation using the whole-cell lysate demonstrated that TBC1D20 depletion did not alter the interaction between GFP-MICAL1 and Myosin-Va (Fig. 5 B). However, by immunofluorescence microscopy, we found that TBC1D20 depletion significantly enhanced the accumulation and co-localization of Myosin-Va and MICAL1 at the centrosome (Fig. 5, C–F). Additionally, we observed that MICAL1 localization at the centrosome was markedly enhanced under serum starvation conditions in RPE1 cells. TBC1D20 depletion not only amplified Rab11 accumulation but also strengthened MICAL1 localization at the centrosome (Fig. 5, G and H).
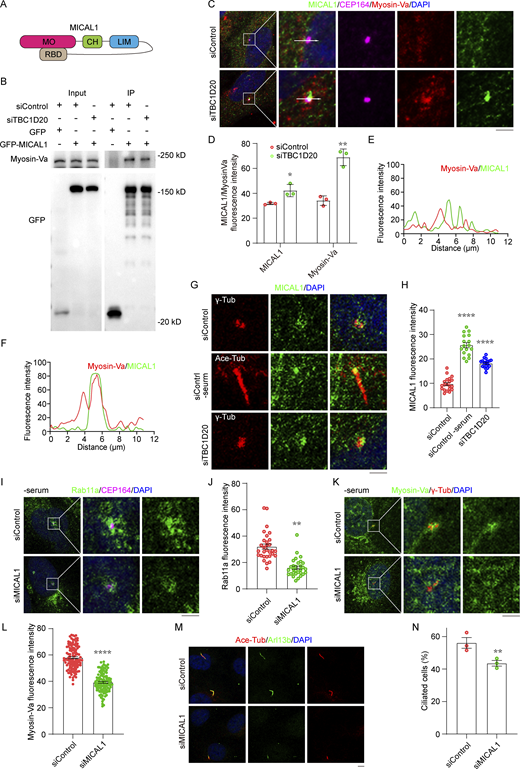
MICAL1 and Myosin-Va regulate vesicle unloading. (A) The structure of the MICAL1. (B) Immunoprecipitation and immunoblotting showing the interaction between GFP-MICAL1 and endogenous Myosin-Va in 293T cells. (C) Immunofluorescence images of the co-localization between MICAL1 and Myosin-Va in RPE1 cells transfected with control or TBC1D20 siRNAs, cultured in serum medium, and stained with the antibodies against MICAL1, Myosin-Va and CEP164. (D) Quantification of the fluorescence intensity of MICAL1 or Myosin-Va at the centrosome, corresponding to C. n = 3 independent experiments. (E and F) The fluorescence intensity of MICAL1 and Myosin-Va across the cell along the white arrow in C was assessed using ImageJ. (G and H) Immunofluorescence images (G) and quantification of the fluorescence intensity of MICAL1 at the centrosome (H) for RPE1 cells transfected with control or TBC1D20 siRNAs, cultured in serum or serum-free medium, and stained with the antibodies against MICAL1, γ-tubulin and Ace-tubulin. n = 3 independent experiments. (I and J) Immunofluorescence images (I) and quantification of the fluorescence intensity of Rab11a at the centrosome (J) for RPE1 cells transfected with control or MICAL1 siRNA, cultured in serum-free medium, and stained with the antibodies against MICAL1 and CEP164. n > 30 cells. (K and L) Immunofluorescence images (K) and quantification of the fluorescence intensity of Myosin-Va at the centrosome (L) for RPE1 cells transfected with control or MICAL1 siRNAs, cultured in serum-free medium, and stained with the antibodies against γ-tubulin and Myosin-Va. n > 100 cells. (M and N) Immunofluorescence images (M) and quantification of the percentage of ciliated cells (N) for RPE1 cells transfected with control or MICAL1 siRNAs, cultured in serum-free medium, and stained with the antibodies against Ace-tubulin and Arl13b. n = 3 independent experiments. All experiments were repeated at least three times. Data are presented as mean ± SEM. **P < 0.01, ****P < 0.0001; ns, not significant. Scale bars, 5 μm. Source data are available for this figure: SourceData F5.
MICAL1 and Myosin-Va regulate vesicle unloading. (A) The structure of the MICAL1. (B) Immunoprecipitation and immunoblotting showing the interaction between GFP-MICAL1 and endogenous Myosin-Va in 293T cells. (C) Immunofluorescence images of the co-localization between MICAL1 and Myosin-Va in RPE1 cells transfected with control or TBC1D20 siRNAs, cultured in serum medium, and stained with the antibodies against MICAL1, Myosin-Va and CEP164. (D) Quantification of the fluorescence intensity of MICAL1 or Myosin-Va at the centrosome, corresponding to C. n = 3 independent experiments. (E and F) The fluorescence intensity of MICAL1 and Myosin-Va across the cell along the white arrow in C was assessed using ImageJ. (G and H) Immunofluorescence images (G) and quantification of the fluorescence intensity of MICAL1 at the centrosome (H) for RPE1 cells transfected with control or TBC1D20 siRNAs, cultured in serum or serum-free medium, and stained with the antibodies against MICAL1, γ-tubulin and Ace-tubulin. n = 3 independent experiments. (I and J) Immunofluorescence images (I) and quantification of the fluorescence intensity of Rab11a at the centrosome (J) for RPE1 cells transfected with control or MICAL1 siRNA, cultured in serum-free medium, and stained with the antibodies against MICAL1 and CEP164. n > 30 cells. (K and L) Immunofluorescence images (K) and quantification of the fluorescence intensity of Myosin-Va at the centrosome (L) for RPE1 cells transfected with control or MICAL1 siRNAs, cultured in serum-free medium, and stained with the antibodies against γ-tubulin and Myosin-Va. n > 100 cells. (M and N) Immunofluorescence images (M) and quantification of the percentage of ciliated cells (N) for RPE1 cells transfected with control or MICAL1 siRNAs, cultured in serum-free medium, and stained with the antibodies against Ace-tubulin and Arl13b. n = 3 independent experiments. All experiments were repeated at least three times. Data are presented as mean ± SEM. **P < 0.01, ****P < 0.0001; ns, not significant. Scale bars, 5 μm. Source data are available for this figure: SourceData F5.
The centrosomal accumulation of Rab11-positive vesicles in TBC1D20-depleted cells likely arises from reduced Rab11 GTP hydrolysis and enhanced release of Rab11 vesicles from F-actin tracks. Consistent with this hypothesis, siRNA-mediated knockdown of MICAL1 significantly reduced Rab11 localization at the centrosome (Fig. 5, I and J; and Fig. S4 A). Similar findings were observed in a MICAL1 knockout RPE1 cell line generated using the CRISPR/Cas9 system, where centrosomal Rab11 localization was markedly diminished (Fig. S4, B–E). Additionally, MICAL1 knockdown impaired Myosin-Va localization at the centrosome (Fig. 5, K and L), indicating that MICAL1 is crucial for Myosin-Va-mediated Rab11 vesicle unloading. Loss of MICAL1 also severely reduced cilia formation, as observed in both siRNA-treated and MICAL1 knockout cells (Fig. 5, M and N; and Fig. S4, F and G). Furthermore, MICAL1 knockdown disrupted EHD1 recruitment to the centrosome, suggesting broader effects on ciliogenesis-associated transport mechanisms (Fig. S4, H and I).
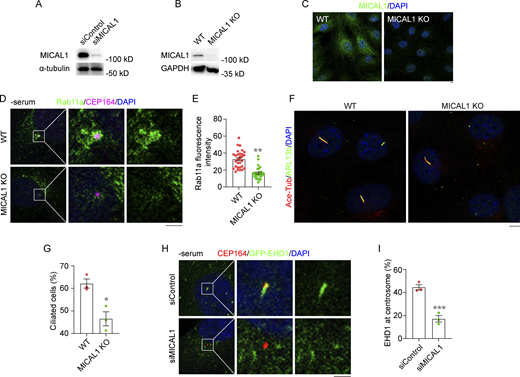
MICAL1 and Myosin-Va regulate vesicle unloading. (A) Immunoblot analysis of MICAL1 and α-tubulin in 293T cells transfected with control or MICAL1 siRNA and cultured in serum medium. (B) Immunoblot analysis of MICAL1 and GAPDH in RPE1 MICAL1 KO cells cultured in serum medium. (C) Immunofluorescence images for RPE1 MICAL1 KO cells cultured in serum medium and stained with the antibody against MICAL1. (D and E) Immunofluorescence images (D) and quantification of the fluorescence intensity of Rab11a at the centrosome (E) for RPE1 MICAL1 KO cells cultured in serum-free medium and stained with the antibodies against CEP164 and Rab11a. n > 30 cells. (F and G) Immunofluorescence images (F) and quantification of the percentage of ciliated cells (G) for RPE1 MICAL1 KO cells cultured in serum-free medium and stained with the antibodies against acetylated α-tubulin and Arl13b. n = 3 independent experiments. (H and I) Immunofluorescence images (H) and quantification of the percentage of cells with EHD1 at the centrosome (I) for RPE1 GFP-EHD1 cells transfected with control or MICAL1 siRNA, cultured in serum-free medium, and stained with the antibody against CEP164. n = 3 independent experiments. All experiments were repeated at least three times. Data are presented as mean ± SEM. *P < 0.1, ***P < 0.001; ns, not significant. Scale bar, 5 µm. Source data are available for this figure: SourceData FS4.
MICAL1 and Myosin-Va regulate vesicle unloading. (A) Immunoblot analysis of MICAL1 and α-tubulin in 293T cells transfected with control or MICAL1 siRNA and cultured in serum medium. (B) Immunoblot analysis of MICAL1 and GAPDH in RPE1 MICAL1 KO cells cultured in serum medium. (C) Immunofluorescence images for RPE1 MICAL1 KO cells cultured in serum medium and stained with the antibody against MICAL1. (D and E) Immunofluorescence images (D) and quantification of the fluorescence intensity of Rab11a at the centrosome (E) for RPE1 MICAL1 KO cells cultured in serum-free medium and stained with the antibodies against CEP164 and Rab11a. n > 30 cells. (F and G) Immunofluorescence images (F) and quantification of the percentage of ciliated cells (G) for RPE1 MICAL1 KO cells cultured in serum-free medium and stained with the antibodies against acetylated α-tubulin and Arl13b. n = 3 independent experiments. (H and I) Immunofluorescence images (H) and quantification of the percentage of cells with EHD1 at the centrosome (I) for RPE1 GFP-EHD1 cells transfected with control or MICAL1 siRNA, cultured in serum-free medium, and stained with the antibody against CEP164. n = 3 independent experiments. All experiments were repeated at least three times. Data are presented as mean ± SEM. *P < 0.1, ***P < 0.001; ns, not significant. Scale bar, 5 µm. Source data are available for this figure: SourceData FS4.
In summary, these findings demonstrate that the transport and unloading of Rab11-positive vesicles at the centrosome during ciliogenesis require the coordinated actions of Myosin-Va and MICAL1. This interaction is critical for regulating F-actin dynamics and vesicle localization, ultimately supporting the ciliogenesis process.
Rab11 activates MICAL1 MO domain to promote F-actin depolymerization
Our data indicate that the interaction between Myosin-Va and MICAL1 facilitates the unloading of Rab11-positive vesicles and F-actin track depolymerization, contributing to the accumulation of Rab11 at the centrosome following TBC1D20 knockdown. MICAL1 is typically self-inhibited within cells, but its interaction with Rab GTPases can release its N-terminal MO domain, enabling F-actin depolymerization (Fremont et al., 2017). To determine whether MICAL1 directly binds Rab11, we performed co-immunoprecipitation (co-IP) assays in 293T cells. We found that transient overexpression of HA-Rab11aQ70L and HA-Rab11bQ70L allowed them to interact with endogenous MICAL1 (Fig. 6 A). This interaction was further confirmed by co-IP experiments using GFP-MICAL1 with HA-Rab11aQ70L and HA-Rab11bQ70L (Fig. 6 B). Moreover, endogenous MICAL1 co-localized with GFP-Rab11bQ70L at the centrosome (Fig. 6, C–E), indicating that Rab11 interacts with MICAL1 at the centrosome, leading to the activation of MICAL1’s MO domain and subsequent F-actin depolymerization.
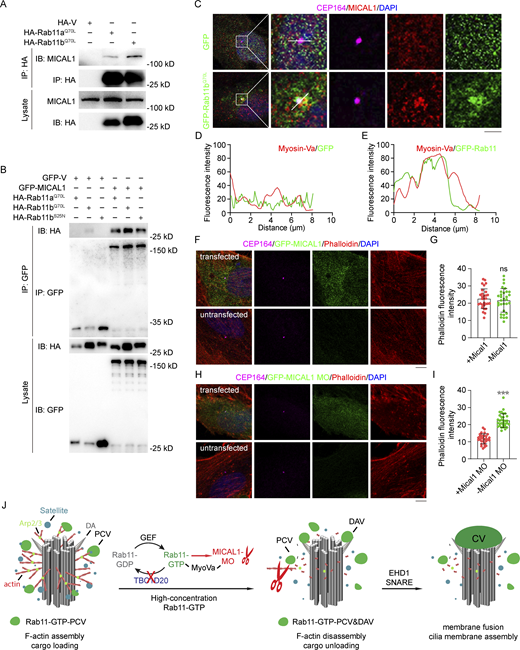
Rab11 interacts with MICAL1 to promote F-actin depolymerization. (A) Immunoprecipitation and immunoblotting showing the interaction between HA-Rab11a or HA-Rab11b and endogenous MICAL1 in 293T cells. (B) 293T cells were transfected with the indicated plasmids and subjected to immunoprecipitation. (C) Immunofluorescence images for RPE1 cells transfected with GFP-V or GFP-Rab11bQ70L, cultured in serum medium, and stained with the antibodies against CEP164 and MICAL1. (D and E) The fluorescence intensity of Rab11 and Myosin-Va across the cell along the white arrow in C was assessed using ImageJ. (F and G) Immunofluorescence images (F) and quantification of the fluorescence intensity of phalloidin at the centrosome (G) for RPE1 cells transfected with GFP-MICAL1, cultured in serum medium, and stained with the antibodies against rhodamine-conjugated phalloidin and CEP164. The top row shows a transfected cell, and the bottom row shows an untransfected cell. n > 30 cells. (H and I) Immunofluorescence images (H) and quantification of the fluorescence intensity of phalloidin at the centrosome (I) for RPE1 cells transfected with GFP-MICAL1 MO domain, cultured in serum medium, and stained with the antibodies against rhodamine-conjugated phalloidin and CEP164. The top row shows a transfected cell, and the bottom row shows an untransfected cell. n > 30 cells. (J) The model of TBC1D20 regulates Rab11 mediated vesicle transport and ciliogenesis. Fusion of DAV to form CV mediated by EHD1 and SNARE proteins. DA, distal appendages; PCV, pre-ciliary vesicles; DAV, docked distal appendage vesicles; CV, ciliary vesicle. All experiments were repeated at least three times. Data are presented as mean ± SEM. Scale bars, 5 μm. Source data are available for this figure: SourceData F6.
Rab11 interacts with MICAL1 to promote F-actin depolymerization. (A) Immunoprecipitation and immunoblotting showing the interaction between HA-Rab11a or HA-Rab11b and endogenous MICAL1 in 293T cells. (B) 293T cells were transfected with the indicated plasmids and subjected to immunoprecipitation. (C) Immunofluorescence images for RPE1 cells transfected with GFP-V or GFP-Rab11bQ70L, cultured in serum medium, and stained with the antibodies against CEP164 and MICAL1. (D and E) The fluorescence intensity of Rab11 and Myosin-Va across the cell along the white arrow in C was assessed using ImageJ. (F and G) Immunofluorescence images (F) and quantification of the fluorescence intensity of phalloidin at the centrosome (G) for RPE1 cells transfected with GFP-MICAL1, cultured in serum medium, and stained with the antibodies against rhodamine-conjugated phalloidin and CEP164. The top row shows a transfected cell, and the bottom row shows an untransfected cell. n > 30 cells. (H and I) Immunofluorescence images (H) and quantification of the fluorescence intensity of phalloidin at the centrosome (I) for RPE1 cells transfected with GFP-MICAL1 MO domain, cultured in serum medium, and stained with the antibodies against rhodamine-conjugated phalloidin and CEP164. The top row shows a transfected cell, and the bottom row shows an untransfected cell. n > 30 cells. (J) The model of TBC1D20 regulates Rab11 mediated vesicle transport and ciliogenesis. Fusion of DAV to form CV mediated by EHD1 and SNARE proteins. DA, distal appendages; PCV, pre-ciliary vesicles; DAV, docked distal appendage vesicles; CV, ciliary vesicle. All experiments were repeated at least three times. Data are presented as mean ± SEM. Scale bars, 5 μm. Source data are available for this figure: SourceData F6.
Since the F-actin remodeling activity of MICAL1 is attributed to its MO domain, and full-length MICAL1 remains autoinhibited, overexpressing full-length MICAL1 does not significantly induce F-actin depolymerization (Rajan et al., 2023). To further investigate this, we cloned the full-length MICAL1 and its MO domain, which were then expressed in RPE1 cells. The results showed that compared with full-length MICAL1, the MO domain alone caused a more pronounced rearrangement of F-actin around the centrosome (Fig. 6, F–I), providing further evidence that F-actin depolymerization is driven by the release of the MO domain upon Rab11-MICAL1 binding.
We also examined the recruitment of other Rab proteins in TBC1D20-depleted cells and found that the centrosomal accumulation of Rab35 and Rab8 was not enhanced, unlike that of Rab11 (Fig. S5, A–C). This suggests that TBC1D20 does not activate GTP hydrolysis in these Rab proteins. Additionally, we assessed the effect of TBC1D20 deletion on endocytosis. The results showed that prolonged TBC1D20 depletion led to a significant reduction in transferrin uptake, indicating that TBC1D20 not only affects Rab11 centrosomal accumulation but also its function in endocytosis (Fig. S5, D–G).

Rab11 interacts with MICAL1 to promote F-actin depolymerization. (A) Immunofluorescence images for RPE1 cells transfected with control or TBC1D20 siRNAs, cultured in serum medium, and stained with the antibodies against CEP164 and Rab35. (B) Immunofluorescence images for RPE1 GFP-Rab35 cells transfected with control or TBC1D20 siRNAs, cultured in serum medium, and stained with the antibody against CEP164. (C) Immunofluorescence images for RPE1 tRFP-Rab8a cells transfected with control or TBC1D20 siRNAs, cultured in serum medium, and stained with the antibody against CEP164. (D and E) Immunofluorescence images (D) and quantification of the fluorescence intensity of transferrin (E) for RPE1 GFP-Rab11B cells transfected with control or TBC1D20 siRNA, cultured in serum-free medium, and stained with the antibody against EEA1. n > 30 cells. (F and G) Immunofluorescence images (F) and quantification of the fluorescence intensity of transferrin (G) for RPE1 cells transfected with control or TBC1D20 siRNA, cultured in serum-free medium, and stained with the antibodies against CEP164 and EEA1. n > 30 cells. All experiments were repeated at least three times. Scale bar, 5 µm.
Rab11 interacts with MICAL1 to promote F-actin depolymerization. (A) Immunofluorescence images for RPE1 cells transfected with control or TBC1D20 siRNAs, cultured in serum medium, and stained with the antibodies against CEP164 and Rab35. (B) Immunofluorescence images for RPE1 GFP-Rab35 cells transfected with control or TBC1D20 siRNAs, cultured in serum medium, and stained with the antibody against CEP164. (C) Immunofluorescence images for RPE1 tRFP-Rab8a cells transfected with control or TBC1D20 siRNAs, cultured in serum medium, and stained with the antibody against CEP164. (D and E) Immunofluorescence images (D) and quantification of the fluorescence intensity of transferrin (E) for RPE1 GFP-Rab11B cells transfected with control or TBC1D20 siRNA, cultured in serum-free medium, and stained with the antibody against EEA1. n > 30 cells. (F and G) Immunofluorescence images (F) and quantification of the fluorescence intensity of transferrin (G) for RPE1 cells transfected with control or TBC1D20 siRNA, cultured in serum-free medium, and stained with the antibodies against CEP164 and EEA1. n > 30 cells. All experiments were repeated at least three times. Scale bar, 5 µm.
In summary, our research demonstrates that TBC1D20 plays a critical role in regulating vesicle transport during ciliogenesis and maintaining the homeostasis of actin microfilaments around the centrosome. The underlying mechanism involves TBC1D20 functioning as a novel GAP for Rab11. In the absence of TBC1D20, GTP-bound Rab11 is transported to and accumulates near the centrosome via Myosin-Va. Subsequently, Myosin-Va recruits MICAL1, which interacts with Rab11 and activates its N-terminal MO domain. This activation leads to the depolymerization of F-actin and the release of PCV cargo near the centrosome, ultimately facilitating PCV docking at the distal appendage to initiate ciliogenesis (Fig. 6 J).
Discussion
Our study identifies TBC1D20 as a novel GTPase-activating protein (GAP) for Rab11, enhancing our understanding of the regulatory mechanisms underlying ciliogenesis. Depletion of TBC1D20 results in the accumulation of GTP-bound Rab11 vesicles at the mother centriole, promoting ciliogenesis in proliferating cells. Rab11 plays a crucial role in vesicle transport across intracellular membrane compartments, and its recruitment to the centrosome is dependent on the generation of PtdIns3P by phosphatidylinositol 3-kinase (PI3K-C2) and the appendage protein ODF2/cenexin (Franco et al., 2014; Hehnly et al., 2012). Subsequently, Rabin8 recruitment by Rab11 activates Rab8, contributing to ciliary membrane assembly (Nachury et al., 2007; Westlake et al., 2011). In addition, TBC1D20 depletion facilitates the docking of ciliary vesicles at the distal appendages, the removal of CP110, and the recruitment of EHD1. Although TBC1D20 also serves as a GAP for Rab1 and Rab2, their depletion does not inhibit ciliogenesis. Therefore, the effect of TBC1D20 depletion on ciliogenesis is unlikely to be mediated through the regulation of Rab1 or Rab2 (Murata et al., 2006; Oguchi et al., 2020; Sklan et al., 2007).
The centrosome serves as a key hub for both microtubule and actin filament organization, playing an essential role in ciliogenesis (Farina et al., 2016). Actin filament polymerization has been shown to inhibit primary cilium formation, while disrupting actin polymerization around the centrosome facilitates ciliogenesis by enabling membrane vesicle docking (Smith et al., 2020; Yan and Zhu, 2013). Our results demonstrate that TBC1D20 depletion leads to significant disassembly of F-actin around the centrosome. Although the direct interaction between TBC1D20 and F-actin has not been previously reported, we observed that GTP-Rab11 accumulates at the centrosome in TBC1D20-depleted cells, where it interacts with MICAL1. This interaction promotes F-actin disassembly (Bachmann-Gagescu et al., 2015; Lundquist et al., 2014). Furthermore, MICAL1 has been shown to interact with Rab8, regulating intracellular membrane tubule formation and protein transport (Lucken-Ardjomande Hasler et al., 2020). Previous studies have suggested that while Rab8 is not essential for the initial docking of ciliary vesicles to the mother centriole, it is involved in the extension of the ciliary membrane (Lu et al., 2015; Nachury et al., 2007). However, we did not observe significant ciliary elongation in serum-starved cells following TBC1D20 knockdown. This suggests that TBC1D20 may not directly influence Rab8 activity during ciliogenesis.
In summary, our findings reveal that TBC1D20 knockdown promotes early stages of ciliogenesis through Rab11 activation and F-actin disassembly. This study uncovers a novel function for TBC1D20 in ciliogenesis, highlighting its dual role in pre-ciliary vesicle trafficking and F-actin regulation. Moreover, mutations in TBC1D20 associated with WARBM suggest a potential link between ciliary dysfunction and disease pathogenesis, emphasizing the need for further investigation into ciliogenesis in disease models (Park et al., 2014).
Materials and methods
Plasmids and siRNAs
Human genes were amplified by PCR with reverse transcription (RT-PCR) from 293T cells and cloned into pENTR gateway vectors, then recombined into pGFP, pHA, or ptRFP destination vectors. The TBC1D20R105A and Rab11aQ70L, Rab11aS25N, Rab11bQ70L, and Rab11bS25N mutants were obtained using Quickchange (Agilent). For rescue experiments, siRNA-resistant versions of TBC1D20 WT and TBC1D20R105A were obtained by mutating 5 bp of the siRNA-targeting sequence using Quickchange (Agilent). PCR primer sequences are listed in Table S1. All point mutations were generated using Quickchange (Agilent). Human TBC1D20 siRNAs (#1: 5′-ACCCUCAGCUGCACUACUA-3′; #2: 5′-GGACUUGCCCUAUGAGACA-3′), human MICAL1 siRNA (5′-GAGUCCACGUCUCCGAUUU-3′) (Frémont et al., 2017), human FIP2 siRNA (#1: 5′-AGGAACAAUAUGACCGCAA-3′; #2: 5′-GCAUAUAUUUAGCGGGUAU-3′) (Walia et al., 2019), and negative control siRNAs (5′-UUCUCCGAACGUGUCACGU-3′) were synthesized by QingKe.
Cell culture and transfection
hTERT RPE1 cells were cultured in DMEM/F-12 (Gibco; Thermo Fisher Scientific) and HEK293 cells were cultured in DMEM (Gibco; Thermo Fisher Scientific), both supplemented with 10% fetal bovine serum (FBS) (ExCell Bio), 100 U/ml penicillin, and 100 mg/ml streptomycin. All cell types were maintained at 37°C in a 5% CO2 atmosphere. PCS2-3HA-TBC1D20 and PCS2-eGFP-TBC1D20 were transfected into cells using Lipofectamine 3000 (L3000015; Life). siRNAs transfections were performed using Lipofectamine RNAiMAX (13778150; Life). The final concentrations of siRNAs which dissolved in RNase-free water were 30–50 nM. After 48-h transfection, the cells were harvested and lysed in the buffer containing 2 × loading and RIPA (1:1), and the knockdown efficiency was verified by immunoblotting. All transfections were performed according to the manufacturer’s instructions.
CRISPR/Cas9 knockout cell lines
The CRISPR/Cas9 system was used to generate RPE1 MICAL1 knockout cell lines as previously described (Ran et al., 2013). The sgRNA sequences targeting human MICAL1 (sgRNA: 5′-CCCAGCGCATGCCCACTTTC-3′) were chosen based on their On-target and Off-target-scores using the webtool Benchling (https://benchling.com). The sgRNA was cloned into the Lenti-CRISPR-V2 vector, which contains expression cassettes for Cas9 and a puromycin resistance selectable gene.
Lentivirus packaging and infection
Lenti-CRISPR-V2, pDEST-GFP-Rab11a, and pDEST-GFP-Rab11b vectors were co-transfected with the viral packaging plasmid psPAX2 (#12260; Addgene) and the envelope plasmid pMD2.G (#12259; Addgene) into 293T cells. Lentivirus-containing supernatant was harvested and filtered through 0.22-μm filters, and 200 μl was added to target cells in 6-well plates. After 48 h, the infected cells were cultured in a selection medium containing puromycin or blasticidin. The stable cells were selected for 2 wk and validated by immunoblots or immunofluorescence.
Antibodies
The following antibodies were used for immunoblotting: rabbit anti-TBC1D20 (ab237685; Abcam), rabbit anti-MICAL1 (14818-1-AP; Proteintech), mouse anti-GAPDH (60004-1-Ig; Proteintech), mouse anti-α-tubulin (T6199; Sigma-Aldrich), mouse anti-His (H1029; Sigma-Aldrich), mouse anti-GST (554805; BD Pharmingen), mouse anti-GFP (11814460001; Roche), and rabbit anti-HA (51064-2-AP; Proteintech). The following antibodies were used for immunofluorescence experiments: rabbit anti-TBC1D20 (ab237685; Abcam), rabbit anti-MICAL1 (14818-1-AP; Proteintech), rabbit anti-Rab11a/b (15903-1-AP; Proteintech), rabbit anti-Rab11a (20229-1-AP; Proteintech), mouse anti-α-tubulin (T6199; Sigma-Aldrich),rabbit anti-CEP164 (22227-1-AP; Proteintech), chicken anti-CEP164 (Accogli et al., 2024), mouse anti-γ-tubulin (T6557; Sigma-Aldrich), rabbit anti-Myosin-Va (sc-365986; Santa Cruz), rabbit anti-Arl13b (17711-1-AP; Proteintech), mouse anti-Ace-tubulin (T7451; Sigma-Aldrich), rabbit anti-CP110 (12780-1-AP; Proteintech), rabbit anti-MKS3 (90103; BiCell Scientific), rabbit anti-IFT88 (13967-1-AP; Proteintech), rabbit anti-IFT140 (17460-1-AP; Proteintech), rabbit anti-PCNT (NBP1006107; Novus Biologicals), rabbit anti-PCM1 (19856-1-AP; Proteintech), and rabbit anti-EEA1 (3288T; CST). Secondary antibodies conjugated with Alexa-Fluor-488, -568, or -647 (Invitrogen) were used at dilution 1:1,000 for immunofluorescence analyses. Secondary antibodies conjugated with horseradish peroxidase (Solarbio) were used at 1:5,000 for immunoblotting.
Immunofluorescence microscopy
Cells were fixed in 4% paraformaldehyde for 15 min or cold methanol for 3 min and blocked with 1% BSA in PBS 0.1% Triton X-100, respectively, for 15 min followed by incubation with primary antibody in blocking solution for 1 h at RT or overnight at 4°C. Fluorophore-conjugated secondary antibodies were incubated for 30 min at RT. For visualization of actin filaments, cells were stained with rhodamine-conjugated phalloidin (Solarbio) for 30 min. Coverslips were mounted with DAPI (Yeasen) and examined with a Zeiss LSM710 confocal microscope. The fluorescent intensity was quantified by ImageJ.
Immunoprecipitation and immunoblotting
For immunoprecipitation, cells were lysed with IP lysis buffer (50 mM Tris-HCl PH 7.5, 150 mM NaCl, 1% Triton X-100, 10% glycerol) and supplemented with a protease inhibitor cocktail (Roche). Cell lysates were incubated with beads (AlpaLife Bio) at 4°C for 1.5 h, washed five times with IP lysis buffer, and then subjected to immunoblotting. For immunoblot analysis, the elution products or the cell lysate were denatured with SDS sample buffer, separated by SDS-PAGE, and transferred to 0.45-μm NC membranes (Merck). The NC membranes were blocked with 5% milk and incubated with antigen-specific primary antibodies followed by horseradish peroxidase-conjugated secondary antibodies. Proteins were visualized using the ECL system (Millipore).
Imaging of actin filaments
For immunostaining experiments, rhodamine-conjugated phalloidin and Lifeact were used to label actin filaments. WT or Lifeact-GFP RPE1 cells were cultured on coverslips in a 24-well plate and transfected with control or TBC1D20 siRNA for 48 h. Cells were fixed with 4% paraformaldehyde in PBS for 15 min, blocked in PBS containing 1% BSA and 0.1% Triton X-100 for 30 min, and incubated overnight at 4°C with anti-CEP164 antibody. The next day, WT cells were stained with Alexa Fluor conjugated secondary antibodies and rhodamine-conjugated phalloidin, while Lifeact-GFP cells were incubated with Alexa Fluor conjugated secondary antibodies for 45 min at RT.
For live-cell imaging experiments, actin filaments were visualized using either Lifeact or CellMask Actin Tracking Stains (A57248; Invitrogen). For Lifeact imaging, a stable cell line co-expressing Lifeact-mScarlet and GFP-CEP83 was established. Cells were cultured on 29-mm glass-bottom dishes (D29-14-1.5-N; Cellvis), transfected with siRNA for 48 h, and stained with Hoechst 33342 for 10 min at 37°C. Fluorescent images were captured using a Zeiss LSM710 confocal microscope equipped with a 63× 1.40 oil objective. The images are presented as maximum-intensity projections of z-stacks encompassing the entire cell. For CellMask Actin Tracker labeling, a stable cell line expressing tRFP-CEP83 was used. After siRNA transfection for 48 h, cells were incubated with CellMask Deep Red Actin Tracking Stains (1× concentration) for 1 h at 37°C, stained with Hoechst 33342 for 10 min, and washed three times. Live imaging was performed at 37°C using the same microscope setup, and images were processed as maximum-intensity projections.
TEM
Electron microscopy processing in RPE1 cells was carried out as previously described (Lu et al., 2012). Briefly, cells were fixed in a solution of 2% glutaraldehyde in 0.1 M sodium cacodylate buffer and post-fixed with 1% osmium tetroxide. After dehydration in graded ethanol, cells were embedded in EMbed 812 (Electron Microscopy Sciences), and 70-nm sections were cut using a Leica EM UC7 microtome. Electron micrographs were acquired using a transmission electron microscope (FEI T12).
Protein expression and purification
To generate the His-TBC1D20 (aa 1–362), His-TBC1D20R105A (aa 1–362), GST, GST-TBC1D20 (aa 1–362), GST-Rab11a, GST-Rab11b, His-Evi5, and GST-Rab7a plasmids, the coding sequences were cloned into the pET28a or pGEX-6P-3 vector. The proteins were expressed in E. coli BL21 (DE3) (QingKe) after induction with 0.5 mM IPTG for 24 h at 16°C and purified using nickel-nitrilotriacetic acid (Ni-NTA) metal affinity beads (30210; Qiagen) or Glutathione Sepharose (GE Healthcare). For His-Tagged proteins, the bacterial pellet was resuspended in lysis buffer (20 mM Tris-HCl pH 8.0, 300 mM NaCl, 0.05% Tween-20, 20 mM imidazole) and GST-Tagged protein in lysis buffer (50 mM Tris-HCl pH8.0, 0.5 mM EDTA, 1 mM DTT, 15 mM glutathione). Fractions containing protein monomers were pooled and stored at −80°C. Protein concentration was measured with Micronano and validated by SDS-PAGE followed by Coomassie staining or western blot analysis with an anti-His6 antibody (1:5,000; Pharmingen).
GST pulldown
For each GST pulldown assay, 5 μg of purified GST-Rab11a or GST proteins together with 5 μg of purified His-TBC1D20 protein were incubated with 30 ml of glutathione sepharose 4B in 1 ml of in vitro binding buffer (25 mM HEPES, pH 7.5, 100 mM KCl, 3 mM MgCl2, 1 mM EDTA, 10% glycerol, 0.1% NP-40, 1 mM DTT) at 4°C for 4 h. The beads were washed six times with in vitro binding buffer. Then, 30 μl 2 × loading buffer was added to the supernatant, and the samples were boiled at 98°C for 5 min. Finally, the supernatant was subjected to SDS-PAGE.
In vitro GAP assays
GAP assays were carried out using GTPase-Glo assay kit (V7681; Promega). Briefly, a 2 × GTP-GAP solution containing 10 µM GTP, 1 mM DTT, and the cognate GAP in GTPase/GAP buffer at twice the desired concentration was prepared. The concentration of GAP in this solution is twofold of the final concentration. Then, Rabs were diluted in GTPase/GAP Buffer, and 5 μl of the solution was dispensed into each well of a 384-well plate (3570; Corning). The GTPase reaction was initiated by adding 5 μl 2 × GTP-GAP solution into each well, resulting in a total reaction volume of 10 μl. After incubation at 25°C for 120 min, 10 μl of reconstituted GTPase-Glo reagent was added to the wells to terminate the GTP hydrolysis reactions, and the plate was incubated at 25°C for 30 min with shaking. Then, 20 μl of detection reagent was added and the plate was incubated for 10 min at room temperature. The luminescence signal was measured using an Enspire plate reader. Notably, Higher GTPase activity results in greater GTP hydrolysis, reducing the luminescence signal.
In another way, GTPase activity assays were carried out according to the instructions of the EnzChek Phosphate Assay Kit (E6646; Invitrogen), which provides a fast and sensitive spectrophotometric method for the continuous detection of phosphate released in enzymatic reactions. In brief, the indicated GTPase (4 μg) fusion proteins and 0.2 μl of 2 mM GTP (G8877; Sigma-Aldrich) were mixed in a 200 μl reaction volume, which contained 10 μl of 20 × reaction buffer, 40 μl of MESG substrate solution, 2 μl of purine nucleoside phosphorylase (1 U), and 144 μl of ddH2O. After incubation at 37°C for 1 h, the indicated purified GAP (2 μg) was added to the above reaction volume and mixed well, while an equal volume of ddH2O was used as the negative control. Finally, the absorbance at 360 nm (A360) was measured every 5 min using an Enspire plate reader to monitor the reaction over time.
Transferrin uptake
GFP-Rab11 or WT RPE1 cells were cultured on coverslips and grown overnight to the desired confluency. Cells were transfected with control or TBC1D20 siRNA for 48 h. To deplete intracellular transferrin, cells were starved in a serum-free medium containing 1% BSA at 37°C for 30 min. After removing the medium, cells were incubated in serum-free medium with 1% BSA and 50 μg/ml Alexa Fluor 568-conjugated transferrin (T23365; Invitrogen) at 37°C for various time points. At each time point, endocytosis was halted by placing the cells on ice and washing them three times with ice-cold PBS. Cells were then fixed with 4% paraformaldehyde for 15 min, blocked with PBS containing 1% BSA and 0.1% Triton X-100 for 30 min, and incubated with primary antibodies (EEA1 for GFP-Rab11B cells and EEA1/CEP164 for WT cells) overnight at 4°C. Subsequently, cells were stained with Alexa Fluor-conjugated secondary antibodies for 45 min at room temperature.
Statistics
The results are presented in all figures as the means ± SEM. Statistical analyses were performed with two-tailed unpaired Student’s t tests. (GraphPad Prism 9; *, P < 0.05, **, P < 0.01; ***, P < 0.001; ****, P < 0.0001; ns, no significance). Statistical parameters and significance (P value) are reported in the figures or the figure legends. All microscopic, biochemical, and biological assays were independently repeated at least three times.
Online supplemental material
Fig. S1 shows that TBC1D20 regulates the localization of ciliary proteins. Fig. S2 shows that TBC1D20 regulates Rab11-mediated vesicle transport. Fig. S3 shows that Rab11 regulates F-actin depolymerization at the centrosome. Fig. S4 shows that MICAL1 and Myosin-Va regulate vesicle unloading. Fig. S5 shows that Rab11 interacts with MICAL1 to promote F-actin depolymerization. Table S1 lists PCR primer sequences.
Data availability
The data is available from the corresponding author upon reasonable request.
Acknowledgments
We thank Xiangdong Li and Zhiqian Zhang for providing plasmids. We also thank Yingjie Jia and Zhen-Chuan Fan for their discussion and suggestions.
This work was supported by grants from the National Natural Science Foundation of China (32170695 and 31991193).
Author contributions: D. Zhai: Conceptualization, Formal analysis, Investigation, Methodology, Validation, Visualization, Writing - original draft, Writing - review & editing, L. Li: Formal analysis, Investigation, Validation, Writing - original draft, D. Wang: Formal analysis, Investigation, Validation, W. Wang: Formal analysis, Investigation, Validation, S. Zhao: Formal analysis, Investigation, Validation, X. Wang: Formal analysis, Methodology, Software, C. Chen: Formal analysis, Investigation, Validation, Z. Zhu: Formal analysis, Investigation, Validation, W. Bu: Formal analysis, Investigation, Validation, M. Yang: Formal analysis, Investigation, Validation, H. Yin: Formal analysis, Investigation, Validation, Y. Shan: Formal analysis, Investigation, Validation, H. Zhao: Resources, C.J. Westlake: Methodology, Writing - review & editing, Q. Lu: Conceptualization, Funding acquisition, Investigation, Methodology, Project administration, Supervision, Visualization, Writing - original draft, Writing - review & editing, J. Zhou: Conceptualization, Funding acquisition, Supervision, Writing - review & editing.

