


Microtubules play essential roles in diverse cellular processes and are important pharmacological targets for treating human disease. Here, we sought to identify cellular factors that modulate the sensitivity of cells to antimicrotubule drugs. We conducted a genome-wide CRISPR/Cas9-based functional genetics screen in human cells treated with the microtubule-destabilizing drug nocodazole or the microtubule-stabilizing drug paclitaxel. We further conducted a focused secondary screen to test drug sensitivity for ∼1,400 gene targets across two distinct human cell lines and to additionally test sensitivity to the KIF11 inhibitor, STLC. These screens defined gene targets whose loss enhances or suppresses sensitivity to antimicrotubule drugs. In addition to gene targets whose loss sensitized cells to multiple compounds, we observed cases of differential sensitivity to specific compounds and differing requirements between cell lines. Our downstream molecular analysis further revealed additional roles for established microtubule-associated proteins and identified new players in microtubule function.
Introduction
Microtubules are dynamic cytoskeletal polymers that serve as essential structural and force-generating elements in all eukaryotic cells. Microtubule assembly involves heterodimers of α-tubulin and β-tubulin associating in a head-to-tail fashion to form a polarized polymer, termed a protofilament, with each microtubule composed of 11–15 protofilaments (Chaaban et al., 2018). The microtubule minus end is often stabilized or anchored at specific cellular sites, whereas the plus ends can undergo growth and shortening (Chalfie and Thomson, 1982; Cueva et al., 2012; Desai and Mitchison, 1997; Kapitein and Hoogenraad, 2011). Microtubules are highly dynamic, undergoing spontaneous growth, shortening, and regrowth—a behavior termed “dynamic instability” (Mitchison and Kirschner, 1984). These intrinsic features of microtubules are further modulated by a network of microtubule-associated proteins to create differing microtubule behaviors, dynamics, and organization (reviewed in Akhmanova and Steinmetz [2015], Bodakuntla et al. [2019]), including creating differences between cell types and over the course of the cell cycle (Akhmanova and Steinmetz, 2015; Chaaban et al., 2018; Howes et al., 2017; Rusan et al., 2001). Established microtubule-associated proteins, including both molecular motors (dynein and kinesin-related proteins) and non-motor proteins, display a range of different properties and activities (Ishikawa, 2017; Karsenti et al., 2006; Lin and Nicastro, 2018; Nédélec et al., 2003).
Microtubules are also important pharmacological targets for treating human disease. During mitosis, even modest alterations to microtubule dynamics can lead to chromosome instability. As a result, mitotic cells are sensitive to antimicrotubule agents. For example, paclitaxel stabilizes microtubule polymers (Jordan et al., 1993; Parness and Horwitz, 1981; Schiff et al., 1979; Schiff and Horwitz, 1980; Yang and Horwitz, 2017), whereas nocodazole promotes microtubule catastrophes (De Brabander et al., 1976; Laisne et al., 2021; Vasquez et al., 1997), although we note that low-dose treatment of these compounds broadly affects dynamic instability but may not alter the total tubulin mass. Despite these opposing effects, each compound will disrupt proper chromosome alignment and mitotic progression. Tubulin-targeting drugs, such as Taxol/paclitaxel and vincristine, are frontline chemotherapeutics against various types of cancer, but the development of resistance to antimicrotubule drugs represents a substantial obstacle in cancer treatment (Čermák et al., 2020; Prassanawar and Panda, 2019; Zhou and Giannakakou, 2005).
Given the central roles of microtubules across diverse cellular processes, defining the complete network of proteins involved in microtubule regulation, dynamics, organization, and function is critical. The use of CRISPR/Cas9-based functional genetic screens has revolutionized the ability to identify the genes, pathways, and mechanisms involved in a biological process (Shalem et al., 2014; Wang et al., 2014). In our recent work, we used optical pooled screening to identify essential genes whose depletion results in dramatic alterations to microtubule assembly or organization (Funk et al., 2022). Here, as a complementary strategy to identify genes with roles in the microtubule cytoskeleton that impact cellular fitness, we conducted large-scale CRISPR/Cas9 functional screening in the presence of low doses of either the microtubule-destabilizing drug nocodazole (Vasquez et al., 1997), the microtubule-stabilizing drug paclitaxel (Arnal and Wade, 1995; Schiff and Horwitz, 1980; Yang and Horwitz, 2017), or the KIF11 inhibitor S-trityl-L-cysteine (STLC), which disrupts bipolar spindle assembly (Kaan et al., 2009; Wu et al., 2018).
Results and discussion
A genome-wide pooled functional genetic screen reveals modulators of microtubule drug sensitivity
To identify factors that modulate the sensitivity of cells to microtubule-based drugs, we conducted pooled genome-wide CRISPR/Cas9-based screening in cultured human cells (Fig. 1 A). For this initial screen (primary screen—low-dose), we compared the growth behavior of untreated leukemia-derived K562 cells with cells grown in the presence of either the microtubule-destabilizing drug nocodazole or the microtubule-stabilizing drug paclitaxel (Fig. 1 B). To identify both enhancers and suppressors of drug sensitivity, we used minimal drug concentrations in which growth was only modestly affected (aiming for a ∼5% reduction in growth rate). We conducted the screen over 14 population doublings, with drug-containing media changed every 2 days. High-throughput sequencing of the single guide RNA (sgRNA) representation in the terminal timepoint relative to the population at day 0 allowed us to generate a CRISPR score indicative of the fitness consequence of targeting each gene (Fig. 1 A and Table S1) (Shalem et al., 2014; Wang et al., 2014). A negative CRISPR score indicates that the elimination of the corresponding gene results in reduced cell proliferation or survival, with strongly negative scores (less than −1) consistent with an essential requirement for the gene under the tested growth conditions. Reciprocally, a positive score indicates that the targeted cells proliferate more quickly or survive more robustly than other cells in the population, which includes suppressors of drug treatment.

Large-scale functional genetics screens reveal modulators of antimicrotubule drug sensitivity. (A) Schematic showing the workflow for the pooled CRISPR screen. (B) Schematic showing the effects of microtubule drugs (nocodazole and paclitaxel) on microtubule dynamics. (C) The curve illustrating the CRISPR score of fitness conferring and growth enhancer genes upon treatment with either nocodazole or paclitaxel. (D) Scatter plot showing the CRISPR scores in untreated versus nocodazole-treated cell pools. (E) Scatter plot showing the CRISPR scores in untreated versus paclitaxel-treated cell pools. (F) Table showing the CRISPR scores of selected iKO in high concentrations of nocodazole or paclitaxel. (G) Autosomal start and end positions (from GRCH38.p12) of genes (black lines) with CRISPR score >1.5, P < 0.05 in 250 nM nocodazole (suppressors) on chromosome 1 were obtained from BioMart and plotted in R (for illustration of all chromosomes see Fig. S1 B); expected versus observed fractions of hits on between the end of chromosome 1 and KIF2C, or between KIF2C and the centromere. Expected fractions were calculated by assuming an even distribution of hits across the chromosome 1 length. (H) Scatter plot illustrating the differential CRISPR scores across all gene targets in the secondary screen. The differential was calculated between nocodazole and untreated and paclitaxel and untreated K562 cell pools. (I) Scatter plot illustrating the differential CRISPR scores across all gene targets in the secondary screen. The differential was calculated between nocodazole and untreated and paclitaxel and untreated HeLa cell pools.
Large-scale functional genetics screens reveal modulators of antimicrotubule drug sensitivity. (A) Schematic showing the workflow for the pooled CRISPR screen. (B) Schematic showing the effects of microtubule drugs (nocodazole and paclitaxel) on microtubule dynamics. (C) The curve illustrating the CRISPR score of fitness conferring and growth enhancer genes upon treatment with either nocodazole or paclitaxel. (D) Scatter plot showing the CRISPR scores in untreated versus nocodazole-treated cell pools. (E) Scatter plot showing the CRISPR scores in untreated versus paclitaxel-treated cell pools. (F) Table showing the CRISPR scores of selected iKO in high concentrations of nocodazole or paclitaxel. (G) Autosomal start and end positions (from GRCH38.p12) of genes (black lines) with CRISPR score >1.5, P < 0.05 in 250 nM nocodazole (suppressors) on chromosome 1 were obtained from BioMart and plotted in R (for illustration of all chromosomes see Fig. S1 B); expected versus observed fractions of hits on between the end of chromosome 1 and KIF2C, or between KIF2C and the centromere. Expected fractions were calculated by assuming an even distribution of hits across the chromosome 1 length. (H) Scatter plot illustrating the differential CRISPR scores across all gene targets in the secondary screen. The differential was calculated between nocodazole and untreated and paclitaxel and untreated K562 cell pools. (I) Scatter plot illustrating the differential CRISPR scores across all gene targets in the secondary screen. The differential was calculated between nocodazole and untreated and paclitaxel and untreated HeLa cell pools.
Targeting the vast majority of genes resulted in similar overall fitness effects in both control and drug-treated populations (Fig. 1, C–E), with an R2 of 0.64 for control versus nocodazole-treated cells and 0.68 for control versus paclitaxel-treated cells. However, a subset of gene targets displayed altered cellular fitness in the presence of microtubule drugs (Fig. 1, C–E). This includes diverse factors involved in microtubule-related and cell division–related functions, such as kinetochore proteins, spindle assembly checkpoint components, mitotic kinases, microtubule-associated proteins, and microtubule-based motors. Similarly, based on a gene set enrichment analysis (Table S2), we observed an enrichment of genes related to the cell division machinery including the terms “spindle,” “kinetochore microtubule,” and “chromosome centromere region.” We also found significant enrichment for categories that include splicing components, consistent with work from our lab and others that eliminating splicing factors results in mitotic defects (Funk et al., 2022). Although many gene targets displayed similar compromised growth in the presence of either paclitaxel or nocodazole, some targets displayed differential behavior between the two drugs (Fig. S1 A). Gene targets with substantially altered growth in at least one drug condition were selected for further analysis, as described below.

Visualization of additional screen output. (A) Scatter plot illustrating the differential CRISPR scores across all gene targets in the primary screen. The differential was calculated between nocodazole and untreated and paclitaxel and untreated K562 cell pools. (B) Autosomal start and end positions (from GRCH38.p12) of genes (black lines) with CRISPR score >1.5, P < 0.05 in 250 nM nocodazole (suppressors) were obtained from BioMart and plotted in R. (C) Scatter plot showing the CRISPR scores in untreated versus nocodazole treated HeLa cell pools from the secondary screen. (D) Scatter plot showing the CRISPR scores in untreated versus paclitaxel-treated HeLa cell pools from the secondary screen. (E) Scatter plot showing the CRISPR scores in untreated versus STLC-treated HeLa cell pools from the secondary screen. (F and G) Scatter plots showing the differential CRISPR scores in treated versus untreated HeLa and K562 cells. The differential was calculated between nocodazole and untreated (F) and paclitaxel and untreated cell pools (G). (H) Scatter plot showing the CRISPR scores in untreated versus nocodazole-treated K562 cell pools. (I) Scatter plot showing the CRISPR scores in untreated versus paclitaxel treated K562 cell pools. (J) Scatter plot showing the CRISPR scores in untreated versus STLC treated K562 cell pools.
Visualization of additional screen output. (A) Scatter plot illustrating the differential CRISPR scores across all gene targets in the primary screen. The differential was calculated between nocodazole and untreated and paclitaxel and untreated K562 cell pools. (B) Autosomal start and end positions (from GRCH38.p12) of genes (black lines) with CRISPR score >1.5, P < 0.05 in 250 nM nocodazole (suppressors) were obtained from BioMart and plotted in R. (C) Scatter plot showing the CRISPR scores in untreated versus nocodazole treated HeLa cell pools from the secondary screen. (D) Scatter plot showing the CRISPR scores in untreated versus paclitaxel-treated HeLa cell pools from the secondary screen. (E) Scatter plot showing the CRISPR scores in untreated versus STLC-treated HeLa cell pools from the secondary screen. (F and G) Scatter plots showing the differential CRISPR scores in treated versus untreated HeLa and K562 cells. The differential was calculated between nocodazole and untreated (F) and paclitaxel and untreated cell pools (G). (H) Scatter plot showing the CRISPR scores in untreated versus nocodazole-treated K562 cell pools. (I) Scatter plot showing the CRISPR scores in untreated versus paclitaxel treated K562 cell pools. (J) Scatter plot showing the CRISPR scores in untreated versus STLC treated K562 cell pools.
Loss of KIF2C/MCAK acts as a dose-sensitive suppressor for growth in nocodazole
In addition to our analysis of drug sensitivity in the presence of modest levels of antimicrotubule drugs, we also conducted a genome-wide screen for gene targets that were able to confer resistance to increased drug concentrations (primary screen—high dose). To identify such suppressors, we gradually increased the drug concentration during each passage of the cells, ultimately reaching a concentration of 250 nM nocodazole or 15 nM paclitaxel. Based on the change in relative sgRNA abundance in the presence and absence of drug treatment, the most potent suppressor of drug sensitivity was the kinesin-13 family member KIF2C/MCAK, whose loss resulted in a strong suppression of nocodazole sensitivity (Fig. 1 F). In contrast, we did not identify clear suppressors of high-dose paclitaxel treatment.
KIF2C binds to microtubule plus ends to accelerate microtubule depolymerization (Howard and Hyman, 2007; Walczak et al., 2013; Wang et al., 2015). Thus, loss of KIF2C is predicted to result in more stable microtubules and buffer cells from perturbations that induce microtubule disassembly, such as nocodazole. Consistent with this model, at low drug concentrations, we found that KIF2C knockouts displayed increased growth in nocodazole (with a score of 1.52; Fig. 1 D) but enhanced sensitivity in low-dose paclitaxel (score of −1.86; Fig. 1 E), consistent with a model in which KIF2C-depleted cells have more stable microtubules and therefore cannot tolerate additional stabilizing treatments. Reciprocally, the KIF2C inhibitory protein GTSE1 (Bendre et al., 2016) displayed reduced growth in nocodazole (−0.91), but was also sensitive to paclitaxel treatment (−2.66).
To identify additional suppressors of nocodazole sensitivity, we surveyed gene targets that were non-essential in untreated cells but displayed improved fitness following high-dose nocodazole treatment (250 nM). Surprisingly, we observed that the majority of nocodazole suppressors were spatially clustered on chromosome 1. In particular, these suppressors were located between KIF2C and the centromere on the p-arm of chromosome 1 with a substantial enrichment of hits compared with a random distribution (Fig. 1 G and Fig. S1 B). Based on the observed clustering, we hypothesize that targeting these genes with sgRNAs results in Cas9-mediated DNA cleavage, which in the absence of DNA repair would lead to the loss of the arm of chromosome 1 containing KIF2C. Although such events likely occur at a low frequency, nocodazole treatment may select for cells with heterozygous loss of the p-arm of chromosome 1 due to the potent suppressive effect of Kif2C depletion on nocodazole-mediated toxicity. This chromosome arm loss and suppression behavior has also been observed by others (Ashoti et al., 2022; Cullot et al., 2019) and underscores its relevance for CRISPR screens with potent dose-sensitive suppressors, in which Cas9-mediated chromosome arm cleavage may contribute to false positives. Together, these results demonstrate that the loss of KIF2C acts as a robust suppressor of the microtubule-destabilizing drug nocodazole.
Secondary screening identifies modulators of drug sensitivity across diverse conditions
To validate the fitness behaviors observed in the primary screen and identify factors that suppress or enhance the antiproliferative effects of antimicrotubule drug treatment, we next conducted a secondary screen targeting a reduced set of 1,411 genes composed of established cell division components, genes that displayed differential growth in nocodazole or paclitaxel in the primary screen (Fig. 1, D and E; and Fig. S1 A), and additional control factors (Table S3 and Fig. S1, C–J). For this analysis, we conducted CRISPR/Cas9 screens in both the suspension cell line, K562 (Fig. 1 H), and the adherent human cervical cancer cell line, HeLa (Fig. 1 I). In each case, we tested the fitness effects of targeting these genes in the presence of low doses of nocodazole or paclitaxel. Repeating the screen with this smaller library size allowed us to evaluate reproducibility and extend this analysis across a wide range of conditions. Because we were able to grow cells at a more optimal lower density compared with the primary screen, lower starting drug concentrations were sufficient to obtain the desired 5% growth inhibition. For these secondary screens, we additionally tested growth in low doses of the KIF11 inhibitor STLC. The additional analysis of growth in STLC also provides insights into the requirements for mitotic spindle formation. For instance, the well-characterized kinesin-related proteins, KIF2C and KIF18B, each displayed unanticipated sensitivity to STLC (Fig. S1, E and J). Together, these datasets provide rich information across a range of comparisons (Fig. S1, C–J and Table S3), including identifying enhancers and suppressors of the different drug treatments, gene targets that result in differential effects between drug treatments, and differences between cell lines.
Among these gene targets and growth properties, we selected genes that displayed unexpected behaviors or had not been previously implicated in microtubule-related functions for in-depth analysis. In particular, we selected two established players in microtubule function, KIF15 and DLGAP5/HURP, and five genes with less established roles (hyaluronan-mediated motility receptor [HMMR], SAM and HD domain–containing protein 1 [SAMHD1], HN1, HN1L, and CARNMT1).
Loss of KIF15 and DLGAP5 leads to the formation of monopolar spindles upon nocodazole treatment
Our pooled Cas9-based screens indicated that loss of the kinesin-12 family member KIF15 (also known as Hklp2; Drechsler et al., 2014; Vanneste et al., 2009) and the microtubule-associated protein DLGAP5 (also called HURP; Perez-Bertoldi et al., 2024, Preprint) sensitized cells to nocodazole treatment (Fig. 2 A). To test the functions of KIF15 and DLGAP5, we conditionally eliminated each gene using a doxycycline-inducible Cas9-based system (McKinley and Cheeseman, 2017; McKinley et al., 2015) to generate inducible knockout (iKO) HeLa cell lines. Based on the analysis of cell biological phenotypes in individual cells for thousands of gene targets, our prior work found this strategy to be highly effective with negligible off-target effects (Funk et al., 2022; McKinley and Cheeseman, 2017), with each imaged cell reflecting an independent Cas9-based cutting and repair event. We also performed Tracking of Indels by Decomposition (TIDE) analysis to verify the frequency of guide cutting and knockout efficiency (see Materials and methods). Using immunofluorescence analysis, we found that iKO of either KIF15 or DLGAP5 resulted in a modest increase in the frequency of chromosome alignment errors, particularly off-axis chromosomes (Fig. 2, B–D).

Analysis of KIF15 and DLGAP5 i KO s. (A) Secondary screen CRISPR score of KIF15 and DLGAP5 iKOs in HeLa and K562 cells. (B) Representative Z-projected deconvolved immunofluorescence images of mitotic cells of control, KIF15, or DLGAP5 iKO HeLas treated with either nocodazole, paclitaxel, or STLC. Microtubules (DM1α), DNA (DAPI). Scale bar: 9 µm. (C) Percentage of cells with mitotic defects in control or KIF15 iKO, treated with nocodazole (noc), paclitaxel (pac), or STLC. n > 300 cells per condition, across three experimental replicates. (D) Percent of cells with mitotic defects after iKO of DLGAP5, treated with nocodazole, paclitaxel, or STLC. n > 300 cells per condition, across three experimental replicates. (E) Quantification of total spindle tubulin signal in control, KIF15, or DLGAP5 iKO HeLas. n = 71, 60, 96 across three experimental replicates. See Fig. S3 A for representative images. (F) Quantification of total EB1 signal in KIF15 iKO and DLGAP5 iKO HeLa cells. n = 71, 60, 96 across three experimental replicates. Statistical tests performed: Welch’s t test (ns = not significant, ****P = <0.0001). Blue lines indicate the median.
Analysis of KIF15 and DLGAP5 i KO s. (A) Secondary screen CRISPR score of KIF15 and DLGAP5 iKOs in HeLa and K562 cells. (B) Representative Z-projected deconvolved immunofluorescence images of mitotic cells of control, KIF15, or DLGAP5 iKO HeLas treated with either nocodazole, paclitaxel, or STLC. Microtubules (DM1α), DNA (DAPI). Scale bar: 9 µm. (C) Percentage of cells with mitotic defects in control or KIF15 iKO, treated with nocodazole (noc), paclitaxel (pac), or STLC. n > 300 cells per condition, across three experimental replicates. (D) Percent of cells with mitotic defects after iKO of DLGAP5, treated with nocodazole, paclitaxel, or STLC. n > 300 cells per condition, across three experimental replicates. (E) Quantification of total spindle tubulin signal in control, KIF15, or DLGAP5 iKO HeLas. n = 71, 60, 96 across three experimental replicates. See Fig. S3 A for representative images. (F) Quantification of total EB1 signal in KIF15 iKO and DLGAP5 iKO HeLa cells. n = 71, 60, 96 across three experimental replicates. Statistical tests performed: Welch’s t test (ns = not significant, ****P = <0.0001). Blue lines indicate the median.
Based on the behaviors observed in the functional genetics screens, we next tested the effects of combining KIF15 or DLGAP5 knockouts with antimicrotubule drug perturbations. Interestingly, although low-dose nocodazole only modestly compromised spindle organization on its own, loss of either KIF15 or DLGAP5 led to a ∼50% increase in the frequency of monopolar spindles following nocodazole addition (Fig. 2 C). In our genome-wide screen, we observed an increased CRISPR score for KIF15 and decreased fitness for DLGAP5 in paclitaxel-treated cells (Fig. 1 E and Fig. 2 A). Consistent with this differing drug sensitivity, we found that low-dose paclitaxel treatment modestly reduced the frequency of chromosome alignment errors in KIF15 knockout cells but resulted in an increased proportion of multipolar spindles in DLGAP5 knockout cells (Fig. 2, B–D). Finally, targeting either KIF15 or DLGAP5 resulted in a substantially increased fraction of monopolar spindles upon treatment with STLC compared with control cells. For KIF15, this is in agreement with previous findings in which KIF15 becomes indispensable for spindle formation when KIF11 is perturbed (Drechsler et al., 2014) and its established role in bipolar spindle formation (Tanenbaum et al., 2009). Based on the quantification of total tubulin fluorescence, we found that the microtubule intensity of the mitotic spindle was reduced by 39% in KIF15-depleted cells and 45% in DLGAP5-depleted cells when compared with control cells (Fig. 2 E and Fig. S2 A). This was also the case in the presence of nocodazole (Fig. S2 B) but not in paclitaxel-treated cells (Fig. S2 C). We quantified the total level of EB1 as a proxy for the relative level of microtubule dynamics on the spindle (Akhmanova and Steinmetz, 2008; Nehlig et al., 2017; Telley et al., 2011). Although we observed higher EB1 total signal in fixed cells for DLGAP5 iKO cells (Fig. 2 F), we did not observe dramatic changes in the speed of EB3 comets in live cells (Fig. S2, D and E) or defects in microtubule organization or abundance in interphase HeLa cells (not shown). A decrease in the total amount of microtubules at a consistent EB3 speed could suggest an increase in depolymerization. However, we note that limitations in our imaging prevented us from analyzing all aspects of microtubule dynamics such as the catastrophe frequency and rescue events.

Analysis of identified hits. (A) Representative max intensity projection of undeconvolved immunofluorescence images of iKO HeLa cells for control, KIF15, or DLGAP5. Stained for microtubules or DNA. Quantified in Fig. 2 E. Scale bar: 5 µm. (B) Quantification of total tubulin immunofluorescence signal in the KIF15 and DLGAP5 iKO HeLa cells treated with nocodazole (noc). n = 73, 70, 61 across three experiments. (C) Quantification of total spindle tubulin immunofluorescence signal in iKO HeLa cells for control, KIF15 or DLGAP5 treated with paclitaxel (pac). n = 66, 73, 66 across three experiments. (D) Mitotic EB3 speed quantification in control, KIF15 or DLGAP5 iKO HeLa cells expressing td-Tomato EB3. n = 82, 148, 111 kymographs, n = 19, 25, 22 cells across three experiments. (E) Interphase EB3 speed quantification in control, KIF15 or DLGAP5 iKO HeLa cells expressing td-Tomato EB3. n = 82, 148, 111, n = 30, 30, 30 cells across three experiments. (F) Interphase EB3 speed quantification in control, HMMR, or SAMHD1 iKO HeLa cells expressing td-Tomato EB3. n = 86, 171, 142 kymographs, n = 30, 30, 32 cells across three experiments. (G) Mitotic EB3 speed quantification in control, HMMR, or SAMHD1 iKO HeLa cells expressing td-Tomato EB3. n = 82, 110, 130 kymographs, n = 20, 19, 23 cells across three experiments. (H) Representative max intensity projection of undeconvolved immunofluorescence images of iKO HeLa cells for control, HMMR, or SAMHD1. Stained for microtubules or DNA. Quantified in Fig. 3 F. Scale bar: 5 µm. (I) Quantification of total mitotic spindle tubulin immunofluorescence signal in the HMMR and SAMHD1 iKO HeLa cells treated with nocodazole. n = 73, 69, 67 across three experimental replicates. (J) Quantification of total mitotic spindle tubulin immunofluorescence in the HMMR and SAMHD1 iKO HeLa cells treated with paclitaxel. n = 60, 61, 60 across three experimental replicates. (K) Representative confocal image of an interphase HeLa cells showing the localization of GFP-tagged SAMHD1. Scale bar: 5 µm. Statistical tests performed: Welch’s t test (***P = <0.001, ****P = <0.0001). Blue lines indicate the median.
Analysis of identified hits. (A) Representative max intensity projection of undeconvolved immunofluorescence images of iKO HeLa cells for control, KIF15, or DLGAP5. Stained for microtubules or DNA. Quantified in Fig. 2 E. Scale bar: 5 µm. (B) Quantification of total tubulin immunofluorescence signal in the KIF15 and DLGAP5 iKO HeLa cells treated with nocodazole (noc). n = 73, 70, 61 across three experiments. (C) Quantification of total spindle tubulin immunofluorescence signal in iKO HeLa cells for control, KIF15 or DLGAP5 treated with paclitaxel (pac). n = 66, 73, 66 across three experiments. (D) Mitotic EB3 speed quantification in control, KIF15 or DLGAP5 iKO HeLa cells expressing td-Tomato EB3. n = 82, 148, 111 kymographs, n = 19, 25, 22 cells across three experiments. (E) Interphase EB3 speed quantification in control, KIF15 or DLGAP5 iKO HeLa cells expressing td-Tomato EB3. n = 82, 148, 111, n = 30, 30, 30 cells across three experiments. (F) Interphase EB3 speed quantification in control, HMMR, or SAMHD1 iKO HeLa cells expressing td-Tomato EB3. n = 86, 171, 142 kymographs, n = 30, 30, 32 cells across three experiments. (G) Mitotic EB3 speed quantification in control, HMMR, or SAMHD1 iKO HeLa cells expressing td-Tomato EB3. n = 82, 110, 130 kymographs, n = 20, 19, 23 cells across three experiments. (H) Representative max intensity projection of undeconvolved immunofluorescence images of iKO HeLa cells for control, HMMR, or SAMHD1. Stained for microtubules or DNA. Quantified in Fig. 3 F. Scale bar: 5 µm. (I) Quantification of total mitotic spindle tubulin immunofluorescence signal in the HMMR and SAMHD1 iKO HeLa cells treated with nocodazole. n = 73, 69, 67 across three experimental replicates. (J) Quantification of total mitotic spindle tubulin immunofluorescence in the HMMR and SAMHD1 iKO HeLa cells treated with paclitaxel. n = 60, 61, 60 across three experimental replicates. (K) Representative confocal image of an interphase HeLa cells showing the localization of GFP-tagged SAMHD1. Scale bar: 5 µm. Statistical tests performed: Welch’s t test (***P = <0.001, ****P = <0.0001). Blue lines indicate the median.
Taken together, these results validate the KIF15 and DLGAP5 knockout growth behavior observed in the primary and secondary screens (Fig. 1) and show that bipolar spindle formation in each of these knockouts is highly sensitive to microtubule depolymerization. In addition, the differential growth behavior between nocodazole and paclitaxel treatment observed in KIF15 knockout cells, as well as the reduced microtubule polymer levels, suggests that KIF15 may play roles in modulating microtubule dynamics beyond its established function in spindle pole separation.
Implication of HMMR and SAMHD1 in microtubule organization
Amongst the additional factors that altered growth in the presence of antimicrotubule drugs, we selected the microtubule-associated HMMR protein and SAMHD1 for further analysis. HMMR is a non-motor adaptor protein that contributes to mitotic spindle assembly by stabilizing kinetochore fibers (Chen et al., 2018; Manning and Compton, 2008). SAMHD1 is a deoxynucleotide triphosphate triphosphohydrolase that plays a role during viral infection (Beloglazova et al., 2013; Goldstone et al., 2011; White et al., 2013) but has not been implicated previously in microtubule dynamics. In the pooled screens, loss of HMMR sensitized cells to both nocodazole and paclitaxel treatment, whereas loss of SAMHD1 sensitized cells to nocodazole and STLC treatment (Fig. 3 A).

Analysis of: HMMR and SAMHD1 i KO s. (A) Table showing the secondary screen CRISPR score of HMMR and SAMHD1 iKOs in HeLa and K562 cells. (B) Representative Z-projected deconvolved immunofluorescence images of mitotic cells of control, HMMR, or SAMHD1 iKO in HeLas treated with nocodazole, paclitaxel, or STLC. Microtubules (DM1α), DNA (DAPI). Scale bar: 9 µm. (C) Percentage of mitotic cells with mitotic defects in control or after iKO of HMMR, treated with either nocodazole (noc), paclitaxel (pac), or STLC, n > 300 cells per condition, across three experimental replicates. (D) Percentage of mitotic cells with mitotic defects after iKO of SAMHD1, treated with nocodazole, paclitaxel, or STLC. n > 300 cells per condition, across three experimental replicates. (E) Quantification of total EB1 immunofluorescence signal in control, HMMR, or SAMHD1 iKO HeLa cells. n = 94, 86, 51 across three experimental replicates. (F) Quantification of total spindle tubulin immunofluorescence in the HMMR and SAMHD1 iKO HeLa cells. n = 61, 69, 62 across three experimental replicates. See Fig. S2 H for representative images. Statistical tests performed: Welch’s t test (***P = <0.001, ****P = <0.0001). Blue lines indicate the median.
Analysis of: HMMR and SAMHD1 i KO s. (A) Table showing the secondary screen CRISPR score of HMMR and SAMHD1 iKOs in HeLa and K562 cells. (B) Representative Z-projected deconvolved immunofluorescence images of mitotic cells of control, HMMR, or SAMHD1 iKO in HeLas treated with nocodazole, paclitaxel, or STLC. Microtubules (DM1α), DNA (DAPI). Scale bar: 9 µm. (C) Percentage of mitotic cells with mitotic defects in control or after iKO of HMMR, treated with either nocodazole (noc), paclitaxel (pac), or STLC, n > 300 cells per condition, across three experimental replicates. (D) Percentage of mitotic cells with mitotic defects after iKO of SAMHD1, treated with nocodazole, paclitaxel, or STLC. n > 300 cells per condition, across three experimental replicates. (E) Quantification of total EB1 immunofluorescence signal in control, HMMR, or SAMHD1 iKO HeLa cells. n = 94, 86, 51 across three experimental replicates. (F) Quantification of total spindle tubulin immunofluorescence in the HMMR and SAMHD1 iKO HeLa cells. n = 61, 69, 62 across three experimental replicates. See Fig. S2 H for representative images. Statistical tests performed: Welch’s t test (***P = <0.001, ****P = <0.0001). Blue lines indicate the median.
In iKO cell lines, we found that HMMR knockout led to a ∼20% increase in the frequency of off-axis chromosomes, consistent with prior reports (Chen et al., 2018). Treatment of HMMR iKO cells with low-dose nocodazole caused a further ∼20% increase in cells with off-axis chromosomes and other spindle defects. However, we observed the most dramatic effect upon treatment with low-dose paclitaxel, which led to an ∼20% increase in the proportion of cells with multipolar spindles, many with four to five spindle poles (Fig. 3, B and C). In SAMHD1 knockouts, we observed a reduction in lagging chromosomes upon paclitaxel treatment, but no significant changes in the frequency of chromosome segregation errors in nocodazole-treated cells (Fig. 3, B and D). We also quantified the total EB1 signal in fixed mitotic cells and observed an increase in EB1 intensity in HMMR knockout cells and a modest decrease in the SAMHD1 knockout (Fig. 3 E). However, the speed of EB3 in live cells did not appear to be dramatically affected (Fig. S2, F and G). The microtubule mass on the spindle was reduced by 41% in HMMR-depleted cells, and we observed a small, but significant tubulin intensity difference in SAMHD1-depleted cells when compared with controls (Fig. 3 F and Fig. S2 H). We noted similar behavior in the presence of nocodazole but not paclitaxel (Fig. S2, I and J). Future studies may provide additional insights into the precise roles of these proteins in microtubule dynamics and spindle function. Together, these results highlight the contributions of HMMR and SAMHD1 to mitotic spindle function, activities that are particularly revealed in the presence of modest perturbations to microtubule dynamics. We also note that SAMHD1 does not show apparent localization to microtubule structures (Fig. S2 K), suggesting that it acts indirectly to influence microtubule behavior.
HN1L–hematological and neurological expressed 1 (HN1) double knockout increases nocodazole sensitivity and paclitaxel resistance
In the primary screen, targeting of HN1) also known as JPT1) led to substantially reduced growth in the presence of both paclitaxel and nocodazole (Fig. 4 A). However, we did not observe similarly strong phenotypes for HN1-targeted cells in the secondary screen (Fig. 4 A). We reasoned that this experimental variability could reflect partial redundancy between HN1 and HN1L (also known as JPT2). Both proteins share sequence similarities with each other and with HN1/Jupiter homologs across species (Fig. S3 A). We found that GFP fusions with either HN1 or HN1L localized to both interphase microtubules and mitotic spindle microtubules (Fig. 4 B). Although this microtubule association had not been tested previously in human cells, this is consistent with the microtubule localization and direct microtubule-binding activity reported for the Drosophila HN1/HNL1 homolog Jupiter (Karpova et al., 2006).

Analysis of HN1 and HN1L double knock-out cells. (A) Table showing the primary and secondary screen CRISPR score of HN1 or HN1L iKOs in K562 cells. (B) Representative confocal immunofluorescence images of mitotic metaphase and interphase HeLa cells showing the localization of GFP-tagged HN1 and HN1L proteins, Scale bar: 5 µm. (C) Percentage of mitotic cells with mitotic defects in control and after HN1+HN1L double iKO, treated with nocodazole (noc), paclitaxel (pac), or STLC. n > 100 cells per condition, across three experimental replicates. (D) Representative Z-projected deconvolved immunofluorescence images of mitotic cells of HN1+HN1L double iKO in HeLas treated with nocodazole, paclitaxel, or STLC. Microtubules (DM1α), DNA (DAPI). Scale bar: 10 µm. (E) Left: Live confocal stills of td-Tomato EB3 expressing control or HN1+HN1L double iKO HeLa cells; middle: max projection over 30 s middle; right: representative kymographs generated from region highlighted by red arrows. Scale bars: 5 µm/2 µm (kymograph). (F) EB3 speed quantification in control, HN1, HN1L, or HN1/HN1L double iKO HeLa cells. n = 93, 103, 104, 127 kymographs, n > 31 cells across three experimental replicates. (G) Quantification of total spindle tubulin signal in the control or HN1+HN1L double iKO HeLa cells. n = 70, 59 across three experimental replicates. (H) Quantification of total EB1 immunofluorescence in control or HN1+HN1L double iKO HeLa cells. N = 76, 75 across three experimental replicates. Statistical tests performed: Welch’s t test (ns = not significant, ***P = <0.001, ****P = <0.0001). Blue lines indicate the median.
Analysis of HN1 and HN1L double knock-out cells. (A) Table showing the primary and secondary screen CRISPR score of HN1 or HN1L iKOs in K562 cells. (B) Representative confocal immunofluorescence images of mitotic metaphase and interphase HeLa cells showing the localization of GFP-tagged HN1 and HN1L proteins, Scale bar: 5 µm. (C) Percentage of mitotic cells with mitotic defects in control and after HN1+HN1L double iKO, treated with nocodazole (noc), paclitaxel (pac), or STLC. n > 100 cells per condition, across three experimental replicates. (D) Representative Z-projected deconvolved immunofluorescence images of mitotic cells of HN1+HN1L double iKO in HeLas treated with nocodazole, paclitaxel, or STLC. Microtubules (DM1α), DNA (DAPI). Scale bar: 10 µm. (E) Left: Live confocal stills of td-Tomato EB3 expressing control or HN1+HN1L double iKO HeLa cells; middle: max projection over 30 s middle; right: representative kymographs generated from region highlighted by red arrows. Scale bars: 5 µm/2 µm (kymograph). (F) EB3 speed quantification in control, HN1, HN1L, or HN1/HN1L double iKO HeLa cells. n = 93, 103, 104, 127 kymographs, n > 31 cells across three experimental replicates. (G) Quantification of total spindle tubulin signal in the control or HN1+HN1L double iKO HeLa cells. n = 70, 59 across three experimental replicates. (H) Quantification of total EB1 immunofluorescence in control or HN1+HN1L double iKO HeLa cells. N = 76, 75 across three experimental replicates. Statistical tests performed: Welch’s t test (ns = not significant, ***P = <0.001, ****P = <0.0001). Blue lines indicate the median.
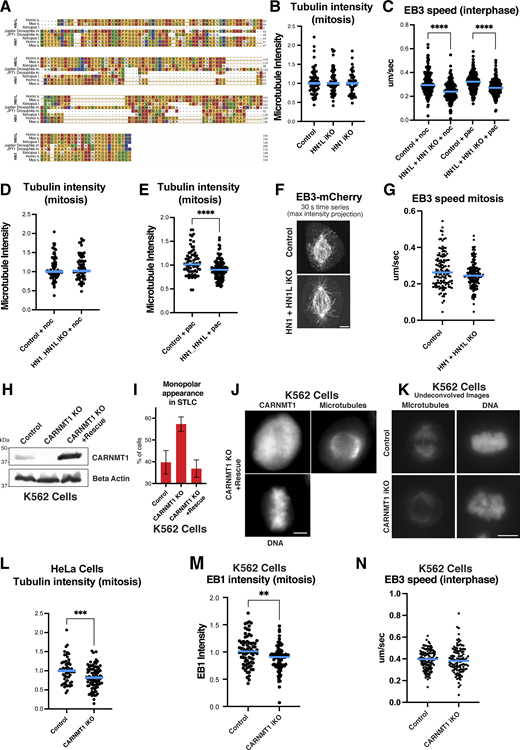
Analysis of identified hits 2. (A) Clustal analysis of HN1, HN1L homologs across species. (B) Quantification of total spindle tubulin immunofluorescence signal in control, HN1, or HN1L iKO HeLa cells. n = 64, 70, 62 across three experimental replicates. (C) EB3 speed quantification in control or HN1+HN1L double iKO HeLa cells treated with nocodazole (noc) or paclitaxel (pac). n = 171, 188, 170, 162 kymographs, n = 31, 33, 32, 33 cells across three experiments. (D) Quantification of total mitotic spindle tubulin signal in the control or HN1+HN1L double iKO HeLa cells treated with nocodazole. n = 71, 72 across three experiments. (E) Quantification of total spindle tubulin signal in the HN1+HN1L double iKO HeLa cells treated with paclitaxel. n = 71, 72 across three experiments. (F) Live confocal image of td-Tomato EB3 in HeLa cells expressing control or HN1+HN1L double iKO. Stills were max projected over 30 s. Scale bar: 2 µm (G) Quantification of EB3 speed of cells in F n = 60, 63 kymographs, n = 24, 25 cells across three experiments. (H) Western blot of control, CARMT1 knockout, or CARNMT1 knock-out K562 cells expressing hardened CARNMT1 rescue construct probed for CARNMT1 or β-actin. (I) Percentage of cells appearing as monopolar in control, CARNMT1 knockout, or CARNMT1 knock-out K562 cells expressing hardened CARNMT1 rescue construct after STLC treatment. n > 100 cells each in three experiments. (J) Immunofluorescence images of CARNMT1 knock-out K562 cells expressing hardened CARNMT1 rescue construct stained for CARNMT1, tubulin, and DNA. Scale bar: 5 µm. (K) Representative max intensity projection of undeconvolved immunofluorescence images of iKO K562 s for control or CARNMT1. Stained for microtubules or DNA. Quantified in Fig. 5 F. (L) Quantification of mitotic spindle tubulin signal in control or CARNMT1 iKO HeLas. n = 58, 64 across three experiments. (M) Quantification of total EB1 immunofluorescence in control or CARNMT1 iKO K562 s. n > 60 across three experimental replicates. (N) Interphase EB3 speed quantification in control or CARNMT1 iKO K562 s expressing td-Tomato EB3. n = 130, 111 kymographs, n = 34, 35 cells across three experiments. Statistical tests performed: Welch’s t test (**P = <0.01, ***P = <0.001, ****p = <0.0001). Blue lines indicate the median. Source data are available for this figure: SourceData FS3.
Analysis of identified hits 2. (A) Clustal analysis of HN1, HN1L homologs across species. (B) Quantification of total spindle tubulin immunofluorescence signal in control, HN1, or HN1L iKO HeLa cells. n = 64, 70, 62 across three experimental replicates. (C) EB3 speed quantification in control or HN1+HN1L double iKO HeLa cells treated with nocodazole (noc) or paclitaxel (pac). n = 171, 188, 170, 162 kymographs, n = 31, 33, 32, 33 cells across three experiments. (D) Quantification of total mitotic spindle tubulin signal in the control or HN1+HN1L double iKO HeLa cells treated with nocodazole. n = 71, 72 across three experiments. (E) Quantification of total spindle tubulin signal in the HN1+HN1L double iKO HeLa cells treated with paclitaxel. n = 71, 72 across three experiments. (F) Live confocal image of td-Tomato EB3 in HeLa cells expressing control or HN1+HN1L double iKO. Stills were max projected over 30 s. Scale bar: 2 µm (G) Quantification of EB3 speed of cells in F n = 60, 63 kymographs, n = 24, 25 cells across three experiments. (H) Western blot of control, CARMT1 knockout, or CARNMT1 knock-out K562 cells expressing hardened CARNMT1 rescue construct probed for CARNMT1 or β-actin. (I) Percentage of cells appearing as monopolar in control, CARNMT1 knockout, or CARNMT1 knock-out K562 cells expressing hardened CARNMT1 rescue construct after STLC treatment. n > 100 cells each in three experiments. (J) Immunofluorescence images of CARNMT1 knock-out K562 cells expressing hardened CARNMT1 rescue construct stained for CARNMT1, tubulin, and DNA. Scale bar: 5 µm. (K) Representative max intensity projection of undeconvolved immunofluorescence images of iKO K562 s for control or CARNMT1. Stained for microtubules or DNA. Quantified in Fig. 5 F. (L) Quantification of mitotic spindle tubulin signal in control or CARNMT1 iKO HeLas. n = 58, 64 across three experiments. (M) Quantification of total EB1 immunofluorescence in control or CARNMT1 iKO K562 s. n > 60 across three experimental replicates. (N) Interphase EB3 speed quantification in control or CARNMT1 iKO K562 s expressing td-Tomato EB3. n = 130, 111 kymographs, n = 34, 35 cells across three experiments. Statistical tests performed: Welch’s t test (**P = <0.01, ***P = <0.001, ****p = <0.0001). Blue lines indicate the median. Source data are available for this figure: SourceData FS3.
Knockout of either HN1 or HN1L alone did not result in increased chromosome segregation defects or altered microtubule intensity (data not shown; Fig. S3 B). Thus, to test for redundancy between HN1 and HN1L, we simultaneously eliminated both proteins. We found that HN1+HN1L double knockouts displayed a mild increase in chromosome segregation defects compared with controls for both untreated cells and in the presence of nocodazole or paclitaxel (Fig. 4, C and D). In addition, we analyzed the consequences of microtubule dynamics by imaging the plus-end tracking protein EB3. EB3 speed in interphase was not affected in the HN1 or HN1L single knockouts. In contrast, EB3 speed was increased in a modest, but statistically significant manner in the combined HN1+HN1L double knockout in interphase cells (Fig. 4, E and F). In addition, EB3 speed was sensitized to treatment with low-dose nocodazole or paclitaxel, with the microtubule plus ends in the HN1+HN1L double knockout moving more slowly than control (Fig. S3 C). In mitotic cells, we observed a decrease in total tubulin signal in cells treated with paclitaxel and a decrease in EB1 signal in fixed cells but did not observe dramatic changes in microtubule behavior in untreated cells otherwise (Fig. 4 G and Fig. S3, C–H). These behaviors suggest that the combined loss of HN1 and HN1L leads to modest changes in spindle microtubule dynamics in interphase, but not in mitosis. Future studies to test the role of these microtubule-associated proteins in microtubule dynamics in vivo and using reconstituted systems will be valuable to fully elucidate their function. Together, our work implicates the Jupiter homologs HN1 and HN1L as non-essential microtubule-localized proteins that contribute to optimal microtubule behavior and dynamics.
CARNMT1 promotes microtubule stability
As both nocodazole and paclitaxel disrupt chromosome segregation, many gene knockouts displayed similar sensitivity to treatment with both of these compounds (Fig. 1, H and I). However, as these drugs have opposing effects on microtubule stability, factors that modulate microtubule dynamics are predicted to have different growth effects in the presence of these drugs. For example, we found that the microtubule-destabilizing motor KIF2C/MCAK suppressed nocodazole treatment, but modestly enhanced paclitaxel treatment in K562 cells (Fig. 1 H). We therefore sought to analyze other gene targets that displayed differential growth behaviors. The loss of carnosine N-methyltransferase 1 (CARNMT1 or C9orf41) led to opposing growth behavior in nocodazole and paclitaxel, with increased fitness in paclitaxel-treated cells and decreased fitness in nocodazole-treated cells (Fig. 5 A). From these data, we predicted that CARNMT1 stabilizes microtubules.

Analysis of CARNMT1 knock-out cells. (A) Table showing the secondary screen CRISPR score of CARNMT1 iKO in HeLa and K562 cells. (B) Representative confocal images of mitotic and interphase HeLa cells showing the localization of GFP-tagged CARNMT1. Scale bar: 2 µm. (C) Representative Z-projected deconvolved images of control or CARNMT1 iKO K562 cells with nocodazole, paclitaxel, or STLC. Microtubules (DM1α), DNA (DAPI). Scale bar: 9 µm. (D) Percentage of mitotic cells without mitotic defects in control or CARNMT1 iKO, treated with nocodazole (noc) or paclitaxel (pac). n > 300 cells per condition, across three experiments. (E) Percentage of cells displaying monopolar spindle in control or CARNMT1 iKO in STLC. n > 300 cells per condition, across three experiments. (F) Quantification of total spindle tubulin immunofluorescence signal in control or CARNMT1 iKO in K562 s. n = 58, 64 across three experimental replicates. For representative images, see Fig. S3 K. (G) Quantification of total spindle tubulin immunofluorescence in the CARNMT1 iKO K562 cells treated with nocodazole. n = 62, 63 across three experimental replicates. (H) Quantification of total spindle tubulin immunofluorescence in the CARNMT1 iKO K562 cells treated with paclitaxel. n = 62, 61 across three experimental replicates. Statistical tests performed: Welch’s t test (ns = not significant, ****p = <0.0001). Blue lines indicate the median.
Analysis of CARNMT1 knock-out cells. (A) Table showing the secondary screen CRISPR score of CARNMT1 iKO in HeLa and K562 cells. (B) Representative confocal images of mitotic and interphase HeLa cells showing the localization of GFP-tagged CARNMT1. Scale bar: 2 µm. (C) Representative Z-projected deconvolved images of control or CARNMT1 iKO K562 cells with nocodazole, paclitaxel, or STLC. Microtubules (DM1α), DNA (DAPI). Scale bar: 9 µm. (D) Percentage of mitotic cells without mitotic defects in control or CARNMT1 iKO, treated with nocodazole (noc) or paclitaxel (pac). n > 300 cells per condition, across three experiments. (E) Percentage of cells displaying monopolar spindle in control or CARNMT1 iKO in STLC. n > 300 cells per condition, across three experiments. (F) Quantification of total spindle tubulin immunofluorescence signal in control or CARNMT1 iKO in K562 s. n = 58, 64 across three experimental replicates. For representative images, see Fig. S3 K. (G) Quantification of total spindle tubulin immunofluorescence in the CARNMT1 iKO K562 cells treated with nocodazole. n = 62, 63 across three experimental replicates. (H) Quantification of total spindle tubulin immunofluorescence in the CARNMT1 iKO K562 cells treated with paclitaxel. n = 62, 61 across three experimental replicates. Statistical tests performed: Welch’s t test (ns = not significant, ****p = <0.0001). Blue lines indicate the median.
Prior work found that CARNMT1 is responsible for synthesizing anserine by methylation of carnosine (Cao et al., 2018). Both carnosine and anserine are abundant dipeptides in vertebrate skeletal muscles and are suggested to serve as proton buffers and radical scavengers (Drozak et al., 2015). CARNMT1 localizes to the nucleus in interphase HeLa cells and diffuses throughout the cell in mitotic cells (Fig. 5 B). In addition, based on immunoprecipitation experiments, we were unable to identify robust interaction partners for CARNMT1 (data not shown). Thus, if CARNMT1 acts to alter microtubule dynamics, it would function indirectly instead of directly associating with microtubule polymers.
In HeLa cells, CARNMT1 knockouts did not display dramatic changes in the frequency of chromosome segregation errors or changes in the microtubule polymerization rate in interphase cells (data not shown). In our secondary screen, CARNMT1 depletion in K562 cells led to a stronger sensitization to nocodazole than CARNMT1 depletion in HeLa cells (Fig. 5 A). Therefore, we generated CARNMT1 iKOs in K562 cells. We observed that the loss of CARNMT1 led to a modest increase in chromosome segregation defects in comparison with controls, including the presence of chromosome bridges and lagging chromosomes, and increased sensitivity to STLC (Fig. 5, C–E). Expression of a sgRNA-resistant (“hardened”) version of the CARNMT1 cDNA was able to rescue these phenotypes for the knockout following STLC treatment (Fig. 5, H–J). CARNMT1 knockout also resulted in a modest decrease in the microtubule mass in the spindle (Fig. 5 F; and Fig. S3, K and L). Importantly, these segregation defects were enhanced in the presence of low doses of nocodazole with the majority of cells displaying highly scattered chromosomes and a 50% decrease in the total spindle microtubule mass (Fig. 5, C–F). This difference was further enhanced in the presence of nocodazole but not in low-dose paclitaxel (Fig. 5, G and H). Reciprocally, CARNMT1 overexpression led to a slight increase in microtubule mass in the spindle (data not shown). Quantification of EB1 in CARNMT1 knock-out K562 cells revealed only a small reduction in total EB1 intensity without a dramatic change in EB3 speed in live cells (Fig. S3, M and N). Overall, these results suggest that CARNMT1 acts indirectly to influence microtubule dynamics by acting as a net microtubule-stabilizing factor.
Identification of factors that modulate microtubule behavior
Prior studies on microtubule-associated proteins have mostly focused on loss-of-function phenotypes that result in dramatic changes in microtubule assembly and organization (Lindwall and Cole, 1984; Maiato et al., 2003; Mandelkow et al., 1995; Ramkumar et al., 2018). Such approaches are valuable, but likely missed molecular players with non-essential roles in spindle formation that do not result in dramatic defects on their own. Such proteins would still play important roles in microtubule function under specific physiological circumstances, such as in the presence of acute cellular stress, in specific cell types, or following treatment with antimicrotubule compounds such as those that are routinely used in cancer treatment. Our functional genetic studies provide a resource of gene targets whose loss has the potential to modulate the sensitivity to altered microtubule dynamics. Using these approaches, we identified contributions from several established and novel players to spindle function in human cells. In addition, analyzing cellular phenotypes in a sensitized background using low doses of antimitotic compounds allowed us to reveal contributions to spindle formation and chromosome segregation that would be missed in an unperturbed background. Importantly, the requirements for these factors and others vary between cell lines and across different antimicrotubule drugs, highlighting the diversity of cellular pathways that contribute to robust spindle function and cell division. Finally, by analyzing the localization of the identified gene targets, our work implicates both direct (microtubule-localized) and indirect (for example, nuclear-localized SAMHD1 and CARNMT1) contributions to microtubule function. Our identification of interphase and mitotic microtubule localization for HN1 and HN1L suggests that these may serve as effective markers for detecting microtubules in live cells, similar to the prior use of Drosophila Jupiter (Karpova et al., 2006; Legent et al., 2015; Takeda et al., 2018). Together, our large-scale analysis provides an important resource for considering mitotic spindle function and the factors that may modulate chemotherapeutic drug treatment.
Materials and methods
Cell culture
HeLa cells (transformed human female cervical epithelium; source: Cheeseman lab) were cultured in Dulbecco’s modified Eagle medium (DMEM) supplemented with 10% fetal bovine serum (FBS), 100 U/ml penicillin and streptomycin, and 2 mM L-glutamine at 37°C with 5% CO2. Doxycycline inducible cell lines were cultured in a medium containing FBS certified as tetracycline-free and were induced by the addition of doxycycline hyclate to 1 µg/ml for 4 days. Other drugs used on HeLa cells were nocodazole (40 nM; Sigma-Aldrich), paclitaxel (5 nM; Invitrogen), and STLC (300 nM; Sigma-Aldrich). The nocodazole and paclitaxel drug treatment was performed for 3 h whereas the STLC treatment was for 16–17 h. Hela cells were regularly monitored for mycoplasma contamination using commercial detection kits.
K562 cells (CCL-243; ATCC) were cultured in RPMI-1640 medium supplemented with 10% FBS, 100 U/ml penicillin, and streptomycin at 37°C with 5% CO2. Doxycycline inducible cell lines were cultured in a medium containing FBS certified as tetracycline-free and were induced by the addition of doxycycline hyclate to 1 µg/ml for 4 days. Other drugs used on these cells were nocodazole (25 nM) and paclitaxel (5 nM). The nocodazole and paclitaxel drug treatment was done for 3 h while the STLC (350 nM) treatment was for 16–17 h. K562 cells were regularly monitored for mycoplasma contamination using commercial detection kits.
Pooled CRISPR screens
The specific details for the CRISPR screen are included below. For an extended protocol, see also Adelmann et al. (2019).
Generation of lentiviral sgRNA libraries
A validation library comprising 14,989 unique sgRNA sequences targeting 1,406 genes was constructed (Table S1). Genes were chosen based on their differential growth in the initial genome-wide CRISPR screen (either synthetic lethal interactions or increased fitness) and also included established cell division components and all sgRNAs from an existing genome-wide library (#1000000100; Addgene) targeting each gene in the subset were included in the validation library (10 sgRNAs for most genes). 975 non-targeting control sgRNAs were included, as well as four targeting control sgRNAs resulting in defined numbers of double-strand breaks (CTRL1-AAVS1, CTRL1-HS1, CTRL1-HS15, and CTRL-HS4 [van den Berg et al., 2018]). An upstream adapter was prepended (5′-TATCTTGTGGAAAGGACGAAACACC-3′) and a downstream adapter was appended (5′-GTTTAAGAGCTATGCTGGAAACAGCATAGC-3′). The library was synthesized as an oligo pool (Agilent). 100 fmol of library per 50 μl PCR reaction was amplified using Q5 HotStart DNA Polymerase (M0493S; New England Biolabs) in eight reactions with a 50–62°C gradient annealing step using the following program:
1 cycle 98°C 2 min
16 cycles 98°C 10 s
50–62°C 15 s
72°C 15 s
1 cycle 72°C 2 min
1 cycle 10°C hold.
An aliquot of each reaction was visualized on a 2% agarose gel, and all reactions with the appropriate molecular weight product were combined and cleaned using the DNA Clean and Concentrator 5 kit (D4013; Zymo Research). 10 µg LentiCRISPRv2-opti (#163126; Addgene) was digested and dephosphorylated for 3 h in a 60 μl reaction at 37°C with FastDigest Esp3I and FastAP (FD0454 and EF0654; Thermo Fisher Scientific, respectively). Digested DNA was cleaned using the DNA Clean and Concentrator 5 kit. Insert and digested vector (5 ng: 100 ng per 20 μl reaction) were assembled in three separate reactions for 15 min at 50°C or 55°C using the NEBuilder HiFi DNA Assembly Master Mix (E2621S; New England Biolabs) alongside a control reaction omitting the insert. Background assembly was measured by transformation of NEB 5-α competent cells (C2987I; New England Biolabs) before cleanup of the assembly reactions using AmpureXP magnetic beads (A63880; Beckman Coulter). Cleaned assembly reactions were electroporated into Endura Electrocompetent cells (60242-1; Biosearch Technologies) according to the manufacturer’s instructions and plated on LB-Lennox 250 × 250 mm square bioassay dishes supplemented with 75 µg/ml carbenicillin. Serial dilutions of each electroporation were plated to estimate library coverage. Cells were incubated overnight at 30°C, collected, and plasmid DNA was prepared using the ZymoPURE II Plasmid DNA Maxiprep kit (D4202; Zymo Research). Three electroporations were mixed proportionally to their electroporation efficiency for a combined total library coverage of ∼27-fold. High-throughput sequencing libraries were prepared as in the sequencing library preparation section below using the secondary forward amplification and Read 1 sequencing primers and common reverse amplification and Index sequencing primers. The cycle number was lowered to 14 cycles, and 10 ng template was used per 50 μl reaction.
Lentivirus production
For large-scale lentiviral preparation, HEK-293T (CRL-3216; ATCC) cells were seeded at a density of 750,000 cells/ml per 175 cm2 flask in 20 ml DMEM (Thermo Fisher Scientific) supplemented with 10% FBS (#100-106; GeminiBio) and 100 U/ml penicillin–streptomycin. After 24 h, the media was changed to viral production medium: IMDM (#1244053; Thermo Fisher Scientific) supplemented with 20% inactivated fetal serum (#100-106; GeminiBio). 32 h after seeding, cells were transfected with a mix containing 76.8 μl Xtremegene-9 transfection reagent (#06365779001; Sigma-Aldrich), 3.62 µg pCMV-VSV-G (Plasmid #8454; Addgene), 8.28 µg psPAX2 (Plasmid #12260; Addgene), and 20 µg sgRNA plasmid and Opti-MEM (#11058021; Thermo Fisher Scientific) to a final volume of 1 ml. Media was changed 16 h later to a fresh viral production medium. At 48 h after transfection, the virus was collected and filtered through a 0.45-µm filter, aliquoted, and stored at −80°C until use.
Genome-Wide CRISPR screen
Lentivirus containing the genome-wide lentiviral sgRNA library (#1000000100; Addgene) was used to transduce 500 million K562 cells as previously described (Adelmann et al., 2019) to maintain 1,000-fold coverage of the sgRNA library. Cells were passaged into fresh RPMI-1640 complete medium supplemented with puromycin (3 µg/ml) 2 days after transduction and selected for 3 days. Pellets of 100 million cells were frozen at the endpoint of puromycin selection to assess initial sgRNA library representation. Cells were allowed to recover without puromycin for 2 days before being passaged every 2 days for 14 population doublings under the indicated condition untreated, low nocodazole (25–30 nM), low paclitaxel (2.5–3 nM), high nocodazole (increasing concentrations from 37.5 to 250 nM), and high paclitaxel (increasing concentrations from 3.75 to 15 nM). Pellets of 100 million cells (untreated, low nocodazole, and low paclitaxel) or 5 million cells (high nocodazole and high paclitaxel) were frozen at the endpoint of the screen to assess final sgRNA library representation under each condition.
Secondary CRISPR screens
For secondary screening of K562 cells, lentivirus containing the targeted lentiviral sgRNA library (Table S3) was used to transduce 35 million K562 cells. Cells were passaged into fresh RPMI-1640 complete medium supplemented with puromycin (3 µg/ml) 2 days after transduction and selected for 6 days. Pellets of 5 million cells were frozen at the endpoint of puromycin selection to assess initial sgRNA library representation. Cells were passaged every 2 days for 14 population doublings under the indicated condition untreated, low nocodazole (15–30 nM), low paclitaxel (1.5–3 nM), or STLC (500–770 nM). Pellets of 5 million cells were frozen at the endpoint of the screen to assess the final sgRNA library representation under each condition.
For secondary screening of HeLa cells, a lentivirus containing the targeted lentiviral sgRNA library was used to transduce 39 million HeLa cells. Cells were passaged into fresh DMEM complete medium supplemented with puromycin (0.4 µg/ml) 2 days after transduction and selected for 4 days. Pellets of 5 million cells were frozen at the endpoint of puromycin selection to assess initial sgRNA library representation. Cells were passaged every 2 days for 14 population doublings under the indicated condition untreated, low nocodazole (15–25 nM), low paclitaxel (1.0–1.5 nM), or STLC (125–375 nM). Pellets of 5 million cells were frozen at the endpoint of the screen to assess the final sgRNA library representation under each condition.
Sequencing library preparation
From pellets of 100 million cells, genomic (g)DNA was extracted using the QIAamp DNA Blood Maxiprep Kit (Qiagen) according to manufacturer’s instructions with the following modifications: 500 μl of a 10 mg/ml solution of ProteinaseK (#311587001; MilliporeSigma) in water was used in place of QIAGEN Protease; incubation with ProteinaseK and Buffer AL was performed overnight; centrifugation steps after Buffer AW1 and AW2 were performed for 2 and 5 min, respectively; gDNA was eluted for 5 min using 1 ml of water preheated to 70°C, followed by centrifugation for 5 min. Pellets of five million cells were extracted using the Blood genomicPrep mini spin kit (Cytiva) according to the manufacturer’s instructions, except that cells were lysed at 56°C overnight, and gDNA was eluted twice consecutively with 30 μl of water preheated to 70°C. gDNA concentration was determined using the Qubit dsDNA HS Assay kit (#Q32851; Thermo Fisher Scientific).
All PCRs were performed in 50 μl reactions using ExTaq Polymerase (#RR001B; Takara Bio) with the following program:
1 cycle 95°C 5 min
28 cycles 95°C 10 s
60°C 15 s
72°C 45 s
1 cycle 72°C 5 min
1 cycle 4°C hold.
Using the following primers:
Forward (genome-wide): 5′-AATGATACGGCGACCACCGAGATCTACACGAATACTGCCATTTGTCTCAAGATCTA-3′
Forward (secondary): 5′-AATGATACGGCGACCACCGAGATCTACACCCCACTGACGGGCACCGGA-3′
Reverse: 5′-CAAGCAGAAGACGGCATACGAGATCnnnnnnTTTCTTGGGTAGTTTGCAGTTTT-3′,
where “nnnnnn” denotes the barcode used for multiplexing.
For all samples, 1, 3, or 6 µg of gDNA was initially amplified for 28 cycles in 50 μl test PCR reactions. For the initial and depletion screen samples, an additional 300 µg of gDNA was used in 50 reactions per sample. For enrichment screens, 27 µg gDNA was subsequently amplified using 6 µg input per reaction. Reactions were pooled and 200 μl of each reaction was purified using AMPure XP magnetic beads (#A63880; Beckman Coulter), eluted with 20 μl water, and quantified using the Qubit dsDNA HS Assay kit prior to sequencing for 50 cycles on an Illumina Hiseq 2500 using the following primers:
Read 1 sequencing primer (genome-wide): 5′-CGGTGCCACTTTTTCAAGTTGATAACGGACTAGCCTTATTTTAACTTGCTATTTCTAGCTCTAAAAC-3′
Read 1 sequencing primer (secondary): 5′-GTTGATAACGGACTAGCCTTATTTAAACTTGCTATGCTGTTTCCAGCATAGCTCTTAAAC-3′
Index sequencing primer: 5′-TTTCAAGTTACGGTAAGCATATGATAGTCCATTTTAAAACATAATTTTAAAACTGCAAACTACCCAAGAAA-3′.
Cell line generation
The cell lines used in this study are described in Table 1. Retrovirus was generated by transfecting 2.5 µg of VSVG packaging plasmid and 5 µg pBABE-based vectors (described in Table 2) into 4 million HEK293-GP cells (Source: Cheeseman Lab) in 300 μl Buffer EC with 16 μl Enhancer and 60 μl Effectene Transfection Reagent (301425; Qiagen). Supernatant-containing retrovirus was sterile-filtered, supplemented with 20 µg/ml polybrene (Millipore), and used to transduce HeLa and K562 containing inducible Cas9. Transduced HeLa and K562 cells were selected with 250 µg/ml hygromycin (Invitrogen) to generate polyclonal cell lines. HeLa and K562 expressing td-Tomato EB3 (pER2) monoclonal cell lines were generated by FACS from the polyclonal cell lines.
List of cell lines
| Name | Transfection | Resistance | Cell line number |
|---|---|---|---|
| HeLa EB3-tdTomato-cas9 | Retrovirus | Puromycin/Hygromycin | cER20 |
| K562 EB3-tdTomato-cas9 | Retrovirus | Puromycin/Hygromycin | cER12 |
| DLGAP5 iKO | Lentivirus | Puromycin/Hygromycin | cER35 (K562), cER37 (HeLa) |
| HMMR iKO | Lentivirus | Puromycin/Hygromycin | cER33 (K562), cER36 (HeLa) |
| SAMDH1 iKO | Lentivirus | Puromycin/Hygromycin | cER35 (K562), cER38 (HeLa) |
| Kif15 iKO | Lentivirus | Puromycin/Hygromycin | cER13 (HeLa), cER22 (K562) |
| HN1 iKO | Lentivirus | Puromycin/Hygromycin | cER17 (HeLa), cER26 (K562) |
| HN1L iKO | Lentivirus | Puromycin/Hygromycin | cER16 (HeLa), cER25 (K562) |
| HN1/HN1L double knockout | Lentivirus | Puromycin/Hygromycin | cER39 (HeLa) |
| CARNMT1 iKO | Lentivirus | Puromycin/Hygromycin | cER15 (HeLa), cER24 (K562) |
sgRNA sequences
| Gene | sgRNA target sequence (5′-3′) | Knockout efficiency (%) |
|---|---|---|
| KIF15 | TCAGGAGAAACAGAAAGAGA | 84 |
| DLGAP5 | CGAATTGCTCAGCCCCACCA | 65.8 |
| HMMR | AGGGAAAATAGCCCAACTGG | 76.1 |
| SAMHD1 | TGATTCGGACGAGGAGAGGG | 36.1 |
| HN1 | GGCACAGGCGCAGCAGGCAC | 68.9 |
| HN1L | GGTGCTGTCGAGTCTGCACG | 78.9 |
| CARNMT1 | GGGCTCCTTACCCGTAGTAG | 88.4 |
| HS1 | GCCGATGGTGAAGTGGTAAG | n/a |
Lentiviral production and transduction were performed as described previously (McKinley, 2018; McKinley and Cheeseman, 2017; McKinley et al., 2015). Briefly, HEK293-T (CRL-3216; ATCC) cells were seeded into 15-cm dishes at a density of 100,000 cells/cm2. After 1 day, cells were transfected with pMD2.G (#12259; Addgene), psPAX2 (#12260; Addgene), and a lentiviral transfer plasmid (2:3:4 ratio by mass) using Lipofectamine 3000 (L3000015; Thermo Fisher Scientific). Viral supernatant was harvested 48 h after transfection and filtered through 0.45-µm cellulose acetate filters (431220; Corning). Transduced HeLa and K562 cells were selected with puromycin (Invitrogen) or blasticidin (Invitrogen) as indicated in Table 1 to generate polyclonal cell lines.
Immunofluorescence and microscopy
Cells for immunofluorescence were seeded on poly-L-lysine (Sigma-Aldrich)–coated coverslips and fixed (for the microtubules staining) with 4% formaldehyde in PHEM (60 mM PIPES, 25 mM HEPES, 10 mM EGTA, and 4 mM MgSO4) or ice-cold methanol (for the EB1 staining) for 10 min followed by plus 4% formaldehyde for in PBS 10 min. Coverslips were washed with PBS plus 0.1% Triton X-100 and blocked in Abdil (20 mM Tris-HCl, 150 mM NaCl, 0.1% Triton X-100, 3% bovine serum albumin, 0.1% NaN3, pH 7.5) for 1 h. Primary antibodies (α-Tubulin [DM1A] Mouse mAb #3873 [Cell Signaling] 1:2,000, mouse anti-EB1 [610535; BD Transduction Laboratories] 1:300, mouse anti C9orf41 TA501299 [Origene] 1:100) were diluted in Abdil. The primary antibody incubation was done for 1 h at room temperature or overnight at 4°C. Cy3 (715-165-150)- and Alexa647 (715-605-150)-conjugated secondary antibodies (Jackson ImmunoResearch Laboratories) were diluted 1:300 in PBS plus 0.1% Triton X-100. The secondary antibody incubation was performed for 1 h. DNA was stained with DAPI. Coverslips were mounted using VECTASHIELD Antifade Mounting Medium with DAPI (Vector Laboratories). Immunofluorescence images of iKO cell lines were acquired on a DeltaVision Core deconvolution microscope (Cytiva) using a 60×/1.42NA objective, equipped with a CoolSnap HQ2 charge-coupled device camera, and deconvolved where appropriate. For microtubule intensity quantification, 75 z-sections at 0.2-mm intervals were taken.
For EB3 live cell imaging, cells were seeded into 96-well glass-bottomed plates (Cellvis) and imaged using a Dragonfly 505 spinning-disk confocal microscope (Andor Technologies) equipped with a piezo Z-stage (ASI) and an iXon Ultra 888 EMCCD camera. Live cells were imaged in a humidified chamber (OKO labs) maintained at 37°C and 5% (vol/vol) CO2 using a 100× oil immersion objective NA 1.45 (MRD01905; Nikon) (pixel size 121 × 121 nm). tdTomato-labeled samples were imaged using a 561-nm excitation and a 594/43 emission filter. Image analysis was performed in Fiji (ImageJ, National Institutes of Health).
Protein localization
For the CARNMT1 localization, we used the pCG006 plasmid (pKC254 C9orf41 cDNA [4278547; IMAGE]). For HN1L localization, we used the pCG018 plasmid (pKC54 HN1L cDNA [5296086; IMAGE]). For HN1 localization, we used a HN1-GFP stable cell line that was made using pCB48 (HN1 cDNA [3140086; IMAGE]). For SAMHD1 localization, we used pER09 plasmid (81899; IMAGE).
Western blotting
Cells expressing sgRNAs were induced in 1 μg/ml doxycycline for 3 days before lysis in Laemmli buffer and incubated at 95°C for 5 min. Samples were separated by SDS-PAGE and wet-transferred to polyvinylidene difluoride membranes. Membranes were blocked for 30 min in blocking buffer (5% milk in TBS with 0.1% Tween-20) before incubation with mouse anti C9orf41 TA501299 (Origene) 1:2,000. This was followed by HRP-conjugated secondary antibody (R1005; Kindle Biosciences) incubation at 1:1,000 dilution. To detect β-actin as a loading control, HRP-conjugated antibody sc-47778HRP (Santa Cruz) was applied at 1:10,000 dilution. Membranes were imaged with a KwikQuant Imager (Kindle Biosciences).
Knockout validation
Genomic DNA was isolated from cell pellets of control and edited cells induced by 1 μg/ml doxycycline for 3 days. Cells were resuspended in Genomic DNA lysis buffer (100 mM Tris pH 8.0, 5 mM EDTA, 200 mM NaCl, 0.2% SDS, proteinase K to a final concentration of 0.2 mg/ml) and incubated overnight at 55°C. DNA was precipitated by the addition of an equal volume of isopropanol, washed with 75% ethanol and resuspended in TE buffer (10 mM Tris-HCl pH 8.0, 0.1 mM EDTA) overnight. Genomic DNA was then used for PCR using Q5 (NEB) with the corresponding primers (below) for each gene. PCR products were run on 1% agarose gels, extracted, and sent for Sanger sequencing. Trace files were used for quantitative assessment of genome editing by TIDE (https://tide.nki.nl/).
Primers used for TIDE:
CARNMT1: 5′-GGAGGACATCGACCACACACAC, CAACAATCCGGCACTCGCC-3′;
DLGAP5: 5′-GGGGCTGTCATTTTAGGAATTGTTGC-3′, 5′-GACATGTGATGTCTCCCCCGG-3′
HMMR: 5′-GGTGTAGGTCAAAGACTGTTCTCTCTACC-3′, 5′-GGAGGTATATTCATAAGGTGAACCACTACTCAG-3′
HN1: 5′-GTGCAGTTCACAAGCATGGAGG-3′, 5′-GGAAGGGGCCGTAGAGCTAGAG-3′
HN1L: 5′-CGCATCTGCCTTGGAGCC-3′, 5′-GGCACGGGCATTTATGCTGA-3′
KIF15: 5′-CTTCTAGCACAGGGAGACAGG-3′, 5′-CTAGTTTCTGTACTTTTGCCATCTATGGTG-3′
SAMHD1: 5′-CACCCCATTCCCTTCTTACCCTAGAC-3′, 5′-CTGGGCATAGTGGCACACCC-3′.
Data analysis
High-throughput sequencing reads from the pooled CRISPR screens were mapped to the sgRNA library using Bowtie. MAGeCK-RRA (Li et al., 2014) was used to generate gene scores representing the median log2 fold change in sgRNA abundance between two samples. The sgRNA-level P value adjustment method was set to false discovery rate (FDR), and the FDR threshold for the gene test was set to 0.05. For comparisons between cell lines, the median log2 fold changes for each endpoint sample relative to the control sample were quantile normalized, and the differential scores between drug-treated and untreated were calculated using the quantile-normalized median log2 fold changes.
Quantification of fluorescence tubulin and EB1 intensity was done on unprocessed, maximally projected images using FIJI/image J. All images were acquired using the same microscope and acquisition settings for comparison. For quantification of chromosome alignment defects, cells were defined as misaligned if at least one off-axis chromosome was observed. Only cells with mature spindle structures were evaluated. The first 100 dividing cells observed were analyzed from each experimental group for each biological replicate. For analysis of microtubule spindle intensity, a circle of 14-pixel-diameter was drawn around the spindle and the total integrated intensity was measured. Background subtraction was done by selecting a region of a 3-pixel-diameter outside of the spindle and subtracting its integrated intensity from that of the spindle region. Approximately 20–25 cells were analyzed for each condition per biological replicate. For the normalization of intensity levels of each iKO cell against control values and normalization of the control value themselves, the total integrated intensity value (after background subtraction as noted above) was divided by the median control value (with background subtraction and calculated from all cells within an experiment). Statistical analyses were performed using Prism (GraphPad Software).
Single-molecule EB3 velocities were quantified from SD movies using kymographs that were generated using the ImageJ plugin KymoResliceWide v.0.4 (https://github.com/ekatrukha/KymoResliceWide). The slope of motile EB3 events in these kymographs was used to calculate EB3 velocities corrected for acquisition settings.
Online supplemental material
Fig. S1 shows the visualization of additional screen output. Fig. S2 shows the analysis of identified hits. Fig. S3 shows the analysis of identified hits 2. Table S1 shows genome-wide CRISPR screen sgRNA sequences, counts, and gene scores. Table S2 shows gene set enrichment analysis of genome-wide CRISPR screen outputs. Table S3 shows data from the secondary screen of 1,411 gene targets with sgRNA sequences, counts, and gene scores.
Data availability
Acknowledgments
We thank the members of the Cheeseman lab for their support and input and Cameron Schmitz and Ankur Jain for assistance with microscopy.
This work was supported by grants from the Harold G. & Leila Y. Mathers Charitable Foundation and National Institutes of Health/National Institute of General Medical Sciences (R35GM126930) to I.M. Cheeseman, a Hope Funds for Cancer Research fellowship (HFCR-18-03-02) to M.-J. Tsang, and the Henry and Frances Keany Rickard Fund Fellowship from the Massachusetts Institute of Technology Office of Graduate Education to N.K. Maier.
Author contributions: K.-C. Su: Conceptualization, Data curation, Formal analysis, Investigation, Methodology, Project administration, Supervision, Validation, Visualization, Writing - review & editing, E. Radul: Data curation, Formal analysis, Investigation, Methodology, Validation, Visualization, Writing - original draft, Writing - review & editing, N.K. Maier: Formal analysis, Investigation, Writing - review & editing, M.-J. Tsang: Conceptualization, Investigation, Writing - original draft, Writing - review & editing, C. Goul: Formal analysis, Investigation, Visualization, Writing - review & editing, B. Moodie: Investigation, Validation, O. Marescal: Investigation, Validation, Writing - review & editing, H.R. Keys: Data curation, Formal analysis, Investigation, Project administration, Resources, Writing - review & editing, I.M. Cheeseman: Conceptualization, Data curation, Formal analysis, Funding acquisition, Investigation, Methodology, Project administration, Supervision, Visualization, Writing - original draft, Writing - review & editing.

