The mechanisms governing mammalian proton pump V-ATPase function are of fundamental and medical interest. The assembly and disassembly of cytoplasmic V1 domain with the membrane-embedded V0 domain of V-ATPase is a key aspect of V-ATPase localization and function. Here, we show that the mammalian protein ATG16L1, primarily appreciated for its role in canonical autophagy and in noncanonical membrane atg8ylation processes, controls V-ATPase. ATG16L1 knockout elevated V-ATPase activity, increased V1 presence on endomembranes, and increased the number of acidified intracellular compartments. ATG16L1’s ability to efficiently bind V-ATPase was required for its inhibitory role in endolysosomal acidification and for control of Mycobacterium tuberculosis infection in mice. These findings uncover a hitherto unappreciated role of ATG16L1 in regulating V-ATPase, a key pump governing acidification and functionality of the endolysosomal system along with its physiological roles.
Introduction
The AuTophaGy-related (ATG) proteins are best known for their role in canonical autophagy, a process of cytoplasmic cargo digestion via its capture into specialized organelles termed autophagosomes (Morishita and Mizushima, 2019). However, recent developments have been steadily expanding ATGs’ roles to other phenomena (Deretic et al., 2024a; Deretic and Lazarou, 2022; Durgan and Florey, 2022; Figueras-Novoa et al., 2024; Galluzzi and Green, 2019; Wang et al., 2022b). This is especially evident in mammalian cells concerning the role of a ubiquitylation-like conjugation system (Mizushima, 2020) engaged in membrane (Deretic and Lazarou, 2022; Julian et al., 2025) and protein (Agrotis et al., 2019; Carosi et al., 2021; Ketteler et al., 2024; Nguyen et al., 2021) atg8ylation participating in a spectrum of diverse processes (Carosi et al., 2021; Deretic and Lazarou, 2022). Traditionally, one of the manifestations of membrane atg8ylation referred to as “LC3 lipidation,” has been considered to be autophagy specific, and one of the mammalian ubiquitin-like ATG8 proteins (mATG8s; seven members in humans), LC3B, is frequently used as a marker of autophagy (Kabeya et al., 2000). In addition to the mATG8 proteins, the membrane atg8ylation systems include multiple components such as E1 (ATG7), E2 (ATG3), and E3 enzymes (e.g., the ATG12–ATG5–ATG16L1 complex) (Deretic and Klionsky, 2024; Mizushima, 2020).
ATG16L1 participates both in canonical autophagy, a process linked to human health (Klionsky et al., 2021), and in noncanonical pathways with emerging roles in diseases, such as neurodegeneration (Heckmann et al., 2019), inflammation (Deretic, 2021), and infections (Golovkine et al., 2023; Köster et al., 2017; Wang et al., 2021). The ATG16L1 protein is a part of an E3 ligase forming a complex with the covalent ATG12–ATG5 conjugate, which, along with adaptors, recruits mATG8–ATG3 high-energy intermediate to carry out membrane atg8ylation of various organelles under stress conditions or undergoing membrane remodeling (Deretic et al., 2024b). Manifestations of this have been variously described as VAIL (Fischer et al., 2020; Xu et al., 2019), EVAC (Sun et al., 2023), CASM (Goodwin et al., 2021; Hooper et al., 2022), and LAP (Rai et al., 2019; Sanjuan et al., 2007), counting ATG16L1-dependent processes. Other membrane atg8ylation phenomena include lipid droplets, where ATG16L1 has not been specifically tested (Omrane et al., 2023), and STIL (Figueras-Novoa et al., 2024), where ATG16L1 is substituted by TECPR1 (Boyle et al., 2023; Corkery et al., 2023; Kaur et al., 2023; Wang et al., 2025).
Many of the membranes targeted for atg8ylation by ATG16L1 are in phagosomal (Hooper et al., 2022; Sanjuan et al., 2007) and endosomal (Heckmann et al., 2019; Wang et al., 2021) compartments, ER exit sites (Sun et al., 2023), and Golgi membranes (Kang et al., 2024). In these processes, V-ATPase serves as an adaptor recruiting the E3 ligase to the respective compartments via direct binding of ATG16L1 to V-ATPase (Hooper et al., 2022; Sun et al., 2023; Ulferts et al., 2021; Xu et al., 2019). V-ATPase is a physiologically critical enzyme responsible for acidification of intracellular compartments in the endolysosomal system as well as proton secretion by specialized cells (Forgac, 2007; Freeman et al., 2023; Kane, 1995; Trombetta et al., 2003). V-ATPase is a complex protein regulated via processes that remain to be fully elucidated (Forgac, 2007; Freeman et al., 2023; Kane, 1995; Oot et al., 2017; Trombetta et al., 2003). It consists of two domains, V0 and V1, each of them containing multiple subunits. V0 proteolipid is integral to membranes, whereas V1 domain can be free in the cytosol or associated with V0 (Forgac, 2007; Freeman et al., 2023; Kane, 1995; Oot et al., 2017). A principal mechanism for regulating V-ATPase activity is the assembly and disassembly of the V0 and V1 domains, which, when assembled into a holoenzyme, pumps protons across membrane while hydrolyzing ATP (Forgac, 2007; Freeman et al., 2023; Oot et al., 2017).
The control of V-ATPase activity in mammalian cells is not completely understood, although multiple candidate factors have been identified (Harvey et al., 2025; Jaskolka et al., 2021; Khan et al., 2022; Lu et al., 2007; Oot and Wilkens, 2024; Pepe et al., 2025; Tan et al., 2022; Wang et al., 2022a; Zhang et al., 2017). Whereas ATG16L1–V-ATPase interaction has been previously noted, this has been primarily studied in the context of CASM/VAIL (Fischer et al., 2020; Goodwin et al., 2021; Hooper et al., 2022; Sun et al., 2023; Xu et al., 2019), and the question of whether ATG16L1 may act as a regulator of V-ATPase has never been posed. Here, we tested whether ATG16L1 affects V-ATPase and luminal acidification in the endolysosomal system. We found that in the absence of ATG16L1, these compartments undergo hyperacidification and that V1V0 assembly and V-ATPase activities are elevated. We furthermore mechanistically define ATG16L1 as a regulator of V-ATPase in mammalian cells.
Results
Loss of ATG16L1 increases abundance of acidified intracellular compartments
ATG16L1 participates in canonical autophagy (Fujita et al., 2008; Lystad et al., 2019; Rao et al., 2024) and in a panel of noncanonical membrane atg8ylation phenomena (Goodwin et al., 2021; Hooper et al., 2022; Liu et al., 2023; Ulferts et al., 2021; Xu et al., 2022; Xu et al., 2019). Recent studies have indicated that membrane atg8ylation is important for maintenance of lysosomal integrity (Cross et al., 2023; Jia et al., 2022) and lysosomal membrane homeostasis via microautophagy (Lee et al., 2020). Here, we tested whether absence of a key atg8ylation E3 ligase ATG16L1 (Mizushima, 2020) diminishes lysosomal fitness using human hepatoma-derived Huh7 cells previously used to study membrane atg8bylation in diverse contexts (Jia et al., 2022; Paddar et al., 2025; Wang et al., 2023). One measure of lysosomal status is its luminal acidification. We quantified this using staining with LysoTracker Red (LTR), an acidotropic fluorescent dye that accumulates in acidified compartments (Via et al., 1998), by high-content microscopy (HCM) to allow unbiased operator-independent image collection, object identification, and quantification, as previously established (Jia et al., 2018; Kumar et al., 2021a). The ATG16L1 knockout cells, Huh7ATG16L1-KO, displayed increase in LTR+ profiles relative to their parental Huh7WT cells (Fig. 1 A). The observed hyperacidification phenotype in the absence of ATG16L1 was unanticipated since it suggested enhanced ability of lysosomes to acidify. This is unexpected since membrane atg8ylation maintains lysosomal membrane integrity via several mechanisms (Bussi et al., 2023; Corkery et al., 2024, Preprint; Cross et al., 2023; Jia et al., 2022; Tan and Finkel, 2022) with ATG16L1 being a key E3 ligase engaged in these processes. Hence, we confirmed the hyperacidification phenotype in additional cell lines, including PC-3 ATG16L1 knockout cells (Wible et al., 2019) (Fig. S1 A) and HeLa ATG16L1 knockout cells (Fig. S1 B), which all showed increased LTR+ profiles compared with their parental cell lines. This phenotype was complemented by transfecting HeLaATG16L1-KO cells with a construct expressing ATG16L1 (FLAG-ATG16L1FL; full-length) (Fig. S1 C). The increase in LTR signal was accompanied by elevated cathepsin B activity (quantified by Magic Red) in HeLaATG16L1-KO cells relative to parental HeLaWT cells (Fig. S1 D).
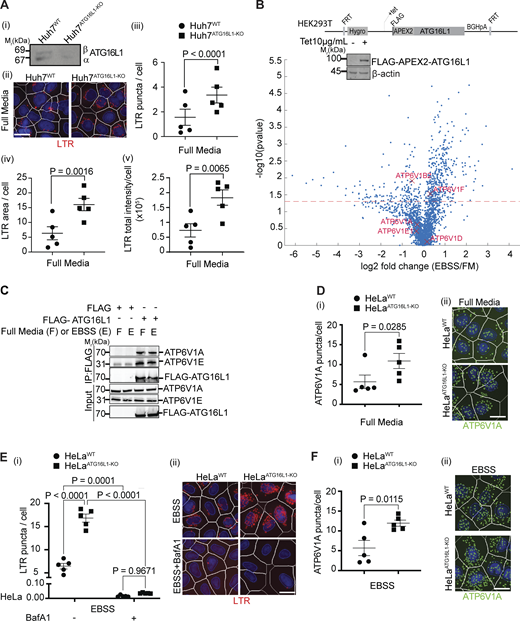
Inactivation of ATG16L1 hyperacidifies intracellular compartments in a V-ATPase–dependent manner. (A) (i) ATG16L1 immunoblot in Huh7WT and Huh7ATG16L1-KO cells. (ii)–(v) HCM. (ii) Images from a bank of >15,000 primary objects/cells per experimental group of LTR in Huh7WT and Huh7ATG16L1-KO in full media. Masks: LTR, red; Hoechst 33342 nuclei, blue; cells/primary objects limits, white. Quantifications: (iii) LTR puncta/cell, (iv) LTR area/cell, and (v) LTR total intensity/cell. (B) Schematic, FLAG-APEX2-ATG16L1 chromosomal insertion in Flp-In T-REx (Tet-ON) HEK293T cells used in proximity biotinylation LC-MS/MS proteomic analyses. FLAG-APEX2-ATG16L1 expression was induced with 10 µg/ml of tetracycline overnight, confirmed by western blot (inset) and proximity biotinylation and subsequent LC-MS/MS and bioinformatics analyses carried out (described in Materials and methods). Volcano plot of ATG16L1 interactors (listed in Table S1) in cells incubated in EBSS or full medium (FM) for 90 min, highlighting V-ATPase components. (C) co-IP analysis of FLAG-ATG16L1 transfected into HEK293T cells in full medium or EBSS with endogenous V1 components of V-ATPase. (D) HCM quantification of (i) ATP6V1A puncta/cell and (ii) their representative images of HeLaWT and HeLaATG16L1-KO in full medium. Masks: ATP6V1A puncta, green; other masks as in A. (E) LTR HCM analysis in HeLa cells as in A: (i) LTR puncta/cell and (ii) HCM representative images of HeLaWT and HeLaATG16L1-KO in EBBS with or without 100 nM bafilomycin A1 (Baf A1) for 90 min stained with LTR (red mask) and Hoechst 33342 (nuclei, blue mask). (F) HCM quantification of (i) ATP6V1A puncta/cell and (ii) their representative images of HeLaWT and HeLaATG16L1-KO in EBSS for 90 min. Statistical significance was determined by two-way ANOVA (E) and paired t test (A, D, and F). Data: means ± SEM, n ≥ 5 (biologically independent replicates, different plates); each HCM experiment: 1,000 valid primary objects/well, 5–6 wells technical replicates per plate. Scale bars: 5 µm. Source data are available for this figure: SourceData F1.
Inactivation of ATG16L1 hyperacidifies intracellular compartments in a V-ATPase–dependent manner. (A) (i) ATG16L1 immunoblot in Huh7WT and Huh7ATG16L1-KO cells. (ii)–(v) HCM. (ii) Images from a bank of >15,000 primary objects/cells per experimental group of LTR in Huh7WT and Huh7ATG16L1-KO in full media. Masks: LTR, red; Hoechst 33342 nuclei, blue; cells/primary objects limits, white. Quantifications: (iii) LTR puncta/cell, (iv) LTR area/cell, and (v) LTR total intensity/cell. (B) Schematic, FLAG-APEX2-ATG16L1 chromosomal insertion in Flp-In T-REx (Tet-ON) HEK293T cells used in proximity biotinylation LC-MS/MS proteomic analyses. FLAG-APEX2-ATG16L1 expression was induced with 10 µg/ml of tetracycline overnight, confirmed by western blot (inset) and proximity biotinylation and subsequent LC-MS/MS and bioinformatics analyses carried out (described in Materials and methods). Volcano plot of ATG16L1 interactors (listed in Table S1) in cells incubated in EBSS or full medium (FM) for 90 min, highlighting V-ATPase components. (C) co-IP analysis of FLAG-ATG16L1 transfected into HEK293T cells in full medium or EBSS with endogenous V1 components of V-ATPase. (D) HCM quantification of (i) ATP6V1A puncta/cell and (ii) their representative images of HeLaWT and HeLaATG16L1-KO in full medium. Masks: ATP6V1A puncta, green; other masks as in A. (E) LTR HCM analysis in HeLa cells as in A: (i) LTR puncta/cell and (ii) HCM representative images of HeLaWT and HeLaATG16L1-KO in EBBS with or without 100 nM bafilomycin A1 (Baf A1) for 90 min stained with LTR (red mask) and Hoechst 33342 (nuclei, blue mask). (F) HCM quantification of (i) ATP6V1A puncta/cell and (ii) their representative images of HeLaWT and HeLaATG16L1-KO in EBSS for 90 min. Statistical significance was determined by two-way ANOVA (E) and paired t test (A, D, and F). Data: means ± SEM, n ≥ 5 (biologically independent replicates, different plates); each HCM experiment: 1,000 valid primary objects/well, 5–6 wells technical replicates per plate. Scale bars: 5 µm. Source data are available for this figure: SourceData F1.
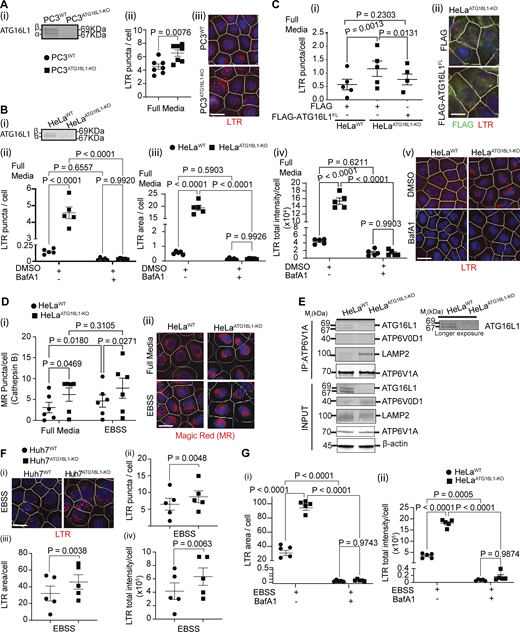
Acidification of intracellular compartments is counteracted by ATG16L1. (A) (i) ATG16L1 immunoblot of PC3WT and PC3ATG16L1-KO cells; (ii) HCM quantification of LTR puncta/cell in PC3WT and PC3ATG16L1-KO cells; (iii) HCM images (examples from a large machine-collected and processed bank of images) of PC3WT and PC3ATG16L1-KO cells (full media). Masks: LTR, red; Hoechst 33342 nuclei, blue; cells/primary objects limits, white. (B) (i) ATG16L1 immunoblot in HeLaWT and HeLaATG16L1-KO; HCM quantification of (ii) LTR puncta/cell, (iii) LTR area/cell, and (iv) LTR total intensity/cell in HeLaWT and HeLaATG16L1-KO cells in full media (DMSO) with or without 100 nM bafilomycin A1 (Baf A1) for 90 min; (v) HCM example HCM images of HeLaWT and HeLaATG16L1-KO in DMSO (full media) ± Baf A1. (C) HCM quantification of (i) LTR puncta/cell in HeLaWT and HeLaATG16L1-KO cells transfected with FLAG or FLAG-ATG16L1FL; (ii) example HCM images of LTR (red) in FLAG+ (gated, green) cells transfected with FLAG or FLAG-ATG16L1FL in HeLaATG16L1-KO. (D) HCM quantification of cathepsin B activity using Magic Red (MR) assay; (i) puncta/cell; (ii) example HCM images of HeLaWT and HeLaATG16L1-KO incubated (or not) in EBSS for 90 min, labeled with MR (red) and Hoechst 33342 (nuclei, blue). (E) co-IP analysis of endogenous ATG16L1 with endogenous ATP6V1A (V1 subunit of V-ATPase) in HeLaWT and HeLaATG16L1-KO in full media. (F) (i) HCM example images, (ii) LTR puncta/cell, (iii) LTR area/cell, and (iv) LTR total intensity/cell of Huh7WT and Huh7ATG16L1-KO in EBSS, masks as in A. (G) (i) LTR area/cell and (ii) LTR total intensity/cell of HeLaWT and HeLaATG16L1-KO in EBBS with or without 100 nM Baf A1 for 90 min, with masks as in A. Statistical significance was determined by paired t test (A and F), one-way ANOVA (C), and two-way ANOVA (D and G). Data: means ± SEM, n ≥ 5 (biologically independent replicates, different plates); each HCM experiment: 1,000 valid primary objects/well, 5–6 wells technical replicates per plate. Scale bars: 5 µm. Source data are available for this figure: SourceData FS1.
Acidification of intracellular compartments is counteracted by ATG16L1. (A) (i) ATG16L1 immunoblot of PC3WT and PC3ATG16L1-KO cells; (ii) HCM quantification of LTR puncta/cell in PC3WT and PC3ATG16L1-KO cells; (iii) HCM images (examples from a large machine-collected and processed bank of images) of PC3WT and PC3ATG16L1-KO cells (full media). Masks: LTR, red; Hoechst 33342 nuclei, blue; cells/primary objects limits, white. (B) (i) ATG16L1 immunoblot in HeLaWT and HeLaATG16L1-KO; HCM quantification of (ii) LTR puncta/cell, (iii) LTR area/cell, and (iv) LTR total intensity/cell in HeLaWT and HeLaATG16L1-KO cells in full media (DMSO) with or without 100 nM bafilomycin A1 (Baf A1) for 90 min; (v) HCM example HCM images of HeLaWT and HeLaATG16L1-KO in DMSO (full media) ± Baf A1. (C) HCM quantification of (i) LTR puncta/cell in HeLaWT and HeLaATG16L1-KO cells transfected with FLAG or FLAG-ATG16L1FL; (ii) example HCM images of LTR (red) in FLAG+ (gated, green) cells transfected with FLAG or FLAG-ATG16L1FL in HeLaATG16L1-KO. (D) HCM quantification of cathepsin B activity using Magic Red (MR) assay; (i) puncta/cell; (ii) example HCM images of HeLaWT and HeLaATG16L1-KO incubated (or not) in EBSS for 90 min, labeled with MR (red) and Hoechst 33342 (nuclei, blue). (E) co-IP analysis of endogenous ATG16L1 with endogenous ATP6V1A (V1 subunit of V-ATPase) in HeLaWT and HeLaATG16L1-KO in full media. (F) (i) HCM example images, (ii) LTR puncta/cell, (iii) LTR area/cell, and (iv) LTR total intensity/cell of Huh7WT and Huh7ATG16L1-KO in EBSS, masks as in A. (G) (i) LTR area/cell and (ii) LTR total intensity/cell of HeLaWT and HeLaATG16L1-KO in EBBS with or without 100 nM Baf A1 for 90 min, with masks as in A. Statistical significance was determined by paired t test (A and F), one-way ANOVA (C), and two-way ANOVA (D and G). Data: means ± SEM, n ≥ 5 (biologically independent replicates, different plates); each HCM experiment: 1,000 valid primary objects/well, 5–6 wells technical replicates per plate. Scale bars: 5 µm. Source data are available for this figure: SourceData FS1.
ATG16L1 affects acidification via V-ATPase
We employed an unbiased proteomic approach based on APEX2 proximity biotinylation to identify interactors of ATG16L1 that may be relevant for the hyperacidification phenotype (Fig. 1 B and Table S1). Among putative interactors were several subunits of the V1 domain of V-ATPase, whereas no V0 subunits were detected (Fig. 1 B and Table S1, Tab1, highlighted entries). Of these, V1A (ATP6V1A) and V1E (ATP6V1E1) were used to confirm interactions by co-immunoprecipitation (co-IP) of FLAG-ATG16L1 with endogenous V-ATPase (Fig. 1 C) as well as in co-IPs of endogenous proteins (Fig. S1 E). This is consistent with prior reports that V-ATPase interacts with ATG16L1, uncovered in genetic screens (Ulferts et al., 2021; Xu et al., 2019) and demonstrated in biochemical assays (Hooper et al., 2022; Sun et al., 2023; Timimi et al., 2024; Xu et al., 2019), and furthermore indicates that ATG16L1 and V-ATPase interact even without any treatments. We thus tested whether the hyperacidification phenotype in cells lacking ATG16L1 was dependent on V-ATPase, the principal proton pump responsible for low pH of endolysosomal compartments (Freeman et al., 2023). For this, we used well-established V-ATPase inhibitor, bafilomycin A1, and observed a loss of hyperacidification phenotype (Fig. S1 B). Next, we tested whether the hyperacidification phenotype in ATG16L1KO cells was accompanied by changes in V-ATPase localization on endomembranes. We observed an increase in numbers of V1A puncta, a catalytic component of the V1 domain of V-ATPase, in HeLaATG16L1-KO cells relative to parental HeLaWT cells (Fig. 1 D).
Our proteomic study included comparator conditions with starvation in EBSS, whereby we detected similar pattern in proximity interactions with V-ATPase with some minor changes (Fig. 1 B and Table S1). The ATG16L1–V-ATPase interactions were confirmed by co-IPs in cells subjected to starvation (Fig. 1 C). The hyperacidification phenotype in ATG16L1KO cells was also observed under starvation (EBSS; Fig. 1 E). Whereas starvation is known to increase overall abundance in LTR+ compartments (Gu et al., 2019), ATG16L1 KO further augmented, relative to ATG16L1 WT cells, the number, total intensity, and area of LTR+ compartments under starvation conditions (EBSS; Fig. 1 E and Fig. S1 G). The effect of ATG16L1 KO on hyperacidification phenotype under starvation conditions was confirmed in Huh7 cells (Fig. S1 F). Bafilomycin A1 abrogated LTR staining and hyperacidification phenotype in HeLaATG16L1-KO cells subjected to starvation in EBSS (Fig. 1 E and Fig. S1 G). The hyperacidification in starved HeLaATG16L1-KO cells was also accompanied by an increase in V1A puncta (Fig. 1 F). We conclude that, in our experiments, under basal and starvation conditions: (1) ATG16L1 interacts with V1 components of V-ATPase by proteomic analyses (Fig. 1 B) and by co-IP (Fig. 1 C); and (2) ATG16L1 knockouts cause an increase in acidified compartments, which is dependent on V-ATPase activity and is accompanied by increased V1 presence on endomembranous compartments.
Identity of hyperacidified compartments in ATG16L1KO cells
We next examined which intracellular compartments are hyperacidified in ATG16L1 KO using a panel of endosomal and lysosomal markers. The majority of LTR+ puncta in ATG16L1 KO cells colocalized with CD63 (LAMP3/LIMP1) (Fig. 2 A), an endolysosomal tetraspanin membrane protein (Bond et al., 2025; Schwake et al., 2013). The lysosomal proteins LAMP1 and CD63 are known to overlap in the majority (70–90%) of endolysosomal compartments (Bond et al., 2025). In keeping with this, the LTR+ compartments in ATG16L1 KO cells were positive for LAMP1 (Fig. 2 B). The V1 subunit V1A in ATG16L1 KO cells colocalized with CD63 (Fig. 2 C). The LTR+ puncta in ATG16L1 KO cells did not overlap with an early endosomal marker, EEA1 (Fig. 2 D), or the ER marker, PDI (Fig. 2 E). Thus, the hyperacidified compartments in cells lacking ATG16L1 are endolysosomal in nature.
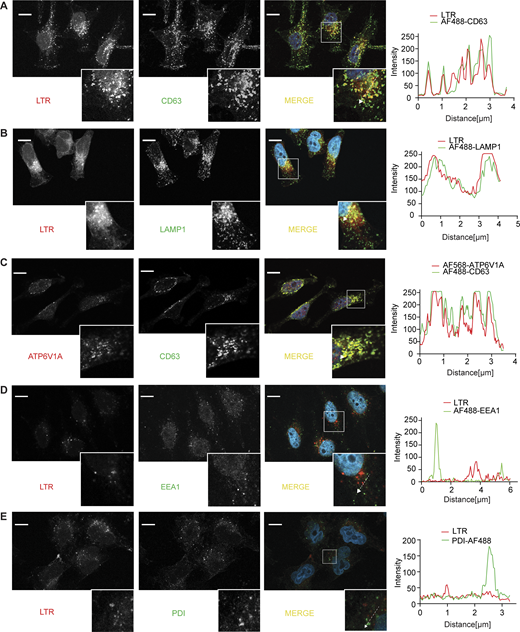
Localization analysis of hyperacidification markers by confocal microscopy. (A) Confocal microscopy images of LysoTracker (LTR; red), CD63 (AlexaFluor 488, green), and merged channels (including Hoechst 33342, blue, for nuclei) in HeLaATG16L1-KO. (B) Confocal images of LTR, Lamp1 (AF488, green), and merged channels in HeLaATG16L1-KO. (C) Confocal images of ATP6V1A (AF568, red), CD63 (AF488, green), and merged channels in HeLaATG16L1-KO. (D) LTR (red), EEA1 (AF488, green), and merged channels in HeLaATG16L1-KO. (E) Confocal images of LTR (red) and ER marker PDI (AF488, green) in HeLaATG16L1-KO. Tracings to the right, line profile intensities corresponding to dashed lines in the insets. Scale bars: 10 µm. Source data are available for this figure: SourceData F2.
Localization analysis of hyperacidification markers by confocal microscopy. (A) Confocal microscopy images of LysoTracker (LTR; red), CD63 (AlexaFluor 488, green), and merged channels (including Hoechst 33342, blue, for nuclei) in HeLaATG16L1-KO. (B) Confocal images of LTR, Lamp1 (AF488, green), and merged channels in HeLaATG16L1-KO. (C) Confocal images of ATP6V1A (AF568, red), CD63 (AF488, green), and merged channels in HeLaATG16L1-KO. (D) LTR (red), EEA1 (AF488, green), and merged channels in HeLaATG16L1-KO. (E) Confocal images of LTR (red) and ER marker PDI (AF488, green) in HeLaATG16L1-KO. Tracings to the right, line profile intensities corresponding to dashed lines in the insets. Scale bars: 10 µm. Source data are available for this figure: SourceData F2.
Loss of ATG16L1 lowers the luminal pH of LAMP1+ compartments
We next determined the pH value in the endolysosomal compartments affected by ATG16L1 KO (Fig. 3). For this, we used a pH-sensitive variant of GFP, termed pHluorin, developed for ratiometric determination of the luminal pH in intracellular organelles (Linders et al., 2022; Miesenböck et al., 1998; Poschet et al., 2001). We utilized an intragenic construct of LAMP1 with RpHluorin2 (LAMP1-RpHluorin2). RpHluorin2 is a variant of pHluorin with improved fluorescence (Mahon, 2011). In LAMP1-RpHluorin2, RpHluorin2 is fused to LAMP1 after the LAMP1 signal sequence at the N terminus (removed co-translationally during membrane insertion) and is followed by the transmembrane domain of LAMP1 and a short cytosolic C terminus (Linders et al., 2022). Hence, the RpHluorin2 in LAMP1-RpHluorin2 faces the endolysosomal lumen and can be used to determine its pH. We employed an unbiased HCM approach, allowing unbiased operator-independent image collection, object identification, and quantification, as previously established (Jia et al., 2018; Kumar et al., 2021a), adopting it for ratiometric quantification of luminal pH in intracellular organelles as detailed in the Materials and methods section (ratiometric HCM in vitro test, Fig. 3 A). Based on the calibration curve (Fig. 3 B), the pH of LAMP1+ endolysosomal compartments was 4.6 ± 0.1 in HeLaATG16L1-KO vs. 5.8 ± 0.3 in HeLaATG16L1WT cells (Fig. 3, C and D). The hyperacidification of endolysosomal compartments in ATG16L1 KO was also observed in cells treated with EBSS, with pH being 4.7 ± 0.1 in HeLaATG16L1KO vs. 5.4 ± 0.05 in HeLaATG16L1WT cells (Fig. 3 C). Thus, absence of ATG16L1 affects pH in LAMP1+ endolysosomal compartments.
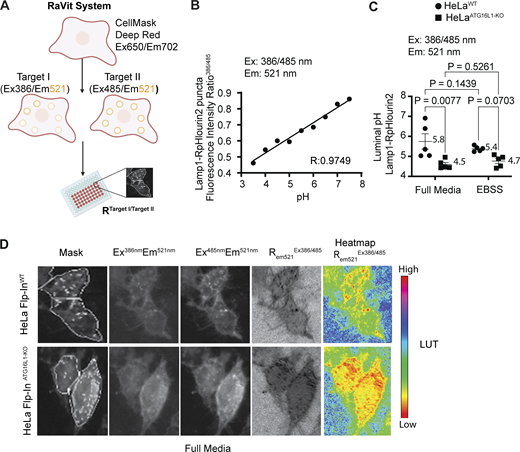
Determination of luminal pH in endolysosomes of ATG16L1KOcells. (A) RaVit (ratiometric HCM in vitro test) in live cells transfected with RpHlourin2 (a ratiometric GFP) fused to a compartment-specific protein (e.g., LAMP1). RaVit is an HCM process using automated imaging system (high-content microscope CX7 Cellomics). Cells in 96-well pates are transfected with RpHlourin2 fusions and imaged live (unfixed). Cells are identified by cell mask (Plasma membrane CellMask Deep Red) for setting regions of interest (ROI A, channel 1, Ex:650/Em:702) and fluoescence intensity determined of RpHlourin2 (e.g., LAMP1 fusion) for target I (Ex:386/Em:521 nm; channel 2) and target II (Ex:485 nm/Em:521 nm; channel 3). Once the images are collected, the total fluorescence emission intensity of target I and target II is divided to derive a ratio. The experimental value (ratio of intensities at 521 nm upon sequential illumination at 386 and 485 nm) is converted into pH value based on a calibration curve of ratios generated with permeabilized transfected cells incubated/equilibrated in pH buffers ranging from 3.5 to 7.5. (B) Calibration curve for Lamp1-RpHLuorin2 in cells permeabilized and equilibrated with external buffers of indicated pH. (C) Luminal pH of Lamp1+ endolysosomal compartments in live HeLaWT and HeLaATG16L1-KO cells. (D) Sequential rendering of representative images: Masks, cells with overlayed algorithm-imposed masks (primary objects, cells) and targets (Lamp1-RpHLuorin2 puncta), followed by corresponding raw images acquired under indicated wavelengths, raw ratio of the channels (excitation at 386 and 485 nm, emission at 521 nm), and corresponding heatmap; image calculator and LUT (look up table), ImageJ; red, lower pH. Data: means ± SEM, two-way ANOVA, n ≥5 (biologically independent replicates, different plates); 5 technical replicates/wells (>400 Lamp1-RpHLourin2–transfected cells per well) per plate per experimental group. Source data are available for this figure: SourceData F3.
Determination of luminal pH in endolysosomes of ATG16L1KOcells. (A) RaVit (ratiometric HCM in vitro test) in live cells transfected with RpHlourin2 (a ratiometric GFP) fused to a compartment-specific protein (e.g., LAMP1). RaVit is an HCM process using automated imaging system (high-content microscope CX7 Cellomics). Cells in 96-well pates are transfected with RpHlourin2 fusions and imaged live (unfixed). Cells are identified by cell mask (Plasma membrane CellMask Deep Red) for setting regions of interest (ROI A, channel 1, Ex:650/Em:702) and fluoescence intensity determined of RpHlourin2 (e.g., LAMP1 fusion) for target I (Ex:386/Em:521 nm; channel 2) and target II (Ex:485 nm/Em:521 nm; channel 3). Once the images are collected, the total fluorescence emission intensity of target I and target II is divided to derive a ratio. The experimental value (ratio of intensities at 521 nm upon sequential illumination at 386 and 485 nm) is converted into pH value based on a calibration curve of ratios generated with permeabilized transfected cells incubated/equilibrated in pH buffers ranging from 3.5 to 7.5. (B) Calibration curve for Lamp1-RpHLuorin2 in cells permeabilized and equilibrated with external buffers of indicated pH. (C) Luminal pH of Lamp1+ endolysosomal compartments in live HeLaWT and HeLaATG16L1-KO cells. (D) Sequential rendering of representative images: Masks, cells with overlayed algorithm-imposed masks (primary objects, cells) and targets (Lamp1-RpHLuorin2 puncta), followed by corresponding raw images acquired under indicated wavelengths, raw ratio of the channels (excitation at 386 and 485 nm, emission at 521 nm), and corresponding heatmap; image calculator and LUT (look up table), ImageJ; red, lower pH. Data: means ± SEM, two-way ANOVA, n ≥5 (biologically independent replicates, different plates); 5 technical replicates/wells (>400 Lamp1-RpHLourin2–transfected cells per well) per plate per experimental group. Source data are available for this figure: SourceData F3.
Loss of ATG16L1 increases V-ATPase activity in vitro
To address mechanistically the regulatory effects of ATG16L1 on V-ATPase, we employed a battery of in vitro assays for activity of V-ATPase using cell extracts or enriched endolysosomal compartments from HeLaWT or HeLaATG16L1-KO cells (Figs. 4 and 5).
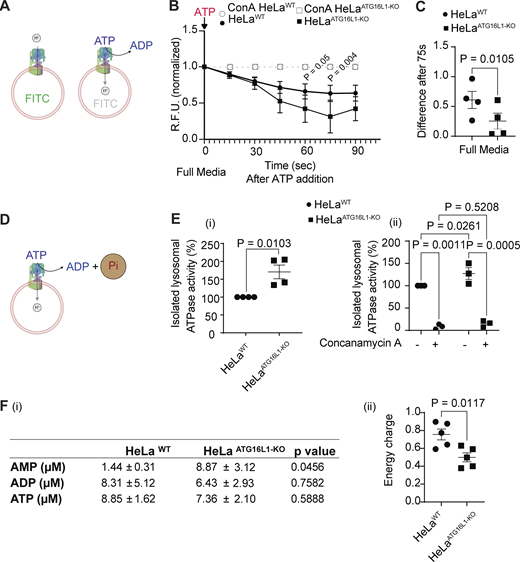
ATG16L1 regulates V-ATPase activity. (A) Scheme, FITC fluorescence quenching by V-ATPase–dependent acidification in FITC-dextran–loaded compartments. (B)In vitro fluorescence quenching of FITC- dextran (FITC Ex: 485/20, Em: 528/20) in endolysosomal compartments (cell extracts) from HeLaWT and HeLaATG16L1-KO after 90 s of ATP addition. (C) Relative fluorescence units (R.F.U.) difference between HeLaWT and HeLaATG16L1-KO cell extract at 75-sec reaction time point. Data: means ± SEM (n = 4 independent experiments); statistical significance was determined by nonlinear regression (B) and paired t test (C). (D) Scheme, in vitro ATPase assay with magnetically isolated lysosomes; phosphate released from ATP is quantified colorimetrically (650 nm). (E) (i) Normalized lysosomal ATPase activity measured (released phosphate) in assays with magnetically isolated lysosomes from HeLaWT and HeLaATG16L1-KO, (ii) as in (i) with or without the V-ATPase inhibitor ConA (1 µM), a control for the specificity of the ATPase activity releasing the phosphate. Data: means ± SEM (n = 4 (i), n = 3 (ii); independent experiments); statistical significance was determined by paired t test. (F) AMP, ADP, and ATP levels (i) and calculated energy charge (ii) in HeLaWT and HeLaATG16L1-KO. Data: means ± SEM (n = 5 independent experiments); statistical significance was determined by paired t test. Source data are available for this figure: SourceData F4.
ATG16L1 regulates V-ATPase activity. (A) Scheme, FITC fluorescence quenching by V-ATPase–dependent acidification in FITC-dextran–loaded compartments. (B)In vitro fluorescence quenching of FITC- dextran (FITC Ex: 485/20, Em: 528/20) in endolysosomal compartments (cell extracts) from HeLaWT and HeLaATG16L1-KO after 90 s of ATP addition. (C) Relative fluorescence units (R.F.U.) difference between HeLaWT and HeLaATG16L1-KO cell extract at 75-sec reaction time point. Data: means ± SEM (n = 4 independent experiments); statistical significance was determined by nonlinear regression (B) and paired t test (C). (D) Scheme, in vitro ATPase assay with magnetically isolated lysosomes; phosphate released from ATP is quantified colorimetrically (650 nm). (E) (i) Normalized lysosomal ATPase activity measured (released phosphate) in assays with magnetically isolated lysosomes from HeLaWT and HeLaATG16L1-KO, (ii) as in (i) with or without the V-ATPase inhibitor ConA (1 µM), a control for the specificity of the ATPase activity releasing the phosphate. Data: means ± SEM (n = 4 (i), n = 3 (ii); independent experiments); statistical significance was determined by paired t test. (F) AMP, ADP, and ATP levels (i) and calculated energy charge (ii) in HeLaWT and HeLaATG16L1-KO. Data: means ± SEM (n = 5 independent experiments); statistical significance was determined by paired t test. Source data are available for this figure: SourceData F4.
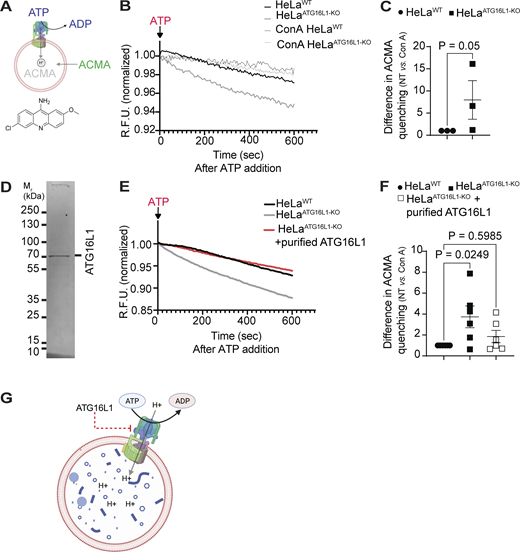
ATG16L1 inhibits V-ATPase activity in vitro. (A) Scheme, ACMA assay. ACMA freely exchanges between the buffer and the lumen of magnetically purified lysosomal organelles, and is trapped in the lumen upon protonation, which also causes quenching of ACMA fluorescence. (B) Fluorimetric quantification of ACMA quenching in magnetically isolated lysosomes from HeLaWT and HeLaATG16L1-KO (grown in full medium) after ATP addition (Ex: 360/40, Em: 460/40). (C) Quantification of ACMA quenching after subtraction of ConA from non-treated with ConA curves. (D) Purified ATG16L1, Coomassie blue stain. (E) Fluorimetric quantification of ACMA quenching in magnetically isolated lysosomes from HeLaWT and HeLaATG16L1-KO with or without added purified ATG16L1 protein. (F) Quantification of ACMA quenching as in C. Data: means ± SEM (n ≥ 3 independent experiments); statistical significance was determined by paired t test. (G) Summary of findings: ATG16L1 inhibits proton pumping by V-ATPase in endolysosomal compartments. R.F.U., relative fluorescence units. Source data are available for this figure: SourceData F5.
ATG16L1 inhibits V-ATPase activity in vitro. (A) Scheme, ACMA assay. ACMA freely exchanges between the buffer and the lumen of magnetically purified lysosomal organelles, and is trapped in the lumen upon protonation, which also causes quenching of ACMA fluorescence. (B) Fluorimetric quantification of ACMA quenching in magnetically isolated lysosomes from HeLaWT and HeLaATG16L1-KO (grown in full medium) after ATP addition (Ex: 360/40, Em: 460/40). (C) Quantification of ACMA quenching after subtraction of ConA from non-treated with ConA curves. (D) Purified ATG16L1, Coomassie blue stain. (E) Fluorimetric quantification of ACMA quenching in magnetically isolated lysosomes from HeLaWT and HeLaATG16L1-KO with or without added purified ATG16L1 protein. (F) Quantification of ACMA quenching as in C. Data: means ± SEM (n ≥ 3 independent experiments); statistical significance was determined by paired t test. (G) Summary of findings: ATG16L1 inhibits proton pumping by V-ATPase in endolysosomal compartments. R.F.U., relative fluorescence units. Source data are available for this figure: SourceData F5.
In the initial assay, we measured quenching of fluorescence upon FITC protonation within the lumen of endolysosomal compartments after activating V-ATPase H+ pumping with ATP (Stransky and Forgac, 2015) (Fig. 4 A). The endosomal compartments in live cells were loaded with FITC-dextran by endocytosis, and cell-free extracts containing endolysosomal membranes were prepared from lysates of HeLaWT or HeLaATG16L1-KO cells. The V-ATPase activity was initiated by addition of ATP and a decline in FITC fluorescence due to FITC protonation (Stransky and Forgac, 2015) measured by fluorometry at 485/20 nm (Ex) and 528/20 nm (Em) (Fig. 4 B). The V-ATPase–dependent FITC quenching, assessed by inclusion of its inhibitor concanamycin A (ConA) in control samples (Fig. 4 B, open symbols), was stronger in the endolysosomes from HeLaATG16L1-KO cells compared with endolysosomes from HeLaWT cells, normalized for protein concentration (Fig. 4 C).
We next tested whether the ATP hydrolysis activity of V-ATPase is affected by ATG16L1. For this assay, we first purified endolysosomal compartments by endocytically loading cells with dextran-coated magnetite DexoMAG (40 kDa dextran, 8 nm magnetite core, and hydrodynamic particle size 40 nm) for 24 h of particles uptake and 24 h of chase. The endolysosomal compartments containing DexoMAG were magnetically isolated, and the ATPase activity was measured by quantifying release of inorganic phosphate upon addition of ATP (Fig. 4 D) in the presence of NaN3 favoring V-ATPase over other ATPase activities (Im et al., 2023). The endolysosomal preparations from HeLaATG16L1-KO cells had higher ATPase activity than HeLaWT normalized for protein concentration (Fig. 4 E(i)). This activity was sensitive to ConA (Fig. 4 E(ii)). We also observed increased AMP levels (Fig. 4 F(i)) and reduced energy charge (Atkinson and Walton, 1967) (Fig. 4 F(ii)) in extracts from HeLaATG16L1-KO cells relative to parental HeLaATG16L1-WT cells.
In the last set of analyses, we employed a 9-amino-6-chloro-2-methoxyacridine (ACMA) assay (Fig. 5 A). For this, we also used magnetically purified endolysosomal compartments loaded with DexoMAG as described above. The purified endolysosomes were incubated in a buffer with the pH sensitive fluorescent probe ACMA. In this assay, ACMA in the buffer is exchanged with the endolysosomal lumen, where it becomes trapped upon protonation. Once protonated, ACMA fluorescence is quenched. Thus, a reduction in total ACMA fluorescence of the reaction mixture reflects proton flux into the lumen. ACMA fluorescence quenching was monitored upon addition of ATP to stimulate V-ATPase H+ pumping activity. The V-ATPase–dependent ACMA quenching (the fraction of the total loss in ACMA fluorescence inhibitable by ConA) was enhanced in the purified endolysosomes from HeLaATG16L1-KO cells compared with endolysosomes from parental HeLaATG16L1-WT cells (Fig. 5, B and C).
Finally, we employed the ACMA assay with affinity purified FLAG-ATG16L1 protein (Fig. 5 D) added to the system described above. Magnetically purified DexoMAG-loaded endolysosomal compartments from HeLaATG16L1-KO cells were preincubated with purified ATG16L1 and V-ATPase activity initiated upon addition of ATP (Fig. 5, E and F). The inclusion of ATG16L1 protein in the ACMA assay inhibited quenching of the fluorophore reflecting the reduced V-ATPase H+ pumping activity in the presence of ATG16L1 (Fig. 5 F). In conclusion, endolysosomal compartments isolated from cells that lack ATG16L1 display enhanced V-ATPase activity, which includes ATPase activity and H+ pumping. This can be countered by adding purified ATG16L1 as tested in the ACMA assay. This demonstrates inhibitory activity of ATG16L1 on V-ATPases as illustrated in a model (Fig. 5 G) in which ATG16L1 acts as an inhibitor of V-ATPase at the endolysosomes.
Loss of ATG16L1 increases assembly of V1 and V0 domains on membranes
The best characterized process regulating V-ATPase activity is the assembly and disassembly of its V1 and V0 domains on membranes, whereby the corresponding organelles are being acidified (Forgac, 2007; Freeman et al., 2023; Kane, 1995; Trombetta et al., 2003). Thus, one mechanism that we considered for hyperacidification of V-ATPase in ATG16L1 KO cells was an increased assembly of V1 and V0 domains and reconstitution of V-ATPase holoenzyme on endolysosomal membranes. Another mechanism considered was an increase in overall levels of cellular V1 and/or V0 domains/subcomplexes. Both alternatives, which are not mutually exclusive, are compatible with the observed increase in V1 on intracellular profiles in ATG16L1 KO cells (Fig. 1 D). To address this further, we tested whether the overall levels of V-ATPase subunits are increased in HeLaATG16L1-KO relative to HeLaWT cells. We detected no significant increase in total cellular content of V1A subunit (Fig. 6, A and B). The levels of the V-ATPase subunits ATP6V1A (a component of the V1 domain) and ATP6V0D1 (a component of the V0 domain) did not significantly change in the presence of proteolytic inhibitors Baf A1 or MG132, blocking lysosomal or proteasomal turnover (Fig. 6, C–E). Collectively, these experiments did not reveal any statistically significant differences between HeLaATG16L1-KO vs. HeLaWT cells in total levels of these proteins, representative of V1 and V0 domains of V-ATPase. Thus, we conclude that increase of V1 on endolysosomal membranes (Fig. 1 D) is not due to a potential increase in overall levels of V1 or V0 subunits.
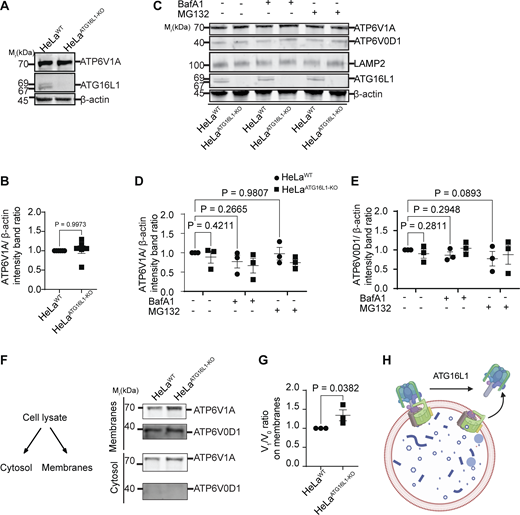
ATG16L1 regulates V-ATPase assembly. (A and B) ATP6V1A immunoblot (A) and band intensity (ATG16L1) quantification (B) in HeLaWT and HeLaATG16L1-KO. (C–E) ATP6V1A and ATP6V0D1 immunoblot (C) and quantification (D and E) without or upon treatment of cells with Bafilomycin A1 (lysosomal degradation inhibitor) or MG132 (proteasomal inhibitor); cell lysates from HeLaWT and HeLaATG16L1-KO. (F) ATP6V1A and ATP6V0D1 (immunoblots) after fractionation (whole cell lysates, membrane, and cytosol) of HeLaWT and HeLaATG16L1-KO cell extracts. (G) Ratio of V1/V0 in membrane preparations from HeLaWT and HeLaATG16L1-KO cells. (H) Summary of findings: V-ATPase assembly is regulated by ATG16L1. Statistical significance was determined by paired t test (B and G) and by two-way ANOVA (D and E). Data: means ± SEM, n ≥ 3 (biologically independent experiments). Baf A1, bafilomycin A1. Source data are available for this figure: SourceData F6.
ATG16L1 regulates V-ATPase assembly. (A and B) ATP6V1A immunoblot (A) and band intensity (ATG16L1) quantification (B) in HeLaWT and HeLaATG16L1-KO. (C–E) ATP6V1A and ATP6V0D1 immunoblot (C) and quantification (D and E) without or upon treatment of cells with Bafilomycin A1 (lysosomal degradation inhibitor) or MG132 (proteasomal inhibitor); cell lysates from HeLaWT and HeLaATG16L1-KO. (F) ATP6V1A and ATP6V0D1 (immunoblots) after fractionation (whole cell lysates, membrane, and cytosol) of HeLaWT and HeLaATG16L1-KO cell extracts. (G) Ratio of V1/V0 in membrane preparations from HeLaWT and HeLaATG16L1-KO cells. (H) Summary of findings: V-ATPase assembly is regulated by ATG16L1. Statistical significance was determined by paired t test (B and G) and by two-way ANOVA (D and E). Data: means ± SEM, n ≥ 3 (biologically independent experiments). Baf A1, bafilomycin A1. Source data are available for this figure: SourceData F6.
The next possibility examined was an increased recruitment of the V1 domain of V-ATPase to endolysosomal membranes. To test this, we separated membranes from the cytosol using previously reported methods (Hooper et al., 2022) and observed by immunoblotting increased ATP6V1A levels in membrane fractions (Fig. 6 F and Fig. S2 A), whereas the total level of ATP6V1A in whole cell lysate did not change (Fig. S2 B). This was quantified by determining ATP6V1A/ATP6V0D1 ratios as a measure of V1V0 association, which increased in ATG16L1 KO cells (Fig. 6 G). Thus, in cells deficient for ATG16L1, there is an increase in the formation of V1V0 complexes on membranes. This fits the model in which ATG16L1 acts as an inhibitor of V-ATPase assembly by shifting the equilibrium of V-ATPase toward the disassembled state of V1 and V0 domains (Fig. 6 H).
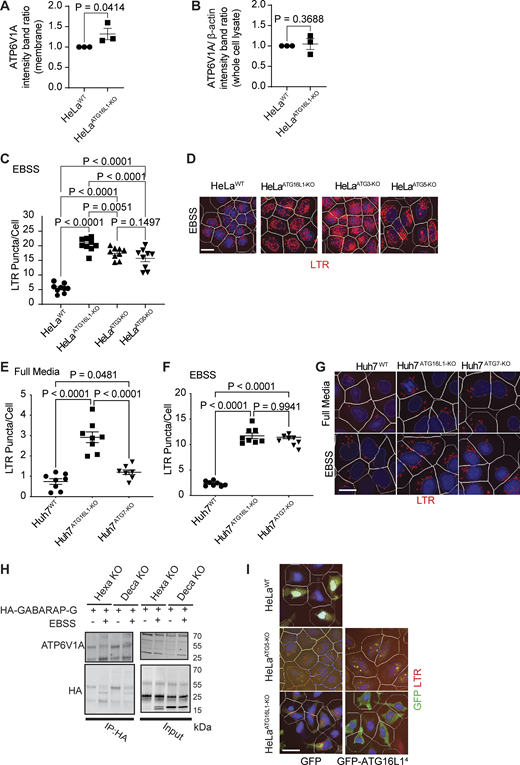
Effects of ATG16L1 and other atg8ylation factors on V-ATPase and acidification. (A and B) Quantification of ATP6V1A immunoblots (Fig. 5 F) in membrane (A) and whole cell lysate (B) in HeLaWT and HeLaATG16L1-KO. (C and D) HCM quantification (LTR) and example images of HeLa mutants with inactivated atg8ylation genes. (E–G) LTR puncta/cell in full media (E), EBSS (F), and HCM images (G) of Huh7WT, Huh7 ATG16L1-KO, and Huh7ATG7-KO cells. (H) Immunoblot analysis (denaturing conditions) of HA IP for ATP6V1A performed on untreated or EBSS-treated (90 min) lysates from mATG8s knockout (Hexa KO) or ATG4/ATG8 knockout (Deca KO) HeLa cells expressing HA-GBRPL-G (primed GABARAP with exposed C-terminal Gly). (I) Example images from a large bank of HCM images corresponding to Fig. 7 I. Masks: LTR (red), GFP (green), Hoechst 33342 (nuclei, blue), and cell outlines (primary objects, white). Statistical significance was determined by paired t test (A and B) and ANOVA (C–F). Data: means ± SEM, n = 3 (immunoblot) or n ≥ 8 (biologically independent replicates, different plates) for HCM; each HCM experiment: 1,000 valid primary objects/well, 5–6 wells technical replicates per plate. Scale bars: 5 µm. Source data are available for this figure: SourceData FS2.
Effects of ATG16L1 and other atg8ylation factors on V-ATPase and acidification. (A and B) Quantification of ATP6V1A immunoblots (Fig. 5 F) in membrane (A) and whole cell lysate (B) in HeLaWT and HeLaATG16L1-KO. (C and D) HCM quantification (LTR) and example images of HeLa mutants with inactivated atg8ylation genes. (E–G) LTR puncta/cell in full media (E), EBSS (F), and HCM images (G) of Huh7WT, Huh7 ATG16L1-KO, and Huh7ATG7-KO cells. (H) Immunoblot analysis (denaturing conditions) of HA IP for ATP6V1A performed on untreated or EBSS-treated (90 min) lysates from mATG8s knockout (Hexa KO) or ATG4/ATG8 knockout (Deca KO) HeLa cells expressing HA-GBRPL-G (primed GABARAP with exposed C-terminal Gly). (I) Example images from a large bank of HCM images corresponding to Fig. 7 I. Masks: LTR (red), GFP (green), Hoechst 33342 (nuclei, blue), and cell outlines (primary objects, white). Statistical significance was determined by paired t test (A and B) and ANOVA (C–F). Data: means ± SEM, n = 3 (immunoblot) or n ≥ 8 (biologically independent replicates, different plates) for HCM; each HCM experiment: 1,000 valid primary objects/well, 5–6 wells technical replicates per plate. Scale bars: 5 µm. Source data are available for this figure: SourceData FS2.
Canonical autophagy is not required for ATG16L1 effects on V-ATPase
ATG16L1 is a component of the best-studied E3 ligase participating in both canonical autophagy (Mizushima, 2020) and in noncanonical forms of membrane atg8ylation (Deretic et al., 2024a). To examine whether canonical autophagy or noncanonical processes, both entailing membrane atg8ylation, contribute to hyperacidification phenotype observed with ATG16L1, we used a panel of other mutants in genes specific for canonical autophagy (FIP200 and ATG13) and in genes that participate in membrane atg8ylation (ATG3, ATG5, and ATG7) and tested whether they too displayed a hyperacidification phenotype (Fig. 7, A–D). HeLaFIP200-KO and HeLaATG13-KO showed no changes in LTR+ compartments in full medium compared with parental WT cells (Fig. 7, A and B). Thus, canonical autophagy changes are not responsible for hyperacidification phenotype associated with a loss of ATG16L1.
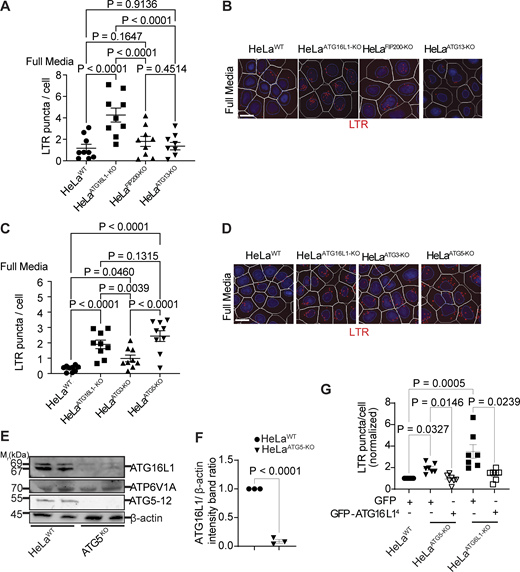
Effects of canonical autophagy and membrane atg8ylation systems on the control of V-ATPase. (A and B) Absence of effects of canonical autophagy factors (FIP200 and ATG13). HCM quantification of LTR puncta/cell in HeLaWT, HeLaATG16L1-KO, HeLaFIP200-KO, and HeLaATG13-KO cells. Images in C are from a large machine-acquired/processed bank of HCM data. (C and D) LTR puncta/cell in HeLaWT, HeLaATG16L1-KO, HeLaATG3-KO, and HeLaATG5-KO cells; C, HCM images from the HCM bank. White masks, outlines of cells/primary objects; LTR, red mask (puncta quantified by HCM); Hoechst 33342 (nuclei) blue circle mask. Scale bars: 5 µm. (E and F) ATG16L1 immunoblots (E) and band intensity quantification (F) in cell lysates from HeLaWT and HeLaATG5-KO (second lane in each set, MG132 treatment; note no effect). (G) LTR puncta/cell in HeLaWT, HeLaATG5-KO, and HeLaATG16L1-KO cells transfected with GFP or GFP-ATG16L14 (NM_001190266.1) in full media. Statistical significance was determined by two-way ANOVA (A and C), paired t test (F), and one-way ANOVA (G). Data: means ± SEM, n ≥ 5 (biologically independent replicates, different plates); each HCM experiment: 1,000 valid primary objects/well, 5–6 wells technical replicates per plate. Scale bars: 5 µm. Source data are available for this figure: SourceData F7.
Effects of canonical autophagy and membrane atg8ylation systems on the control of V-ATPase. (A and B) Absence of effects of canonical autophagy factors (FIP200 and ATG13). HCM quantification of LTR puncta/cell in HeLaWT, HeLaATG16L1-KO, HeLaFIP200-KO, and HeLaATG13-KO cells. Images in C are from a large machine-acquired/processed bank of HCM data. (C and D) LTR puncta/cell in HeLaWT, HeLaATG16L1-KO, HeLaATG3-KO, and HeLaATG5-KO cells; C, HCM images from the HCM bank. White masks, outlines of cells/primary objects; LTR, red mask (puncta quantified by HCM); Hoechst 33342 (nuclei) blue circle mask. Scale bars: 5 µm. (E and F) ATG16L1 immunoblots (E) and band intensity quantification (F) in cell lysates from HeLaWT and HeLaATG5-KO (second lane in each set, MG132 treatment; note no effect). (G) LTR puncta/cell in HeLaWT, HeLaATG5-KO, and HeLaATG16L1-KO cells transfected with GFP or GFP-ATG16L14 (NM_001190266.1) in full media. Statistical significance was determined by two-way ANOVA (A and C), paired t test (F), and one-way ANOVA (G). Data: means ± SEM, n ≥ 5 (biologically independent replicates, different plates); each HCM experiment: 1,000 valid primary objects/well, 5–6 wells technical replicates per plate. Scale bars: 5 µm. Source data are available for this figure: SourceData F7.
ATG16L1 can bypass ATG5-dependent atg8ylation to exert effects on V-ATPase
HeLaATG3-KO and HeLaATG5-KO showed an increase in LTR profiles (Fig. 7, C and D; and Fig. S2, C and D) relative to parental HeLaWT cells, comparable with the effects seen with HeLaATG16L1-KO cells. This hyperacidification phenotype was also observed in Huh7 cells knocked out for ATG7 (Huh7ATG7-KO cells) relative to their parental Huh7WT cells (Fig. S2, E–G). Thus, all atg8ylation mutants tested showed hyperacidification phenotype. The question arose of whether membrane (Deretic et al., 2024a; Deretic and Lazarou, 2022; Kumar et al., 2021b) or protein (Agrotis et al., 2019; Carosi et al., 2021; Ketteler et al., 2024; Nguyen et al., 2021) atg8ylation are responsible for ATG16L1 effects on V-ATPase. Based on the recent studies (Ketteler et al., 2024), protein atg8ylation is independent of ATG5, a key component of the ATG12–ATG5–ATG16L1 E3 ligase, and thus this possibility can be ruled out. Nevertheless, we additionally tested whether we could detect atg8ylation of the V1 subunit in ATG16L1 WT cells. For this, we expressed “activated” HA-GABARAP-G (Jia et al., 2022) with exposed C-terminal Gly in Hexa HeLa cells (lacking six mAtg8s [Nguyen et al., 2016]) and Deca HeLa cells (Hexa HeLa with additional KO of all four ATG4s [Nguyen et al., 2021]). ATG4s constitutively de-atg8ylate proteins in Hexa cells (Agrotis et al., 2019) but are absent in Deca cells. After IP of HA and immunoblotting for V-ATPase, we did not observe any new higher molecular weight bands in Deca cells that were absent in Hexa cells (Fig. S2 H). These results, taken together with the report (Ketteler et al., 2024) that protein atg8ylation is independent of ATG5 and thus by extension independent of ATG16L1, lead us to conclude that protein atg8ylation is likely not responsible for inhibition of V-ATPase in WT cells.
We next considered whether membrane atg8ylation is responsible for the effects on V-ATPase. A previous report has shown that ATG16L1 is destabilized in ATG5 KO cells (Wible et al., 2019). We confirmed this in HeLaATG5-KO cells (Fig. 7, E and F). Thus, a possibility emerged that the hyperacidification phenotype observed with the mutants in at least some components of membrane atg8ylation machinery, such as ATG5, may be indirect due to reduced ATG16L1 levels. To test this, we performed cross-complementation experiments, transfecting/overexpressing ATG16L1 in HeLaATG5-KO and quantifying LTR phenotype by HCM. HeLaATG5-KO transfected with GFP-ATG16L14 (isoform 4; resistant to destabilization in the absence of ATG5) lost their hyperacidification phenotype as determined by HCM of LTR levels (Fig. 7 G and Fig. S2 I). We conclude that, when overexpressed, ATG16L1 can bypass a requirement for ATG5-dependent membrane atg8ylation to exert its effects on V-ATPase, acting as a hitherto unappreciated standalone regulator of V-ATPase.
Effects of ATG16L1 inactivation on the known regulators of V-ATPase assembly
The mechanisms for regulation of V-ATPase assembly are complex and not completely understood (Collins and Forgac, 2020; Forgac, 2007; Freeman et al., 2023; Jaskolka et al., 2021; Kane, 1995; Oot and Wilkens, 2024; Trombetta et al., 2003). Among the known factors affecting the V1V0 assembly and disassembly in mammalian systems are diverse factors, including (1) Rabconnectin complexes corresponding to components of the RAVE complex in yeast (Jaskolka et al., 2021), including newly described ROGDI in mammalian cells (Winkley and Kane, 2025); (2) TLDc family members (Oot and Wilkens, 2024), including TBC1D24 (Pepe et al., 2025), and others such as OXR1 (Khan et al., 2022), mEAK7 (Oot and Wilkens, 2024; Tan et al., 2022; Wang et al., 2022a), and NCOA7 (Harvey et al., 2025); and (3) glycolytic enzymes, such as aldolase, which has been reported to interact with V-ATPase (Li et al., 2019; Lu et al., 2007; Lu et al., 2004; Zhang et al., 2017). None of the above factors, with the exception of ALDOA, were in the ATG16L1 proximity interactome (Table S1 and Tab1).
The V1V0 assembly and V-ATPase activity are affected by signaling pathways associated with mTOR (Collins and Forgac, 2020; Collins et al., 2020; Ratto et al., 2022; Stransky and Forgac, 2015; Zoncu et al., 2011) and can also be influenced by membrane lipids such as phosphoinositides, including PI(3,5)P2 (Banerjee and Kane, 2020; Li et al., 2014; Mitra et al., 2023). We examined the above factors in ATG16L1 KO cells. Apilimod (inhibitor of PikFYVE and PI(3,5)P2 production [Ikonomov et al., 2019]) showed an inhibitory trend, whereas VPS34-IN-1 (inhibitor of PI3P generation, a precursor to PI(3,5)P2) diminished hyperacidification phenotype in ATG16L1 KO cells (Fig. S3 A), thus confirming the specificity of the effect of ATG16L1 on V-ATPase. We next tested mTOR because there is a well-established functional relationship between the ATG systems and mTOR (Efeyan et al., 2013; Ganley et al., 2009; Goul et al., 2023; Hosokawa et al., 2009; Kim et al., 2011; Kumar et al., 2020a; Manifava et al., 2016; Settembre et al., 2011), and since we found mTOR and Rheb in our ATG16L1 interactome proteomic data (Table S1 and Tab1). The anticipated effect was that absence of ATG16L1 could inactivate mTOR based on a recent report that inactive mTOR leads to increased V1V0 assembly and lysosomal acidification (Ratto et al., 2022). However, we observed in ATG16L1 KO cells in full media neither loss of mTOR from lysosomes (Fig. S3 B) nor diminished phospho-S6K levels (Fig. S3 C), indicating that mTOR remains active in ATG16L1 KO cells. As a comparator control, mTOR was responsive to starvation (aa and growth factors) as it desorbed from lysosomes and lost kinase activity toward S6K substrate in EBSS (Fig. S3, B and C). ATG16L1 KO actually increased mTOR localization to lysosomes in either fed or aa- and growth factor–starved cells (Fig. S3 B). Thus, increased assembly of V1V0, enhanced V-ATPase activity, and hyperacidification in ATG16L1 KO cells cannot be explained by inactivation of mTOR secondary to the loss of ATG16L1. The aldolase isoform ALDOA was found in our proteomic analyses (Table S1), and thus we intended to test whether absence of ATG16L1 affected ALDOA association with V-ATPase. However, using SidK (an effector protein of Legionella pneumophila that firmly binds V-ATPase), we could not discern whether there was more ALDOA in our co-IPs with SidK-GFP (relative to GFP control) in ATG16L1 KO cells vs WT cells (Fig. S3 D). We next examined DMXL1, a member of the Rabconnectin complex affecting V-ATPase (Merkulova et al., 2015; Eaton et al., 2024). We observed increased levels of DMXL1 in whole cell lysates of ATG16L1 KOs in three different cell lines tested (HeLa, Huh7, and PC-3) (Fig. S3 E). The elevated DMXL1 in ATG16L1 KO cells could potentially contribute to increased V1V0 assembly and V-ATPase activity observed in the absence of ATG16L1 or be a consequence of other effects. When we knocked down DMXL1 in ATG16L1 KO cells, this did not diminish the elevated LTR signal (Fig. S3 F), which is compatible with a noncausal effect of increased DMXL1 in the absence of ATG16L1. This is in keeping with the direct action of ATG16L1 on V-ATPase demonstrated in vitro (Fig. 5, D–F).
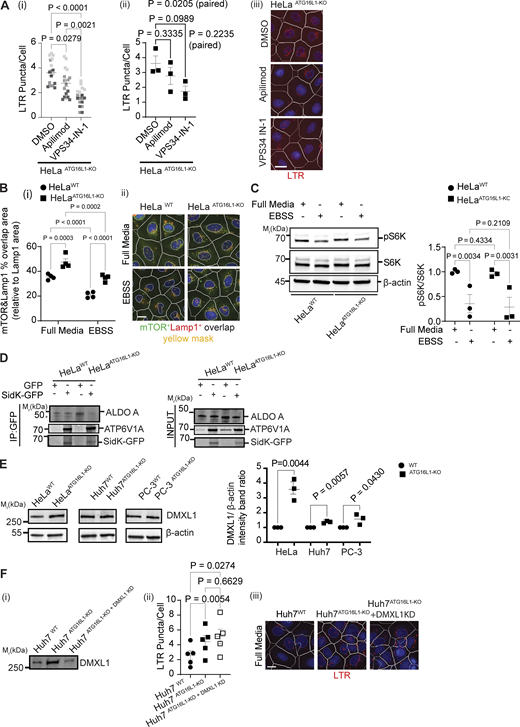
Analysis of the effects of ATG16L1 inactivation on a subset of known regulators of V-ATPase. (A) HCM LTR puncta/cell (i and ii) and HCM images (iii) of HeLaATG16L1-KO treated with DMSO, 0.5 µM apilimod, or 5 µM VPS34 inhibitor (VPS34-IN-1) for 90 min. (B) HCM quantification (i) and HCM images (ii) of overlaps between mTOR and LAMP1 in HeLaWT and HeLaATG16L1-KO in full media or EBSS for 90 min. Lamp1 (red mask), mTOR (green mask) and overlap (yellow mask), Hoechst 33342 (nuclei, blue), and primary objects/cells (white masks). Scale bar: 5 µm. (C) Phospho-S6K and S6K immunoblot and quantification in extracts from HeLaWT and HeLaATG16L1-KO in full media or EBSS for 90 min. Data: means ± SEM, n ≥ 3 (biologically independent replicates, different gels). (D) co-IP of Sidk-GFP (or GFP control) with ALDOA and ATP6V1A in HeLaWT and HeLaATG16L1-KO. (E) DMXL1 immunoblots and quantification in extracts from HeLa, Huh7, and PC-3 cells (parental and ATG16L1 KO). Data: means ± SEM, n ≥ 3 (biologically independent replicates, different gels). (F) Immunoblot (i), HCM LTR puncta/cell (ii), and HCM images (iii) in samples from Huh7WT, Huh7ATG16L1-KO, and Huh7 ATG16L1-KO+DMXL1KD cells. Statistical significance was determined by one-way ANOVA (A and F), two-way ANOVA (B and C), and paired t test (E). Data: means ± SEM, n ≥ 3 (biologically independent replicates, different plates); each HCM experiment: 1,000 valid primary objects/well, 5–6 wells technical replicates per plate. Scale bars: 5 µm. All HCM images shown are from a large bank of collected data. Source data are available for this figure: SourceData FS3.
Analysis of the effects of ATG16L1 inactivation on a subset of known regulators of V-ATPase. (A) HCM LTR puncta/cell (i and ii) and HCM images (iii) of HeLaATG16L1-KO treated with DMSO, 0.5 µM apilimod, or 5 µM VPS34 inhibitor (VPS34-IN-1) for 90 min. (B) HCM quantification (i) and HCM images (ii) of overlaps between mTOR and LAMP1 in HeLaWT and HeLaATG16L1-KO in full media or EBSS for 90 min. Lamp1 (red mask), mTOR (green mask) and overlap (yellow mask), Hoechst 33342 (nuclei, blue), and primary objects/cells (white masks). Scale bar: 5 µm. (C) Phospho-S6K and S6K immunoblot and quantification in extracts from HeLaWT and HeLaATG16L1-KO in full media or EBSS for 90 min. Data: means ± SEM, n ≥ 3 (biologically independent replicates, different gels). (D) co-IP of Sidk-GFP (or GFP control) with ALDOA and ATP6V1A in HeLaWT and HeLaATG16L1-KO. (E) DMXL1 immunoblots and quantification in extracts from HeLa, Huh7, and PC-3 cells (parental and ATG16L1 KO). Data: means ± SEM, n ≥ 3 (biologically independent replicates, different gels). (F) Immunoblot (i), HCM LTR puncta/cell (ii), and HCM images (iii) in samples from Huh7WT, Huh7ATG16L1-KO, and Huh7 ATG16L1-KO+DMXL1KD cells. Statistical significance was determined by one-way ANOVA (A and F), two-way ANOVA (B and C), and paired t test (E). Data: means ± SEM, n ≥ 3 (biologically independent replicates, different plates); each HCM experiment: 1,000 valid primary objects/well, 5–6 wells technical replicates per plate. Scale bars: 5 µm. All HCM images shown are from a large bank of collected data. Source data are available for this figure: SourceData FS3.
Association of ATG16L1 with V-ATPase is necessary for control of V-ATPase
We next addressed the role of ATG16L1 that, based on the above experiments (Fig. 7 G and Fig. S2 I), when overexpressed, can be independent of other atg8ylation components. We considered the fact that ATG16L1 interacts directly with V-ATPase as previously reported (Hooper et al., 2022; Sun et al., 2023; Timimi et al., 2024; Ulferts et al., 2021; Xu et al., 2019) and as seen in our experiments (Fig. 1, B and C; and Fig. S1 E). Thus, we employed in complementation experiments a truncated form of ATG16L1 (ATG16L1E230) lacking the regions absent in yeast Atg16 including the WD domain (Paddar et al., 2025; Rai et al., 2019) (Fig. 8 A) previously implicated in interactions between ATG16L1 and V-ATPase (Hooper et al., 2022; Kang et al., 2024; Sun et al., 2023; Xu et al., 2019). The ATG16L1E230 variant retains all aspects required for carrying out atg8ylation in the context of canonical autophagy (Rai et al., 2019). In co-IPs, ATG16L1E230 did not detectably interact with V-ATPase (Fig. 8, B and C). In complementation experiments, transfection with FLAG-ATG16L1E230 did not reverse the hyperacidification in ATG16L1 KO cells (Fig. 8 D and Fig. S4 A).
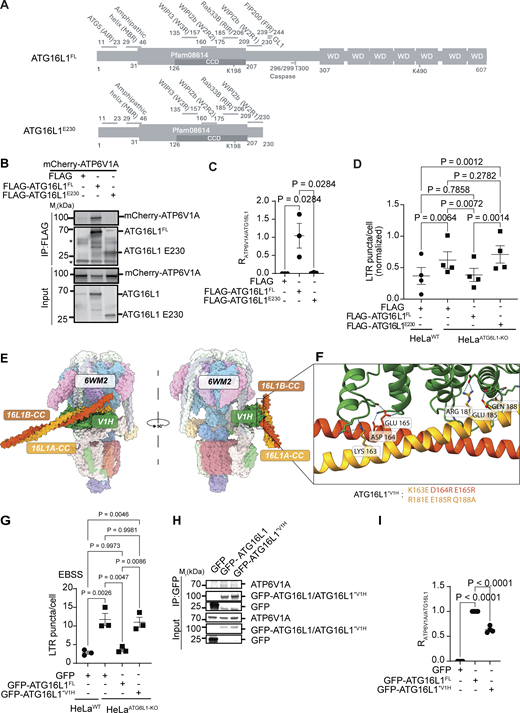
Effects of ATG16L1E230truncation and mutations in ATG16L1 V1H interaction sites. (A) Schematic, ATG16L1 full-length and ATG16L1E230 indicating regions of interaction with known binding partners based on existing crystal structures, when applicable. (B and C) co-IP (B) and quantification (C) of ATP6V1A assocaition with FLAG, FLAG-ATG16L1FL, and FLAG-ATG16L1E230. Data: means ± SEM, n = 3 (biologically independent replicates). (D) LTR puncta/cell (HCM) in HeLaWT and HeLaATG16L1-KO cells transfected with FLAG, FLAG-ATG16L1FL, or FLAG-ATG16L1E230. Data: means ± SEM, n = 4 (biologically independent replicates). (E) Overlay of AlphaFold3 predicted interactions between ATG16L1-CC dimer (region 78–230; CC, predicted coiled-coil) and V1H imposed on the known structure of human V-ATPase (PDB ID: 6WM2). ATG16L1A and ATG16L1B, A and B chains of ATG16L1 in its dimer. (F) Residues participating in putative interactions predicted by AF3 Multimer and Chimera X analyses. Site detail was flipped and rotated to enable viewing of a putative ATG16L1-ATP6V1H–binding pocket; the mutated aa in ATG16L1 are indicated (CC-chain A in yellow, and CC-chain B in orange). (G) LTR puncta/cell (HCM) in HeLaWT and HeLaATG16L1-KO cells transfected with GFP, GFP-ATG16L1FL, and GFP-ATG16L1*V1H in EBSS. Data: means ± SEM, n = 3 (biologically independent replicates). (H and I) co-IP (H) and quantification (I) of ATP6V1A with GFP, GFP-ATG16L1FL, and GFP-ATG16L1*V1H. Data: means ± SEM, n = 4 (biologically independent replicates). HCM experiments in D and G: 1,000 primary objects/well, 4–6 wells technical replicates per plate. Statistical significance was determined by one-way ANOVA. Source data are available for this figure: SourceData F8.
Effects of ATG16L1E230truncation and mutations in ATG16L1 V1H interaction sites. (A) Schematic, ATG16L1 full-length and ATG16L1E230 indicating regions of interaction with known binding partners based on existing crystal structures, when applicable. (B and C) co-IP (B) and quantification (C) of ATP6V1A assocaition with FLAG, FLAG-ATG16L1FL, and FLAG-ATG16L1E230. Data: means ± SEM, n = 3 (biologically independent replicates). (D) LTR puncta/cell (HCM) in HeLaWT and HeLaATG16L1-KO cells transfected with FLAG, FLAG-ATG16L1FL, or FLAG-ATG16L1E230. Data: means ± SEM, n = 4 (biologically independent replicates). (E) Overlay of AlphaFold3 predicted interactions between ATG16L1-CC dimer (region 78–230; CC, predicted coiled-coil) and V1H imposed on the known structure of human V-ATPase (PDB ID: 6WM2). ATG16L1A and ATG16L1B, A and B chains of ATG16L1 in its dimer. (F) Residues participating in putative interactions predicted by AF3 Multimer and Chimera X analyses. Site detail was flipped and rotated to enable viewing of a putative ATG16L1-ATP6V1H–binding pocket; the mutated aa in ATG16L1 are indicated (CC-chain A in yellow, and CC-chain B in orange). (G) LTR puncta/cell (HCM) in HeLaWT and HeLaATG16L1-KO cells transfected with GFP, GFP-ATG16L1FL, and GFP-ATG16L1*V1H in EBSS. Data: means ± SEM, n = 3 (biologically independent replicates). (H and I) co-IP (H) and quantification (I) of ATP6V1A with GFP, GFP-ATG16L1FL, and GFP-ATG16L1*V1H. Data: means ± SEM, n = 4 (biologically independent replicates). HCM experiments in D and G: 1,000 primary objects/well, 4–6 wells technical replicates per plate. Statistical significance was determined by one-way ANOVA. Source data are available for this figure: SourceData F8.
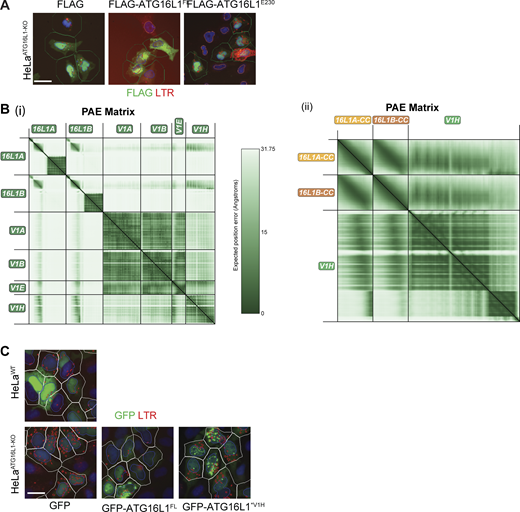
Additional documentation for complementation experiments and AlphaFold analyses. (A) Examples from a large bank of HCM images corresponding to Fig. 8 D. Masks: LTR (red), FLAG (green), Hoechst 33342 (nuclei, blue), and cell outlines/primary objects (white). Scale bar: 5 µm. (B) AlphaFold3 analysis of ATG16L1 dimer with V1 subunits. (i) Predicted aligned error (PAE) for AlphaFold3 modeling of the ATG16L1 dimer with key components of the V1 complex (V1A, V1B, V1E, and V1H). (ii) PAE for AlphaFold3 modeling of ATG16L1 coiled-coil dimer (aa 78–230) with V1H alone. Darker regions indicate greater prediction accuracy. Interface predicted template modeling (ipTM) score for the complex of ATG16L1 coiled-coil dimer (aa 78–230) with V1H was 0.58. (C) Examples from a large bank of HCM images corresponding to Fig. 8 G. Masks: LTR (red), GFP (green), Hoechst 33342 (nuclei, blue), and cell outlines/primary objects (white). Scale bar: 5 µm. Source data are available for this figure: SourceData FS4.
Additional documentation for complementation experiments and AlphaFold analyses. (A) Examples from a large bank of HCM images corresponding to Fig. 8 D. Masks: LTR (red), FLAG (green), Hoechst 33342 (nuclei, blue), and cell outlines/primary objects (white). Scale bar: 5 µm. (B) AlphaFold3 analysis of ATG16L1 dimer with V1 subunits. (i) Predicted aligned error (PAE) for AlphaFold3 modeling of the ATG16L1 dimer with key components of the V1 complex (V1A, V1B, V1E, and V1H). (ii) PAE for AlphaFold3 modeling of ATG16L1 coiled-coil dimer (aa 78–230) with V1H alone. Darker regions indicate greater prediction accuracy. Interface predicted template modeling (ipTM) score for the complex of ATG16L1 coiled-coil dimer (aa 78–230) with V1H was 0.58. (C) Examples from a large bank of HCM images corresponding to Fig. 8 G. Masks: LTR (red), GFP (green), Hoechst 33342 (nuclei, blue), and cell outlines/primary objects (white). Scale bar: 5 µm. Source data are available for this figure: SourceData FS4.
Additional residues, such as K198 (Fig. 8 A) within the region of ATG16L1 absent in yeast Atg16 (which is only 151 aa long compared with 607 aa in ATG16L1), have recently been identified in cross-link mass spectrometry with ATP6V1H (Timimi et al., 2024) and may play a role in ATG16L1–V-ATPase interactions. We detected interactions between ATG16L1 and V1H in our proximity proteomic analysis (Table S1 and Tab2). AlphaFold (AF3) modeling of the coiled-coil domain (including K198) of ATG16L1 with V1H subunit showed potential for complex formation (Fig. 8 E and Fig. S4 B). We mutated residues (K163, D164, and E165) and (R181, E185, and Q188) clustered in two regions of ATG16L1 predicted by AlphaFold to contact V1H, which engaged both chains of the ATG16L1 dimer (Fig. 8 F). These mutations (ATG16L1*V1H) resulted in a loss of the ability of ATG16L1 to complement the hyperacidification phenotype in ATG16L1 KO cells incubated in EBSS, conditions that enhanced the range of detectable differences in LTR staining (Fig. 8 G and Fig. S4 C). It also diminished capacity of ATG16L1 to bind the V1 domain of V-ATPase assessed by levels of V1A (used as a proxy due to an overlap between ATP6V1H and immunoglobulin bands) in co-IPs with ATG16L1 (Fig. 8, H and I).
In summary, the absence of the portions of the coiled-coil and WD regions in ATG16L1E230 was sufficient to abrogate binding between ATG16L1 and V-ATPase and prevented complementation of the hyperacidification phenotype in ATG16L1 KO cells. Furthermore, specific interactions between V1H and ATG16L1 identified here contributed to the association of ATG16L1 with V-ATPase and were important for its ability to inhibit this pump.
ATG16L1’s ability to bind V-ATPase is critical for control of Mycobacterium tuberculosis
We next intended to test whether the loss of ATG16L1 ability to control V-ATPase, such as in the case of ATG16L1E230 (Rai et al., 2019) had a detectable in vivo phenotype. For this, we used M. tuberculosis (Mtb) infection model in mice. Early studies with conditional Atg5 knockout mice have implicated canonical autophagy in control of Mtb in vivo (Castillo et al., 2012; Watson et al., 2012) but were subsequently contested (Kimmey et al., 2015). This has remained an unresolved controversy, as recent studies reaffirmed the role of additional atg8ylation genes, such as Atg16L1, in controlling Mtb (Golovkine et al., 2023), whereas other studies have revived the idea that canonical autophagy plays a role in control of Mtb (Feng et al., 2024; Mittal et al., 2024). Might then the effects of ATG16L1 uncovered in the present study be of relevance for control of Mtb and suggest a resolution to this controversy? To test this, we employed the previously characterized transgenic mouse in which Atg16l1 gene has been modified by introducing a stop codon after the E230 residue, thus lacking its domains shown above to play a role in binding to and regulating V-ATPase while retaining the WIPI2b-intercating motif and remaining competent for canonical autophagy (Rai et al., 2019). The mice were subjected to aerosol infection with Mtb Erdman in several independent experiments. We used a range of initial Mtb bacilli deposition doses conventionally employed to model chronic infection (low-dose, long-term survival in the presence of bacterial infection) (Castillo et al., 2012; Golovkine et al., 2023; Kimmey et al., 2015; Wang et al., 2023; Watson et al., 2012) or acute infection (high dose) (Chauhan et al., 2016; Feng et al., 2024; Jia et al., 2020b; Mittal et al., 2024). The Atg16l1E230 animals succumbed to Mtb within 30 days, whereas control littermate animals were resistant to low-dose (chronic) infection (Fig. 9 A). Similarly, in an intermediate infectious dose model (Fig. 9 B) and in a high infectious dose (acute) model (Fig. S5), Atg16l1E230 animals succumbed to Mtb before WT controls. Thus, mice lacking the Atg16l1 domain interacting with the V1 complex of V-ATPase but retaining the full canonical autophagy capability (Rai et al., 2019) were hypersensitive to Mtb.

Susceptibility of Atg16l1 E230 mice to Mtb infection. (A and B) Kaplan–Meier survival rate of mice infected with Mtb Erdman. Mouse groups (littermates): Atg16L1E230/E230, Atg16L1WT/WT (homozygous control), and Atg16L1 E230/WT (heterozygous control). Aerosol infection: low dose (A); intermediate dose (B). Gehan–Breslow–Wilcoxon and Mantel–Cox (log-rank) tests.
Susceptibility of Atg16l1 E230 mice to Mtb infection. (A and B) Kaplan–Meier survival rate of mice infected with Mtb Erdman. Mouse groups (littermates): Atg16L1E230/E230, Atg16L1WT/WT (homozygous control), and Atg16L1 E230/WT (heterozygous control). Aerosol infection: low dose (A); intermediate dose (B). Gehan–Breslow–Wilcoxon and Mantel–Cox (log-rank) tests.

High-dose Mtb infection in Atg16l1 E230 mice. Kaplan–Meier survival curve of mice infected with Mtb Erdman (high-dose aerosol infection). Experimental groups: Atg16l1E230/E230 mice and Ubc-Cre-AMPKfl/fl, Cre− (used as comparator group. Survival comparison, Gehan–Breslow–Wilcoxon and Mantel–Cox (log-rank) tests.
High-dose Mtb infection in Atg16l1 E230 mice. Kaplan–Meier survival curve of mice infected with Mtb Erdman (high-dose aerosol infection). Experimental groups: Atg16l1E230/E230 mice and Ubc-Cre-AMPKfl/fl, Cre− (used as comparator group. Survival comparison, Gehan–Breslow–Wilcoxon and Mantel–Cox (log-rank) tests.
Discussion
In this work, we have uncovered a previously unappreciated role in the regulation of V-ATPase assembly and activity of the otherwise well-studied protein ATG16L1, primarily known for its roles in canonical autophagy and membrane atg8ylation. This newly found ATG16L1 function is independent of ATG16L1’s role in canonical autophagy. The effects of ATG16L1 rely on its binding to V-ATPase, whereupon it negatively controls proton pump’s function (Fig 10). This tonic ATG16L1’s activity is present under homeostatic conditions without exogenously imposed stress (Fig. 10). We furthermore show that the deletion of a V-ATPase–interacting domain of ATG16L1, which is responsible for its functions uncovered here, has a strong in vivo phenotype in a murine model of tuberculosis.

Model of ATG16L1 as a regulator of mammalian V-ATPase. Top, ATG16L1 AlphaFold predicted structure and its WD and CCD regions, the latter containing the section of ATG16L1 used in modeling its interactions with V1H. Bottom left: Under homeostatic conditions (e.g., cells with intact lysosomes) ATG16L1 inhibits V-ATPase to maintain optimal normo-acidic pH of endolysosomal organelles and prevent futile ATP hydrolysis. In the absence of ATG16L1, this process is perturbed, and V-ATPase is excessively activated, causing hyperacidification of endolysosomal compartments. Right, under stress conditions, such as starvation or endomembrane injury, ATG16L1 is mobilized as atg8ylation E3 ligase to support canonical autophagy or noncanonical processes known as CASM or VAIL.
Model of ATG16L1 as a regulator of mammalian V-ATPase. Top, ATG16L1 AlphaFold predicted structure and its WD and CCD regions, the latter containing the section of ATG16L1 used in modeling its interactions with V1H. Bottom left: Under homeostatic conditions (e.g., cells with intact lysosomes) ATG16L1 inhibits V-ATPase to maintain optimal normo-acidic pH of endolysosomal organelles and prevent futile ATP hydrolysis. In the absence of ATG16L1, this process is perturbed, and V-ATPase is excessively activated, causing hyperacidification of endolysosomal compartments. Right, under stress conditions, such as starvation or endomembrane injury, ATG16L1 is mobilized as atg8ylation E3 ligase to support canonical autophagy or noncanonical processes known as CASM or VAIL.
The ATG16L1’s regulatory action upon V-ATPase can be uncoupled from ATG5-dependent membrane atg8ylation when ATG16L1 is overexpressed. Since inactivation of multiple membrane atg8ylation components (ATG3 and ATG7) phenocopies ATG16L1 KO hyperacidification effects, it is likely that membrane atg8ylation normally assists ATG16L1 in control of V-ATPase, i.e., when ATG16L1 is not overexpressed. In addition to its effects on V-ATPase uncovered here, ATG16L1 participates in lysosomal quality control via membrane atg8ylation as reported elsewhere (Corkery et al., 2023; Cross et al., 2023; Jia et al., 2022; Kumar et al., 2020a; Lee et al., 2020; Nakamura et al., 2020; Paddar et al., 2025). We propose a model whereby these ATG16L1’s functions coalesce during lysosomal membrane damage. While ATG16L1 directs membrane atg8ylation in combination with repair/remodeling processes (Corkery et al., 2024, Preprint; Cross et al., 2023; Lee et al., 2020; Tan and Finkel, 2022), its binding to V-ATPase may inhibit ATP hydrolysis to prevent futile proton pumping and loss of ATP until membrane is repaired. Although our data primarily addressed ATG16L1’s action upon membrane-associated V-ATPase, it is also possible that ATG16L1 exerts an inhibitory activity on the pool of dissociated V1 domains in the cytosol.
Regulation of V-ATPase assembly and its ATPase activity may be critical, since under basal and other physiological conditions unnecessary ATP hydrolysis and excessive acidification could be detrimental. We do find that cells lacking ATG16L1 display elevated AMP levels and reduced energy charge, which may have multiple pathophysiological consequences (González et al., 2020), including the immunometabolic ones (Deretic, 2021; O’Neill et al., 2016). Whereas we find that ATG16L1 binds to V-ATPase even under resting conditions, in keeping with a report that in untreated cells V-ATPase subunits and ATG16L1 interact (Sun et al., 2023), others have reported this association in cells only upon pharmacologically perturbing endolysosomal/phagosomal compartments (Hooper et al., 2022; Xu et al., 2019). Whereas V1A and ATG16L1 bind under basal conditions, perturbation of endomembranous compartments increases this association (Sun et al., 2023).
The effect of ATG16L1 on acidification holds up under starvation conditions in our experiments. This effect of ATG16L1 cannot be explained by TFEB activation in the absence of ATG16L1 since in EBSS-treated cells TFEB is already fully activated (Goodwin et al., 2021; Kumar et al., 2020b; Settembre et al., 2013; Settembre et al., 2011). ATG16L1 KO does not change TFEB phosphorylation (Goodwin et al., 2021; Nakamura et al., 2020). Furthermore, in ATG16L1 KO cells, mTOR is active and is on lysosomes, opposite to the connection between inactivation of mTOR and TFEB activation. Although ATP6V1A is a TFEB-controlled gene (Settembre et al., 2011), we did not detect any increase in V1 levels in ATG16L1 KO cells. Other connections to canonical autophagy may, however, exist. For example, engagement of ATG16L1 during the generation of autophagosomes upon induction of canonical autophagy could relieve V-ATPase from its ATG16L1-dependent inhibition and simultaneously enhance acidification and lysosomal activity to support degradative autophagy. The ATG16L1 region (residues 163–188), identified here through AlphaFold modeling and mutational analysis as being important for ATG16L1’s association with the V1 domain and its effects upon V-ATPase, overlaps with the recently identified second binding site for WIPI2b (ATG16L1 residues 160–175) (Gong et al., 2023), compatible with potential switching of binding partners from ATP6V1H to WIPI2b during canonical autophagy induction.
The control of mammalian V-ATPase is not fully understood, and most of the known regulatory components are related to studies in yeast (Jaskolka et al., 2021). Curiously, the yeast Atg16 lacks a WD domain present in mammalian ATG16L1. Saccharomyces cerevisiae Atg16 is only 150 aa long, whereas human ATG16L1 (the standard β isoform) has 607 residues. It is then possible that the addition of the WD domain and the intervening section preceding the WD domain to the shared Atg16/ATG16L1 core during the evolution in mammals (and other metazoans as well as in plants and some protozoans [Romano et al., 2023]) reflects in part an acquisition of a regulatory function that controls V-ATPase. With a number of alternative RAVE candidates presently being pursued in the field (Forgac, 2007; Freeman et al., 2023; Jaskolka et al., 2021; Oot and Wilkens, 2024), we note that, with the exception of ROGDI (Lee et al., 2017; Winkley and Kane, 2025), nearly all of the Rav 1 paralogs (DMXL1, DMXL2, WDR7, and WDR72) possess WD domains, a feature shared with the mammalian ATG16L1.
We observed an increase in DMXL1 levels in ATG16L1 KO cells. We do not know how ATG16L1 absence results in increased DMXL1 levels in all three mutant cancer cell lines tested. DMXL1 can be degraded by proteasome upon CMV infection (Li et al., 2024), whereas autophagic/lysosomal degradation of DMXL1 has not been explored. Regardless of the mechanism, this could contribute to increased V1V0 assembly (Merkulova et al., 2015; Eaton et al., 2024). Although downregulation of DMXL1 in ATG16L1 KO cells did not reverse the hyperacidification phenotype in our experiments carried out under homeostatic conditions, this does not preclude a role for DMXL1 in other situations. While our work was in revision, a study was published showing that upon lysosomal stress/damage, ATG16L1-dependent lysosomal membrane atg8ylation recruits DMXL1 and V1 to lysosomal membranes (Lee et al., 2025). We propose a model in which, under homeostatic conditions, ATG16L1 acts to prevent hyperacidification, whereas under conditions causing lysosomal hypoacidification, which elicits ATG16L1-dependent membrane atg8ylation, this recruits DMXL1 to deliver additional V1 subunits and restore normo-acidic status to the lysosomes.
The WD domain of ATG16L1 has been proposed to contribute to the association with V-ATPase (Hooper et al., 2022; Sun et al., 2023; Ulferts et al., 2021; Xu et al., 2019), and a role of the F467 and K490 residues in the WD domain has been analyzed through mutational analyses (Fletcher et al., 2018; Hooper et al., 2022). A recent report highlighted a direct interaction between ATG16L1 and the H subunit (ATP6V1H) discovered in a cross-link MS of K198 outside of the WD domain of ATG16L1 (Timimi et al., 2024). The H subunit is known in yeast (Vma13p) to act as a brake, inhibiting ATPase activity of the V1 domain in the cytosol following disassembly from the V1 domain (Oot et al., 2017; Oot et al., 2016; Parra et al., 2000). Upon V1V0 disassembly, the C-terminal domain of H undergoes a large rotation (150°) from its position proximal to the membrane in the V1V0 complex to a position near the catalytic site in the V1 subunit, a conformational change that is believed to exert inhibitory role on the V1 subunit free in the cytosol (Oot et al., 2017; Oot et al., 2016). Our AlphaFold model of the H subunit and ATG16L1 interactions includes a region within the coiled-coil domain that is immediately adjacent to the K198 residue previously identified in cross-links between ATP6V1H and ATG16L1 (Timimi et al., 2024). This region (163–188) includes herein functionally characterized residues of ATG16L1 that participate in interactions between the two proteins and are necessary for control of V-ATPase by ATG16L1. The interaction between ATG16L1 and the inhibitory H subunit capable of blocking ATPase activity (at least in the context of the free V1 domain) suggests a model in which ATG16L1 may regulate V-ATPase function through its effects on V1H. This, however, does not preclude participation of other parts of ATG16L1, particularly the WD domain, in the effects such as V1V0 assembly and disassembly. Future analyses will be necessary to determine whether these functions can be separated.
A key limitation of this study is as follows. Whereas our in cellulo and in vitro data show a link between ATG16L1’s ability to interact with V-ATPase and its inhibition, we did not distinguish between different effector mechanisms downstream of this interaction, as they may pertain to the control of Mtb in vivo. We can exclude canonical autophagy based on our in vivo experiments with Atg16l1E230 mice, which can carry out canonical autophagy (Heckmann et al., 2020; Rai et al., 2019; Wang et al., 2021) but are exquisitely sensitive to Mtb as shown here. The other effectors could include hyperacidification, LAP, CASM, or other yet to be defined noncanonical membrane atg8ylation processes. LAP, and by extension CASM, can affect Mtb in vivo (Köster et al., 2017). However, this is observed only when partially disabled mutant strains of the tubercle bacillus are used but not with the fully virulent Mtb (Köster et al., 2017). Additional studies using mutant mice specifically disabled for LAP have excluded this process as a defense against virulent Mtb (Feng et al., 2024). The Mtb strain Erdman used in our animal studies is fully virulent (Raghavan et al., 2008). Of note, low-energy charge and elevated AMP have been observed here in ATG16L1 KO cells, which we attribute to hyperactive V-ATPase and futile ATP hydrolysis. Low-energy charge may disadvantage the host under the stress of infection. Undernutrition, as a form of malnutrition, is associated with low-energy charge and adversely affects immune response in general, including those to infections (Gerriets and MacIver, 2014). Malnutrition and active tuberculosis show direct correlation in human populations (Cegielski and McMurray, 2004; Tverdal, 1986). Future work is needed to dissect these complex relationships. Another limitation is that the relationships reported here have been observed in different types of human cancer cell lines, whereas the in vivo studies were carried out in transgenic mice.
Nevertheless, we have uncovered a new function for ATG16L1 that is independent of its role in canonical autophagy but appears coupled with membrane atg8ylation processes (Deretic and Lazarou, 2022; Deretic et al., 2024b). ATG16L1 is a novel regulator of an important ancient enzymatic complex, V-ATPase, which is essential for acidification of key intracellular compartments in cells (Forgac, 2007; Freeman et al., 2023; Kane, 1995; Trombetta et al., 2003). All cells must digest material in lysosomes, whether coming from self (canonical autophagy) (Zhao and Zhang, 2019) or from external sources (Ballabio and Bonifacino, 2020), during infection and antigen presentation in immune cells (Deretic, 2021) and various other physiological processes, including acidification of the extracellular milieu in specialized tissues (Forgac, 2007; Freeman et al., 2023; Kane, 1995; Trombetta et al., 2003), loading of neurotransmitters into synaptic vesicles (Coupland et al., 2024; Wang et al., 2024), and pathological conditions such as cancer metastasis (Chen et al., 2022; Stransky et al., 2016). Thus, the newly found role for ATG16L1 is a significant advancement in our understanding of how these functions are integrated in the cell, of relevance for health and disease.
Materials and methods
Antibodies
The antibodies used in this study were as follows: ALDOA (WB-1:1,000, #11217-1-AP; Proteintech), ATG16L1 (WB-1:1,000, #M150-3; MBL), ATG5 (WB:1:2,000, #ab108327; Abcam), ATP6V0D1 (WB-1:1,000, #ab56441; Abcam), ATP6V1A (IF-1:200, IP-1:200, #ab199326; Abcam, WB-1:1,000, #17115-1-AP; Proteintech,), ATP6V1E (WB-1:1,000, #15280-1-AP; Proteintech), Beta-actin (WB-1:2,000; Proteintech, rabbit or WB-1:2,500, #sc-47778; Santa Cruz, mouse), CD63 (IF:1:500, #556019; BD, mouse), DMXL1 (WB-1:1,000, #24413-1-AP; Proteintech), EEA1 (IF-1:500, #AF8047; R&D Systems), FLAG [IF-1:200, WB-1:2,000, IP-1:200, #1804; Sigma-Aldrich or WB-1:2,000, #14793; CST), GFP (WB-1:2,000, #ab291; Abcam [mouse] or #ab290 [rabbit]), HA-tag (WB-1:1,000, #3724; CST), Lamp1 (IF-1:500, #15665; CST), Lamp2 (WB-1:1,000, #H4B4; Developmental Studies Hybridoma Bank of University of Iowa), mTOR (IF:1:500, #2983; CST), mCherry (WB-1:2,500, #ab213511; Abcam, rabbit), PDI (IF:1:200, #3501; CST, rabbit), phospho-p70 S6 kinase – Thr389 (WB-1:1,000, #9234; CST, rabbit), and p70S6K (WB-1:1,000, #2708; CST, rabbit).
Plasmids
The plasmids used in this study, ATG16L1 and ATP6V1A, were cloned into pDONR221 using BP cloning, and expression vectors were made utilizing LR cloning (Gateway, Thermo Fisher Scientific) in appropriate pDEST vectors for IP, mass spectrometry, and complementation assays. pDONR221ATG16L1E230 mutant was generated by VectorBuilder and added to a pDEST vector by LR reaction. For mutant versions of ATG16L1, isoform 4 was obtained from Addgene (#82245), and point mutations for ATG16L1*V1H, primers were generated using the Agilent Quick Change primer design tool. pCMV-3xFLAG-SUMOstar-hATG16L1 was donated by Alf Lystad (University of Oslo, Oslo, Norway), and has been as previously described (Lystad et al., 2019). All plasmids were confirmed by sequencing (Genewiz and Plasmidsaurus). Plasmid transfections were performed using Lipofectamine 3000 or Lipofectamine 2000 Transfection Reagent (#L3000150; Thermo Fisher Scientific) (Wang et al., 2023).
Cells and cell lines
HEK293T and HeLa cells were obtained from American Type Culture Collection. Huh7 cells were obtained from Rocky Mountain Laboratories, National Institutes of Health. Flp-In HeLa cells were obtained from Terje Johansen (UiT The Arctic University of Norway, Tromsø, Norway). PC3 cells (including ATG16L1KO) have been previously described (Wible et al., 2019). HeLaATG16L1-KO used in this study is described under the next subheading. The HeLa and Huh7 KO cells have been described (Jia et al., 2022; Wang et al., 2023). HeLa mATG8sKO (HexaKO) and DecaKO cells were obtained from Michael Lazarou (Monash University, Melbourne, Australia). HEK-F cells were obtained from Thermo Fisher Scientific. HEK293T Flp-In T-REx (Tet-ON) cells were obtained from Terje Johansen.
Generation of HeLa ATG16L1KO cell line
ATG16L1 knockout cell line designated HeLaATG16L1-KO was generated by CRISPR/Cas9–mediated knockout system in Flp-In T-REx HeLaATG16L1-KO (Alf Lystad, University of Oslo, Oslo, Norway) authenticated at American Type Culture Collection as HeLa (CCL-2) by short tandem repeat profiling: 17 short tandem repeat loci plus the gender-determining locus, amelogenin, were amplified using PowerPlex 18D Kit from Promega. The cell line sample was processed using the ABI Prism 3500xl Genetic Analyzer. Data were analyzed using GeneMapper ID-X software (Applied Biosystems). Appropriate positive and negative controls were run and confirmed for each sample submitted. The knockout system was based on a lentiviral vector lentiCRISPRv2 carrying both Cas9 enzyme and a gRNA-targeting ATG16L1 (gRNA-puro: 5′-ACCAAATGCAGCGGAAGGAC-3′) from VectorBuilder (Wang et al., 2023). The plasmid was transfected into HEK293T cells with the packaging plasmids psPAX2 (#12260; Addgene) and pCMV-VSV-G (#8454; Addgene) at the ratio of 5:3:2. 48 h after transfection, the supernatant containing lentiviruses was collected, filtered, and stored at −80°C. Flp-In HeLa cells were infected by the lentiviruses with 8–10 μg/ml polybrene, and 36 h after infection, the cells were selected with puromycin (1–10 μg/ml, #P9620; Sigma-Aldrich) for at least 1 wk to select knockout cells. All knockouts were confirmed by western blot.
Generation of Flp-In-APEX2-ATG16L1 Tet-ON cell lines
Flp-In HEK293T host cells were transfected with pDest-Flp-In-APEX2-ATG16L1 reconstructed plasmid and the pOG44 expression plasmid at ratio of 1:9 (Jia et al., 2018; Jia et al., 2022). After 24 h of transfection, cells were washed, cultured in fresh medium, and, 24 h later, cells were incubated with fresh medium containing 100 µg/ml hygromycin (#H0654; Sigma-Aldrich). Every 3–4 days, media was changed, increasing the antibiotic concentration up to 300 µg/ml, until single cell clone can be identified. The antibiotic-resistant clones were picked and expanded, each to be tested with 1–10 µg/ml tetracycline (#T3383; Sigma-Aldrich) overnight by western blot for the expression of ATG16L1.
ATG16L1 protein purification
For ATG16L1 protein purification, we followed the protocol by Lystad et al. (2019). Briefly, 2–3 × 10⁶ HEK-F cells were grown in 100 ml of CD293 medium with 4 mM L-glutamine, transfected with 1 µg of pCMV-3xFLAG-SUMOstar-hATG16L1 per 1 × 10⁶ cells using polyethyleneimine MAX (40 kDa, Polysciences) for three days, adding 5% more BalanCD HEK293 Feed media after 24 and 48 h. The cells were lysed in PBS containing 1% Nonidet P40 (Pierce), 1 mM EDTA, and cOmplete ULTRA protease inhibitors (Roche), and the supernatant was collected and snap frozen in liquid nitrogen and stored at −80°C. Lysate was thawed and centrifuged at 20,000 g for 10 min, and the supernatant was added to 200 μl of anti-Flag (M2)-agarose for a 5-h incubation at 4°C with end-to-end rotation. The gel matrix was transferred to a column and washed stepwise with at least 5 column volumes of NT350 (350 mM NaCl and 20 mM Tris-HCl, pH 7.4), followed by resuspension in 1 ml of NT350 with 1 μl SUMOstar protease (20 U; Life Sensors), and the closed column was incubated at 4°C overnight. The ATG16L1 protein (released from its tag by SUMOstar protease) was eluted in 100 μl aliquots of NT350 buffer, and fractions with the highest amount of protein were pooled. For confirmation of purification, the fractions were run on 10% SDS gel electrophoresis, followed by Coomassie staining and imaging on ChemiDoc. The aliquots were snap frozen in liquid nitrogen and stored at −80°C.
LysoTracker assay
2 μl of LTR DND-99 Staining Solution (#L7528; Thermo Fisher Scientific) was diluted in 1 ml of media to add 10 μl of it in the treatment in 96-well plate, totaling 110 μl per well (final concentration: 182 nM) (Gu et al., 2019). Cells were cultured in full medium or starved for 1 h in EBSS, followed by LTR for another 30 min, at 37°C. After, three washes gently with PBS, cells were fixed in 4% PFA diluted in PBS for 2 min, washed three times, and stained for nuclei with Hoechst 33342 (#H3570; Invitrogen, final concentration: 5 µg/ml) for 5 min at RT before detection by HCM.
HCM
HCM with automated image acquisition and quantification was carried out using a Cellomics HCS CX7- CellInsight CX7 High Content Analysis Platform scanner and iDEV software (Thermo Fisher Scientific). Automated epifluorescence image collection was performed for a minimum of 500 cells per well, 4–6 wells each condition. The software analyzed the images using preset scanning parameters and object mask definitions. Nuclei staining was used for autofocus to set the first channel and automatically define cellular outlines based on background staining of the cytoplasm. Cells defined primary objects, and regions of interest or targets were algorithm defined by shape/segmentation, maximum/minimum average intensity, total area and total intensity, etc., to automatically identify puncta or other profiles. All data collection, processing (object, regions of interest, and target mask assignments), and analyses were computer driven independently of human operators (Javed et al., 2023).
Treatments
Cells were plated, and on the next day, treatments were performed accordingly. For growth factors and aa starvation, cells were incubated with EBSS for 90 min. For evaluation of phosphoinositide pathways, cells were treated with 0.5 µM of apilimod (Yanagawa et al., 2024) or 5 µM of Vps34-IN-1 (Cross et al., 2023) for 90 min, including LTR in the last 30 min.
BioWeB (APEX2-labeling proximity biotinylation and western blotting)
FlpIn APEX2-ATG16L1-HEK293T stable cells were incubated in full medium or EBSS for 90 min (70–80% confluence of cells), and 500 mM biotin-phenol (AdipoGen) was added in the last 30 min of other treatments. A 1-min pulse with 1 mM H2O2 at RT was stopped with quenching buffer (10 mM sodium ascorbate, 10 mM sodium azide, and 5 mM Trolox in PBS). The samples were washed twice with quenching buffer and PBS, and subjected to lysis in 500 μl ice-cold lysis buffer (6 M urea, 0.3 M Nacl, 1 mM EDTA, 1 mM EGTA, 10 mM sodium ascorbate, 10 mM sodium azide, 5 mM Trolox, 1% glycerol, and 25 mm Tris/HCl, pH 7.5) for 30 min by gentle pipetting. Lysates were clarified by centrifugation, and protein concentrations determined by Pierce BCA Protein Assay #23225; Thermo Fisher Scientific). Streptavidin-coated magnetic beads (#88817; Pierce – Thermo Fisher Scientific) were washed with lysis buffer. 1–3 mg of each sample was mixed with 100 μl of streptavidin bead. The suspensions were gently rotated at 4°C overnight to bind biotinylated proteins. The flow-through after enrichment was removed, and the beads were washed in sequence with 1 ml IP buffer (150 mM NaCl, 10 mM Tris-HCl, pH 8.0, 1 mM EDTA, 1 mM EGTA, and 1% Triton X-100) twice; 1 ml 1 M KCl; 1 ml of 50 mM Na2CO3; 1 ml 2 M Urea in 20 mM Tris HCl, pH 8; 1 ml IP buffer. Biotinylated proteins were eluted, and the sample was processed for western blot.
Proteomic mass spectrometry after proximity biotinylation and LC-MS/MS
The protein samples on the magnetic beads were washed four times with 200 μl triethyl ammonium bicarbonate 50 mM, with shaking for 20 min at 4°C in between each wash. 2.5 μg of trypsin was added to the bead and triethyl ammonium bicarbonate mixture, and the samples were digested overnight at 4°C, with shaking at 800 rpm. After, the digested supernatant was removed, and the beads were washed once with 50 mM ammonium bicarbonate to cover the volume. After 20 min of gently shaking, the wash was removed and combined with the initial supernatant. The peptide extracts were reduced in volume by vacuum centrifugation and quantified by peptide quantification (Thermo Fisher Scientific Pierce). For each LC-MS analysis, 1 μg of sample based on the fluorometric peptide assay was loaded.
DIA data were analyzed using Spectronaut 14.10 (Biognosys Schlieren) using the direct DIA workflow with the default settings. Briefly, protein sequences were downloaded from UniProt (Human Proteome UP000005640), ATG16L1 from UniProt, and common laboratory contaminant sequences from https://thegpm.org/crap/. Trypsin/P specific was set for the enzyme, allowing two missed cleavages. A minimum of two peptides per protein group were required for quantification. Proteins known to be endogenously biotinylated were excluded from consideration.
Immunoblotting and co-IP assay
Western blotting and co-IP were performed as described previously (Jia et al., 2022). Briefly, for co-IP, cells were transfected with plasmids as indicated in figures and lysed in NP-40 buffer containing protease inhibitor cocktail (#11697498001; Roche) and PMSF (1 mM, #93482; Sigma-Aldrich) for 30 min at 4°C while shaking. For phosphorylated protein analysis, PhosSTOP (Roche) was also added. Lysates were incubated with respective antibodies overnight at 4°C, followed by incubation with Dynabeads protein G (#10004D; Invitrogen) for 2–4 h at same temperature. Beads were washed three times with 1× PBS, eluted with 2× Laemmli sample buffer (Bio-Rad), and processed for immunoblotting to analyze the interactions between immunoprecipitated proteins. For immunoblotting, lysates were centrifuged for 15 min at 16,000 × g at 4°C. Supernatants were then separated on 4–20% Mini-PROTEAN TGX Precast Protein Gels (Bio-Rad), previously eluted in Laemmli buffer with β-mercaptoethanol, and transferred to nitrocellulose or PVDF membranes. The membranes were blocked in 3% BSA in PBST for 1 h at RT and incubated overnight at 4°C with primary antibodies diluted in the blocking buffer. They were then incubated with an IRDye secondary antibodies (LI-COR), and proteins were detected using ChemiDoc Imaging System (Bio-Rad). The analysis and quantification of bands were performed using ImageJ software, with mean intensity area.
Magic Red assay
Magic Red (#938; ImmunoChemistry) was reconstituted by adding DMSO and freshly diluted in 1:10 with H2O. In 96-well plate, 4 μl of Magic Red were added to cells in 100 μl of full media or EBSS at 37°C for the last 15 min of incubation. Cells were rinsed gently with PBS 1×, fixed in 4% PFA for 2 min, washed three times in PBS, and stained with Hoechst 33342 for 5 min at RT before HCM analysis (Jia et al., 2020a).
Immunofluorescence
For antibody labeling, after treatment, cells were fixed in 4% PFA for 2 min, washed three times in PBS 1×, and incubated for 10–15 min at RT with 3% of BSA and 0.05% of saponin in PBS. The cells were then incubated with primary antibodies overnight at 4°C. Next, the plate was washed with PBS and incubated with secondary antibodies for 1 h at RT, followed by a 5-min incubation with Hoechst 33342 (final concentration: 5 µg/ml).
Confocal microscopy and profile intensity
Cells were plated onto 12-mm coverslips in 12-well plates. For LTR, 30 min before fixation, cells were incubated with the probe and then fixed in 4% PFA for 2 min, followed by permeabilization with 0.05% saponin in 3% BSA for 15 min. Cells were then incubated with primary antibodies for 1 h at RT, and appropriate secondary antibodies Alexa Fluor 488 or 568 (Thermo Fisher Scientific) for 1 h at RT. Coverslips were mounted using Prolong Gold Antifade Mountant (Thermo Fisher Scientific). Images were acquired using a confocal microscope (META LSM900; Zeiss) equipped with a 63× objective 3/1.4 NA oil objective, Axiocam 712 mono camera (LSM META; Carl Zeiss), and ZEN software (Carl Zeiss). For profile intensity, a line in each channel was drawn to evaluate intensity by Plot Profile in ImageJ.
Ratiometric HCM in vitro test for pH measurement
Ratiometric pH measurements were performed using CellInsight CX7 High Content Analysis Platform. 1 day before, 5,000 cells were transfected with 100 ng plasmid Lamp1-RpHLuorin2 (# 171720; Addgene) with Lipofectamine 3000 (#L3000150; Thermo Fisher Scientific), incubated with full media or EBSS, washed with HBSS, and imaged. In parallel, cells were also treated for 5 min with buffers from pH 3.5–7.5. The buffers were prepared with 10 µM nigericin, 10 µM monensin, 125 mM KCl, 25 mM NaCl, and Hepes (pH 7.5 or 7.0) or 25 mM MES (pH 6.5, 6.0, 5.5, 5.0, 4.5, 4.0 and 3.5), adjusting the final pH using 1 M NaOH or 1 M HCl. Buffers were added before reading for 5 min at 37°C.
The CellInsight CX7 was equipped with 5% CO2 and humidity of 50%. The settings used for Lamp1-RpHLuorin2 were (1) excitation at 386 nm (23 nm bandwidth) and (2) 485 nm (20 nm bandwidth), with an emission wavelength bandwidth interval of 510–531 nm for both excitations. For the selected panels, the combination of excitation wavelengths and filter cubes were 386/23 BGRFRN and 485/20 BGS. Based on the emission intensity ratios when excited at 386/485 nm, pH values were calculated using the calibration curve with buffers from pH 3.5–7.5. Linear regression was done for the calibration curve. For cell focus on the equipment, CellMask Deep Red Plasma Membrane Stain (#C10046; Invitrogen) was used, acquiring images upon excitation of 650/13 nm with emission at 702/35 nm. At least 300 live cells/well were acquired, with 4 different wells (technical repeats), with biological repeats (experimental units) in triplicates. For the representation of the ratiometric images, the collected images were converted to 32-bit in Image J, and the different channels had their values divided (386/485) in ImageJ using Image calculator to apply 16-color look up table, where the values between 0 and 1 represent 16 colors, the bluest being higher pH and red lower pH.
FITC-dextran loading of lysosomes and proton pumping
We adapted a published method (Stransky and Forgac, 2015) as follows: Flp-In HeLaWT and Flp-In HeLaATG16L1-KO were plated in 10-cm dishes, and on the following day, the media was replaced with a media supplemented with 2.0 mg/ml FITC-Dextran (MW 40,000) (#HY-128868D; MedChemExpress). Cells were incubated overnight, and the following day, FITC-dextran media was replaced by fresh media without the fluorescent dextran for 1 h. Later, cells were treated or not with EBSS for 90 min, washed with cold PBS, scrapped with 500 μl of fractionation buffer (25 mM KCl, 1 mM EDTA, 50 mM sucrose, 20 mM Hepes, 1 mM PMSF, and EDTA-free Protease Inhibitor Cocktail [#11836170001; Roche]), and centrifuged at 300 rpm for 5 min. Then cells were resuspended in 750 μl of fractionation buffer for lysis by passing 10 times in a 25-G needle. The lysate was cleared by centrifugation at 2,000 g for 10 min; the supernatant was then centrifuged at 16,000 g for 15 min to sediment the resulting pellet of FITC-dextran loaded endolysosomes. They were resuspended in 100 μl for protein quantification and measuring proton pumping. The preparation was added to a pre-warmed 37°C 100 μl fractionation buffer and evaluated in a BioTek Synergy HTX Multimode Reader (ex 485/20 and em 528/20; Agilent). After initial fluorescence stabilized, 1 mM of ATP and 2 mM Mg were added to the wells to evaluate the ATPase activity and proton pumping into the endosomal compartments, causing FITC quenching in the organelle lumen. 1 μM ConA (#HY-N1724; MedChemExpress) was added to confirm the V-ATPase–dependent quenching. After reading every 15 s for 105 s, the graph was plotted, and the linear regression was calculated.
Magnetic nanoparticle lysosomal isolation
For V-ATPase activity and proton translocation assays, we followed an established protocol (Im et al., 2023). 10-cm dish with Flp-In HeLaWT or Flp-In HeLaATG16L1-KO cells were incubated in a medium containing 10% dextran-conjugated magnetite overnight and then changed to normal media for 24 h. Cells were washed with 1× PBS, harvested in 4 ml of ice-cold buffer A, 1 mM Hepes (pH 7.2), 15 mM KCl, 1.5 mM MgAc, 1 mM DTT, and 1× protease inhibitor cocktail. After centrifugation, cells were homogenized with 40 strokes in a Dounce homogenizer and then passed through a 23-G needle 5×. After this, 500 μl of ice-cold buffer B, 220 mM Hepes (pH 7.2), 375 mM KCl, 22.5 mM MgAc, 1 mM DTT, and 20 μM deoxyribonuclease I were added, lysates were then centrifuged at 750 g for 10 min. The supernatant was passed through a QuadroMACS LS column (130-042-976; Miltenyi Biotec), previously equilibrated with 0.5% BSA in PBS, and non lysosomal fraction was allowed to flow through via gravity, while the pellet was suspended in 4 ml of ice-cold buffer A and 500 μl of ice-cold buffer B for resuspension and centrifugation to allow a second round of purification. Lysosomes were eluted by removing the column from the magnetic assembly, adding 100 μl M1 buffer, 10 mM Tris (pH 7.5), 250 mM sucrose, 150 mM KCl, 3 mM β-mercaptoethanol, and 20 mM CaCl2 for v-ATPase activity and proton translocation assay.
V-ATPase activity assay
Isolated lysosomes (magnetic nanoparticles loaded) were mixed with 0.052% NaN3 (inhibitor of P- and F-type ATPase), and V-ATPase activity was measured using an ATPase assay kit according to the manufacturer’s protocol (#ab270551; Abcam). Control samples were measured in the presence of 1 μM ConA (MedChemExpress), and the experimental values were subtracted accordingly. Absorbance was measured at 650 nm, and solutions of Pi in the same M1 buffer were used to generate a standard curve (Im et al., 2023).
Proton translocation ACMA assay
To evaluate proton transport activity into the lumen of isolated lysosomes, fluorescence quenching of ACMA (#HY-118155; MedChemExpress) was measured (Liu et al., 2023). The lysosome fractions were collected and added to the reaction buffer, 10 mM BisTrisPropene-MES (pH 7.0), 25 mM KCl, 2 mM MgSO4, 10% glycerol, and 2 μM ACMA, and after stabilizing the fluorescence, 1 mM ATP was added in BisTrisPropene, pH 7.4, and measured every 5 s for 600 s in a Biotek Cytation 1 Multimode Reader (Agilent) (Ex: 360/40 and Em: 460/40). Control samples were measured in the presence of 1 μM ConA (Liu et al., 2023).
For the reactions containing purified ATG16L1 protein and the isolated endolysosomes, stock reaction mixtures (with or without ATG16L1) were prepared in multiples of the 60-μl unit reaction volume consisting of 10 μl of purified protein (0.05 µg/μl) in NT350 buffer (or just NT350 buffer), combined with 50 μl of isolated lysosomes in ACMA buffer per reaction (ATG16L1 at 0.1 µM final concentration). The 60 μl aliquots were dispensed in a 384-well plates, incubated for 30 min on ice, warmed up to RT in Biotek Cytation 1 Multimode Reader (Agilent) for 5 min to obtain a baseline read, and ATP was added (1 mM final concentration) to initiate the reaction. The ACMA fluorescence was measured as above.
AMP/ADP/ATP assay
HeLa cells (1 × 10⁶ per sample), WT, and ATG16L1KO were prepared for the extraction following the boiling water method (Yang et al., 2002), and levels of AMP, ADP, and ATP were measured using ATP/ADP/AMP Assay Kit (Biomedical Research Service & Clinical Application). Luciferase bioluminescence output was measured using a Synergy HTX Agilent Multi-Mode Reader. Data were normalized for protein levels in each sample. Energy charge was calculated per Atkinson and Walton using the formula ([ATP]+1/2[ADP])/([ATP] +[ADP]+[AMP]) (Atkinson and Walton, 1967).
Membrane fractionation
As previously described (Hooper et al., 2022), cells were seeded on a 10-cm dish, treated or not with EBSS, for 90 min. Cytosol and membrane fractions were isolated using the MemPer Plus Membrane Protein Extraction Kit (#89842; Thermo Fisher Scientific) following product guidelines. 5% of the initial pellet was used as input. Protein concentration was measured by BCA assay, and equal amounts were loaded onto polyacrylamide gels for SDS-PAGE analysis.
Housing and husbandry conditions of experimental animals
The study was compliant with all relevant ethical guidelines for animal research. The mice used in this study were housed in AAALAC-accredited Animal Research Facility of the University of New Mexico Health Sciences Center (UNM HSC), institutionally approved housing and husbandry conditions, as also approved breeding protocols.
Mtb-infected animals were housed in a separate Animal Biosafety Level 3 suite within the UNM HSC Animal Research Facility, and all the staff followed strict Animal Biosafety Level 3, BSL3, and animal protocols approved by the UNM HSC Biosafety Committee and the Institutional Animal Care and Use Committee.
Murine model of Mtb infection
For this study, littermate mice (C57BL/6 background) were compared: Atg16l1WT/WT (homozygous), Atg16l1E230/WT (heterozygous), and Atg16l1E230/E230 (homozygous). In one of the experiments, AMPKfl/fl Ubc-Cre- mice were used as a heterologous control. The Mtb Erdman aerosol inoculum was prepared by diluting Mtb frozen stock 1:50 in PBS/0.01% Tween to ∼7.38e6 CFU/ml, verified by serial dilutions and plating on 7H11 agar plates. The aerosol inoculum was placed in Glas–Col inhalation System, and mice were infected with Mtb aerosols according to the following machine settings for Glas–Col Cycle, which has a preheat (15 min), nebulizing (20 min), cloud decay (20 min), decontamination (15 min with UV lights on), and cool down (10 min). The initial lung deposition (CFU) was determined by euthanizing C57B/6 mice present in the cohort of transgenic mice coinfected in a chamber at the same time and plating 5 × 200 μl aliquots of neat, homogenized tissue and counting bacterial colonies after 2–3 wk at 37°C and 5% CO2. Mouse survival was monitored as approved by the institutional IACUC.
AlphaFold3 modeling
AlphaFold predictions were run using the official AlphaFold3 server (https://alphafoldserver.com/) and visualized in ChimeraX using the matchmaker alignment tool to merge the known structure of the V-ATPase (PDB ID: 6WM2) with the predicted structure from AlphaFold3.
Statistical analysis
Data were analyzed and plotted using GraphPad Prism 10.3. For HCM, sample size was n = 3–8 (biological replicates each on different pates). Technical replicates for HCM were typically five wells per condition, averaged to produce sample values per plate per condition. For HCM, sample size was based on a power analysis from prior studies (Javed et al., 2023), assuming large effect size (differences and variability/standard deviation extrapolated from published studies) and normal distribution of α 5%, β 20%, power 80% (favoring type II errors; false negative) over type I errors (false positive). For band intensity in immunoblots, n = 3 (biological replicates) no power analysis was performed. Data: means ± SEM (n ≥ 3). ANOVA and pot hoc modified t tests or t test (two-tailed) were used. Statistical significance: P < 0.05.
Online supplemental material
There are 5 supplemental figures and one excel sheet with proteomic data. Fig. S1 shows the negative regulation by ATG16L1 of the acidification within intracellular compartments. Fig. S2 shows the additional data regarding effects of ATG16L1 and other atg8ylation factors on V-ATPase and acidification. Fig. S3 shows the effects of ATG16L1 inactivation on a subset of known regulators of V-ATPase. Fig. S4 shows supplementary documentation for complementation experiments and AlphaFold analyses. Fig. S5 shows the high-dose Mtb infection in Atg16l1E230 mice, Kaplan–Meier survival curve. An excel sheet with proteomic data is referred to as Table S1 in the text; it contains data spreadsheet exported from Spectronaut file (Biognosys Schlieren) showing proteomic profiling based on proximity biotinylation data (LC-MS/MS) in Flp-In T-REx (Tet-ON) HEK293T cells with FLAG-APEX2-ATG16L1 chromosomal insertion grown in full medium or subjected for 90 min to starvation in EBSS (Tab1; yellow highlighted rows indicate V-ATPase subunits; Tab2 shows map of identified peptides superimposed on the ATP6V1H protein sequence and quantitative data in individual samples/repeats).
Data availability
The raw data corresponding to Table S1 are available within the entry MSV000084519 deposited in the MassIVE proteomics repository. Scaffold proteomic analysis corresponding to Table S1 is within the entry PXD016084 in Proteome Exchange. Other data are available from the corresponding author upon reasonable request. Source data for panels in figures have been submitted to the journal. LC-MS/MS data and proteomic data have been deposited in MassIVE MSV000097317 and Proteome Exchange ID PXD061809.
Ethics statement
All institutional inclusion and ethics policies were followed.
Acknowledgments
We thank Ryan Peters for his outstanding technical help with mouse studies, Alf Lystad (University of Oslo, Oslo, Norway) for HeLa ATG16L1 knockout and its parental cell line, and Fulong Wang for several cell lines. We thank Sharina Desai, AIM core director for technical advice. We acknowledge Matthew Jefferson’s animal husbandry.
This work was supported by the National Institutes of Health grants R37AI042999 and R01AI111935 and a center grant P20GM121176 to Vojo Deretic.
Author contributions: Thabata L.A. Duque: conceptualization, data curation, formal analysis, investigation, methodology, project administration, validation, visualization, and writing—original draft, review, and editing. Masroor Paddar: formal analysis, investigation, validation, and writing—review and editing. Einar Trosdal: formal analysis and visualization. Ruheena Javed: formal analysis, investigation, and visualization. Lee Allers: software and visualization. Michal H. Mudd: formal analysis. Prithvi Akepati: formal analysis. Soumya R. Mishra: formal analysis. Michelle Salemi: investigation. Brett Phinney: formal analysis and resources. Shawn B. Bratton: funding acquisition and resources. Thomas Wileman: conceptualization, methodology, and writing—review and editing. Vojo Deretic: conceptualization, formal analysis, funding acquisition, investigation, methodology, project administration, resources, supervision, validation, visualization, and writing—original draft, review, and editing.