


Polycomb repressive complexes regulate developmental gene programs, promote DNA damage repair, and mediate pericentromeric satellite repeat repression. Expression of pericentromeric satellite repeats has been implicated in several cancers and diseases, including facioscapulohumeral dystrophy (FSHD). Here, we show that DUX4-mediated transcription of HSATII regions causes nuclear foci formation of KDM2A/B–PRC1 complexes, resulting in a global loss of PRC1-mediated monoubiquitination of histone H2A. Loss of PRC1-ubiquitin signaling severely impacts DNA damage response. Our data implicate DUX4-activation of HSATII and sequestration of KDM2A/B–PRC1 complexes as a mechanism of regulating epigenetic and DNA repair pathways.
Introduction
Epigenetic reprogramming is a hallmark of early development that also plays a critical role in driving cancer and certain diseases (Sandoval and Esteller, 2012). Polycomb repressive complex 1 (PRC1) is a major epigenetic regulator in developmental gene regulation and cancer (Di Croce and Helin, 2013; Sandoval and Esteller, 2012). PRC1 activity is essential for transcriptional repression of PcG-target genes and regulating developmental gene programs (Endoh et al., 2012; Posfai et al., 2012; Tsuboi et al., 2018). Recent work has suggested a role for PRC1-mediated deposition of monoubiquitination of histone H2A at lysine 119 (H2AK119Ub) in regulating DNA double-stranded break (DSB) repair (Ismail et al., 2010, 2013; Pan et al., 2011). Loss of PRC1 function led to defects in DNA damage response and recruitment of DNA repair factors (Pan et al., 2011). Thus, PRC1 function extends beyond gene regulation and is critical for maintaining genome integrity.
Human satellite II (HSATII) is a high-copy tandem repeat found at pericentromeric regions close to human centromeres (Gosden et al., 1975; Tagarro et al., 1994). HSATII is found on 11 different chromosomes and constitutes the main component of pericentromeric heterochromatin on chromosomes 1, 2, 7, 10, 16, and 22, with the largest blocks at 1q12 and at 16q11 (Altemose et al., 2014; Kent et al., 2002). Human satellite regions are core pericentromeric components that facilitate interactions with DNA-binding proteins to maintain heterochromatin architecture, ensuring chromatin integrity and genome stability (Bierhoff et al., 2014; Brückmann et al., 2018; Pezer et al., 2012). Loss of repression at HSATII regions has been found in human and mammalian cell lines in response to stress stimuli, DNA demethylation, and heat shock (Bai et al., 2016), and has been correlated with genomic instability in cancer and disease (Hall et al., 2017; Shadle et al., 2019; Smurova and De Wulf, 2018). Furthermore, pericentromeric satellite regions have been implicated in early mammalian development and are essential for chromatin reorganization during early embryonic development (Probst et al., 2010; Puschendorf et al., 2008; Zhu et al., 2023). In mammals, the largest proportion of PRC-mediated DNA and chromatin modifications are located in genomic repeats, including pericentromeric regions, which could provide a binding platform for PRC1 (Leeb et al., 2010). Indeed, activation of HSATII in cancer cells has been shown to sequester components of PRC1, suggesting a role for PRC1 activity in regulation of pericentromeric regions (Cooper et al., 2014; Hall et al., 2017). However, the mechanism of PRC1 sequestration at HSATII regions has yet to be elucidated.
Our lab has reported that DUX4, an early embryonic transcription factor and the causative gene for facioscapulohumeral dystrophy (FSHD), specifically activates transcription of HSATII in human myoblast cells (Young et al., 2013). Interestingly, DUX4 and HSATII expression are highly correlated during human early embryonic development (Shadle et al., 2019). Recently, we uncovered that DUX4 induces the accumulation of intranuclear HSATII double-stranded RNA (dsRNA) foci that form ribonucleoprotein complexes with nuclear regulatory proteins (Shadle et al., 2017). The accumulation of HSATII dsRNA and sequestration of nuclear proteins contribute to DUX4-induced cellular toxicity. Moreover, DUX4 expression in human myoblast cells also correlates with accumulation of DNA damage (Bou Saada et al., 2016; Shadle et al., 2019). How DUX4-activation of HSATII impacts genome stability in FSHD muscle cells remains unknown.
In this study, we examined the relationship between HSATII activation and the impact of PRC1 redistribution at satellite regions on DNA damage signaling in a model system of FSHD. Our work indicates that DUX4-activation of HSATII can cause nuclear foci formation of epigenetic factors including KDM2A– and KDM2B–PRC1 complexes. We show that KDM2A/B proteins are required for PRC1 occupancy at HSATII regions. Strikingly, the concentration of KDM2B–PRC1 complexes at HSATII genomic regions results in a global depletion of the H2AK119Ub signal. Our data indicate that sequestration of PRC1 at HSATII loci impacts its function, resulting in a diminished DNA damage response signaling in nuclei harboring DNA damage. Activation of HSATII regions in concert with a diminished capability of DNA repair results in replication stress and genomic instability. Our data implicate DUX4-activation of HSATII and nuclear accumulation of KDM2A/B–PRC1 as a mechanism of regulating chromatin states and DNA repair pathways.
Results
RNF2 sequestration at activated HSATII loci suppresses global H2AK119Ub levels
DUX4 expression in FSHD patient muscle cells is rare—it is expressed in a small fraction of the overall population (Snider et al., 2010). For this reason, we generated and characterized a human myoblast cell line (MB135) with a doxycycline-inducible DUX4 (iDUX4) that allows for homogenous DUX4 expression (Jagannathan et al., 2016), where nuclei are nearly 100% DUX4-positive during doxycycline (“dox”) induction (first 4-h) and remain 65% positive 24-h after a 4-h pulse of dox (Fig. S1, A–C). We have previously described that both continuous and brief (4-h dox treatment, “pulse”) DUX4 expression in our iDUX4 cell line recapitulate the FSHD gene signature (Jagannathan et al., 2016; Resnick et al., 2019). We used this model system to interrogate the activity of downstream targets of DUX4, including HSATII.

Dynamics of DUX4 and HSATII expression, and BMI1 aggregation in DUX4-expressing cells. (A) Representative immunofluorescence of DUX4 (gray) expression in −dox, briefly induced (4-h doxycycline treatment, “4-h fix”) and 24 h after brief doxycycline pulse (“24-h fix”) in iDUX4 cells (scale bar = 20 μm). Images are representative of two independent experiments conducted on separate days. (B) Fraction of nuclei DUX4+ for all conditions. Dots represent the average of fields taken. N ≥ 50 nuclei. (C) The ratio of DUX4 signal type (aggregates or pan-nuclear staining pattern) in +dox at either 4- or 24-h timepoint. N ≥ 50 nuclei. (D) HSATII RNA FISH signal (gray) in −dox, and pulse or continuous doxycycline induction and fixed 20 h after induction (scale bar = 20 μm). Images are representative of four independent experiments conducted on separate days. (E) Fraction nuclei that are HSATII RNA positive (HSATII+) in −dox, pulse, or continuous conditions. Dots represent the average of fields taken. N ≥ 50 nuclei. (F) Combined RNA-FISH and immunofluorescence of HSATII RNA (green) and BMI1 (magenta) signal in −dox or +dox (4-h pulse and fixed/analyzed 20 h after induction) iDUX4 cells. Images are representative of one independent experiment. (G) BMI1 signal intensity measured within nuclei in −dox, +dox HSATII−, or HSATII+ nuclei, compared to BMI1 signal intensity measured within HSATII RNA foci or randomly drawn ROI within the nucleoplasm in +dox HSATII+ nuclei. Each dot represents either individual nuclei or individual foci, respectively. Nuclei are indicated for representative experiment and N ≥ 50 nuclei per condition or N ≥ 40 ROI. (H) Immunofluorescence of RNF2 (green) and BMI1 (magenta) signal in −dox or +dox (4-h pulse and fixed/analyzed 20-h post-induction) iDUX4 cells. Images are representative of three independent experiments conducted on separate days. (I) Fraction nuclei with BMI1 signal type (foci versus pan-nuclear staining pattern) within +dox cells. Dots represent each independent experiment. (J) Fraction nuclei with RNF2 foci co-occur with or contain only BMI1 foci in +dox iDUX4 cells. Fraction calculated represents fields taken from each independent experiment and N ≥ 50 nuclei. (K) Immunofluorescence of H2AUb (green) and BMI1 (magenta) signal in −dox or +dox (4-h pulse and fixed/analyzed 20 h after induction) iDUX4 cells. Images are representative of two independent experiments conducted on separate days. (L) Nuclear H2AUb signal in −dox or +dox cells with BMI1 signal type. Dots represent individual nuclei for the representative experiment. N ≥ 25 nuclei per condition. (B, E, G, I, and L) Data represent means ± SD. Statistical differences between groups were analyzed employing either two-tailed paired t test or were assessed with one-way ANOVA Tukey’s multiple comparison test between each group and a control.
Dynamics of DUX4 and HSATII expression, and BMI1 aggregation in DUX4-expressing cells. (A) Representative immunofluorescence of DUX4 (gray) expression in −dox, briefly induced (4-h doxycycline treatment, “4-h fix”) and 24 h after brief doxycycline pulse (“24-h fix”) in iDUX4 cells (scale bar = 20 μm). Images are representative of two independent experiments conducted on separate days. (B) Fraction of nuclei DUX4+ for all conditions. Dots represent the average of fields taken. N ≥ 50 nuclei. (C) The ratio of DUX4 signal type (aggregates or pan-nuclear staining pattern) in +dox at either 4- or 24-h timepoint. N ≥ 50 nuclei. (D) HSATII RNA FISH signal (gray) in −dox, and pulse or continuous doxycycline induction and fixed 20 h after induction (scale bar = 20 μm). Images are representative of four independent experiments conducted on separate days. (E) Fraction nuclei that are HSATII RNA positive (HSATII+) in −dox, pulse, or continuous conditions. Dots represent the average of fields taken. N ≥ 50 nuclei. (F) Combined RNA-FISH and immunofluorescence of HSATII RNA (green) and BMI1 (magenta) signal in −dox or +dox (4-h pulse and fixed/analyzed 20 h after induction) iDUX4 cells. Images are representative of one independent experiment. (G) BMI1 signal intensity measured within nuclei in −dox, +dox HSATII−, or HSATII+ nuclei, compared to BMI1 signal intensity measured within HSATII RNA foci or randomly drawn ROI within the nucleoplasm in +dox HSATII+ nuclei. Each dot represents either individual nuclei or individual foci, respectively. Nuclei are indicated for representative experiment and N ≥ 50 nuclei per condition or N ≥ 40 ROI. (H) Immunofluorescence of RNF2 (green) and BMI1 (magenta) signal in −dox or +dox (4-h pulse and fixed/analyzed 20-h post-induction) iDUX4 cells. Images are representative of three independent experiments conducted on separate days. (I) Fraction nuclei with BMI1 signal type (foci versus pan-nuclear staining pattern) within +dox cells. Dots represent each independent experiment. (J) Fraction nuclei with RNF2 foci co-occur with or contain only BMI1 foci in +dox iDUX4 cells. Fraction calculated represents fields taken from each independent experiment and N ≥ 50 nuclei. (K) Immunofluorescence of H2AUb (green) and BMI1 (magenta) signal in −dox or +dox (4-h pulse and fixed/analyzed 20 h after induction) iDUX4 cells. Images are representative of two independent experiments conducted on separate days. (L) Nuclear H2AUb signal in −dox or +dox cells with BMI1 signal type. Dots represent individual nuclei for the representative experiment. N ≥ 25 nuclei per condition. (B, E, G, I, and L) Data represent means ± SD. Statistical differences between groups were analyzed employing either two-tailed paired t test or were assessed with one-way ANOVA Tukey’s multiple comparison test between each group and a control.
DUX4 expression in human myoblast cells leads to robust activation and nuclear accumulation of HSATII RNA (Shadle et al., 2019). However, differences in the duration of dox treatment does impact the overall percentage of nuclei that are positive for HSATII (HSATII+). Continuous treatment for 24 h yielded 60% nuclei HSATII+ whereas 20 h after a 4-h dox pulse yielded 30% nuclei HSATII+ (Fig. S1, D and E). The percentage of cells with HSATII RNA accumulation detected following DUX4 induction may be attributed to the dynamics and duration of DUX4 activity (pulse versus continuous conditions), the ability of the cell to silence HSATII regions post-DUX4 induction, and activation of DUX4 targets that may synergize with DUX4 to fully activate HSATII genomic regions.
In some cancer cells, it has been shown that transcriptionally active HSATII DNA can sequester components of PRC1 (Hall et al., 2017). Additionally, DUX4 expression impacts the intracellular distribution of ubiquitin-conjugated proteins in human myoblast cells (Homma et al., 2015). Therefore, we interrogated whether PRC1 localization and function were disrupted in DUX4-expressing muscle cells due to HSATII activation. We found that RNF2, the catalytic component of PRC1, formed nuclear protein aggregates that colocalized with HSATII RNA foci when analyzed 20 h after a 4-h dox pulse in iDUX4 cells (Fig. 1 A). Over 80% of RNF2 protein aggregates had at least partial signal overlap with HSATII RNA foci (Fig. 1 B) and 70% of the total RNF2 nuclear aggregate signal was contained within HSATII RNA foci (Fig. 1 C). Furthermore, the RNF2 signal was relatively unchanged when measuring total nuclear signal between uninduced and induced HSATII negative (HSATII−) or HSATII+ cells but was significantly increased within HSATII RNA foci (median signal intensity [Mdn]: 1,945) compared with random regions of interest (ROI) within the nucleoplasm (Mdn: 1,693) within HSATII+ cell nuclei (Fig. 1 D). We observed that 95% of induced HSATII− cells exhibited pan-nuclear staining of RNF2, while 92% of induced HSATII+ cells contained RNF2 nuclear aggregates (“RNF2 foci”) (Fig. 1 E). Additionally, RNF2 protein levels remained unchanged between all conditions, suggesting that DUX4 expression impacted RNF2 localization and not RNF2 expression (Fig. 1 F). Other PRC1 components, including BMI1, also partially localized with HSATII RNA foci and RNF2 foci when analyzed 20 h after a 4-h dox pulse in iDUX4 cells (Fig. S1, F–J).
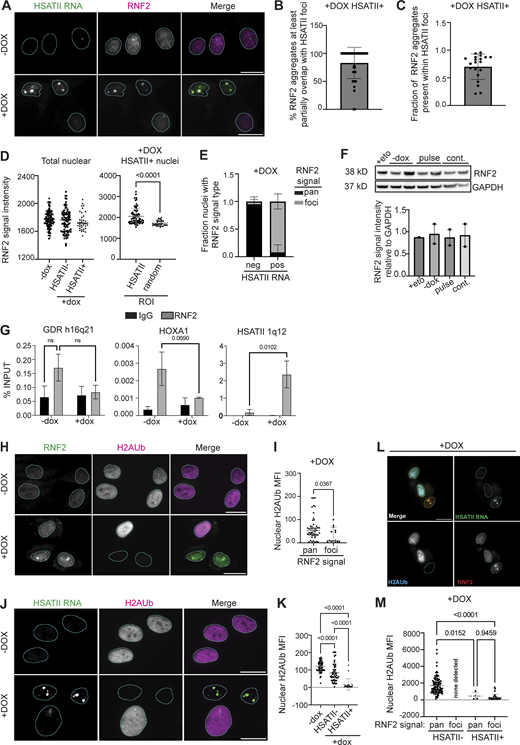
RNF2 is enriched at HSATII genomic regions and RNF2 protein aggregation correlates with loss of nuclear H2AUb signal in DUX4-expressing cells. (A) Combined RNA fluorescence in situ hybridization (RNA-FISH) and immunofluorescence of HSATII RNA (green) and RNF2 (magenta) signal in −dox or +dox (4 h pulse and fixed/analyzed 20 h after induction) iDUX4 cells, (scale bar = 20 μm). Images are representative of four independent experiments conducted on separate days. (B) Percentage of individual RNF2 foci that have at least partial signal overlap with HSATII RNA foci per nucleus in +dox iDUX4 cells. N = 50 nuclei. (C) Fraction of RNF2 nuclear aggregates present within HSATII RNA foci in +dox iDUX4 cells. Fraction calculated represents the total proportion within each individual nuclei for a representative experiment and N ≥ 100 nuclei. (D) RNF2 signal intensity measured within nuclei in −dox, +dox HSATII−, or HSATII+ nuclei compared with RNF2 signal intensity measured within HSATII RNA foci or randomly drawn ROI within the nucleoplasm in +dox HSATII+ nuclei. Each dot represents either individual nuclei or individual foci, respectively. Nuclei are indicated for representative experiment and N ≥ 100 nuclei per condition or N ≥ 40 ROI. (E) Fraction nuclei with RNF2 signal type: foci versus pan-nuclear (pan) staining patterns within +dox cells either with HSATII RNA (pos) or without HSAT RNA (neg). Fraction calculated represents fields taken from each independent experiment and N ≥ 100 nuclei. (F) Quantification of total RNF2 protein levels in +eto, −dox, pulse, or continuous +dox conditions. Blot shows two biological replicates for each condition. (G) Chromatin immunoprecipitation (ChIP) of RNF2 or IgG isotype control in −dox or +dox (4 h pulse and fixed/analyzed 20 h after induction) iDUX4 cells. Quantitative PCR (qPCR) was performed on isolated DNA from RNF2- or IgG-bound chromatin fractions. Primers targeting a control gene desert region (GDR) h16q21 (Maston et al., 2012), canonical PcG-target gene HOXA1, or HSATII 1q12 were used. N = 3 per IP per condition. (H) Representative immunofluorescence images of RNF2 signal (green) and H2AUb signal (magenta) in −dox or +dox (4 h pulse and fixed/analyzed 20 h after induction) iDUX4 cells, (scale bar = 20 μm). Images are representative of two independent experiments conducted on separate days. (I) Nuclear H2AUb MFI was calculated for nuclei that contained RNF2 pan-nuclear signal (pan) or RNF2 aggregates (foci). Nuclei are indicated for representative experiment and N ≥ 50 nuclei per condition. (J) Combined RNA-FISH and immunofluorescence of HSATII RNA (green) and H2AUb (magenta) signal in −dox or +dox (4-h pulse and fixed/analyzed 20-h after induction) iDUX4 cells, (scale bar = 20 μm). Images are representative of two independent experiments conducted on separate days. (K) Nuclear H2AUb MFI was calculated in −dox cells or +dox cells in nuclei that contained no HSATII RNA (HSATII−) or HSATII RNA foci (HSATII+). Nuclei are indicated for representative experiment and N ≥ 50 nuclei per condition. (L) Combined RNA-FISH and immunofluorescence of HSATII RNA (green), H2AUb (cyan), and RNF2 (red) signal in +dox (4 h pulse and fixed/analyzed 20 h after induction) iDUX4 cells, (scale bar = 20 μm). Images are representative of two independent experiments conducted on separate days. (M) Nuclear H2AUb MFI was calculated in +dox cells in nuclei that contained no HSATII RNA (HSATII−) or HSATII RNA foci (HSATII+) with RNF2 signal type. Nuclei are indicated for representative experiment and N ≥ 50 nuclei per condition unless stated otherwise. (C–G, I, K, and M) Data represent means ± SD. Statistical differences between groups were analyzed employing either nonparametric Mann–Whitney test in the absence of normal distribution, two-tailed paired t test, or were assessed with one-way ANOVA Tukey’s multiple comparisons test or two-way ANOVA Sidak’s multiple comparison test between each group and a control. Source data are available for this figure: SourceData F1.
RNF2 is enriched at HSATII genomic regions and RNF2 protein aggregation correlates with loss of nuclear H2AUb signal in DUX4-expressing cells. (A) Combined RNA fluorescence in situ hybridization (RNA-FISH) and immunofluorescence of HSATII RNA (green) and RNF2 (magenta) signal in −dox or +dox (4 h pulse and fixed/analyzed 20 h after induction) iDUX4 cells, (scale bar = 20 μm). Images are representative of four independent experiments conducted on separate days. (B) Percentage of individual RNF2 foci that have at least partial signal overlap with HSATII RNA foci per nucleus in +dox iDUX4 cells. N = 50 nuclei. (C) Fraction of RNF2 nuclear aggregates present within HSATII RNA foci in +dox iDUX4 cells. Fraction calculated represents the total proportion within each individual nuclei for a representative experiment and N ≥ 100 nuclei. (D) RNF2 signal intensity measured within nuclei in −dox, +dox HSATII−, or HSATII+ nuclei compared with RNF2 signal intensity measured within HSATII RNA foci or randomly drawn ROI within the nucleoplasm in +dox HSATII+ nuclei. Each dot represents either individual nuclei or individual foci, respectively. Nuclei are indicated for representative experiment and N ≥ 100 nuclei per condition or N ≥ 40 ROI. (E) Fraction nuclei with RNF2 signal type: foci versus pan-nuclear (pan) staining patterns within +dox cells either with HSATII RNA (pos) or without HSAT RNA (neg). Fraction calculated represents fields taken from each independent experiment and N ≥ 100 nuclei. (F) Quantification of total RNF2 protein levels in +eto, −dox, pulse, or continuous +dox conditions. Blot shows two biological replicates for each condition. (G) Chromatin immunoprecipitation (ChIP) of RNF2 or IgG isotype control in −dox or +dox (4 h pulse and fixed/analyzed 20 h after induction) iDUX4 cells. Quantitative PCR (qPCR) was performed on isolated DNA from RNF2- or IgG-bound chromatin fractions. Primers targeting a control gene desert region (GDR) h16q21 (Maston et al., 2012), canonical PcG-target gene HOXA1, or HSATII 1q12 were used. N = 3 per IP per condition. (H) Representative immunofluorescence images of RNF2 signal (green) and H2AUb signal (magenta) in −dox or +dox (4 h pulse and fixed/analyzed 20 h after induction) iDUX4 cells, (scale bar = 20 μm). Images are representative of two independent experiments conducted on separate days. (I) Nuclear H2AUb MFI was calculated for nuclei that contained RNF2 pan-nuclear signal (pan) or RNF2 aggregates (foci). Nuclei are indicated for representative experiment and N ≥ 50 nuclei per condition. (J) Combined RNA-FISH and immunofluorescence of HSATII RNA (green) and H2AUb (magenta) signal in −dox or +dox (4-h pulse and fixed/analyzed 20-h after induction) iDUX4 cells, (scale bar = 20 μm). Images are representative of two independent experiments conducted on separate days. (K) Nuclear H2AUb MFI was calculated in −dox cells or +dox cells in nuclei that contained no HSATII RNA (HSATII−) or HSATII RNA foci (HSATII+). Nuclei are indicated for representative experiment and N ≥ 50 nuclei per condition. (L) Combined RNA-FISH and immunofluorescence of HSATII RNA (green), H2AUb (cyan), and RNF2 (red) signal in +dox (4 h pulse and fixed/analyzed 20 h after induction) iDUX4 cells, (scale bar = 20 μm). Images are representative of two independent experiments conducted on separate days. (M) Nuclear H2AUb MFI was calculated in +dox cells in nuclei that contained no HSATII RNA (HSATII−) or HSATII RNA foci (HSATII+) with RNF2 signal type. Nuclei are indicated for representative experiment and N ≥ 50 nuclei per condition unless stated otherwise. (C–G, I, K, and M) Data represent means ± SD. Statistical differences between groups were analyzed employing either nonparametric Mann–Whitney test in the absence of normal distribution, two-tailed paired t test, or were assessed with one-way ANOVA Tukey’s multiple comparisons test or two-way ANOVA Sidak’s multiple comparison test between each group and a control. Source data are available for this figure: SourceData F1.
To determine whether sequestration of RNF2 was at transcriptionally active HSATII DNA loci or HSATII RNA foci, we performed chromatin immunoprecipitation studies and determined the occupancy of RNF2 at target loci. We observed a significant enrichment of RNF2 at HSATII loci and a loss of RNF2 occupancy at HOXA1, a canonical PRC1-target locus (Fig. 1 G). Because loss of PRC1 activity has been shown to affect global levels of monoubiquitination of H2A.X at lysine 119 (H2AK119Ub) (Ginjala et al., 2011), we explored the possibility that RNF2 nuclear aggregation may impair global H2AK119Ub levels in DUX4-expressing cells. Nuclei containing RNF2 foci had nearly complete loss of H2AK119Ub signal (Mdn: 9.8), whereas nuclei with no RNF2 foci had increased pan-nuclear H2AK119Ub signal (Mdn: 52.8) when analyzed 20 h after a 4-h dox pulse in iDUX4 cells (Fig. 1, H and I). Moreover, nearly all induced HSATII+ cells completely lacked global H2AK119Ub nuclear signal (mean signal intensity: 17.2 ± 32) compared with uninduced (120.2 ± 29) or induced HSATII− cells (84.0 ± 52) (Fig. 1, J and K). Additional microscopy analysis confirmed that loss of H2AK119Ub nuclear signal occurred in cells that contained both RNF2 foci and HSATII RNA accumulation (311 ± 326) compared with HSATII− cells (1,715 ± 1,014) when analyzed 20 h after a 4-h dox pulse in iDUX4 cells (Fig. 1, L and M). Additionally, nuclei containing BMI1 foci showed loss of H2AK119Ub signal (Mdn: 944) compared with uninduced (Mdn: 2,045) or induced cells with pan-nuclear BMI1 signal (Mdn: 1,565) (Fig. S1, K and L). To further confirm whether RNF2 nuclear aggregation was dependent on transcriptionally active HSATII DNA loci and not HSATII RNA foci, we used antisense oligonucleotides to deplete cells of HSATII RNA and performed immunofluorescence for RNF2 and H2AK119Ub. HSATII RNA depletion did not affect RNF2 protein aggregation or rescue the loss of nuclear H2AK119Ub signal in induced cells (Fig. S2, A–C). Our data agree with other reports that activation of HSATII DNA regions causes nuclear foci formation of PRC1 components, resulting in a global loss of H2AK119Ub nuclear signal.
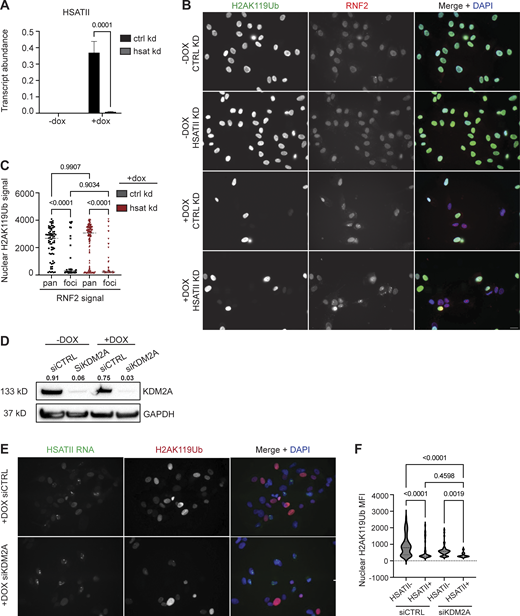
HSATII RNA depletion nor KDM2A depletion does not rescue global H2AK119Ub signal. (A) Quantitative RT-PCR of gapmer-mediated HSATII RNA depletion in cells using gapmers targeting either HSATII or control sequences (Shadle et al., 2019) in −dox or +dox (4-h pulse and fixed/analyzed 20 h after induction) iDUX4 cells. HSATII transcripts are normalized to RPL27 internal control. N = 3. (B) Paired samples from A for immunofluorescence analysis of RNF2 signal (red) and H2AK119Ub signal (green) in −dox or +dox iDUX4 cells treated with HSATII− or control gapmers. Images represent one experiment. (C) Nuclear H2AUb signal intensity was calculated for nuclei that contained RNF2 pan-nuclear signal (pan) or RNF2 aggregates (foci) in HSATII or control gapmer treated cells. Nuclei are indicated for each independent experiment and N ≥ 50 nuclei per condition. (D) siRNA depletion of either KDM2A (siKDM2A) or control (siCTRL) sequences in −dox or +dox (4-h pulse and fixed/analyzed 20 h after induction) iDUX4 cells. Western blot was performed on whole-cell lysate and probed for KDM2A. GAPDH was used as loading control. Numbers above KDM2A represent signal relative to GAPDH. Blot is representative of three biological replicates per condition. (E) Paired samples from A for combined RNA-FISH and immunofluorescence of HSATII RNA signal (green) and H2AK119Ub signal (red) in +dox (4-h pulse and fixed/analyzed 20 h after induction) iDUX4 cells with (siKDM2A) or without (siCTRL) KDM2A depletion. Images represent one experiment. (F) Nuclear H2AUb MFI was calculated in +dox iDUX4 cells with (siKDM2A) or without (siCTRL) KDM2A depletion in nuclei that contained no HSATII RNA (HSATII−) or HSATII RNA foci (HSATII+). Nuclei are indicated for representative experiment and N ≥ 50 nuclei per condition. (A, C, and F) Data represent means ± SD. Statistical differences between groups were analyzed with one-way ANOVA Tukey’s multiple comparison test or two-way ANOVA Sidak’s multiple comparison test or were assessed with Kruskal–Wallis test between each group and a control. Source data are available for this figure: SourceData FS2.
HSATII RNA depletion nor KDM2A depletion does not rescue global H2AK119Ub signal. (A) Quantitative RT-PCR of gapmer-mediated HSATII RNA depletion in cells using gapmers targeting either HSATII or control sequences (Shadle et al., 2019) in −dox or +dox (4-h pulse and fixed/analyzed 20 h after induction) iDUX4 cells. HSATII transcripts are normalized to RPL27 internal control. N = 3. (B) Paired samples from A for immunofluorescence analysis of RNF2 signal (red) and H2AK119Ub signal (green) in −dox or +dox iDUX4 cells treated with HSATII− or control gapmers. Images represent one experiment. (C) Nuclear H2AUb signal intensity was calculated for nuclei that contained RNF2 pan-nuclear signal (pan) or RNF2 aggregates (foci) in HSATII or control gapmer treated cells. Nuclei are indicated for each independent experiment and N ≥ 50 nuclei per condition. (D) siRNA depletion of either KDM2A (siKDM2A) or control (siCTRL) sequences in −dox or +dox (4-h pulse and fixed/analyzed 20 h after induction) iDUX4 cells. Western blot was performed on whole-cell lysate and probed for KDM2A. GAPDH was used as loading control. Numbers above KDM2A represent signal relative to GAPDH. Blot is representative of three biological replicates per condition. (E) Paired samples from A for combined RNA-FISH and immunofluorescence of HSATII RNA signal (green) and H2AK119Ub signal (red) in +dox (4-h pulse and fixed/analyzed 20 h after induction) iDUX4 cells with (siKDM2A) or without (siCTRL) KDM2A depletion. Images represent one experiment. (F) Nuclear H2AUb MFI was calculated in +dox iDUX4 cells with (siKDM2A) or without (siCTRL) KDM2A depletion in nuclei that contained no HSATII RNA (HSATII−) or HSATII RNA foci (HSATII+). Nuclei are indicated for representative experiment and N ≥ 50 nuclei per condition. (A, C, and F) Data represent means ± SD. Statistical differences between groups were analyzed with one-way ANOVA Tukey’s multiple comparison test or two-way ANOVA Sidak’s multiple comparison test or were assessed with Kruskal–Wallis test between each group and a control. Source data are available for this figure: SourceData FS2.
KDM2A is sequestered at transcribed HSATII regions
The lysine-specific demethylase 2A (KDM2A) has been shown to silence centromeric satellite regions (Borgel et al., 2017; Frescas et al., 2008) and to interact with HP1 proteins at pericentromeric regions (Lađinović et al., 2017). We determined whether activation of HSATII caused the accumulation of other chromatin modifiers known to interact with these regions, including KDM2 proteins. We observed aggregation of KDM2A protein in DUX4-expressing cells that colocalized with HSATII RNA foci when analyzed 20 h after a 4-h dox pulse in iDUX4 cells (Fig. 2, A and B). Nuclear KDM2A signal intensity was notably increased in induced cells regardless of HSATII expression (HSATII−: 2,317 ± 83, HSATII+: 2,347 ± 100) compared with uninduced (2,233 ± 98); however, KDM2A signal intensity within HSATII+ cell nuclei was significantly increased in HSATII RNA foci (2,576 ± 247) compared with random ROI within the nucleoplasm (2,303 ± 133) (Fig. 2 C). Furthermore, chromatin immunoprecipitation of KDM2A revealed enrichment of KDM2A occupancy at HSATII loci (Fig. 2 D). Interestingly, KDM2A and RNF2 nuclear aggregates colocalized, suggesting that KDM2A and RNF2 are in close association at HSATII expressing loci (Fig. 2, E and F). Nuclear KDM2A signal intensity was specifically increased in RNF2 foci (2,390 ± 283) compared with random ROI within the nucleoplasm (2,034 ± 106) within induced cells that contained RNF2 protein aggregates compared with total nuclear KDM2A signal, which was slightly increased in induced cells with RNF2 foci compared with uninduced cells (Fig. 2 G).

KDM2A is enriched at HSATII genomic regions and associates with RNF2 at HSATII-expressing loci. (A) Combined RNA-FISH and immunofluorescence of HSATII RNA (green) and KDM2A (magenta) signal in −dox or +dox (4 h pulse and fixed/analyzed 20 h after induction) iDUX4 cells, (scale bar = 20 μm). Asterisk in +dox merged image is the drawn distance measured in plot-profile. Images are representative of two independent experiments conducted on separate days. N ≥ 100 nuclei imaged. (B) Plot-profile colocalization of HSATII RNA or KDM2A. Y-axis represents fluorescent intensity (gray value) for HSATII (green line) or KDM2A (magenta line) signal; x-axis represents drawn distances in microns. Pearson R value = 0.64 (HSATII RNA foci and KDM2A foci in +dox cells). (C) KDM2A signal intensity measured within nuclei in −dox, +dox HSATII−, or HSATII+ nuclei, compared with KDM2A signal intensity measured within HSATII RNA foci or randomly drawn ROI within the nucleoplasm in +dox HSATII+ nuclei. Each dot represents either individual nuclei or individual foci, respectively. Nuclei are indicated for representative experiment and N ≥ 75 nuclei per condition or N ≥ 60 ROI. (D) ChIP-qPCR of KDM2A or IgG isotype control in −dox or +dox (4-h pulse and fixed/analyzed 20 h after induction) iDUX4 cells. Primers targeting control GAPDH or HSATII 1q12 were used. N = 3 per IP per condition. (E) Representative immunofluorescence images of RNF2 signal (green) and KDM2A signal (magenta) in −dox or +dox (4-h pulse and fixed/analyzed 20-h post-induction) iDUX4 cells (scale bar = 20 μm). Asterisk in +dox merged image is the drawn distance measured in the plot-profile. Images are representative of two independent experiments conducted on separate days. N ≥ 100 nuclei imaged. (F) Plot-profile colocalization of RNF2 and KDM2A. Y-axis represents fluorescent intensity (gray value) for RNF2 (green line) or KDM2A (magenta line) signal; x-axis represents drawn distances in microns. Pearson R value = 0.71 (KDM2A and RNF2 foci in +dox cells). (G) KDM2A signal intensity measured within nuclei in −dox, +dox cells with RNF2 pan-nuclear signal (pan) or RNF2 foci signal, compared to KDM2A signal intensity measured within RNF2 foci or randomly drawn ROI within the nucleoplasm in +dox RNF2 foci+ nuclei. Each dot represents either individual nuclei or individual foci, respectively. Nuclei are indicated for representative experiment and N = 10–50 nuclei per condition or N ≥ 40 ROI. (H) Combined RNA-FISH and immunofluorescence of proximity ligation assays (PLA) of KDM2A and RNF2 (magenta) and HSATII RNA (green) in −dox or +dox (4-h pulse and fixed/analyzed 20 h after induction) iDUX4 cells (scale bar = 20 μm). Images are representative of two independent experiments conducted on separate days. N = 50–100 nuclei imaged. (I) Quantification of number of PLA foci per nucleus in −dox or +dox cells. Each dot represents individual nuclei. N ≥ 80 nuclei per condition. (J) Quantification of overall nuclear PLA signal intensity within −dox or +dox cells. Each dot represents individual nuclei. N ≥ 85 nuclei per condition. (K) PLA signal intensity measured within HSATII RNA foci or random ROI within +dox HSATII+ cells only. Each dot represents individual foci. N ≥ 50 foci per condition. (C, D, G, I–K) Data represent means ± SD. Statistical differences between groups were analyzed employing either nonparametric Mann–Whitney test in the absence of normal distribution, two-tailed paired t test, or were assessed with one-way ANOVA Tukey’s multiple comparisons test between each group and a control.
KDM2A is enriched at HSATII genomic regions and associates with RNF2 at HSATII-expressing loci. (A) Combined RNA-FISH and immunofluorescence of HSATII RNA (green) and KDM2A (magenta) signal in −dox or +dox (4 h pulse and fixed/analyzed 20 h after induction) iDUX4 cells, (scale bar = 20 μm). Asterisk in +dox merged image is the drawn distance measured in plot-profile. Images are representative of two independent experiments conducted on separate days. N ≥ 100 nuclei imaged. (B) Plot-profile colocalization of HSATII RNA or KDM2A. Y-axis represents fluorescent intensity (gray value) for HSATII (green line) or KDM2A (magenta line) signal; x-axis represents drawn distances in microns. Pearson R value = 0.64 (HSATII RNA foci and KDM2A foci in +dox cells). (C) KDM2A signal intensity measured within nuclei in −dox, +dox HSATII−, or HSATII+ nuclei, compared with KDM2A signal intensity measured within HSATII RNA foci or randomly drawn ROI within the nucleoplasm in +dox HSATII+ nuclei. Each dot represents either individual nuclei or individual foci, respectively. Nuclei are indicated for representative experiment and N ≥ 75 nuclei per condition or N ≥ 60 ROI. (D) ChIP-qPCR of KDM2A or IgG isotype control in −dox or +dox (4-h pulse and fixed/analyzed 20 h after induction) iDUX4 cells. Primers targeting control GAPDH or HSATII 1q12 were used. N = 3 per IP per condition. (E) Representative immunofluorescence images of RNF2 signal (green) and KDM2A signal (magenta) in −dox or +dox (4-h pulse and fixed/analyzed 20-h post-induction) iDUX4 cells (scale bar = 20 μm). Asterisk in +dox merged image is the drawn distance measured in the plot-profile. Images are representative of two independent experiments conducted on separate days. N ≥ 100 nuclei imaged. (F) Plot-profile colocalization of RNF2 and KDM2A. Y-axis represents fluorescent intensity (gray value) for RNF2 (green line) or KDM2A (magenta line) signal; x-axis represents drawn distances in microns. Pearson R value = 0.71 (KDM2A and RNF2 foci in +dox cells). (G) KDM2A signal intensity measured within nuclei in −dox, +dox cells with RNF2 pan-nuclear signal (pan) or RNF2 foci signal, compared to KDM2A signal intensity measured within RNF2 foci or randomly drawn ROI within the nucleoplasm in +dox RNF2 foci+ nuclei. Each dot represents either individual nuclei or individual foci, respectively. Nuclei are indicated for representative experiment and N = 10–50 nuclei per condition or N ≥ 40 ROI. (H) Combined RNA-FISH and immunofluorescence of proximity ligation assays (PLA) of KDM2A and RNF2 (magenta) and HSATII RNA (green) in −dox or +dox (4-h pulse and fixed/analyzed 20 h after induction) iDUX4 cells (scale bar = 20 μm). Images are representative of two independent experiments conducted on separate days. N = 50–100 nuclei imaged. (I) Quantification of number of PLA foci per nucleus in −dox or +dox cells. Each dot represents individual nuclei. N ≥ 80 nuclei per condition. (J) Quantification of overall nuclear PLA signal intensity within −dox or +dox cells. Each dot represents individual nuclei. N ≥ 85 nuclei per condition. (K) PLA signal intensity measured within HSATII RNA foci or random ROI within +dox HSATII+ cells only. Each dot represents individual foci. N ≥ 50 foci per condition. (C, D, G, I–K) Data represent means ± SD. Statistical differences between groups were analyzed employing either nonparametric Mann–Whitney test in the absence of normal distribution, two-tailed paired t test, or were assessed with one-way ANOVA Tukey’s multiple comparisons test between each group and a control.
We hypothesized that KDM2A could be an interacting partner of RNF2, recruiting RNF2 to HSATII loci and resulting in the loss of H2AK119Ub. We performed proximity ligation assays (PLA) to determine if KDM2A and RNF2 were interacting near transcribed HSATII regions (Fig. 2 H). The number of KDM2A-RNF2 PLA foci per nucleus was unchanged between uninduced and induced cells (Fig. 2 I); however, overall nuclear KDM2A-RNF2 PLA signal intensity was moderately increased in induced cells (911 ± 54) compared with uninduced (861 ± 31) (Fig. 2 J), and KDM2A-RNF2 PLA signal was increased in HSATII RNA foci (296 ± 95) compared with random ROI within the nucleoplasm (257 ± 69) in induced HSATII+ cells, suggesting that KDM2A and RNF2 are interacting at or near activated HSATII loci (Fig. 2 K). However, depletion of KDM2A from cells did not rescue the DUX4-induced loss of H2AK119Ub global signal but rather resulted in decreased H2AK119Ub signal in both HSATII− and HSATII+ cells (Fig. S2, D–F). Thus, our data show that DUX4 activation of HSATII DNA can lead to the aggregation of other nuclear regulatory proteins including KDM2A and RNF2 protein complexes.
KDM2B is present in HSATII genomic regions
Lysine-specific demethylase 2B (KDM2B), a paralogue of KDM2A, functionally associates with components of PRC1 to form a non-canonical PRC1 complex that includes RNF2 (KDM2B–PRC1) (Farcas et al., 2012). KDM2B specifically targets PRC1 to unmethylated CpGs and pericentromeric regions of the genome (Cooper et al., 2014; He et al., 2013). Therefore, we interrogated whether KDM2B was responsible for RNF2 recruitment to HSATII loci. Interestingly, nuclear KDM2B signal was only detected in DUX4-expressing cells that contained HSATII RNA foci (144 ± 47) compared with uninduced (43 ± 9) or induced HSATII− cells (27 ± 20) (Fig. 3, A and B). Interestingly, immunofluorescence analysis showed a pan-nuclear KDM2B signal and no distinct foci colocalizing with HSATII genomic regions. To determine if KDM2B was present at HSATII loci, we performed chromatin immunoprecipitation and found that KDM2B occupancy was enriched at HSATII genomic regions in DUX4-expressing cells (Fig. 3 C). Furthermore, the KDM2B nuclear signal was enriched in cells that contained RNF2 foci (123 ± 45) compared with cells with pan-nuclear RNF2 signal (35 ± 28) (Fig. 3, D and E). To determine if KDM2B and RNF2 had close interaction, we performed KDM2B and RNF2 PLA. KDM2B-RNF2 PLA signal intensity was increased in DUX4-expressing cells, particularly within induced HSATII+ cells (443 ± 242), compared with HSATII− cells (295 ± 183) (Fig. 3, F and G). Additionally, KDM2B-RNF2 PLA immunofluorescence staining showed distinct foci that overlapped with HSATII foci but were not restricted to HSATII RNA foci, suggesting that KDM2B and RNF2 interacted at HSATII genomic regions and other loci within DUX4-expressing cells (Fig. 3, F and G). These data indicate that DUX4-expressing myoblast cells show close proximity of KDM2B and RNF2 at HSATII genomic regions in HSATII+ cells.

KDM2B is enriched at HSATII genomic regions and has increased association with RNF2 in DUX4-expressing cells. (A) Combined RNA-FISH and immunofluorescence of HSATII RNA (green) and KDM2B (magenta) signal in −dox or +dox (4-h pulse and fixed/analyzed 20 h after induction) iDUX4 cells, (scale bar = 20 μm). Images are representative of two independent experiments conducted on separate days. (B) Nuclear KDM2B MFI in −dox cells or +dox cells in nuclei that contained no HSATII RNA (HSATII−) or HSATII RNA foci (HSATII+). Nuclei are indicated for representative experiment and N = 20–50 nuclei per condition. (C) ChIP-qPCR of KDM2B or IgG isotype control in −dox or +dox iDUX4 cells. Primers targeting control GDR h16q21 (Maston et al., 2012) or HSATII 1q12 were used. Three biological replicates were performed per IP per condition. (D) Immunofluorescence of RNF2 (green) and KDM2B (magenta) signal in −dox or +dox (4 h pulse and fixed/analyzed 20 h after induction) iDUX4 cells, (scale bar = 20 μm). Images are representative of two independent experiments conducted on separate days. (E) Quantification of nuclear KDM2B MFI of nuclei that contained RNF2 pan-nuclear signal (pan) or RNF2 aggregates (foci). Nuclei are indicated for representative experiment and N = 15–50 nuclei per condition. (F) Combined RNA-FISH and immunofluorescence of PLA of KDM2B and RNF2 (magenta) and HSATII RNA (green) in −dox or +dox (4-h pulse and fixed/analyzed 20 h after induction) iDUX4 cells (scale bar = 20 μm). Images are representative of two independent experiments conducted on separate days. N = 50–100 nuclei imaged. (G) KDM2B–RNF2 PLA signal intensity measured within nuclei in −dox, +dox HSATII− or HSATII+ nuclei, compared with KDM2B–RNF2 PLA signal intensity measured within HSATII RNA foci or randomly drawn ROI within the nucleoplasm in +dox HSATII+ nuclei. Each dot represents either individual nuclei or individual foci, respectively. Nuclei are indicated for representative experiment and N ≥ 50 nuclei per condition or N ≥ 140 ROI. (B, C, E, and G) Data represent means ± SD. Statistical differences between groups were analyzed employing nonparametric Mann–Whitney test in the absence of normal distribution, with one-way ANOVA Dunnett’s or Tukey’s multiple comparison test, or two-way ANOVA Sidak’s multiple comparison test between each group and a control.
KDM2B is enriched at HSATII genomic regions and has increased association with RNF2 in DUX4-expressing cells. (A) Combined RNA-FISH and immunofluorescence of HSATII RNA (green) and KDM2B (magenta) signal in −dox or +dox (4-h pulse and fixed/analyzed 20 h after induction) iDUX4 cells, (scale bar = 20 μm). Images are representative of two independent experiments conducted on separate days. (B) Nuclear KDM2B MFI in −dox cells or +dox cells in nuclei that contained no HSATII RNA (HSATII−) or HSATII RNA foci (HSATII+). Nuclei are indicated for representative experiment and N = 20–50 nuclei per condition. (C) ChIP-qPCR of KDM2B or IgG isotype control in −dox or +dox iDUX4 cells. Primers targeting control GDR h16q21 (Maston et al., 2012) or HSATII 1q12 were used. Three biological replicates were performed per IP per condition. (D) Immunofluorescence of RNF2 (green) and KDM2B (magenta) signal in −dox or +dox (4 h pulse and fixed/analyzed 20 h after induction) iDUX4 cells, (scale bar = 20 μm). Images are representative of two independent experiments conducted on separate days. (E) Quantification of nuclear KDM2B MFI of nuclei that contained RNF2 pan-nuclear signal (pan) or RNF2 aggregates (foci). Nuclei are indicated for representative experiment and N = 15–50 nuclei per condition. (F) Combined RNA-FISH and immunofluorescence of PLA of KDM2B and RNF2 (magenta) and HSATII RNA (green) in −dox or +dox (4-h pulse and fixed/analyzed 20 h after induction) iDUX4 cells (scale bar = 20 μm). Images are representative of two independent experiments conducted on separate days. N = 50–100 nuclei imaged. (G) KDM2B–RNF2 PLA signal intensity measured within nuclei in −dox, +dox HSATII− or HSATII+ nuclei, compared with KDM2B–RNF2 PLA signal intensity measured within HSATII RNA foci or randomly drawn ROI within the nucleoplasm in +dox HSATII+ nuclei. Each dot represents either individual nuclei or individual foci, respectively. Nuclei are indicated for representative experiment and N ≥ 50 nuclei per condition or N ≥ 140 ROI. (B, C, E, and G) Data represent means ± SD. Statistical differences between groups were analyzed employing nonparametric Mann–Whitney test in the absence of normal distribution, with one-way ANOVA Dunnett’s or Tukey’s multiple comparison test, or two-way ANOVA Sidak’s multiple comparison test between each group and a control.
KDM2B recruits RNF2 to HSATII loci resulting in a global loss of H2AK119Ub
Given that KDM2 proteins have been shown to interact with RNF2 (see Figs. 2 and 3) and are required for pericentromeric transcriptional repression (Cooper et al., 2014; Puschendorf et al., 2008), we next determined if KDM2 proteins were required for RNF2 recruitment to HSATII loci. Simultaneous depletion of KDM2A and KDM2B using siRNAs from DUX4-expressing human myoblast cells resulted in a dramatic decrease in occupancy of RNF2 at HSATII genomic regions when analyzed 20 h after a 4-h dox pulse in iDUX4 cells (Fig. 4, A and B). Additionally, simultaneous depletion of KDM2A and KDM2B rescued global H2AK119Ub nuclear signal in induced HSATII+ cells (1,325 ± 987) compared with control knockdown HSATII+ cells (603 ± 658) (Fig. 4, C and D). Based on these data, we examined whether KDM2B-dependent recruitment of RNF2 to HSATII regions was responsible for the global loss of the H2AK119Ub signal. Indeed, depletion of KDM2B alone from DUX4-expressing human myoblast cells led to an increase in H2AK119Ub nuclear signal in induced HSATII+ cells (809 ± 596) compared with control knockdown HSATII+ cells (362 ± 39) (Fig. 4, E and F). These data indicate that KDM2A/B are necessary for the recruitment of RNF2 at activated HSATII loci, which impacts the global H2AK119Ub nuclear signal.
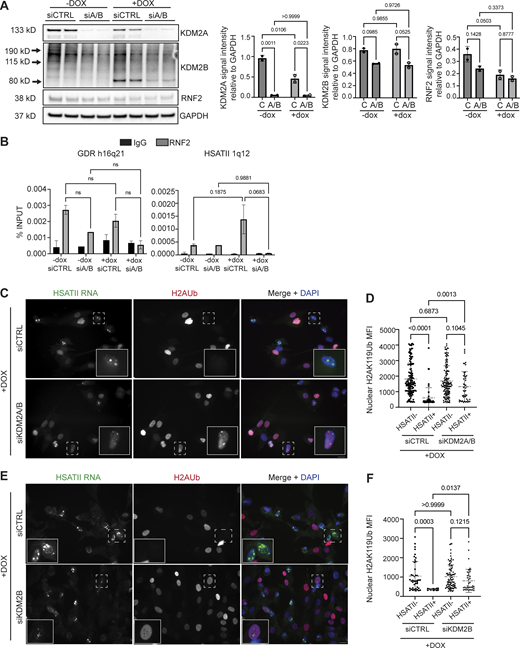
KDM2 proteins recruit RNF2 to HSATII genomic loci impacting global H2AUb signal. (A) siRNA depletion of either KDM2A and KDM2B (siA/B) or control (siCTRL) sequences in −dox or +dox (4 h pulse and fixed/analyzed 20 h after induction) iDUX4 cells. Western blot was performed on whole cell lysate and probed for KDM2A, KDM2B, and RNF2. GAPDH was used as the loading control. N = 3 per condition, blot shows two replicates. (B) Paired cells from A were used for ChIP-qPCR of RNF2 or IgG isotype control in −dox or +dox with (siA/B) or without (siCTRL) KDM2A/B depletion in iDUX4 cells. Primers targeting control GDR h16q21 (Maston et al., 2012) or HSATII 1q12 were used. N = 3 per IP per condition. (C) Combined RNA-FISH and immunofluorescence of HSATII RNA (green) and H2AUb (red) signal in +dox (4 h pulse and fixed/analyzed 20 h after induction) iDUX4 cells with (siKDM2A/B) or without (siCTRL) KDM2A/B depletion, (scale bar = 10 μm). Images are representative of two independent experiments conducted on separate days. (D) Quantification of nuclear H2AUb MFI was calculated in +dox cells with (siKDM2A/B) or without (siCTRL) KDM2A/B depletion in nuclei that contained no HSATII RNA (HSATII−) or HSATII RNA foci (HSATII+). Nuclei are indicated for each independent experiment and N ≥ 100 nuclei per condition. (E) Combined RNA-FISH and immunofluorescence of HSATII RNA (green) and H2AUb (red) signal in +dox (4-h pulse and fixed/analyzed 20 h after induction) iDUX4 cells with (siKDM2B) or without (siCTRL) KDM2B depletion, (scale bar = 10 μm). Images are representative of two independent experiments conducted on separate days. (F) Quantification of nuclear H2AUb MFI was calculated in +dox cells with (siKDM2B) or without (siCTRL) KDM2B depletion in nuclei that contained no HSATII RNA (HSATII−) or HSATII RNA foci (HSATII+). Nuclei are indicated for each independent experiment and N ≥ 100 nuclei per condition. (A, B, D, and F) Data represent means ± SD. Statistical differences between groups were analyzed with one-way ANOVA Tukey’s multiple comparison test, Kruskal–Wallis test, or two-way ANOVA Sidak’s multiple comparison test between each group and a control. Source data are available for this figure: SourceData F4.
KDM2 proteins recruit RNF2 to HSATII genomic loci impacting global H2AUb signal. (A) siRNA depletion of either KDM2A and KDM2B (siA/B) or control (siCTRL) sequences in −dox or +dox (4 h pulse and fixed/analyzed 20 h after induction) iDUX4 cells. Western blot was performed on whole cell lysate and probed for KDM2A, KDM2B, and RNF2. GAPDH was used as the loading control. N = 3 per condition, blot shows two replicates. (B) Paired cells from A were used for ChIP-qPCR of RNF2 or IgG isotype control in −dox or +dox with (siA/B) or without (siCTRL) KDM2A/B depletion in iDUX4 cells. Primers targeting control GDR h16q21 (Maston et al., 2012) or HSATII 1q12 were used. N = 3 per IP per condition. (C) Combined RNA-FISH and immunofluorescence of HSATII RNA (green) and H2AUb (red) signal in +dox (4 h pulse and fixed/analyzed 20 h after induction) iDUX4 cells with (siKDM2A/B) or without (siCTRL) KDM2A/B depletion, (scale bar = 10 μm). Images are representative of two independent experiments conducted on separate days. (D) Quantification of nuclear H2AUb MFI was calculated in +dox cells with (siKDM2A/B) or without (siCTRL) KDM2A/B depletion in nuclei that contained no HSATII RNA (HSATII−) or HSATII RNA foci (HSATII+). Nuclei are indicated for each independent experiment and N ≥ 100 nuclei per condition. (E) Combined RNA-FISH and immunofluorescence of HSATII RNA (green) and H2AUb (red) signal in +dox (4-h pulse and fixed/analyzed 20 h after induction) iDUX4 cells with (siKDM2B) or without (siCTRL) KDM2B depletion, (scale bar = 10 μm). Images are representative of two independent experiments conducted on separate days. (F) Quantification of nuclear H2AUb MFI was calculated in +dox cells with (siKDM2B) or without (siCTRL) KDM2B depletion in nuclei that contained no HSATII RNA (HSATII−) or HSATII RNA foci (HSATII+). Nuclei are indicated for each independent experiment and N ≥ 100 nuclei per condition. (A, B, D, and F) Data represent means ± SD. Statistical differences between groups were analyzed with one-way ANOVA Tukey’s multiple comparison test, Kruskal–Wallis test, or two-way ANOVA Sidak’s multiple comparison test between each group and a control. Source data are available for this figure: SourceData F4.
DUX4 expression impairs DNA damage signaling
DUX4 expression in human myoblast cells induces constitutive DNA damage, evidenced by an increase in the percentage of cells with at least five nuclear γH2A.X foci (uninduced: 3% γH2A.X+, induced: 29% γH2A.X+) (Fig. 5, A and B) and increased total γH2A.X levels (Fig. 5 C) when analyzed 24 h after induction (Dmitriev et al., 2016). Chromatin remodeling and posttranslational modifications surrounding DNA damage sites are essential upstream signaling events that help facilitate the recruitment and activation of DNA damage response (DDR) proteins, as well as dictate DNA repair pathway choice and outcomes (Ciccia and Elledge, 2010; Uckelmann and Sixma, 2017; van Attikum and Gasser, 2009). In addition to the phosphorylation of H2A.X, the ubiquitylation of histone H2A/H2A.X is a major contributor to the spatio-temporal recruitment of repair factors (Oberdoerffer and Miller, 2023; Uckelmann and Sixma, 2017). Three major classes of H2A ubiquitylation govern DDR signaling. First, H2A ubiquitylation of K13/15 by RNF8/RNF168 regulates recruitment of BRCA1 and 53BP1 proteins, major determinants of repair outcomes by homologous recombination (HR) and non-homologous end joining (NHEJ), respectively (Millán-Zambrano et al., 2022). Second, BRCA1 and its cofactor BARD1 can mediate the ubiquitylation of H2A K127/K129 (Kalb et al., 2014). Third, PRC1-mediated deposition of H2AK119Ub, the earliest known histone H2A ubiquitylation mark, is an early DDR modification required for DNA damage signaling and for transcriptional regulation at DNA damage sites (Barbour et al., 2020; Ismail et al., 2010; Pan et al., 2011; Shanbhag et al., 2010; Tamburri et al., 2020; Wu et al., 2011). However, whereas the role of K13/K15 modifications in the recruitment of repair factors is well characterized, the exact role of H2AK119Ub in DDR signaling is not well understood. We hypothesized that HSATII sequestration of PRC1 and changes in global H2AK119Ub signal impaired DNA damage signaling.
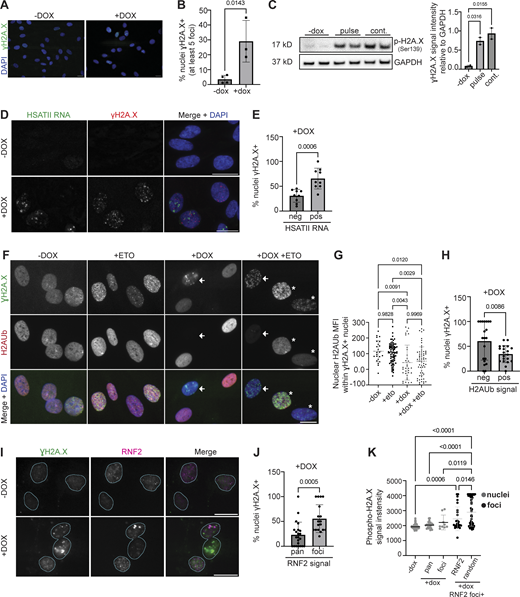
Nuclei with PRC1 aggregation, HSATII RNA accumulation, and H2AUb depletion have increased incidence of DNA damage. (A) Representative immunofluorescence images of γH2A.X signal (green) in uninduced (−dox; no DUX4 expression) or induced with 2 μg/ml doxycycline for 24-h (+dox; DUX4-expressing) iDUX4 cells (scale bar = 20 μm). Images are representative of four independent experiments conducted on separate days. (B) Percent γH2A.X positive (containing at least 5 γH2A.X foci) nuclei are indicated for three independent experiments. N ≥ 100 random nuclei per condition within each experiment. (C) Western blot was performed on whole-cell lysate and probed for phosphorylated H2A.X at Serine 139. GAPDH was used as the loading control. iDUX4 cells were either uninduced (−dox), briefly induced with 2 μg/ml doxycycline for 4-h (pulse) and harvested 20 h after induction or induced with 2 μg/ml doxycycline for 24 h (continuous, “cont.”). The blot shows two biological replicates. (D) Combined RNA-FISH and immunofluorescence of γH2A.X (red) and HSATII RNA (green) in −dox or +dox (4-h pulse and fixed/analyzed 20 h after induction) iDUX4 cells (scale bar = 20 μm). Images are representative of two independent experiments conducted on separate days. N ≥ 100 nuclei imaged. (E) Percentage of cells with HSATII RNA accumulation (pos) or no HSATII RNA (neg) that contain γH2A.X foci within +dox only condition. Dots represent the mean number of nuclei per field. (F) Representative immunofluorescence images of γH2A.X signal (green) and H2AK119Ub (H2AUb) signal (red) in iDUX4 cells. Cells were either uninduced (−dox), briefly induced with 10 μM etoposide for 30 min and immediately harvested (+eto), briefly induced with 2 μg/ml doxycycline for 4 h (pulse) and harvested 20 h after induction (+dox), or pulsed and treated with etoposide 30 min before harvest (+dox +eto) (scale bar = 10 μm). White arrows indicate nuclei that contain γH2A.X signal but low/negative H2AUb signal. Asterisks indicate nuclei that contain γH2A.X and H2AUb signal. Images are representative from two independent experiments conducted on separate days. (G) Nuclear H2AUb mean fluorescence intensity (MFI) was calculated for all γH2A.X positive nuclei. Nuclei are indicated for each independent experiment and N = 50–100 random nuclei per condition for the representative experiment. (H) Percentage of cells with no H2AUb signal (neg) or cells with H2AUb signal (pos) that contain γH2A.X foci within +dox only condition. Dots represent mean number of nuclei per field. (I) Representative immunofluorescence images of γH2A.X signal (green) and RNF2 signal (magenta) in −dox, or +dox (4 h pulse and fixed/analyzed 20 h after induction) iDUX4 cells, (scale bar = 20 μm). Images are representative of two independent experiments conducted on separate days. (J) Percentage of cells with RNF2 signal type (pan versus foci) that contain γH2A.X foci within +dox only condition. Dots represent the mean number of nuclei per field. (K) Phospho-H2A.X signal intensity measured within nuclei in −dox, +dox cells with RNF2 pan-nuclear signal (pan) or RNF2 foci signal, compared to γH2A.X signal intensity measured within RNF2 foci or randomly drawn ROI within the nucleoplasm in +dox RNF2 foci+ nuclei. Each dot represents either individual nuclei or individual foci, respectively. Nuclei are indicated for representative experiment and N = 10–50 nuclei per condition or N ≥ 40 ROI. (B, C, E, G, H, J, and K) Data represent means ± SD. Statistical differences between groups were analyzed employing either two-tailed paired t test or were assessed with one-way ANOVA Tukey’s multiple comparison test between each group and a control. Source data are available for this figure: SourceData F5.
Nuclei with PRC1 aggregation, HSATII RNA accumulation, and H2AUb depletion have increased incidence of DNA damage. (A) Representative immunofluorescence images of γH2A.X signal (green) in uninduced (−dox; no DUX4 expression) or induced with 2 μg/ml doxycycline for 24-h (+dox; DUX4-expressing) iDUX4 cells (scale bar = 20 μm). Images are representative of four independent experiments conducted on separate days. (B) Percent γH2A.X positive (containing at least 5 γH2A.X foci) nuclei are indicated for three independent experiments. N ≥ 100 random nuclei per condition within each experiment. (C) Western blot was performed on whole-cell lysate and probed for phosphorylated H2A.X at Serine 139. GAPDH was used as the loading control. iDUX4 cells were either uninduced (−dox), briefly induced with 2 μg/ml doxycycline for 4-h (pulse) and harvested 20 h after induction or induced with 2 μg/ml doxycycline for 24 h (continuous, “cont.”). The blot shows two biological replicates. (D) Combined RNA-FISH and immunofluorescence of γH2A.X (red) and HSATII RNA (green) in −dox or +dox (4-h pulse and fixed/analyzed 20 h after induction) iDUX4 cells (scale bar = 20 μm). Images are representative of two independent experiments conducted on separate days. N ≥ 100 nuclei imaged. (E) Percentage of cells with HSATII RNA accumulation (pos) or no HSATII RNA (neg) that contain γH2A.X foci within +dox only condition. Dots represent the mean number of nuclei per field. (F) Representative immunofluorescence images of γH2A.X signal (green) and H2AK119Ub (H2AUb) signal (red) in iDUX4 cells. Cells were either uninduced (−dox), briefly induced with 10 μM etoposide for 30 min and immediately harvested (+eto), briefly induced with 2 μg/ml doxycycline for 4 h (pulse) and harvested 20 h after induction (+dox), or pulsed and treated with etoposide 30 min before harvest (+dox +eto) (scale bar = 10 μm). White arrows indicate nuclei that contain γH2A.X signal but low/negative H2AUb signal. Asterisks indicate nuclei that contain γH2A.X and H2AUb signal. Images are representative from two independent experiments conducted on separate days. (G) Nuclear H2AUb mean fluorescence intensity (MFI) was calculated for all γH2A.X positive nuclei. Nuclei are indicated for each independent experiment and N = 50–100 random nuclei per condition for the representative experiment. (H) Percentage of cells with no H2AUb signal (neg) or cells with H2AUb signal (pos) that contain γH2A.X foci within +dox only condition. Dots represent mean number of nuclei per field. (I) Representative immunofluorescence images of γH2A.X signal (green) and RNF2 signal (magenta) in −dox, or +dox (4 h pulse and fixed/analyzed 20 h after induction) iDUX4 cells, (scale bar = 20 μm). Images are representative of two independent experiments conducted on separate days. (J) Percentage of cells with RNF2 signal type (pan versus foci) that contain γH2A.X foci within +dox only condition. Dots represent the mean number of nuclei per field. (K) Phospho-H2A.X signal intensity measured within nuclei in −dox, +dox cells with RNF2 pan-nuclear signal (pan) or RNF2 foci signal, compared to γH2A.X signal intensity measured within RNF2 foci or randomly drawn ROI within the nucleoplasm in +dox RNF2 foci+ nuclei. Each dot represents either individual nuclei or individual foci, respectively. Nuclei are indicated for representative experiment and N = 10–50 nuclei per condition or N ≥ 40 ROI. (B, C, E, G, H, J, and K) Data represent means ± SD. Statistical differences between groups were analyzed employing either two-tailed paired t test or were assessed with one-way ANOVA Tukey’s multiple comparison test between each group and a control. Source data are available for this figure: SourceData F5.
We first determined whether cells with HSATII RNA accumulation, RNF2 foci, and lack of H2AK119Ub signal contained DNA damage. Immunofluorescent analysis revealed that over 60% of induced HSATII+ cells had DNA damage compared with 30% of induced HSATII− cells when analyzed 20 h after a 4-h dox pulse in iDUX4 cells (Fig. 5, D and E). Furthermore, a subset of cells with nuclear γH2A.X foci in DUX4-expressing cells completely lacked H2AK119Ub nuclear signal, even after treatment with the DNA-damaging agent etoposide (Fig. 5, F and G). 20 h after dox induction of DUX4, 60% of H2AK119Ub negative cells contained γH2A.X foci compared with 34% H2AK119Ub positive cells (Fig. 5 H). PRC1 has been shown to localize rapidly to sites of DNA damage immediately after DNA breakage (Chou et al., 2010) and to induce ubiquitylation in an ATM-dependent manner. We sought to determine whether loss of H2AK119Ub signal in a subset of nuclei with DNA damage correlated with RNF2 protein aggregation. Indeed, over half of induced cells with RNF2 foci had DNA damage compared with less than a quarter of induced cells with pan-nuclear RNF2 signal (Fig. 5, I and J). Interestingly, nuclear γH2A.X signal intensity was lower in RNF2 foci (2,454 ± 795) compared with random ROI within the nucleoplasm (2,892 ± 930) within RNF2 foci+ cells (Fig. 5 K), suggesting that γH2A.X signal did not colocalize with RNF2 foci. These data point to a high incidence of DNA damage within nuclei containing RNF2 foci, depleted H2AK119Ub signal, and HSATII RNA accumulation in DUX4-expressing cells.
We speculated that RNF2 sequestration at HSATII loci and loss of H2AK119Ub signal in nuclei containing DNA damage might impair DDR signaling. We interrogated whether the major repair mediator of NHEJ via resection control, 53BP1 (Escribano-Díaz et al., 2013; Polo and Jackson, 2011; Weterings and Chen, 2008; Zhang and Gong, 2021), or effectors of HR such as RAD51 that form nucleofilaments following DNA end resection in a BRCA1/2-dependent manner (Baumann and West, 1998; Lundin et al., 2003) were recruited to sites of damage. Strikingly, immunofluorescent microscopy revealed that a subset of nuclei that contained γH2A.X foci in DUX4-expressing cells exhibited no accumulation of 53BP1 at sites of damage, even after exposure to etoposide when analyzed 20 h after a 4-h dox pulse in iDUX4 cells (Fig. 6, A and B), reducing the percentage of cells with overlapping foci from near 100% to about 30% (Fig. 6 B). The loss of 53BP1 recruitment was not due to the depletion of 53BP1 protein, as 53BP1 protein levels were unchanged within all conditions (Fig. 6 C). BRCA1 and 53BP1 compete for ubiquitylated nucleosome binding after DNA damage; following replication, deposition of ubiquitylation of histone H2A tilts the balance toward BRCA1 binding, allowing resection and RAD51 filament formation to occur after damage (Kalb et al., 2014; Uckelmann and Sixma, 2017; van Attikum and Gasser, 2009). To rule out a cell cycle–dependent effect on the failure to observe 53BP1 foci formation, we examined cells for RAD51 foci. Similar to what was seen with 53BP1, DUX4-induced γH2A.X foci did not colocalize with RAD51 nucleofilaments, with only 10% of the population showing colocalization compared with 66% in etoposide-treated cells (Fig. 6, D and E). Unlike 53BP1, RAD51 protein levels were affected by DUX4 expression (Fig. 6 F), suggesting that DUX4 impacted both the expression and localization of RAD51. Further immunofluorescent analysis of various proteins involved in DNA damage repair, including BRCA1, RNF168, and RAP80, a ubiquitin-binding protein downstream of RNF8-signaling and recruitment factor for BRCA1 (Kim et al., 2007; Wu et al., 2012), showed that DUX4 expression impacted their localization broadly (Fig. S3). Furthermore, colocalization of factors with γH2A.X foci within DUX4-expressing cells was drastically reduced (all reducing from 100% to 30% for BRCA1, 25% for RNF168, and 55% for RAP80) without impacting protein expression (Fig. S3). p53 is a major determinant of repair outcomes in response to various damage stimuli. As further evidence of a general dysregulation of DNA damage signaling following DUX4 expression, we also failed to observe recruitment of activated p53 to sites of DNA damage in a subset of nuclei that contained γH2A.X foci, reducing the overall percentage from 100% in etoposide treated to 30% in DUX4-expressing cells (Fig. 6, G and H). DUX4-expressing cells also failed to robustly activate p53 compared with etoposide-treated cells (Fig. 6 I). Thus, expression of DUX4 broadly impairs DNA damage signaling and DDR factor recruitment to DUX4-induced genomic lesions within a subset of nuclei.
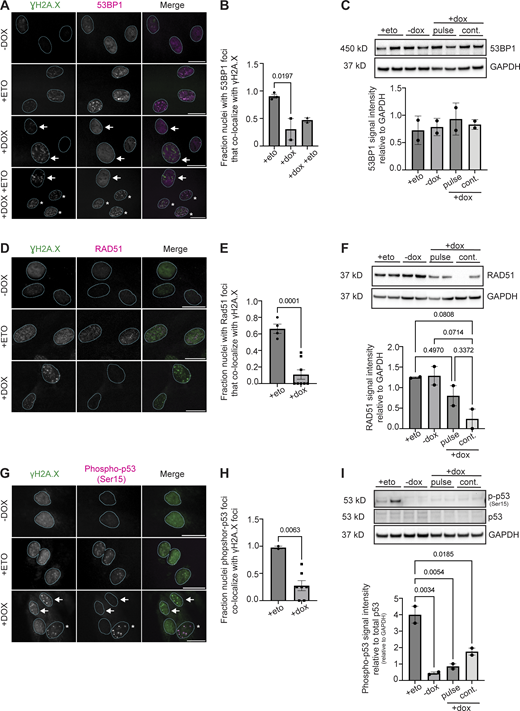
DDR factors have impaired recruitment to sites of DNA damage in DUX4-expressing cells. (A) Representative immunofluorescence images of γH2A.X signal (green) and 53BP1 signal (magenta) in uninduced (−dox), treated with 10 μM etoposide for 30 min and immediately fixed (+eto), briefly induced with 2 μg/ml doxycycline for 4 h and fixed 20 h after induction (+dox), or briefly induced with 2 μg/ml doxycycline for 4 h and at 20 h after induction treated with 10 μM etoposide for 30 min and then immediately fixed (+dox +eto), (scale bar = 20 μm). White arrows indicate nuclei with γH2A.X foci that lack 53BP1 foci. The asterisk indicates nuclei with γH2A.X foci that have 53BP1 foci colocalization. Images are representative of four independent experiments conducted on separate days. (B) Quantification of fraction nuclei with 53BP1 signal overlap with γH2A.X signal are indicated for two independent experiments and N ≥ 100 nuclei per condition within each experiment. (C) Quantification of total 53BP1 protein levels in +eto, −dox, pulse, or continuous +dox conditions. N = 3 per condition; blot shows two biological replicates for each condition. (D) Representative immunofluorescence images of γH2A.X signal (green) and RAD51 signal (magenta) in −dox, +eto, or +dox iDUX4 cells, (scale bar = 20 μm). The cell cycle state for each imaged nucleus was not determined. Images are representative of three independent experiments conducted on separate days. N ≥ 100 nuclei imaged. (E) Quantification of fraction RAD51 signal overlap with γH2A.X signal in nuclei are indicated for two independent experiments and N ≥ 100 nuclei per condition within each experiment. (F) Quantification of total RAD51 protein levels in +eto, −dox, pulse, or continuous +dox conditions. Three biological replicates were used; blot shows two biological replicates for each condition. Note that Fig. S3 F uses the same GAPDH control image because the same western membrane was used to probe for RAD51 and RNF168. (G) Representative immunofluorescence images of γH2A.X signal (green) and phosphor-p53 (Ser15) signal (magenta) in −dox, +eto, or +dox iDUX4 cells, (scale bar = 20 μm). White arrows indicate nuclei with γH2A.X foci that lack phosphor-p53 foci. Asterisk indicates nuclei with γH2A.X foci that have phosphor-p53 foci colocalization. Images are representative of two independent experiments conducted on separate days. N ≥ 50 nuclei imaged. (H) Quantification of the fraction of nuclei containing phosphor-p53 that colocalize with γH2A.X foci. Fraction calculated per field of images taken from each independent experiment and N ≥ 50 nuclei. (I) Quantification of total phosphor-p53 protein levels in +eto, −dox, pulse, or continuous +dox conditions. Relative levels are normalized to total p53 levels and then to loading control (GAPDH). N = 3; Blot shows two biological replicates for each condition. (B, C, E, F, H, and I). Data represent means ± SD. Statistical differences between groups were analyzed employing one-way ANOVA Tukey’s multiple comparison test between each group and a control. Source data are available for this figure: SourceData F6.
DDR factors have impaired recruitment to sites of DNA damage in DUX4-expressing cells. (A) Representative immunofluorescence images of γH2A.X signal (green) and 53BP1 signal (magenta) in uninduced (−dox), treated with 10 μM etoposide for 30 min and immediately fixed (+eto), briefly induced with 2 μg/ml doxycycline for 4 h and fixed 20 h after induction (+dox), or briefly induced with 2 μg/ml doxycycline for 4 h and at 20 h after induction treated with 10 μM etoposide for 30 min and then immediately fixed (+dox +eto), (scale bar = 20 μm). White arrows indicate nuclei with γH2A.X foci that lack 53BP1 foci. The asterisk indicates nuclei with γH2A.X foci that have 53BP1 foci colocalization. Images are representative of four independent experiments conducted on separate days. (B) Quantification of fraction nuclei with 53BP1 signal overlap with γH2A.X signal are indicated for two independent experiments and N ≥ 100 nuclei per condition within each experiment. (C) Quantification of total 53BP1 protein levels in +eto, −dox, pulse, or continuous +dox conditions. N = 3 per condition; blot shows two biological replicates for each condition. (D) Representative immunofluorescence images of γH2A.X signal (green) and RAD51 signal (magenta) in −dox, +eto, or +dox iDUX4 cells, (scale bar = 20 μm). The cell cycle state for each imaged nucleus was not determined. Images are representative of three independent experiments conducted on separate days. N ≥ 100 nuclei imaged. (E) Quantification of fraction RAD51 signal overlap with γH2A.X signal in nuclei are indicated for two independent experiments and N ≥ 100 nuclei per condition within each experiment. (F) Quantification of total RAD51 protein levels in +eto, −dox, pulse, or continuous +dox conditions. Three biological replicates were used; blot shows two biological replicates for each condition. Note that Fig. S3 F uses the same GAPDH control image because the same western membrane was used to probe for RAD51 and RNF168. (G) Representative immunofluorescence images of γH2A.X signal (green) and phosphor-p53 (Ser15) signal (magenta) in −dox, +eto, or +dox iDUX4 cells, (scale bar = 20 μm). White arrows indicate nuclei with γH2A.X foci that lack phosphor-p53 foci. Asterisk indicates nuclei with γH2A.X foci that have phosphor-p53 foci colocalization. Images are representative of two independent experiments conducted on separate days. N ≥ 50 nuclei imaged. (H) Quantification of the fraction of nuclei containing phosphor-p53 that colocalize with γH2A.X foci. Fraction calculated per field of images taken from each independent experiment and N ≥ 50 nuclei. (I) Quantification of total phosphor-p53 protein levels in +eto, −dox, pulse, or continuous +dox conditions. Relative levels are normalized to total p53 levels and then to loading control (GAPDH). N = 3; Blot shows two biological replicates for each condition. (B, C, E, F, H, and I). Data represent means ± SD. Statistical differences between groups were analyzed employing one-way ANOVA Tukey’s multiple comparison test between each group and a control. Source data are available for this figure: SourceData F6.
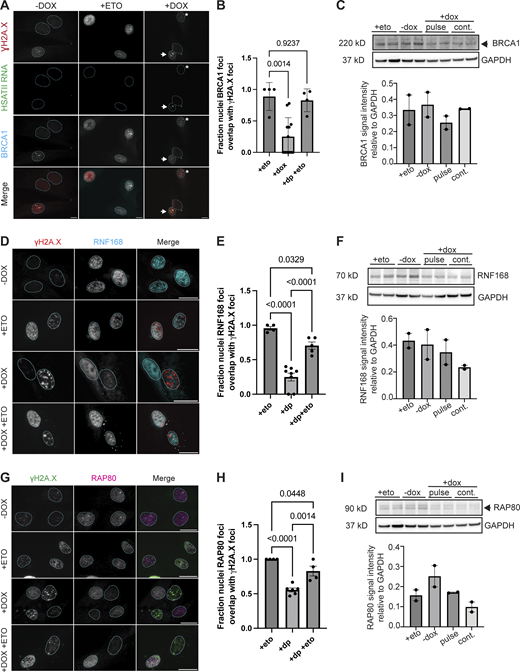
DUX4 expression impacts DNA damage response factor recruitment to sites of damage. (A) Combined RNA-FISH and immunofluorescence of HSATII RNA (green), γH2A.X (red), and BRCA1 (cyan) signal in −dox, treated with 10 μM etoposide for 30 min and immediately fixed (+eto), briefly induced with 2 μg/ml doxycycline for 4 h and fixed 20 h after induction (+dox) iDUX4 cells (scale bar = 20 μm). Arrow indicates nuclei with γH2A.X foci and HSATII RNA but lacks BRCA1 foci formation at sites of damage. Asterisk indicates nuclei with γH2A.X foci and BRCA1 foci formation at sites of damage in HSATII− nuclei. Images are representative of two independent experiments conducted on separate days. (B) Fraction nuclei with BRCA1 foci formation at DNA damage sites (γH2A.X foci) in −dox, +eto and +dox either in HSATII− or HSATII+ nuclei. Dots represent fields taken from representative experiments. N ≥ 50 nuclei per condition. (C) Western blot of whole cell lysate probing BRCA1 total protein in +eto, −dox, pulsed, or continuous dox-treated cells. The blot shows two biological replicates. Note that I uses the same GAPDH control image because the same western membrane was used to probe for BRCA1 and RAP80. (D) Immunofluorescence of γH2A.X (red) and RNF168 (cyan) signal in −dox, treated with 10 μM etoposide for 30 min and immediately fixed (+eto), briefly induced with 2 μg/ml doxycycline for 4 h and fixed 20 h after induction (+dox), or briefly induced with 2 μg/ml doxycycline for 4 h and at 20 h after induction treated with 10 μM etoposide for 30 min and then immediately fixed (+dox +eto) iDUX4 cells (scale bar = 20 μm). Images are representative from two independent experiments conducted on separate days. (E) Fraction nuclei with RNF168 foci formation at DNA damage sites (γH2A.X foci) in +eto, +dox pulse (+dp), and +dp +eto cells. Dots represent the average of fields taken from a representative experiment. N ≥ 50 nuclei per condition. (F) Western blot of whole cell lysate probing RNF168 total protein in +eto, −dox, pulsed, or continuous dox treated cells. The blot shows two biological replicates. Note that Fig. 6 F uses the same GAPDH control image because the same western membrane was used to probe for RAD51 and RNF168. (G) Immunofluorescence of γH2A.X (green) and RAP80 (magenta) signal in −dox, +eto, +dox, and +dox +eto iDUX4 cells, (scale bar = 20 μm). Images are representative of two independent experiments conducted on separate days. (H) Fraction nuclei with RAP80 foci formation at DNA damage sites (γH2A.X foci) in +eto, +dox pulse (+dp), and +dp +eto cells. Dots represent the average of fields taken from a representative experiment. N ≥ 50 nuclei per condition. (I) Western blot of whole cell lysate probing RAP80 total protein in +eto, −dox, pulsed, or continuous dox treated cells. The blot shows two biological replicates. Note that C uses the same GAPDH control image because the same western membrane was used to probe for BRCA1 and RAP80. (B, E, and H) Data represent means ± SD. Statistical differences between groups were analyzed with one-way ANOVA Tukey’s multiple comparison test between each group and a control. Source data are available for this figure: SourceData FS3.
DUX4 expression impacts DNA damage response factor recruitment to sites of damage. (A) Combined RNA-FISH and immunofluorescence of HSATII RNA (green), γH2A.X (red), and BRCA1 (cyan) signal in −dox, treated with 10 μM etoposide for 30 min and immediately fixed (+eto), briefly induced with 2 μg/ml doxycycline for 4 h and fixed 20 h after induction (+dox) iDUX4 cells (scale bar = 20 μm). Arrow indicates nuclei with γH2A.X foci and HSATII RNA but lacks BRCA1 foci formation at sites of damage. Asterisk indicates nuclei with γH2A.X foci and BRCA1 foci formation at sites of damage in HSATII− nuclei. Images are representative of two independent experiments conducted on separate days. (B) Fraction nuclei with BRCA1 foci formation at DNA damage sites (γH2A.X foci) in −dox, +eto and +dox either in HSATII− or HSATII+ nuclei. Dots represent fields taken from representative experiments. N ≥ 50 nuclei per condition. (C) Western blot of whole cell lysate probing BRCA1 total protein in +eto, −dox, pulsed, or continuous dox-treated cells. The blot shows two biological replicates. Note that I uses the same GAPDH control image because the same western membrane was used to probe for BRCA1 and RAP80. (D) Immunofluorescence of γH2A.X (red) and RNF168 (cyan) signal in −dox, treated with 10 μM etoposide for 30 min and immediately fixed (+eto), briefly induced with 2 μg/ml doxycycline for 4 h and fixed 20 h after induction (+dox), or briefly induced with 2 μg/ml doxycycline for 4 h and at 20 h after induction treated with 10 μM etoposide for 30 min and then immediately fixed (+dox +eto) iDUX4 cells (scale bar = 20 μm). Images are representative from two independent experiments conducted on separate days. (E) Fraction nuclei with RNF168 foci formation at DNA damage sites (γH2A.X foci) in +eto, +dox pulse (+dp), and +dp +eto cells. Dots represent the average of fields taken from a representative experiment. N ≥ 50 nuclei per condition. (F) Western blot of whole cell lysate probing RNF168 total protein in +eto, −dox, pulsed, or continuous dox treated cells. The blot shows two biological replicates. Note that Fig. 6 F uses the same GAPDH control image because the same western membrane was used to probe for RAD51 and RNF168. (G) Immunofluorescence of γH2A.X (green) and RAP80 (magenta) signal in −dox, +eto, +dox, and +dox +eto iDUX4 cells, (scale bar = 20 μm). Images are representative of two independent experiments conducted on separate days. (H) Fraction nuclei with RAP80 foci formation at DNA damage sites (γH2A.X foci) in +eto, +dox pulse (+dp), and +dp +eto cells. Dots represent the average of fields taken from a representative experiment. N ≥ 50 nuclei per condition. (I) Western blot of whole cell lysate probing RAP80 total protein in +eto, −dox, pulsed, or continuous dox treated cells. The blot shows two biological replicates. Note that C uses the same GAPDH control image because the same western membrane was used to probe for BRCA1 and RAP80. (B, E, and H) Data represent means ± SD. Statistical differences between groups were analyzed with one-way ANOVA Tukey’s multiple comparison test between each group and a control. Source data are available for this figure: SourceData FS3.
Defective DNA damage signaling following DUX4 expression is due to aggregation of RNF2 and loss of H2AK119Ub signaling
53BP1 acts as a bivalent histone modification reader (Fradet-Turcotte et al., 2013). It specifically binds to H4K20me2 via its TUDOR domain and to DNA damage-induced (via RNF8/RNF168) H2AK15ub through a ubiquitin-binding motif termed the UDR domain. However, a specific role for RNF2-dependent K119Ub of H2A in 53BP1 recruitment to damage foci is not known. Interestingly, the lack of 53BP1 foci formation correlated with H2AK119Ub signal depletion when analyzed 20 h after a 4-h dox pulse in iDUX4 cells with or without etoposide treatment, where all H2AK119Ub negative cells lacked 53BP1 foci (Fig. 7, A and B). We observed that lack of 53BP1 recruitment to DNA damage sites was correlated with nuclear RNF2 protein aggregation as evidenced by a decrease in the percentage of cells with 53BP1 foci formation within induced RNF2 foci+ cells (Fig. S4, A and B). This trend was evident in cells pulsed with DUX4 without etoposide treatment. This suggested to us that RNF2 activity might influence 53BP1 recruitment and retention at DNA-damaged sites. Since we previously showed that KDM2A/B knockdown impacted RNF2 enrichment at HSATII loci and partially restored global H2AK119Ub levels (see Fig. 4), we next determined whether KDM2A/B depletion impacts DNA damage signaling and DDR factor recruitment to sites of damage. 97% of control knockdown HSATII+ cells contained only γH2A.X foci and no 53BP1 foci (Fig. 7, C and D; and Fig. S4C). However, upon dual depletion of KDM2A and KDM2B, 32% of HSATII+ cells contained both γH2A.X and 53BP1 foci (Fig. 7, C and D; and Fig. S4 C). Altogether, these data demonstrate that PRC1 nuclear accumulation and loss of H2AK119Ub signal correlates with a lack of 53BP1 recruitment and retention at sites of damage. Additionally, KDM2A/B recruitment of RNF2 at HSATII loci may impact 53BP1 localization to chromatin sites following damage.

PRC1 sequestration and loss of activity impact DDR factor recruitment to sites of damage. (A) Representative immunofluorescence images of 53BP1 signal (red) and H2AUb signal (green) in −dox, +dox, +eto, or +dox +eto iDUX4 cells (scale bar = 20 μm). White arrows indicate nuclei that have no H2AUb signal and no 53BP1 signal/recruitment to sites of damage. Asterisks indicate nuclei with H2AUb signal and 53BP1 foci. Images are representative from two independent experiments conducted on separate days. (B) Fraction nuclei with H2AUb signal type that contain 53BP1 foci. With H2AUb nuclear signal (positive) or lack H2AUb signal (negative) in +dox only or +dox +eto iDUX4 cells. Dots represent each independent experiment and N ≥ 100 nuclei per condition. (C) Combined RNA-FISH and immunofluorescence of HSATII RNA (green), γH2A.X (cyan), and 53BP1 (red) signal in +dox iDUX4 cells with (siKDM2A/B) or without (siCTRL) KDM2A/B depletion (scale bar = 10 μm). Images are representative of two independent experiments conducted on separate days. (D) Fraction total nuclei with either γH2A.X signal only or both γH2A.X and 53BP1 signal in +dox cells with (siKDM2A/B) or without (siCTRL) KDM2A/B depletion in nuclei that contained HSATII RNA foci (HSATII+). N ≥ 100 nuclei between all fields; dots indicate the average between fields. (B, D) Data represent means ± SD. Statistical differences between groups were assessed with one-way ANOVA Tukey’s multiple comparison test between each group and a control.
PRC1 sequestration and loss of activity impact DDR factor recruitment to sites of damage. (A) Representative immunofluorescence images of 53BP1 signal (red) and H2AUb signal (green) in −dox, +dox, +eto, or +dox +eto iDUX4 cells (scale bar = 20 μm). White arrows indicate nuclei that have no H2AUb signal and no 53BP1 signal/recruitment to sites of damage. Asterisks indicate nuclei with H2AUb signal and 53BP1 foci. Images are representative from two independent experiments conducted on separate days. (B) Fraction nuclei with H2AUb signal type that contain 53BP1 foci. With H2AUb nuclear signal (positive) or lack H2AUb signal (negative) in +dox only or +dox +eto iDUX4 cells. Dots represent each independent experiment and N ≥ 100 nuclei per condition. (C) Combined RNA-FISH and immunofluorescence of HSATII RNA (green), γH2A.X (cyan), and 53BP1 (red) signal in +dox iDUX4 cells with (siKDM2A/B) or without (siCTRL) KDM2A/B depletion (scale bar = 10 μm). Images are representative of two independent experiments conducted on separate days. (D) Fraction total nuclei with either γH2A.X signal only or both γH2A.X and 53BP1 signal in +dox cells with (siKDM2A/B) or without (siCTRL) KDM2A/B depletion in nuclei that contained HSATII RNA foci (HSATII+). N ≥ 100 nuclei between all fields; dots indicate the average between fields. (B, D) Data represent means ± SD. Statistical differences between groups were assessed with one-way ANOVA Tukey’s multiple comparison test between each group and a control.

RNF2 aggregation correlates with loss of 53BP1 response foci and depletion of KDM2A/B rescues 53BP1 response foci formation at sites of damage. (A) Representative immunofluorescence images of 53BP1 signal (green) and RNF2 signal (magenta) in −dox, +dox, +eto, or +dox +eto iDUX4 cells (scale bar = 20 μm). White arrows indicate nuclei that contain RNF2 aggregates but no 53BP1 signal/recruitment to sites of damage. Asterisks indicate nuclei with pan-nuclear RNF2 signal and 53BP1 foci. Images are representative of three independent experiments conducted on separate days. (B) Fraction nuclei with RNF2 signal type and 53BP1 recruitment to sites of damage. RNF2 pan-nuclear signal (pan) or RNF2 aggregates (foci) in +dox only or +dox +eto iDUX4 cells. Nuclei are indicated for each independent experiment and N ≥ 100 nuclei per condition. (C) Expanded data from Fig. 7 D. Fraction total nuclei with either γH2A.X signal only or both γH2A.X and 53BP1 signal in +dox cells with (siKDM2A/B) or without (siCTRL) KDM2A/B depletion in nuclei that contained no HSATII RNA foci (HSATII−) or contained HSATII RNA foci (HSATII+). N ≥ 100 nuclei between all fields; dots indicate the average between fields. (B) Data represent means ± SD. Statistical differences between groups were analyzed with one-way ANOVA Tukey’s multiple comparison test between each group and a control.
RNF2 aggregation correlates with loss of 53BP1 response foci and depletion of KDM2A/B rescues 53BP1 response foci formation at sites of damage. (A) Representative immunofluorescence images of 53BP1 signal (green) and RNF2 signal (magenta) in −dox, +dox, +eto, or +dox +eto iDUX4 cells (scale bar = 20 μm). White arrows indicate nuclei that contain RNF2 aggregates but no 53BP1 signal/recruitment to sites of damage. Asterisks indicate nuclei with pan-nuclear RNF2 signal and 53BP1 foci. Images are representative of three independent experiments conducted on separate days. (B) Fraction nuclei with RNF2 signal type and 53BP1 recruitment to sites of damage. RNF2 pan-nuclear signal (pan) or RNF2 aggregates (foci) in +dox only or +dox +eto iDUX4 cells. Nuclei are indicated for each independent experiment and N ≥ 100 nuclei per condition. (C) Expanded data from Fig. 7 D. Fraction total nuclei with either γH2A.X signal only or both γH2A.X and 53BP1 signal in +dox cells with (siKDM2A/B) or without (siCTRL) KDM2A/B depletion in nuclei that contained no HSATII RNA foci (HSATII−) or contained HSATII RNA foci (HSATII+). N ≥ 100 nuclei between all fields; dots indicate the average between fields. (B) Data represent means ± SD. Statistical differences between groups were analyzed with one-way ANOVA Tukey’s multiple comparison test between each group and a control.
KDM2A/B–RNF2 axis regulates 53BP1 foci formation after DNA damage
Our data suggest that the KDM2A/B–RNF2 axis controls 53BP1 recruitment upon DUX4 expression. To determine whether this was a generalizable effect or peculiar to DUX4 alone, we manipulated this axis in myoblast cells and examined 53BP1 recruitment upon etoposide treatment. To test this, we depleted cells of RNF2 alone or simultaneously with either KDM2A or KDM2B. RNF2 knockdown alone reduced H2AK119Ub nuclear signal in cells treated with etoposide (1,296 ± 204) compared with control knockdown etoposide-treated cells (2,049 ± 399) (Fig. S5, A–C). However, RNF2 depletion alone did not affect 53BP1 localization to sites of damage after etoposide treatment (Fig. S5, D and E). Interestingly, simultaneous depletion of either RNF2 and KDM2A or RNF2 and KDM2B both significantly impaired H2AK119Ub nuclear signal in untreated (1,020 ± 373 and 770 ± 233, respectively) or etoposide-treated cells (1,506 ± 341 and 1,548 ± 503, respectively) compared with control knockdown untreated (1,707 ± 434) or etoposide-treated cells (2,191 ± 515) (Fig. 8, A–C). Furthermore, simultaneous depletion of either RNF2 and KDM2A or RNF2 and KDM2B both impacted 53BP1 recruitment to sites of damage following etoposide treatment, reducing the number of detectable 53BP1 foci from ∼12 foci per nucleus in control knockdown cells to ∼6 foci per nucleus in RNF2 and KDM2A-depleted cells and ∼4 foci per nucleus in RNF2 and KDM2B-depleted cells (Fig. 8, D and E). Additional targeted depletions of KDM2A and KDM2B alone also impacted 53BP1 localization to sites of damage (Fig. S5, F–H). Our data uncovers the importance of KDM2 proteins and PRC1 in regulating the recruitment of repair factors, like 53BP1.
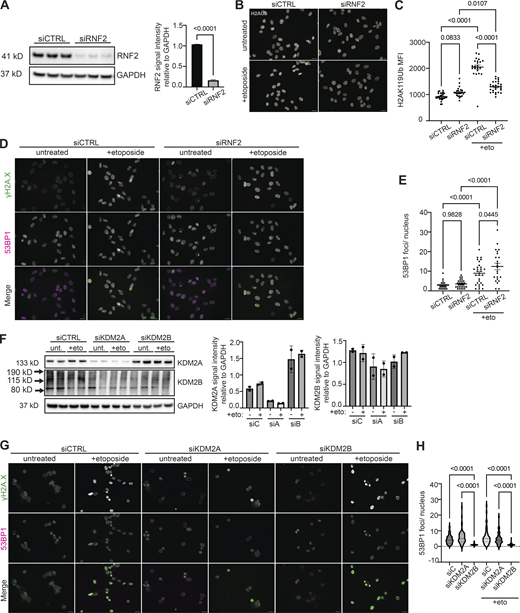
KDM2 proteins and PRC1 components are required for 53BP1 foci formation and/or H2AUb signaling following DNA damage. (A) Quantification of total RNF2 protein levels in control knockdown (siCTRL) or in RNF2-depleted cells (siRNF2). The blot shows three biological replicates. Protein levels were normalized to loading control (GAPDH). (B) Representative immunofluorescence images of H2AUb signal (gray) within siCTRL cells or siRNF2 cells either left untreated or treated briefly with 10 μM etoposide. Scale bar = 20 μm. Images are representative of three independent experiments conducted on separate days. N ≥ 100 nuclei imaged. (C) Quantification of nuclear H2AUb signal intensity in siCTRL or siRNF2 cells with or without etoposide treatment. Dots represent the number of nuclei measured. Nuclei are indicated for representative experiment and N ≥ 25 nuclei per condition. (D) Representative immunofluorescence images of γH2A.X (green) and 53BP1 (magenta) within siCTRL cells or siRNF2 cells either left untreated or treated briefly with 10 μM etoposide. Scale bar = 20 μm. Images are representative from three independent experiments conducted on separate days. N ≥ 100 nuclei imaged. (E) Quantification of the number of 53BP1 foci per nucleus in siCTRL or siRNF2 cells with or without etoposide treatment. Nuclei are indicated for representative experiment and N ≥ 25 nuclei per condition. (F) Western blot of whole cell lysate probing for total KDM2A and KDM2B protein levels in control knockdown (siCTRL), KDM2A-depleted cells (siKDM2A), or KDM2B-depleted (siKDM2B) cells. Blot shows two biological replicates. Protein levels were normalized to loading control (GAPDH). (G) Representative immunofluorescence images of γH2A.X (green) and 53BP1 (magenta) within siCTRL, siKDM2A, or siKDM2B cells either left untreated or treated briefly with 10 μM etoposide. Scale bar = 20 μm. Images are representative of two independent experiments conducted on separate days. N ≥ 100 nuclei imaged. (H) Quantification of the number of 53BP1 foci per nucleus in siCTRL, siKDM2A, or siKDM2B cells with or without etoposide treatment. Nuclei are indicated for representative experiment and N ≥ 50 nuclei per condition. (A, C, E, and H) Data represent means ± SD. Statistical differences between groups were analyzed with one-way ANOVA Tukey’s multiple comparison or Dunnett’s multiple comparison test between each group and a control. Source data are available for this figure: SourceData FS5.
KDM2 proteins and PRC1 components are required for 53BP1 foci formation and/or H2AUb signaling following DNA damage. (A) Quantification of total RNF2 protein levels in control knockdown (siCTRL) or in RNF2-depleted cells (siRNF2). The blot shows three biological replicates. Protein levels were normalized to loading control (GAPDH). (B) Representative immunofluorescence images of H2AUb signal (gray) within siCTRL cells or siRNF2 cells either left untreated or treated briefly with 10 μM etoposide. Scale bar = 20 μm. Images are representative of three independent experiments conducted on separate days. N ≥ 100 nuclei imaged. (C) Quantification of nuclear H2AUb signal intensity in siCTRL or siRNF2 cells with or without etoposide treatment. Dots represent the number of nuclei measured. Nuclei are indicated for representative experiment and N ≥ 25 nuclei per condition. (D) Representative immunofluorescence images of γH2A.X (green) and 53BP1 (magenta) within siCTRL cells or siRNF2 cells either left untreated or treated briefly with 10 μM etoposide. Scale bar = 20 μm. Images are representative from three independent experiments conducted on separate days. N ≥ 100 nuclei imaged. (E) Quantification of the number of 53BP1 foci per nucleus in siCTRL or siRNF2 cells with or without etoposide treatment. Nuclei are indicated for representative experiment and N ≥ 25 nuclei per condition. (F) Western blot of whole cell lysate probing for total KDM2A and KDM2B protein levels in control knockdown (siCTRL), KDM2A-depleted cells (siKDM2A), or KDM2B-depleted (siKDM2B) cells. Blot shows two biological replicates. Protein levels were normalized to loading control (GAPDH). (G) Representative immunofluorescence images of γH2A.X (green) and 53BP1 (magenta) within siCTRL, siKDM2A, or siKDM2B cells either left untreated or treated briefly with 10 μM etoposide. Scale bar = 20 μm. Images are representative of two independent experiments conducted on separate days. N ≥ 100 nuclei imaged. (H) Quantification of the number of 53BP1 foci per nucleus in siCTRL, siKDM2A, or siKDM2B cells with or without etoposide treatment. Nuclei are indicated for representative experiment and N ≥ 50 nuclei per condition. (A, C, E, and H) Data represent means ± SD. Statistical differences between groups were analyzed with one-way ANOVA Tukey’s multiple comparison or Dunnett’s multiple comparison test between each group and a control. Source data are available for this figure: SourceData FS5.
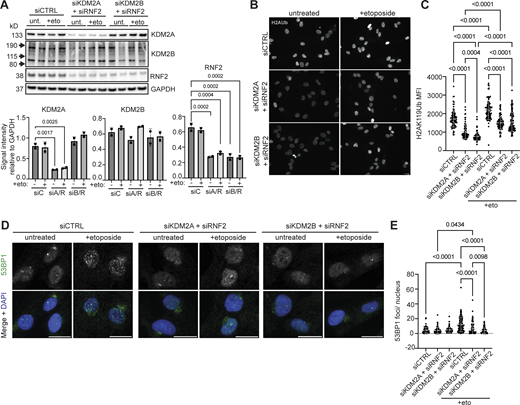
KDM2A/B–RNF2 axis is necessary for H2AUb signaling and DNA damage response. (A) Quantification of total KDM2A, KDM2B, and RNF2 protein levels in control knockdown (siCTRL), in KDM2A and RNF2-depleted cells (siKDM2A + siRNF2) or in KDM2B and RNF2-depleted cells (siKDM2B + siRNF2) with or without etoposide treatment. Blot shows two biological replicates. Protein levels were normalized to loading control (GAPDH). (B) Representative immunofluorescence images of H2AUb signal (gray) within siCTRL cells, siKDM2A + siRNF2 cells, or siKDM2B + siRNF2 cells either left untreated or treated briefly with 10 μM etoposide. Scale bar = 20 μm. Images are representative of three independent experiments conducted on separate days. N ≥ 100 nuclei imaged. (C) Quantification of nuclear H2AUb signal intensity in siCTRL cells, siKDM2A + siRNF2 cells, or siKDM2B + siRNF2 cells with or without etoposide treatment. Dots represent the number of nuclei measured. Nuclei are indicated for representative experiment and N ≥ 100 nuclei per condition. (D) Representative immunofluorescence images of 53BP1 (green) within siCTRL cells, siKDM2A + siRNF2 cells, or siKDM2B + siRNF2 cells either left untreated or treated briefly with 10 μM etoposide. Scale bar = 20 μm. Images are representative of two independent experiments conducted on separate days. N ≥ 100 nuclei imaged. (E) Quantification of the number of 53BP1 foci per nucleus in siCTRL cells, siKDM2A + siRNF2 cells, or siKDM2B + siRNF2 cells with or without etoposide treatment. Nuclei are indicated for representative experiment and N ≥ 50 nuclei per condition. (A, C, and E) Data represent means ± SD. Statistical differences between groups were analyzed employing one-way ANOVA Tukey’s multiple comparison test between each group and a control. Source data are available for this figure: SourceData F8.
KDM2A/B–RNF2 axis is necessary for H2AUb signaling and DNA damage response. (A) Quantification of total KDM2A, KDM2B, and RNF2 protein levels in control knockdown (siCTRL), in KDM2A and RNF2-depleted cells (siKDM2A + siRNF2) or in KDM2B and RNF2-depleted cells (siKDM2B + siRNF2) with or without etoposide treatment. Blot shows two biological replicates. Protein levels were normalized to loading control (GAPDH). (B) Representative immunofluorescence images of H2AUb signal (gray) within siCTRL cells, siKDM2A + siRNF2 cells, or siKDM2B + siRNF2 cells either left untreated or treated briefly with 10 μM etoposide. Scale bar = 20 μm. Images are representative of three independent experiments conducted on separate days. N ≥ 100 nuclei imaged. (C) Quantification of nuclear H2AUb signal intensity in siCTRL cells, siKDM2A + siRNF2 cells, or siKDM2B + siRNF2 cells with or without etoposide treatment. Dots represent the number of nuclei measured. Nuclei are indicated for representative experiment and N ≥ 100 nuclei per condition. (D) Representative immunofluorescence images of 53BP1 (green) within siCTRL cells, siKDM2A + siRNF2 cells, or siKDM2B + siRNF2 cells either left untreated or treated briefly with 10 μM etoposide. Scale bar = 20 μm. Images are representative of two independent experiments conducted on separate days. N ≥ 100 nuclei imaged. (E) Quantification of the number of 53BP1 foci per nucleus in siCTRL cells, siKDM2A + siRNF2 cells, or siKDM2B + siRNF2 cells with or without etoposide treatment. Nuclei are indicated for representative experiment and N ≥ 50 nuclei per condition. (A, C, and E) Data represent means ± SD. Statistical differences between groups were analyzed employing one-way ANOVA Tukey’s multiple comparison test between each group and a control. Source data are available for this figure: SourceData F8.
DUX4 expression impacts cell cycle progression
Following DNA damage, orchestrated signaling events lead to activation of cell cycle checkpoints that delay entry into the next phase of the cell cycle to allow time for adequate repair (Branzei and Foiani, 2008; Lazzaro et al., 2009). Our failure to observe proper initiation of repair cascades suggested that DUX4 might cause cell cycle defects. To further characterize the DNA damage accumulation and signaling defects seen following DUX4 expression, we used flow cytometry analysis coupled with BrdU staining to examine replicating cells.
We observed that after a pulse of doxycycline and incubating cells with BrdU 20 h prior to fixation, there was a diminished number of cells in the early S phase at the 24-h timepoint (−dox: 18% early S-phase compared with +dox: 11% early S-phase) and a concomitant increased accumulation of cells in G0/G1 (−dox: 50%, +dox: 63%), suggesting delayed S-phase entry and G1 arrest. This was not an effect of doxycycline treatment, where treatment with doxycycline in parental MB135 cells showed no reduction of early S phase or increase in G0/G1 cell populations. This effect appeared to be transient, however, there was near normal distribution of cells around 48 h after induction (21% early S-phase) (Fig. 9 A). The occurrence of a transient arrest in G1 and diminished S-phase entry and progression was further evidenced by the failure to observe significant changes in cell cycle distribution in the mid to late S-phase.
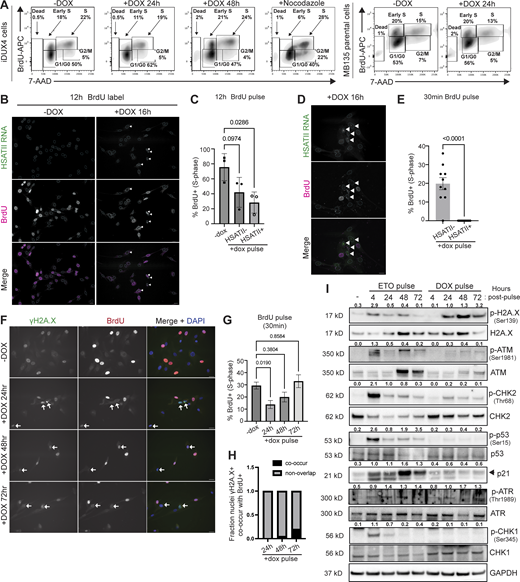
DUX4 expression induces DNA damage but fail to activate DNA damage response pathways. (A) Cell cycle flow cytometry analysis in −dox cells (iDUX4 or MB135 parentals), cells briefly induced with 2 μg/ml doxycycline for 4-h (+dox) and fixed at 24 h (iDUX4 or MB135 parentals) or 48 h (iDUX4 only), or cells treated with 0.5 μg/ml nocodazole for 24-h (control, iDUX4 only). The cell cycle was determined by BrdU-APC and 7-AAD staining. G1 accumulation in −dox cells at 24 h compared with +dox cells at 24 or 48 h after induction. N = 3. (B) Representative immunofluorescence of HSATII RNA (green) and BrdU (magenta) in induced cells 12 h after a 4-h pulse of doxycycline and 12-h pulse of BrdU leading up to fixation. Arrows indicate HSATII+ nuclei. Scale bar = 20 μm. Images are representative from three independent experiments conducted on separate days. N ≥ 100 nuclei imaged. (C) Fraction of nuclei that contain BrdU staining in either uninduced and induced cells either with no HSATII RNA (HSATII−) or with HSATII RNA (HSATII+). Dots represent independent experiments. N ≥ 100 nuclei. (D) Representative immunofluorescence of HSATII RNA (green) and BrdU (magenta) in induced cells 12 h after a 4-h pulse of doxycycline and 30-min pulse of BrdU prior to fixation. Arrows indicate HSATII+ nuclei. Scale bar = 20 μm. Images are representative of two independent experiments conducted on separate days. N ≥ 100 nuclei imaged. (E) Percent of nuclei that contain BrdU staining in induced cells either with no HSATII RNA (HSATII−) or with HSATII RNA (HSATII+). Dots represent fields taken. N ≥ 100 nuclei. (F) Immunofluorescence of γH2A.X (green) or BrdU (red) signal in −dox cells or cells briefly induced with 2 μg/ml doxycycline for 4 h (+DOX) and fixed at 24, 48, or 72 h. BrdU pulse labeling was performed on cells 30 min prior to fixation for each indicated time point. Arrows indicate nuclei with γH2A.X foci. Scale bar = 20 μm. Images are representative of three independent experiments conducted on separate days. N ≥ 100 nuclei imaged. (G) Frequency of BrdU positive (BrdU+) cells for each condition. N = 3; data are mean ± SD of experimental replicates. (H) Fraction of nuclei containing γH2A.X foci that overlap with nuclei that also contain BrdU signal. The fraction calculated represents the mean taken from each independent experiment and N ≥ 50 nuclei. (I) Western blot was performed on whole cell lysate and probed for various NHEJ and HR DNA damage response factors. GAPDH was used as the loading control. iDUX4 cells were either untreated (no etoposide) and uninduced (−dox), briefly treated with 10 μM etoposide for 4 h and harvested immediately following treatment or at 24-h timepoint intervals (24, 48, or 72 h), or briefly induced with 2 μg/ml doxycycline for 4 h and harvested immediately following treatment or at 24-h timepoint intervals (24, 48, or 72 h). The numbers indicated above phosphor-blots are phosphorylation signals relative to total protein normalized to loading control. Shown is a representative blot of three biological replicates. (C, E, and G) Data represent means ± SD. Statistical differences between groups were analyzed employing either two-tailed paired t test or were assessed with one-way ANOVA Tukey’s multiple comparison test between each group and a control. Source data are available for this figure: SourceData F9.
DUX4 expression induces DNA damage but fail to activate DNA damage response pathways. (A) Cell cycle flow cytometry analysis in −dox cells (iDUX4 or MB135 parentals), cells briefly induced with 2 μg/ml doxycycline for 4-h (+dox) and fixed at 24 h (iDUX4 or MB135 parentals) or 48 h (iDUX4 only), or cells treated with 0.5 μg/ml nocodazole for 24-h (control, iDUX4 only). The cell cycle was determined by BrdU-APC and 7-AAD staining. G1 accumulation in −dox cells at 24 h compared with +dox cells at 24 or 48 h after induction. N = 3. (B) Representative immunofluorescence of HSATII RNA (green) and BrdU (magenta) in induced cells 12 h after a 4-h pulse of doxycycline and 12-h pulse of BrdU leading up to fixation. Arrows indicate HSATII+ nuclei. Scale bar = 20 μm. Images are representative from three independent experiments conducted on separate days. N ≥ 100 nuclei imaged. (C) Fraction of nuclei that contain BrdU staining in either uninduced and induced cells either with no HSATII RNA (HSATII−) or with HSATII RNA (HSATII+). Dots represent independent experiments. N ≥ 100 nuclei. (D) Representative immunofluorescence of HSATII RNA (green) and BrdU (magenta) in induced cells 12 h after a 4-h pulse of doxycycline and 30-min pulse of BrdU prior to fixation. Arrows indicate HSATII+ nuclei. Scale bar = 20 μm. Images are representative of two independent experiments conducted on separate days. N ≥ 100 nuclei imaged. (E) Percent of nuclei that contain BrdU staining in induced cells either with no HSATII RNA (HSATII−) or with HSATII RNA (HSATII+). Dots represent fields taken. N ≥ 100 nuclei. (F) Immunofluorescence of γH2A.X (green) or BrdU (red) signal in −dox cells or cells briefly induced with 2 μg/ml doxycycline for 4 h (+DOX) and fixed at 24, 48, or 72 h. BrdU pulse labeling was performed on cells 30 min prior to fixation for each indicated time point. Arrows indicate nuclei with γH2A.X foci. Scale bar = 20 μm. Images are representative of three independent experiments conducted on separate days. N ≥ 100 nuclei imaged. (G) Frequency of BrdU positive (BrdU+) cells for each condition. N = 3; data are mean ± SD of experimental replicates. (H) Fraction of nuclei containing γH2A.X foci that overlap with nuclei that also contain BrdU signal. The fraction calculated represents the mean taken from each independent experiment and N ≥ 50 nuclei. (I) Western blot was performed on whole cell lysate and probed for various NHEJ and HR DNA damage response factors. GAPDH was used as the loading control. iDUX4 cells were either untreated (no etoposide) and uninduced (−dox), briefly treated with 10 μM etoposide for 4 h and harvested immediately following treatment or at 24-h timepoint intervals (24, 48, or 72 h), or briefly induced with 2 μg/ml doxycycline for 4 h and harvested immediately following treatment or at 24-h timepoint intervals (24, 48, or 72 h). The numbers indicated above phosphor-blots are phosphorylation signals relative to total protein normalized to loading control. Shown is a representative blot of three biological replicates. (C, E, and G) Data represent means ± SD. Statistical differences between groups were analyzed employing either two-tailed paired t test or were assessed with one-way ANOVA Tukey’s multiple comparison test between each group and a control. Source data are available for this figure: SourceData F9.
Next, we determined whether there was a correlation between the delay in S-phase progression and the accumulation of HSATII RNA. HSATII RNA accumulates in nuclei 12 h after a pulse of doxycycline (Shadle et al., 2019), so we determined whether the onset of HSATII RNA accumulation co-occurred in cells progressing through the S-phase. Immunofluorescent analysis of cells pulsed with doxycycline and then incubated with BrdU for 12 h prior to fixation at 16 h showed that 30% of HSATII+ cells had BrdU signal (Fig. 9, B and C). However, when we pulsed cells with doxycycline and then treated cells with BrdU for 30 min prior to fixation at 16 h to capture cells currently within S-phase, we observed that no HSATII+ cells incorporated BrdU (Fig. 9, D and E). Our data indicated that the short-term arrest of cells entering and progressing through the S-phase maybe during the period in which HSATII RNA accumulation and DNA damage induction occurs.
To further characterize DUX4-induced transient cell cycle arrest, we performed a time course. Cells were pulsed with doxycycline, and immediately prior to fixation at indicated times, we treated cells for 30 min with BrdU to capture cells currently in the S-phase. Immunofluorescent analysis revealed a decreased frequency of BrdU-positive (BrdU+) cells 20 h after a pulse of doxycycline (Fig. 9, F and G). By 48 and 72 h after a pulse of doxycycline, the frequency of BrdU+ cells was comparable to uninduced control cells (Fig. 9, F and G), confirming that cells experienced a brief cell cycle arrest which recovered by 48 h. These data suggest that DUX4 expression might negatively impact replication initiation and/or progression. To further characterize this, we used BrdU-labeling combined with immunofluorescence of γH2A.X in DUX4-expressing cells to determine if DNA damage correlated with the cells’ inability to progress through the S-phase (Gratzner, 1982; Kao et al., 2001). We pulsed cells with doxycycline, and prior to fixation at indicated time points, we treated cells with BrdU for 30 min and observed at 24 h after induction if there was minimal co-occurrence of cells with DNA damage and BrdU incorporation (Fig. 9, F and H), suggesting that DNA damage occurred prior to S-phase entry or that cells failed to continue synthesizing DNA after damage. Interestingly, by 48 h there was an increased percentage of cells with DNA damage and BrdU (∼10%), which further increased at the 72-h time point (∼20%) (Fig. 9, F and H). These data demonstrate that DUX4 expression causes transient cell cycle arrest that co-occurs temporally with the onset of HSATII induction. We propose that in cells with DNA damage, recovery in cell cycle re-entry is delayed but eventually progresses.
NHEJ, the dominant repair pathway during G1 due to the high chromatin compaction, and the lack of sister chromatids are necessary for mediating other repair pathways, including HR (Branzei and Foiani, 2008). The activation of NHEJ in response to DNA DSBs is regulated, in part, by the activation of protein kinase ataxia telangiectasia mutated (ATM) and downstream signaling proteins CHK2 and p53 (Escribano-Díaz et al., 2013; Weterings and Chen, 2008; Zhang and Gong, 2021). 24 h after a pulse of doxycycline, DUX4-expressing cells showed activation of ATM-target CHK2 but minimal activation of p53 compared with etoposide-treated cells (Fig. 9 I). Failure to activate p53 is consistent with dysregulated 53BP1 activity (Cuella-Martin et al., 2016). We also probed for factors involved in replication stress signaling and found that although DUX4-expressing cells showed minimal activation of CHK1 (Fig. 9 I), phosphorylation of ATR at threonine 1989, an indicator of ATR activation in response to DNA damage and replication stress (Liu et al., 2011; Nam et al., 2011), was increased in induced cells 24 h after induction (Fig. 9 I, compare lane 7 to lane 1) and further increased by 72 h (Fig. 9 I). These data indicate that DUX4 expression severely impacts cell cycle progression, dysregulates DNA damage repair checkpoint activation, and induces non-canonical replication stress responses. Our time course data showing persistent DNA damage signaling imply that DNA damage occurring in cells progressing through S-phase triggers replication stress response pathways.
Persistent DNA damage in DUX4-expressing cells leads to replication fork stress
Persistent DNA damage can promote replication stress and genomic instability (Berti et al., 2020; Krupina et al., 2021; Wilhelm et al., 2019; Xu et al., 2011; Zeman and Cimprich, 2014) leading to fork breakage. Constitutive DNA damage in FSHD myoblasts and in inducible DUX4 systems has been reported (Dmitriev et al., 2016); however, it is unclear whether the marked H2A.X phosphorylation seen upon DUX4 expression was due to replication stress or the formation of DNA DSBs, or both. Altered kinetics of BrdU incorporation (see Fig. 9) suggest that there may be defective DNA replication leading to replication stress following DUX4 expression. Therefore, we determined whether the lack of DNA damage signaling resulted in ongoing or unrepaired DNA damage. Terminal deoxynucleotidyl transferase dUTP nick end labeling (TUNEL) catalyzes the incorporation of deoxynucleotides (BrdU) at the free 3′-hydroxyl ends of fragmented DNA. We combined TUNEL with flow cytometry and found that DUX4-expressing cells have increased BrdU fluorescence, demonstrating break formation. Importantly, BrdU intensity remained unchanged 72 h after induction when compared with cells treated for 4 h with etoposide (Fig. 10 A). This suggests either that initial DNA breaks induced by DUX4 are unrepaired for days following dox induction or that genomic instability caused by DUX4 persists and causes more damage or both. Unrepaired or constitutive DNA damage can result from and lead to further replication stress in cells (Krupina et al., 2021). DUX4-expressing cells showed phosphorylation of the single-stranded DNA binding protein RPA at serine 4/8 at 24 h, a potent marker of replication stress (Ashley et al., 2014) which increased at 48 and 72 h after induction (Fig. 10 B), suggesting that the DNA damage caused by DUX4 expression promotes ongoing replication stress over time.
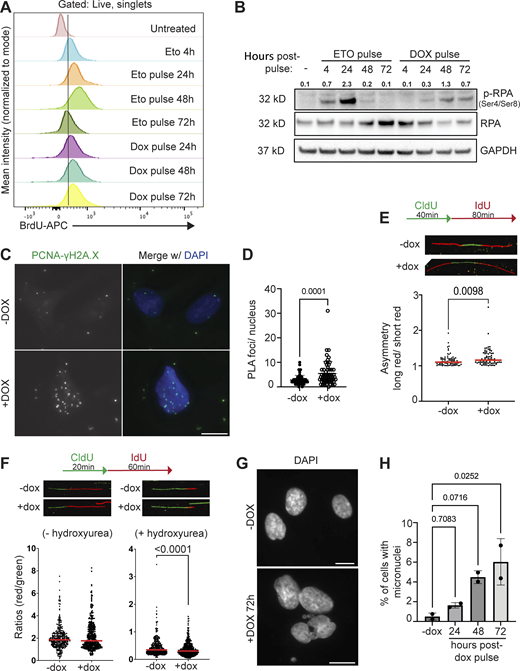
Persistent DNA damage induces replication stress and genomic instability DUX4-expressing myoblast cells. (A) Flow cytometry analysis of TUNEL experiments in untreated (no etoposide or dox), briefly treated with 10 μM etoposide for 4 h only or for 4 h and assayed at 24-h timepoint intervals (24, 48, or 72 h), or briefly induced with 2 μg/ml doxycycline for 4 h and assayed at 24-h timepoint intervals (24, 48, or 72 h). Intracellular BrdU fluorescence (BrdU-APC) was measured indicating DNA breaks. N = 3. (B) Paired protein samples from A. Western blot was performed on whole cell lysate and probed for activated (p-RPA) and total RPA. GAPDH was used as the loading control. The numbers indicated above phosphor-RPA blot is a phosphorylation signal relative to total RPA normalized to loading control. Shown is a representative blot of three biological replicates. (C) Proximity-ligation assay (PLA) performed using antibodies from two different species targeting PCNA or γH2A.X (green signal indicates proximity = PLA foci) in −dox or +dox iDUX4 cells, (scale bar = 10 μm). Images are representative from two independent experiments conducted on separate days. (D) Number of PLA foci per nucleus in either −dox or +dox iDUX4 cells. Nuclei are indicated for each independent experiment and N ≥ 60 nuclei per condition. (E and F) Representative images and ratio data from DNA fiber assay. DNA was labeled 24 or 48 h after a 4-h pulse of doxycycline, and the lengths of red and green segments were measured to calculate the ratio of each DNA fiber. N > 300 fibers. (G) Representative images of micronuclei in +dox cells compared to uninduced (−dox), (scale bar = 5 μm in −dox or 10 μm in +dox). Images are representative of two independent experiments conducted on separate days. (H) Percent cells with micronuclei in −dox cells or briefly induced with 2 μg/ml doxycycline for 4 h and fixed at 24-h time-point intervals (24, 48, or 72 h). Percent calculated represents the mean taken from each independent experiment and N ≥ 100 nuclei. (D–F and H) Data represent means ± SD. Statistical differences between groups were analyzed employing nonparametric Mann–Whitney test in the absence of normal distribution or one-way ANOVA Dunnett’s multiple comparison test between each group and a control. Source data are available for this figure: SourceData F10.
Persistent DNA damage induces replication stress and genomic instability DUX4-expressing myoblast cells. (A) Flow cytometry analysis of TUNEL experiments in untreated (no etoposide or dox), briefly treated with 10 μM etoposide for 4 h only or for 4 h and assayed at 24-h timepoint intervals (24, 48, or 72 h), or briefly induced with 2 μg/ml doxycycline for 4 h and assayed at 24-h timepoint intervals (24, 48, or 72 h). Intracellular BrdU fluorescence (BrdU-APC) was measured indicating DNA breaks. N = 3. (B) Paired protein samples from A. Western blot was performed on whole cell lysate and probed for activated (p-RPA) and total RPA. GAPDH was used as the loading control. The numbers indicated above phosphor-RPA blot is a phosphorylation signal relative to total RPA normalized to loading control. Shown is a representative blot of three biological replicates. (C) Proximity-ligation assay (PLA) performed using antibodies from two different species targeting PCNA or γH2A.X (green signal indicates proximity = PLA foci) in −dox or +dox iDUX4 cells, (scale bar = 10 μm). Images are representative from two independent experiments conducted on separate days. (D) Number of PLA foci per nucleus in either −dox or +dox iDUX4 cells. Nuclei are indicated for each independent experiment and N ≥ 60 nuclei per condition. (E and F) Representative images and ratio data from DNA fiber assay. DNA was labeled 24 or 48 h after a 4-h pulse of doxycycline, and the lengths of red and green segments were measured to calculate the ratio of each DNA fiber. N > 300 fibers. (G) Representative images of micronuclei in +dox cells compared to uninduced (−dox), (scale bar = 5 μm in −dox or 10 μm in +dox). Images are representative of two independent experiments conducted on separate days. (H) Percent cells with micronuclei in −dox cells or briefly induced with 2 μg/ml doxycycline for 4 h and fixed at 24-h time-point intervals (24, 48, or 72 h). Percent calculated represents the mean taken from each independent experiment and N ≥ 100 nuclei. (D–F and H) Data represent means ± SD. Statistical differences between groups were analyzed employing nonparametric Mann–Whitney test in the absence of normal distribution or one-way ANOVA Dunnett’s multiple comparison test between each group and a control. Source data are available for this figure: SourceData F10.
We next determined if DNA damage occurred close to the replication machinery, which would signal the activation of RPA. Proximity-ligation assays showed that DNA double-stranded breaks (marked by γH2A.X) were in close proximity to PCNA, a critical component of the replication fork machinery (Choe and Moldovan, 2017) (Fig. 10, C and D). We hypothesized that DUX4 expression led to defects in replication fork progression. To directly examine replication defects, we performed DNA fiber assays. In this assay, the DNA analogs CldU and IdU are sequentially pulsed into cells to track the progression of individual replication forks. During normal replication, sister forks typically advance at similar rates; however, measuring the asymmetry of fork progression is a sensitive way to detect problems that result in defective fork progression and fork stalling. Asymmetry is measured by comparing the lengths of the second label in bidirectionally labeled forks. With DUX4-expression, we observed minor increases in fork asymmetry starting as early as 24 h after induction (Fig. 10 E), demonstrating the onset of replication stress. To further examine replication defects upon DUX4 induction, we subjected cells to exogenous stress using hydroxyurea (HU) treatment, which depletes nucleotide levels. In the absence of exogenous stress, there was no significant reduction in fork lengths. However, upon HU treatment, DUX4-expressing cells had significantly reduced rates of replication fork progression 48 h after induction under exogenous stress (−/+ HU) conditions (Fig. 10 F), suggesting increased replication fork stalling and/or restart defects.
Persistent DNA damage and replication stress can promote genomic instability and DNA break formation, and cause chromosomal aberrations like micronuclei formation (Fenech et al., 2020; Xu et al., 2011). One model for micronuclei formation in cells undergoing replication stress results from a failure to complete DNA replication in a timely fashion, leading to the presence of under-replicated DNA in mitosis and subsequent break formation. Analyses of micronuclei formation showed that DUX4-expressing cells displayed higher frequencies of cells with micronuclei compared with uninduced cells (Fig. 10, G and H). These data indicate that DUX4-induced genomic lesions persist and cause replication stress that correlates with genomic instability.
Discussion
In this study, we uncovered that nuclear aggregation of canonical and variable PRC1, importantly the core catalytic component RNF2, at DUX4-activated HSATII loci resulted in complete loss of PRC1 nuclear function as indicated by the lack of nuclear H2AK119Ub signal. Our work revealed that RNF2 sequestration to HSATII regions is dependent on KDM2 proteins. This work is the first to link the sequestration of KDM2A/B–PRC1 at HSATII regions to impacting DNA damage response signaling. Ultimately, the inability of DUX4-expressing cells to repair DNA damage leads to persistent replication stress and genomic instability. Thus, our work identifies HSATII activation as a mechanism contributing to cellular dysregulation and genomic instability in DUX4-driven FSHD pathogenesis.
Our work clearly shows that DUX4 expression induces nuclear aggregation of several epigenetic factors including components of PRC1 and KDM2 family proteins. Nuclear protein aggregation in DUX4-expressing myoblast cells has been observed previously. DUX4 expression has been shown to impact nuclear distribution and aggregation of TDP-43, FUS, SC-35, and PML bodies which may impact nuclear architecture (Homma et al., 2015, 2016). Our work identifies a mechanism in which DUX4 expression causes protein aggregation and sequestration of nuclear proteins by activated satellite repeats. Our lab previously uncovered that DUX4-induced accumulation of HSATII non-coding RNA (ncRNA) was responsible for the nuclear accumulation of RNA-binding proteins, including eIF4A3 and ADAR1 (Shadle et al., 2019). This work implies that derepressed HSATII DNA can function in a similar fashion. Our data uncovered that HSATII DNA can sequester chromatin-modifying enzymes, including KDM2 family proteins, KDM2A and KDM2B, in addition to PRC1. Their sequestration by HSATII DNA may be due to loss of repressive genomic modifications including DNA methylation, where KDM2B–PRC1 have been shown to preferentially bind to non-methylated CpG DNA (Farcas et al., 2012). How activation of HSATII impacts the localization of other regulatory factors is unknown. Future work will uncover the complete network of factors that regulate satellite regions and those impacted by satellite derepression in diseases like FSHD.
Our study reveals the consequence that derepression of HSATII genomic regions has on the nuclear environment. The innate ability of satellite repeats to concentrate physiologically relevant amounts of epigenetic regulators to globally affect chromatin modifications is striking. Previous work has observed that HSATII DNA and RNA can be scaffolds in forming cancer-specific nuclear bodies. In several cancer cell lines, cancer-associated polycomb (CAP) bodies form at demethylated 1q12 HSATII DNA, while cancer-associated satellite transcript (CAST) bodies form with HSATII RNA foci (Hall et al., 2017). Thus, the sequestration of epigenetic regulators may affect transcription and epigenetic regulation contributing to carcinogenesis and disease states. Our study shows that sequestration of PRC1, through its interaction with KDM2A/B, at HSATII loci globally alters H2AK119Ub levels. Our study implicates that the nuclear localization of PRC1, specifically RNF2, affects the global deposition of H2AK119Ub, which impacts downstream DNA damage response signaling. Thus, beyond transcriptional and epigenetic regulation, HSATII repeats can impact critical signaling pathways contributing to genome instability and disease pathogenesis.
Some studies have identified the role of PRC1 in modulating DNA damage response signaling. Specifically, the catalytic function of PRC1 is necessary for propagating ubiquitin-mediated signaling events that recruit downstream repair factors, including 53BP1, to sites of damage (Ismail et al., 2010, 2013; Pan et al., 2011). Our work shows that RNF2 and PRC1 nuclear localization is critical for DNA damage response signaling. HSATII+ cells which harbor DNA damage as evidenced by γH2A.X levels and contain nuclear foci of RNF2 resulted in impaired downstream DDR factor recruitment to DNA damaged sites and dysregulated DDR signaling 20 h after brief expression of DUX4. This was particularly striking with major mediators of DNA damage signaling including RNF168 and RAP80, downstream repair pathway regulators 53BP1 and BRCA1, as well as signaling and repair effectors p53 and RAD51. In addition to the loss of PRC1 signaling in HSATII+ nuclei impacting 53BP1 recruitment to DNA damage sites, the modest reduction of RNF168 protein levels in induced cells (see Fig. S3 F) could also contribute to decreased 53BP1 recruitment since RNF168 modulates 53BP1 localization to damaged sites by ubiquitinating histone H2A on K15 which 53BP1 recognizes and binds to via its UDR motif (Fradet-Turcotte et al., 2013; Mattiroli et al., 2012). We show here for the first time that sequestration of RNF2 at HSATII regions can impede an effective DNA damage response downstream of DUX4 expression. Recent work has shown that nuclear sequestration of BMI1 at demethylated 1q12 satellite regions impairs effective replication stress response (Azzoni et al., 2022). BMI1 has also been shown to be required for proper HR repair (Fitieh et al., 2022). Therefore, our observations agree with other reports showing that localization of PRC1 is essential in mediating DNA damage response and ensuring genome stability.
Our study also highlights the impact DUX4 expression has on the role of RNF2 and KDM2 proteins during DDR factor recruitment to damage foci. While retention of RNF2 at transcriptionally active HSATII loci was associated with impaired 53BP1 recruitment to sites of DNA damage in DUX4-expressing cells, siRNA depletion of RNF2 alone in cells not expressing DUX4 did not result in a similar phenotype but instead led to slight increases in 53BP1 foci formation following damage. The reason for these differences is not fully clear but may be attributed to our demonstration that DUX4 expression broadly impacts DDR signaling, affecting the expression and recruitment of multiple factors (for example, DUX4 expression led to diminished RNF168 levels), whereas in cells without DUX4 expression RNF2 may no longer be required for facilitating efficient 53BP1 foci formation after DNA damage. This may also apply to KDM2B. KDM2B depletion in DUX4-expressing cells rescued the recruitment of 53BP1 to sites of damage, possibly by preventing retention/sequestration of factors such as RNF2 (and perhaps others), to HSATII loci, whereas, RNF2 and KDM2 codepletion prevented efficient 53BP1 foci formation by etoposide in the absence of DUX4 expression. However, since KDM2B depletion alone also behaved similarly, we cannot rule out a distinct and as-of-yet unclear mechanism for KDM2B independent of RNF2 during 53BP1 foci formation upon exposure to etoposide.
DNA repair pathways play an important role in the maintenance of genome stability and integrity, and failure of these pathways to correct impaired DNA may contribute to cancer and other diseases (Alhmoud et al., 2020; Jackson and Bartek, 2009). One such disease is FSHD, where DUX4 expression has been shown to induce DNA damage and constitutive DDR signaling leading to impaired myogenesis and apoptosis (Dmitriev et al., 2016; Yao et al., 2014). In addition, DNA breaks occur early in normal muscle differentiation (Dawson and Lough, 1988; Farzaneh et al., 1982; Larsen et al., 2010), possibly related to de novo gene expression and genome organization, and normal muscle differentiation requires intact DNA damage response signaling (Fayzullina and Martin, 2016; Latella et al., 2004). Our work indicates that DUX4-induced HSATII expression and dysregulation of DNA damage response pathways might impair differentiation-associated DNA damage repair and contribute to the apoptosis of FSHD muscle cells. Furthermore, PRC1 activity is crucial for myogenesis (Asp et al., 2011). Thus, DUX4-induced HSATII expression and PRC1 nuclear accumulation might contribute to impaired muscle differentiation and cytotoxicity in FSHD muscle.
This study highlights the broader impact that activation of human satellite regions may have in normal development and in disease. We speculate that HSATII activation and expression may be a unique mechanism for the cell to rapidly and efficiently reprogram signaling and epigenetic pathways. This poses the question of how DUX4-driven expression of HSATII is important in early development and how this regulation may be co-opted in cancer cells and dysregulated in disease. Interestingly, cancer cells share several features with early embryonic cells. There are various parallels between observations of HSATII biology made in this study, HSATII-expressing cancer cells, and the biology of early embryos, including localization dynamics of PRC1 components to pericentromeric regions (see Figs. 1 and 3) (Azzoni et al., 2022; Eid and Torres-Padilla, 2016; Hall et al., 2017), dynamics of H2AK119Ub modification (see Fig. 1) (Chen et al., 2021; Rodriguez-Terrones et al., 2018), lack of stringent control of cell cycle checkpoint (see Fig. 9) (Kermi et al., 2019; Wilcox et al., 1988), and genome instability (see Fig. 10) (Bakhoum and Cantley, 2018; Vanneste et al., 2009). We postulate that activation of pericentromeric satellite regions and expression of satellite ncRNA may play a functional role in the early embryo while contributing to pathogenic mechanisms in diseases like FSHD and cancer.
Materials and methods
Cell culture
Immortalized MB135 myoblast cells (Homo sapiens, female, Fields Center for FSHD and Neuromuscular Research at the University of Rochester Medical Center, https://www.urmc.rochester.edu/neurology/fshd-center.aspx) were used in this study. MB135 parental cells or MB135 cells that contain a tet-inducible DUX4 transgene (iDUX4) (RRID:Addgene_99281) (Resnick et al., 2019) were cultured in F10 medium (Gibco/Thermo Fisher Scientific) supplemented with 20% fetal bovine serum (GE Healthcare Life Sciences) and 1% penicillin/streptomycin (Gibco/Thermo Fisher Scientific), 10 ng/ml recombinant human FGF (PeproTech), and 1 μM dexamethasone (Sigma-Aldrich). iDUX4 cells were induced in the presence of 2 μg/ml of doxycycline-hyclate (Sigma-Aldrich) for 4 h and assayed 20 h after induction, unless otherwise noted. For DNA damage control samples, cells were treated with 10 μM Etoposide (Sigma-Aldrich) for 30 min at 37°C prior to assay.
Immunofluorescence
Cells cultured in 35-mm dishes were washed with 1× PBS and then treated with cold cytoskeletal (CSK) buffer (100 mM NaCl, 300 mM sucrose, 3 mM MgCl2, 10 mM Pipes, pH 6.8, and 0.2 mM Triton X-100) for 5 min. Cells were fixed in 2 or 4% paraformaldehyde (Electron Microscopy Sciences) for 10 min at room temperature (RT) and then quenched in 0.125 M glycine for 5 min at RT. Cells were permeabilized and blocked (0.5% Triton X-100, 5% normal donkey serum (Jackson Immuno Research) for 1 h at RT and subsequently incubated overnight at 4°C with the primary antibody in staining buffer (0.1% Triton X-100, 1% BSA). Cells were washed with 1× PBS for 15 min (2×) and then incubated with a secondary antibody for 1 h at RT in a staining buffer. Cells were washed with 1× PBS and nuclei were stained using DAPI (1:1,000; Sigma-Aldrich) for 10 min at RT. Cells were imaged in 1× PBS on a Zeiss AxioPhot fluorescence microscope using either 25×/0.80 NA or 40×/0.90 NA water immersion objective at RT. All fluorescence channels were imaged at non-saturating levels, and settings were kept identical between all samples within replicates used for comparisons or quantifications. For antibodies used refer to the Antibodies and primers section.
Combined HSATII RNA-FISH and immunofluorescence
Cells were cultured in 35-mm dishes or grown in 4- or 8-well chamber slides. Immunofluorescence was performed as stated in the Immunofluorescence section, with modifications. After secondary staining, cells were refixed in 4% paraformaldehyde for 7 min at RT. Cells were then washed in hybridization wash buffer (2× SSC, 50% Formamide) for 10 min at RT. Locked nucleic acid and FITC-conjugated HSATII probes were purchased from QIAGEN and are based on the sequence used in previous publications (Hall et al., 2017). Probe 5′-FAM-ATTCCATTCAGATTCCATTCGATC-3′ detects the reverse HSATII transcript. HSATII probes were diluted to 5.0 pmol/ml in whole chromosome painting buffer (50% formamide (Sigma-Aldrich), 2× SSC (Invitrogen), and 10% dextran sulfate) and hybridized overnight at 37°C. Cells were washed with 15% formamide/2× SSC for 20 min at 37°C, 2× SSC for 20 min at 37°C, and 2× SSC for 5 min at RT. Cells were washed with 1× PBS and nuclei were stained using DAPI for 10 min at RT. Cells in 35-mm dishes were imaged in 1× PBS on a Zeiss AxioPhot fluorescence microscope using either 25×/0.80 NA or 40×/0.90 NA water immersion objective at RT. Cells in the chamber slides were briefly air-dried and mounted using ProLong Glass Antifade Mounting with NucBlue (Thermo Fisher Scientific). Cells were imaged with a Zeiss Axio Imager Z2 upright microscope as part of a TissueFAXS system (TissueGnostics, software version 7.1.133) using a 40×/0.75 NA Zeiss EC Plan-NEOFLUAR air objective with an ORCA-Flash 4.0 monochrome sCMOS camera. All fluorescence channels were imaged at non-saturating levels, and the settings were kept identical between all samples within replicates used for comparisons or quantifications. For the antibodies used refer to the Antibodies and primers section.
Cell cycle immunofluorescence
Cells cultured in 35-mm dishes were assayed at various time points after induction (24-, 48-, or 72-h after induction). BrdU pulse labeling was performed on cells using 10 μM BrdU (Thermo Fisher Scientific) either 24 h or 30 min prior to being assayed. Control cells were treated with either 0.5 μg/ml nocodazole (Sigma-Aldrich) or 2 mM thymidine (Sigma-Aldrich) overnight prior to harvest. Prior to fixation, cells were washed with 1× PBS and then treated with cold CSK buffer for 5 min. Cells were fixed in 2% paraformaldehyde (Electron Microscopy Sciences) for 10 min at RT and then quenched in 0.125 M glycine for 5 min at RT. Cells were permeabilized and blocked (0.5% Triton X-100, 5% normal donkey serum) for 1 h at RT. DNA was hydrolyzed with 1 M HCl for 45 min at RT and neutralized with 0.1 M sodium borate, pH 8.5, for 30 min at RT. Cells were washed with 1× PBS and incubated overnight at 4°C with primary antibody in staining buffer (0.1% Triton X-100, 1% BSA). Cells were washed with 1× PBS for 15 min (2×) and then incubated with a secondary antibody for 1 h at RT in a staining buffer. Cells were washed with 1× PBS and nuclei were stained using DAPI for 10 min at RT. Cells were imaged in 1× PBS on a Zeiss AxioPhot fluorescence microscope using 25×/0.80 NA water immersion objective at RT. All fluorescence channels were imaged at non-saturating levels and the settings were kept identical between all samples within replicates used for comparisons or quantifications. For antibodies used refer to the Antibodies, primers, and reagents section.
Microscope image acquisition and analysis
Widefield imaging was performed with a Zeiss Axio Imager Z2 upright microscope as part of a TissueFAXS system (TissueGnostics, software version 7.1.133). Fluorescence in situ hybridization (FISH) images were acquired using a 40×/0.75 NA Zeiss EC Plan-NEOFLUAR air objective with an ORCA-Flash 4.0 monochrome sCMOS camera at RT. Fluorophores were excited with an X-Cite XLED1 system (Excelitas Technologies) at the following wavelengths: DAPI: λex = 375–400 nm; GFP: λex = 450–495 nm; Texas Red: λex = 540–600 nm; and Cy5: λex = 612–655 nm and detected using a quad-band filter set (Semrock Brightline LED-DA/FI/TR/Cy5-4X-A-ZHE). For image analysis, 16-bit FISH images were analyzed in StrataQuest version 7.1.1.134 (TissueGnostics). Nuclei were identified with the Nuclei Detection algorithm using DAPI staining. To identify FISH dots at the periphery of the nucleus, nuclear segmentation masks were dilated 0.5 μm and then FISH dots were detected with the Dots detection algorithm using the Texas Red channel. Dot size was restricted between 4 and 13 pixels within dot detection windows between 3 and 14 pixels. Additional widefield imaging was performed using a Zeiss AxioPhot fluorescence microscope with an AxioCam MRm camera (Zeiss) using either 25×/0.80 NA or 40×/0.90 NA water immersion objective at RT. AxioVision SE64 Rel. 4.9.1 acquisition software was used for image acquisition and analysis. ImageJ analysis software was used for further analysis including plot profile, mean fluorescence intensity measurements, finding maxima, and colocalization analysis. The proportion of signal overlap between two channels was calculated by segmenting individual nuclei and segmenting foci to be analyzed by thresholding signal and generating ROI from nuclei or foci, and then the overlap of signal was generated from both channel ROIs. Integrated density measurements were performed on all measured ROIs and analysis of proportion overlap between channels was performed. Protein signal intensity was measured by segmenting individual nuclei or segmenting foci of interest in one channel to be analyzed by thresholding the signal and generating ROI. Then signal intensity from the second channel was measured in nuclear ROI or foci ROI. Number of foci per nucleus was determined by first segmenting nuclei to be analyzed by thresholding signal and generating ROI, then finding maxima for individual foci (prominence was kept the same between experiments), and then calculating raw integrated density (RawIntDen). The number of foci per nucleus was RawIntDen/255 (the value of each pixel representing foci).
Gapmer-mediated knockdown
Gapmers were transfected into iDUX4 cells after doxycycline induction using Lipofectamine RNAiMAX reagent (Thermo Fisher Scientific) following the manufacturer’s instructions. Gapmers were ordered from QIAGEN. Sequences of the gapmers (a “+” indicates a locked nucleic acid modification in the following base) were as follows: Control_gfp: 5′-+G+A+G+AAAGTGTGACA+A+G+T+G-3′, HSATII_F: 5′-+A+T+G+GAATCGAATGGA+A+T+C+A-3′, and HSATII_R: 5′-+C+A+T+TCGATGATTCC+A+T+T+C.
Western blot
Cells were harvested in 100 μl cold RIPA buffer (150 mM NaCl, 1% NP-40, 0.5% sodium deoxycholate, 0.1% SDS, and 25 mM Tris-HCl, pH 7.4) supplemented with Pierce Protease Inhibitors EDTA-free (PIA32955) and Pierce Phosphatase Inhibitors (PIA32957). Cells were scraped and the cell lysate was incubated on ice for 15 min. Samples were sonicated in a Biorupter (Diagenode) for 5 min on low, 30 s on/30 s off to aid in lysis. Samples were centrifuged at 16,000 rcf for 10 min at 4°C and the supernatant was quantified using Pierce Protein BCA assay kit (Thermo Fisher Scientific). Samples were diluted in 1× NuPAGE LDS buffer (Invitrogen)/2.5% β-mercaptoethanol and boiled at 70°C for 10 min. For SDS-PAGE, proteins were loaded onto a 4–12% NuPAGE Bis-Tris gel (Invitrogen) and run at 120 V for 1–2 h in NuPAGE MES SDS Running Buffer or NuPAGE MOPS SDS running buffer (Invitrogen) with 250 μl NuPAGE antioxidant (Invitrogen). Proteins were transferred to a 0.2 µm or 0.4 μM PVDF membrane that was presoaked in MeOH for 1 min and transferred at 30 V or 200 mA for 1–1.5 hour at 4°C in NuPAGE Transfer Buffer (Invitrogen) containing 20% MeOH. Membranes were blocked in 5% milk/1× TBS/0.1% Tween or 5% BSA/1× TBS/0.1% Tween for 1 h and then incubated with primary antibody in blocking buffer overnight at 4°C with gentle rocking. Blots were washed with 1× TBS/0.1% Tween for 15 min at RT (2×) and incubated with HRP-conjugated secondary antibody for 1 h in a blocking buffer. Blots were washed with 1× TBS/0.1% Tween for 15 min at RT (2×) and the bands were detected via chemiluminescence with either SuperSignal West Pico PLUS Substrate (Thermo Fisher Scientific) or SuperSignal West Femto Substrate (Thermo Fisher Scientific) on a ChemiDoc MP imaging system (BioRad) using ImageLab 6.1 software (BioRad). Blots were analyzed using ImageLab 6.0 software (BioRad) and ImageJ for quantification of signal intensities. For antibodies used refer to the Antibodies and primers section.
Chromatin immunoprecipitation
Chromatin immunoprecipitation (ChIP) was performed as previously described (Nelson et al., 2006), with the following modifications. Cells were plated and allowed to grow to 70–80% confluence. Cells were fixed with 1.42% formaldehyde for 15 min at room temperature with shaking. Fixation was quenched with 125 mM glycine and cells were scraped into Falcon tubes and collected by centrifugation. Cells were lysed to isolate nuclei for 10 min on ice using IP Buffer (150 mM NaCl, 50 mM Tris-HCl, pH 7.4, 5 mM EDTA, 1% Triton X-100, and 0.5% NP-40) containing Pierce Protease Inhibitors EDTA-free (PIA32955) and Pierce Phosphatase Inhibitors (PIA32957) added fresh. Pelleted nuclei were sonicated on a Biruptor (Diagenode) on low for 10 min as 30 s on/30 s off, followed by four rounds of sonication on high for 10 min each as 30 s on/30 s off (50 min total sonication) in IP Buffer containing 0.5% SDS. For immunoprecipitation, 500 ng of chromatin was set aside per condition as an “Input” and 4 µg of primary targeting antibody or IgG isotype control was added to 10 µg of chromatin in an equal volume of IP Buffer containing 0.5% SDS across samples. IP buffer was added to lower the percentage of SDS < 0.1% and the tubes were incubated with rotation overnight at 4°C. During this time, protein-A agarose Fastflow beads (Millipore) were washed twice with IP Buffer and then blocked in IP Buffer containing 2% BSA by rotating overnight at 4°C. After clearing the chromatin as described, the beads were aliquoted to fresh tubes and the top 90% of chromatin was transferred to the tubes containing the blocked bead slurry. Tubes were rotated for 1 h at 4°C. Beads were washed 5× with cold IP buffer containing 0.1% SDS, 2× with cold IP buffer containing 500 mM NaCl, and 2× with cold 1× PBS. DNA was isolated as described in the original protocol and used as a template in qPCR. Input DNA was used to create a standard curve. qPCR primers for the h16q21 gene desert region were previously published (Maston et al., 2012). For antibodies used refer to the Antibodies and primers section.
Quantitative RT-PCR
RNA was harvested with the NucleoSpin RNA Kit (Takara) according to the manufacturer’s protocol. RNA quality was verified by NanoDrop 2000 (Thermo Fisher Scientific). RNA was treated with DNaseI, Amplification Grade (Invitrogen). Reverse transcription was performed using the Superscript IV First-Strand Synthesis System. For 20 μl reaction, 200–1,000 ng total RNA, 1 μl 10 mM dNTPs, 1 μl 10 mM random hexamers, 4 μl 5× SSIV buffer, 1 μl 100 mM DTT, 1 μl RNaseOUT (Invitrogen), and 1 μl SSIV RT enzyme were used. Thermal cycling conditions for reverse transcription were as follows: 50°C for 40 min, 55°C for 30 min, and 80°C for 10 min. Complementary DNA (cDNA) was treated with 1 μl of RNaseH and incubated at 37°C for 20 min and then diluted 1:5 with RNase-free H2O. Quantitative real-time PCR (qPCR) was performed on the QuantStudio 7 Flex Real-Time PCR System in a 10-μl reaction: 2 μl cDNA, 5 μl 2X iTaq Universal SYBR Green Supermix, 0.3 μl 10 μM forward and reverse primer, and 2.4 μl H2O. qPCR primers were synthesized by Integrated DNA Technologies (IDT) and are listed in the Antibodies and primers section. Thermal cycling conditions for qPCR were as follows: 50°C for 2 min and 95°C for 10 min; 40 cycles of 95°C for 15 s and 60°C for 60 s. For each biological replicate, qPCR reactions were run in technical triplicates, including RT controls. Median CT values of the technical triplicates were used for analysis. Gene expression was normalized to the housekeeping gene RPL27 (ribosomal protein L27). For primers used refer to the Antibodies and primers section.
siRNA knockdown
siRNAs were transfected into iDUX4 cells 24- to 72-h prior to doxycycline induction using Lipofectamine RNAiMAX reagent (Thermo Fisher Scientific) following the manufacturer’s instructions. ON-TARGETplus SMARTpool siRNAs were ordered from Horizon Discovery/Dharmacon Reagents. siRNAs used: human KDM2A (Catalog ID L-012458-02-0005), human KDM2B (L-014930-00-0005), human RNF2 (L-006556-00-0005), and control (D-001810-10).
Terminal deoxynucleotidyl transferase dUTP nick end labeling
Cells were fixed for 10 min with 3.7% paraformaldehyde (Thermo Fisher Scientific) and permeabilized for 15 min with 0.5% Triton X-100 (Sigma-Aldrich)/0.2 mg/ml BSA and proceeded to TUNEL staining according to manufacturer’s instructions using the TUNEL Assay Kit (ab66110; Abcam). In brief, cells were labeled with Br-dUTP for 1 h at 37°C followed by incubation with anti-BrdU-Red antibody for 30 min at RT. Cells were incubated with 7-AAD/RNase A solution for 30 min at RT and analyzed by flow cytometry using the BD LSRFortessa X-50 and BD FACS Diva software.
Proximity ligation assay
Cells were fixed for 10 min with 4% paraformaldehyde (Thermo Fisher Scientific), permeabilized for 10 min with 0.5% Triton X-100 (Sigma-Aldrich), and then blocked for 2 h at room temperature with PBS/0.3 M glycine/3% BSA. Primary antibodies were diluted in PBS/3% BSA and incubated with samples overnight at 4°C. Samples were washed three times for 10 min with 1× Wash Buffer A (10 mM Tris, 150 mM NaCl, and 0.05% Tween, adjusted pH to 7.4) and then incubated with Duolink In Situ PLA Probe Anti-Rabbit PLUS (Cat#DUO92002; Sigma-Aldrich) and Anti-Mouse MINUS (Cat#DUO92004; Sigma-Aldrich) or Anti-Rabbit MINUS (Cat#DUO92005; Sigma-Aldrich) and Anti-Mouse PLUS (Cat#DUO92001; Sigma-Aldrich) diluted in PBS/3% BSA for 1 h in a humidity chamber at 37°C. Samples were washed three times for 10 min with 1× Wash Buffer A and then treated with ligase from the Duolink In Situ Detection Reagents Green kit (Cat#DUO92014; Sigma-Aldrich) or Duolink In Situ Detection Reagents FarRed kit (Cat#DUO9203; Sigma-Aldrich) for 30 min in a humidity chamber at 37°C. Samples were washed three times for 10 min with 1× Wash Buffer A and then treated with polymerase from the Duolink In Situ Detection Reagents Green/FarRed kit for 1 h and 40 min in a humidity chamber at 37°C. Samples were washed two times for 10 min with 1× Wash Buffer B (200 mM Tris, 100 mM NaCl, adjusted pH to 7.5) and then once for 1 min with 0.01× Wash Buffer B. For combined PLA and HSATII RNA FISH, after the last wash samples were fixed with 4% PFA for 10 min at RT, incubated with hybridization wash buffer for 10 min at RT, and subsequently hybridized with HSATII reverse probe (12.5 pmole) in whole-chromosome paint overnight at 37°C. Samples were washed with 15% formamide/2× SSC for 20 min at 37°C, 2× SSC for 20 min at 37°C, and 2× SSC for 5 min at RT. Samples were briefly air-dried and mounted using ProLong Glass Antifade Mounting with NucBlue (Thermo Fisher Scientific). Cells were imaged using a Zeiss AxioPhot fluorescence microscope with an AxioCam MRm camera (Zeiss) using either 25×/0.80 NA or 40×/0.90 NA objective at RT. All fluorescence channels were imaged at non-saturating levels and the settings were kept identical between all samples within replicates used for comparisons or quantifications. For antibodies used refer to the Antibodies and primers section.
DNA fiber assay
Cells were incubated with 25 µM CldU for 20 min, washed, and subsequently treated with 250 µM IdU for 60 min. After labeling, cells were washed, harvested, and resuspended in 1× PBS. 2 μl of the cell suspension was transferred to a glass microscope slide, overlaid with 6 μl lysis buffer (0.5% SDS, 200 mM Tris-HCl [pH 7.4], and 50 mM EDTA), and the slide was tilted to allow DNA to spread by gravity. After being air-dried for 10 min, freshly prepared 3:1 methanol/acetic acid was applied on the slides to fix DNA. DNA was denatured by incubating the slide in 2.5 M HCl for 80 min, followed by three washes with 1× PBS. Blocking was performed with 5% BSA in PBS for 30 min. For immunostaining, slides were incubated overnight with primary antibodies: ab6326 anti-BrdU (cross-reacts with CldU) antibody (rat) (1:200) and BD Biosciences 347580 anti-BrdU (cross-reacts with ldU) antibody (mouse) (1:40) in 5% BSA in PBS. Slides were washed three times with 1× PBS followed by incubation for 1 h with the secondary antibodies; anti-rat AIexa-488 (1:400) and anti-mouse Alexa-594 (1:400) in 5% BSA in PBS. After washing with 1× PBS, a mounting medium was added to the slides and the images were acquired with a Leica SP8 confocal microscope. Images were analyzed with ImageJ. More than 300 fibers were counted for each condition. P values were calculated using the Mann–Whitney test. Doxycycline treatment was done 2 days before labeling for 4 h at a final concentration of 2 µg/ml. HU treatment was done with IdU labeling at a final concentration of 0.5 mM.
Cell cycle flow cytometry
Bromodeoxyuridine nucleoside was added fresh to culture media at a final concentration of 10 μM and incubated with cells for 4–24 h at 37°C. Cells were fixed in 2% paraformaldehyde (Electron Microscopy Sciences) for 10 min at RT and then quenched in 0.125 M glycine for 5 min at RT. Cells were permeabilized and blocked (0.5% Triton X-100, 5% normal donkey serum) for 10 min at RT. DNA was hydrolyzed with 1 M HCl for 45 min at RT and neutralized with 0.1 M sodium borate pH 8.5 for 30 min at RT or with DNase I for 1 h at 37°C. Cells were washed with 1× PBS and incubated for 30 min at RT with the primary antibody in staining buffer (0.1% Triton X-100, 1% BSA). Cells were washed in 1× PBS/0.5% BSA and resuspended in 7-AAD/RNase A solution for 30 min at RT and analyzed by flow cytometry using the BD LSRFortessa X-50 and BD FACS Diva software. For antibodies used refer to the Antibodies and primers section.
Statistics
All statistical analyses were performed in Prism (GraphPad). Bars represent mean ± SD. At least three experimental replicates were performed unless otherwise stated. Statistical measures are described in the legends.
Antibodies and primers
Primary antibodies
RING1B [3-3] (1:500 IF, 1:1000 PLA) (Cat#39063; Active Motif), RING1B [D22F2] (1:500 IF) (Cat#5694, RRID:AB_10705604; Cell Signaling Technology), RING1B (1:500; IF, 1:1,000; WB) (Cat#16031-1-AP; Proteintech), Ubiquityl-Histone H2A [E6C5] (1:500 IF) (Cat#05-678, RRID:AB_11214408; Millipore), Ubiquityl-Histone H2A (Lys 119) [D27C4] (1:1,600; IF, 1:1,000; WB) (Cat#8240, RRID:AB_10891618; Cell Signaling Technology), KDM2A [EPR18602] (1:500; IF and PLA 1:1,000; WB, 4 ug ChIP) (Cat#ab191387, RRID:AB_2928955; Abcam), GAPDH [6C5] (1:5,000; WB) (Cat#GTX28245, RRID:AB_370675; GeneTex), JHDM1B (1:500; IF, 1:1,000; WB and PLA, 4 ug ChIP) (Cat#09-864, RRID:AB_10806072; Millipore), DUX4 [E14-3] (1:400; IF, 1:1,000; WB) (Geng et al., 2012), Phospho-Histone H2A.X (Ser139) [JBW301] (1:400; IF, 1:1,000; WB, 1:500; TUNEL) (Cat#05-636, RRID:AB_309864; Millipore), APC anti-BrdU [Bu20a] (1:50; FC) (Cat#339807, RRID:AB_10900446; BioLegend), 7-AAD (Cat#420403; BioLegend), BrdU (1:500; IF) (Cat#GTX128091, RRID:AB_11168976; GeneTex), Histone H2A.X (1:1,000; WB) (Cat#2595, RRID:AB_10694556; Cell Signaling Technology), Phospho-ATM (Ser1981) [D6H9] (1:1,000; WB) (Cat#5883, RRID:AB_10835213; Cell Signaling Technology), ATM [D2E2] (1:1,000; WB) (Cat# 2873, RRID:AB_2062659; Cell Signaling Technology), Phospho-CHK2 (Thr68) [C13C1] (1:1,000; WB) (Cat#2197, RRID:AB_2080501; Cell Signaling Technology), CHK2 [D9C6] (1:1,000; WB) (Cat# 6334, RRID:AB_11178526; Cell Signaling Technology), Phospho-p53 (Ser15) (1:200; IF, 1:1,000; WB) (Cat#9284, RRID:AB_331464; Cell Signaling Technology), p53 [7F5] (1:1,000; WB) (Cat# 2527, RRID:AB_10695803; Cell Signaling Technology), p21 WAF1/CIP1 [12D1] (1:1,000; WB) (Cat#2947, RRID:AB_823586; Cell Signaling Technology), Phospho-ATR (Ser428) (1:1,000; WB) (Cat#2853, RRID:AB_2290281; Cell Signaling Technology), Phospho-ATR (Thr1989) (1:1,000; WB) (Cat# GTX128145, RRID:AB_2687562; Gene Tex), ATR (1:1,000; WB) (Cat# 2790, RRID:AB_2227860; Cell Signaling Technology), Phospho-CHK1 [133D3] (1:1,000; WB) (Cat#2348, RRID:AB_331212; Cell Signaling Technology), CHK1 [G-4] (1:200; WB) (Cat#sc-8408, RRID: AB_627257; Santa Cruz Biotechnology), Phospho-RPA32 (S4/S8) (1:1,000; WB) (Cat#A300-245A, RRID:AB_210547; Bethyl), RPA32/RPA2 [4E4] (1:200; IF, 1:1,000; WB) (Cat#2208, RRID:AB_2238543; Cell Signaling Technology), Phospho-BRCA1 (Ser1524) (1:1,000; WB) (Cat#9009, RRID:AB_491003; Cell Signaling Technology), BRCA1 [D-9] (1:200; WB) (Cat#sc-6954, RRID:AB_626761; Santa Cruz Biotechnology), BRCA1 (1:200; IF, 1:1,000; WB) (Cat# 07-434, RRID:AB_2275035; Millipore), RNF168 (1:200; IF, 1:1,000; WB) (Cat#21393-1-AP, RRID:AB_10733883; Proteintech), RAP80 (1:100; IF, 1:1,000; WB) (Cat#14466, RRID:AB_2798487; Cell Signaling Technology), Cyclin A (1:40 IF) (Cat#C4710, RRID:AB_1078603; Sigma-Aldrich), Caspase-3 (1:1,000; WB) (Cat#9662, RRID:AB_331439; Cell Signaling Technology), PCNA [D3H8P] (1:1,000; TUNEL) (Cat#13110, RRID:AB_2636979; Cell Signaling Technology), DAPI (1:5,000) (Cat#D9542; Millipore ), BMI1 [D20B7] (1:600; IF) (Cat#6964, RRID:AB_10828713; Cell Signaling Technology), BMI1 [EPR3745(2)] (1:500; IF, 1:1,000; WB) (Cat#ab126783, RRID:AB_11127730; Abcam), BrdU (1:500; IF) (Cat#GTX128091, RRID:AB_11168976; GeneTex), BrdU-APC [3D4] (1:50; Flow) (Cat#364113 [also 364114], RRID:AB_2814314; BioLegend).
Primers
h16q21 forward 5′-AAACAAGCATCAGGGTGGAC-3′
h16q21 reverse 5′-GATCCCACAAAGGAAAGGAAC-3′
RPL27 forward 5′-GCAAGAAGAAGATCGCCAAG-3′
RPL27 reverse 5′-TCCAAGGGGATATCCACAGA-3′
HSATII 1q12 forward 5′-TGAATGGAATCGTCATCGAA-3′
HSATII 1q12 reverse 5′-CCATTCGATAATTCCGCTTG-3′
HOXA1 forward 5′-CCCTACGCGTTAAATCAGGA-3′
HOXA1 reverse 5′-GGACCATGGGAGATGAGAGA-3′
GAPDH forward 5′-GCACGTAGCTCAGGCCTCAAGAC-3′
GADPH reverse 5′-GACTGTCGAACAGGCGGCGCAGAG-3′
Online supplemental material
Fig. S1 shows the dynamics of DUX4 and HSATII expression, and BMI1 aggregation in DUX4-expressing cells. Fig. S2 shows that HSATII RNA depletion or KDM2A depletion does not rescue the global H2AK119Ub signal. Fig. S3 shows that DUX4 expression impacts DNA damage response factor recruitment to sites of damage. Fig. S4 shows RNF2 aggregation correlates with loss of 53BP1 response foci and depletion of KDM2A/B rescues 53BP1 response foci formation at sites of damage. Fig. S5 shows that KDM2 proteins and PRC1 components are required for 53BP1 foci formation and/or H2Aub signaling following DNA damage.
Acknowledgments
We thank the Fred Hutchinson Cancer Center Cellular Imaging Shared Resource for assistance with the microscopy and image analysis, specifically Jin Meng and Lena Schroeder, and support through the Cellular Imaging Shared Resource (RRID:SCR_022609) and Flow Cytometry shared resource of the Fred Hutch/University of Washington/Seattle Children’s Cancer Consortium (P30 CA015704).
This research was supported by the National Institutes of Health (NIH) National Institute of Arthritis and Musculoskeletal and Skin diseases grant R01AR045203 (S.J. Tapscott); National Cancer Institute (NCI) grant P30CA015704 (R.O. Adeyemi); NCI grant T32CA009657 (T. Arends); Friends of FSH Research (T. Arends, S.J. Tapscott); an Early Career Investigator Grant from the Ovarian Cancer Research Alliance, and by NIH National Institute of General Medical Sciences grant R35GM150532 (R.O. Adeyemi).
Author contributions: Conceptualization: T. Arends and S.J. Tapscott. Formal analysis: T. Arends and H. Tsuchida. Funding acquisition: T. Arends, R.O. Adeyemi, and S.J. Tapscott. Investigation: T. Arends and H. Tsuchida. Project administration: T. Arends and S.J. Tapscott. Supervision: R.O. Adeyemi, S.J. Tapscott. Validation: T. Arends and H. Tsuchida. Visualization: T. Arends, H. Tsuchida. Writing—original draft: T. Arends. Writing—review & editing: T. Arends, R.O. Adeyemi, and S.J. Tapscott.

