


Membrane-shaping proteins are driving forces behind establishment of proper cell morphology and function. Yet, their reported structural and in vitro properties are noticeably inconsistent with many physiological membrane topology requirements. We demonstrate that dendritic arborization of neurons is powered by physically coordinated shaping mechanisms elicited by members of two distinct classes of membrane shapers: the F-BAR protein syndapin I and the N-Ank superfamily protein ankycorbin. Strikingly, membrane-tubulating activities by syndapin I, which would be detrimental during dendritic branching, were suppressed by ankycorbin. Ankycorbin’s integration into syndapin I–decorated membrane surfaces instead promoted curvatures and topologies reflecting those observed physiologically. In line with the functional importance of this mechanism, ankycorbin- and syndapin I–mediated functions in dendritic arborization mutually depend on each other and on a surprisingly specific interface mediating complex formation of the two membrane shapers. These striking results uncovered cooperative and interdependent functions of members of two fundamentally different membrane shaper superfamilies as a previously unknown, pivotal principle in neuronal shape development.

Introduction
Cell shape establishment is pivotal for the function of individual cells and organs. An important mechanism for membrane sculpturing is curvature induction via attachment of inherently curved peripheral membrane binding proteins—a concept prominently highlighted by molecular studies of Bin–Amphiphysin–Rvs (BAR) superfamily proteins (McMahon and Gallop, 2005; Frost et al., 2009; Qualmann et al., 2011; Carman and Dominguez, 2018; Simunovic et al., 2019; Snider et al., 2021). Among the superfamily, syndapins (also called PACSINs) are structurally distinguished by their tilde-like shape. They insert hydrophobic protein wedges into membranes to promote curvature induction (Edeling et al., 2009; Wang et al., 2009). In negative-stain EM examinations of in vitro reconstitutions, syndapin I led to uniform particles (diameter, 35 nm) and tubules (Wang et al., 2009).
SyndapinI knockout (KO) unveiled critical roles of syndapin I in presynaptic compensatory endocytosis after strong stimulation (Koch et al., 2011) and in postsynaptic internalizations of GluA1 and GluA2 during long-term depressions (Koch et al., 2020). Such endocytic processes are promoted by inductions of strong membrane curvatures by different BAR superfamily proteins (Daumke et al., 2014; Haucke and Kozlov, 2018).
Yet, syndapin I was also found to be critical for shaping dendritic spines and dendritic arborization both in neuronal cultures and in syndapin I KO mice (Schwintzer et al., 2011; Schneider et al., 2014; Koch et al., 2020). The different impairments observed are correlated with epileptic seizures and schizophrenia-related behaviors in syndapin I KO mice (Koch et al., 2011; Koch et al., 2020). The critical role of syndapin I in shaping synapses and the dendritic arbor hereby coincides with prominent localizations and accumulations of syndapin I at these sites and involves functional couplings to the actin cytoskeletal effectors N-WASP, Cobl, and Cobl-like (Schwintzer et al., 2011; Schneider et al., 2014; Izadi et al., 2021). Yet, both of these cell-shaping processes display rather moderate membrane curvatures readily visible in light microscopy. The physiological curvature values, therefore, are easily an order of magnitude higher than the intrinsic curvature of the syndapin I F-BAR domain and the tubulation data observed in vitro (Wang et al., 2009).
Furthermore, both neuronal sites of syndapin I accumulation and function show complex membrane curvatures in different orientations. In contrast, geometrical considerations for both lateral and tip-to-tip assembled stacks of crescent-shaped F-BAR proteins, such as FBP17, CIP4, and syndapin I, merely predicted the formation of membrane tubules, i.e., unidirectionally curved structures (Shimada et al., 2007; Frost et al., 2008; Wang et al., 2009; Simunovic et al., 2016). We therefore screened for yet unknown syndapin I–associated factors that may bring about disruptions of the unfavorable tubulation property of syndapin I during early neuromorphogenesis but at the same time ensure the required effectiveness of membrane shaping.
We identified ankycorbin (RAI14; NORPEG)—a member of a recently discovered, new class of membrane-shaping proteins, the N-Ank protein family (Wolf et al., 2019). N-Ank proteins are structurally completely unrelated to BAR superfamily proteins. They use ankyrin repeats to sense membrane curvature and actively shape membranes by amphipathic helix insertion (Wolf et al., 2019). Analyzing the physical and functional interactions of syndapin I and ankycorbin and their membrane-shaping abilities, we here unveil cooperation of two distinct classes of membrane shapers as a pivotal, previously unknown principle for bringing about proper morphology of neurons.
Results
Identification of ankycorbin as syndapin I binding partner
Syndapin I is a neuron-enriched membrane-shaping protein eliciting neuronal morphology during early and late stages of development (Dharmalingam et al., 2009; Schneider et al., 2014). Yet, the still relatively low levels of syndapin I during early dendritic arbor formation (Koch et al., 2011) as well as the fact that the membrane curvatures of syndapin I–modulated neuronal morphology features did not fit those observed in in vitro reconstitutions suggested that syndapin I may require further functional and physical coupling to additional powerful effectors, which may also modulate the membrane-shaping properties of syndapin I arrays.
To gain insights into putative enforcements or modulations of syndapin I–related membrane shaping functions during dendritogenesis, we conducted an in silico interaction screen using a syndapin I SH3 domain consensus, which we deduced from the syndapin I binding sites of Cobl and Cobl-like (Schwintzer et al., 2011; Izadi et al., 2021; Fig. 1 A). Running the obtained consensus against data bases yielded 533 sequences, of which 201 were from vertebrates. 54 and 41 represented Cobl-like and Cobl proteins, respectively. Strikingly, 32 further hits represented ankycorbin (RAI14, NORPEG; Peng et al., 2000; Kutty et al., 2001; Fig. 1 B).
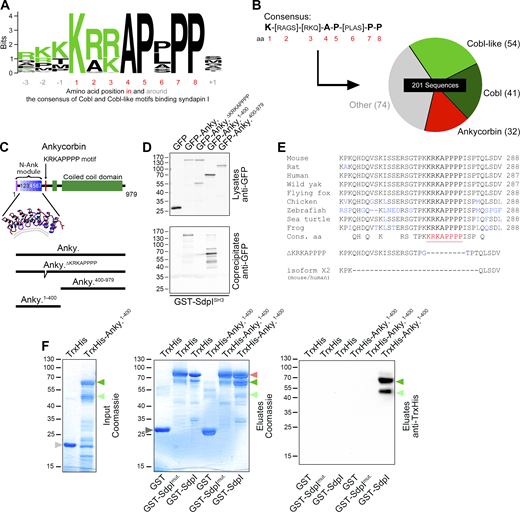
A syndapin I SH3 domain binding consensus is present in ankycorbin and mediates syndapin I binding. (A) Consensus and degree of conservation of eight amino acids (red) in the three identified syndapin I SH3 domain binding sites of Cobl and Cobl-like and neighboring residues (−3 to −1 and +1, respectively), as visualized by WebLogo 3 (basic aa in green; Crooks et al., 2004). (B) Database screening results with consensus K-[RAGS]-[RKQ]-A-P-[PLAS]-P-P via ScanProsite (de Castro et al., 2006) selected for vertebrate sequences. (C) Scheme of the domain structure of ankycorbin and schematic representation of deletion mutants. N-Ank module with N terminal amphipathic helix and seven suggested ankyrin repeats are in shades of purple, KRKAPPPP motif is in red, and green represents ankycorbin segments with coiled-coil prediction. In addition, a structural representative of the seven ankyrin repeats is shown. (D) Anti-GFP immunoblotting analysis of coprecipitation experiments with ankycorbin and mutants thereof depicted in C and immobilized syndapin I (SdpI) SH3 domain. For supernatants and further specificity controls with immobilized GST, see Fig. S1. (E) Alignment showing that the verified syndapin I binding site of ankycorbin (red, bold, underlined) is highly conserved throughout evolution (mouse, Q3EP71-1; rat, Q5U312-1; human, Q9P0K7-1; [black] flying fox [black fruit bat], XP_015449448.1; wild yak, L8J220; chicken, E1C6R7; zebrafish, A9JT26; [green] sea turtle, XP_037758560.1; frog (Xenopus laevis), A8WGG4). Blue residues highlight lack of full conservation. Additionally depicted are the KRKAPPPP deletion mutant (∆271–281; ∆KRKAPPPP) and the X2 splice isoform of ankycorbin (mouse, NP_001343463.1, human, Q9P0K7-4). Blue residues in the ∆KRKAPPPP mutant mark mutated residues. For further information and characterization, see Fig. S1. (F) Coomassie-stained gels (left, center) and immunoblotting analysis (right) of reconstitutions of complex formation between immobilized GST-syndapin I but not a GST-syndapin IP434L mutant (GST-SdpImut.) with purified TrxHis-tagged ankycorbin1-400 proving a direct interaction. Green arrowheads, TrxHis-ankycorbin1-400, and a proteolytic fragment thereof; red arrowhead marks the positions of GST-syndapin I and GST-syndapin IP434L. Gray arrowheads at the left, negative controls TrxHis (light gray, in left panel (input), 19 kD) and GST (dark gray, in middle panel (eluates), 27 kD), respectively. Source data are available for this figure: SourceData F1.
A syndapin I SH3 domain binding consensus is present in ankycorbin and mediates syndapin I binding. (A) Consensus and degree of conservation of eight amino acids (red) in the three identified syndapin I SH3 domain binding sites of Cobl and Cobl-like and neighboring residues (−3 to −1 and +1, respectively), as visualized by WebLogo 3 (basic aa in green; Crooks et al., 2004). (B) Database screening results with consensus K-[RAGS]-[RKQ]-A-P-[PLAS]-P-P via ScanProsite (de Castro et al., 2006) selected for vertebrate sequences. (C) Scheme of the domain structure of ankycorbin and schematic representation of deletion mutants. N-Ank module with N terminal amphipathic helix and seven suggested ankyrin repeats are in shades of purple, KRKAPPPP motif is in red, and green represents ankycorbin segments with coiled-coil prediction. In addition, a structural representative of the seven ankyrin repeats is shown. (D) Anti-GFP immunoblotting analysis of coprecipitation experiments with ankycorbin and mutants thereof depicted in C and immobilized syndapin I (SdpI) SH3 domain. For supernatants and further specificity controls with immobilized GST, see Fig. S1. (E) Alignment showing that the verified syndapin I binding site of ankycorbin (red, bold, underlined) is highly conserved throughout evolution (mouse, Q3EP71-1; rat, Q5U312-1; human, Q9P0K7-1; [black] flying fox [black fruit bat], XP_015449448.1; wild yak, L8J220; chicken, E1C6R7; zebrafish, A9JT26; [green] sea turtle, XP_037758560.1; frog (Xenopus laevis), A8WGG4). Blue residues highlight lack of full conservation. Additionally depicted are the KRKAPPPP deletion mutant (∆271–281; ∆KRKAPPPP) and the X2 splice isoform of ankycorbin (mouse, NP_001343463.1, human, Q9P0K7-4). Blue residues in the ∆KRKAPPPP mutant mark mutated residues. For further information and characterization, see Fig. S1. (F) Coomassie-stained gels (left, center) and immunoblotting analysis (right) of reconstitutions of complex formation between immobilized GST-syndapin I but not a GST-syndapin IP434L mutant (GST-SdpImut.) with purified TrxHis-tagged ankycorbin1-400 proving a direct interaction. Green arrowheads, TrxHis-ankycorbin1-400, and a proteolytic fragment thereof; red arrowhead marks the positions of GST-syndapin I and GST-syndapin IP434L. Gray arrowheads at the left, negative controls TrxHis (light gray, in left panel (input), 19 kD) and GST (dark gray, in middle panel (eluates), 27 kD), respectively. Source data are available for this figure: SourceData F1.
Ankycorbin belongs to a superfamily of membrane shapers completely different from the BAR domain superfamily (Wolf et al., 2019). Coprecipitation experiments clearly confirmed a specific interaction with the SH3 domain of syndapin I in vitro, and deletion studies demonstrated that indeed the suggested motif, which is highly conserved in ankycorbin and is located in the hinge region between N-Ank module and coiled-coil domain, is critical for the interaction (Fig. 1, C–E; and Fig. S1, A and B). Interestingly, a splice isoform (ankycorbin X2) was predicted to exist in a variety of species and supposed to lack the identified syndapin I binding motif (Fig. 1 E and Fig. S1 C). This ankycorbin splice isoform was indeed expressed at low levels in most tissues tested, as proven by RT-PCR, cloning, and sequencing using both mouse and human cDNAs (mouse, Fig. S1 D). The shorter X2 splice variant of ankycorbin did not bind to the syndapin I SH3 domain (Fig. S1 E). Interestingly, the gall bladder and the brain almost exclusively expressed the syndapin I binding-competent, complete version of ankycorbin (Fig. S1 D). This suggested a particular importance of ankycorbin/syndapin complex formations in the brain.
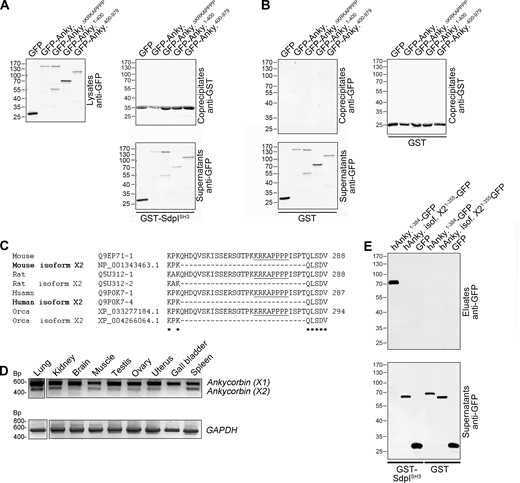
The syndapin I SH3 domain coprecipitates ankycorbin but not a splice variant thereof that occurs in both mice and man, yet shows particularly low expression in gall bladder and brain. (A) Supplementary data related to the coprecipitation analyses with immobilized GST-syndapin I SH3 domain (GST-SdpISH3; Fig. 1 D) showing the anti-GFP immunoblotting of supernatants (lysates are repeated for comparison) and the anti-GST immunoblotting of the immobilized proteins in the eluates. (B) Specificity controls related to the coprecipitations shown in Fig. 1 D (immobilized GST instead of GST-syndapin I SH3 domain). (C) Alignment of ankycorbin (X1 isoforms; a isoforms) of several exemplary species with the respective predicted X2 (b) isoforms lacking an exon encoding for a region containing the syndapin I–binding KRKAPPPP motif (underlined). Conserved residues are marked (*). Ankycorbin X2 splice isoforms experimentally demonstrated to exist by cloning and sequencing from cDNA from different sources are in bold. (D) RT-PCR analysis of different (adult) murine tissues for the expression of the ankycorbin X1 (a) isoform (upper, strong band) and the ankycorbin X2 (b) isoform (lower band) sequences. GAPDH is shown as control. Note that ankycorbin X2 is a widely expressed variant of low abundance and is particularly hard to detect in brain and gall bladder. The identity of both RT-PCR bands (ankycorbin X1 and ankycorbin X2) was confirmed by cloning and sequencing of the RT-PCR products. (E) Coprecipitation experiments show that, in contrast to human ankycorbin (X1), the human ankycorbin X2 isoform does not bind to immobilized GST-syndapin I SH3 domain (GST-SdpISH3). Source data are available for this figure: SourceData FS1.
The syndapin I SH3 domain coprecipitates ankycorbin but not a splice variant thereof that occurs in both mice and man, yet shows particularly low expression in gall bladder and brain. (A) Supplementary data related to the coprecipitation analyses with immobilized GST-syndapin I SH3 domain (GST-SdpISH3; Fig. 1 D) showing the anti-GFP immunoblotting of supernatants (lysates are repeated for comparison) and the anti-GST immunoblotting of the immobilized proteins in the eluates. (B) Specificity controls related to the coprecipitations shown in Fig. 1 D (immobilized GST instead of GST-syndapin I SH3 domain). (C) Alignment of ankycorbin (X1 isoforms; a isoforms) of several exemplary species with the respective predicted X2 (b) isoforms lacking an exon encoding for a region containing the syndapin I–binding KRKAPPPP motif (underlined). Conserved residues are marked (*). Ankycorbin X2 splice isoforms experimentally demonstrated to exist by cloning and sequencing from cDNA from different sources are in bold. (D) RT-PCR analysis of different (adult) murine tissues for the expression of the ankycorbin X1 (a) isoform (upper, strong band) and the ankycorbin X2 (b) isoform (lower band) sequences. GAPDH is shown as control. Note that ankycorbin X2 is a widely expressed variant of low abundance and is particularly hard to detect in brain and gall bladder. The identity of both RT-PCR bands (ankycorbin X1 and ankycorbin X2) was confirmed by cloning and sequencing of the RT-PCR products. (E) Coprecipitation experiments show that, in contrast to human ankycorbin (X1), the human ankycorbin X2 isoform does not bind to immobilized GST-syndapin I SH3 domain (GST-SdpISH3). Source data are available for this figure: SourceData FS1.
Reconstitutions with purified proteins proved that the identified ankycorbin/syndapin I interaction also occurred in the syndapin I full-length context, critically involved the SH3 domain of syndapin I, and was direct, as demonstrated by the specific detection of TrxHis-ankycorbin1-400 in the eluates from immobilized GST-syndapin I but not in those from a mutated GST-syndapin I (SdpImut) carrying a P434L mutation rendering the SH3 domain inactive (Qualmann et al., 1999; Fig. 1 F).
Ankycorbin associates with syndapin I in vivo
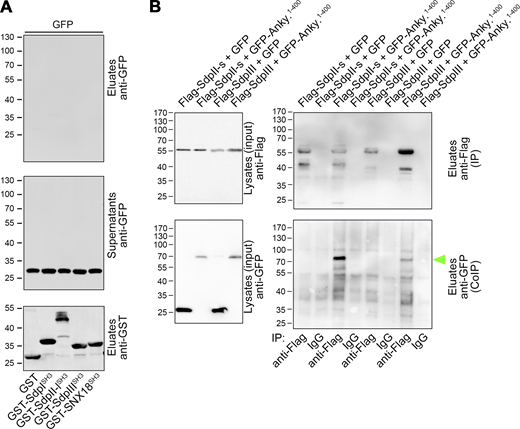
In order to address the in vivo relevance of the identified syndapin I interaction with ankycorbin, we next conducted coimmunoprecipitations. Flag-tagged syndapin I specifically coimmunoprecipitated GFP-ankycorbin1-400 (Fig. 2 A). Experiments with a syndapin I deletion mutant lacking the SH3 domain clearly demonstrated a critical role of this domain for the in vivo interaction of both overexpressed proteins (Fig. 2 A).
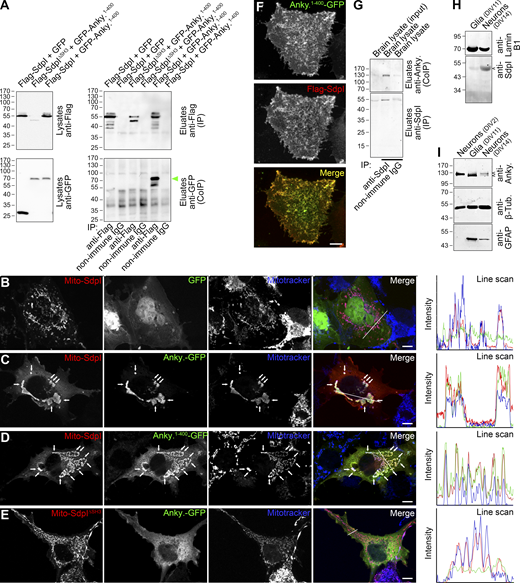
Ankycorbin associates with syndapin I in vivo. (A) Coimmunoprecipitation analyses of Flag-syndapin I (Flag-SdpI) and GFP-ankycorbin1-400 (GFP-Anky.1-400) complexes. Note that syndapin I specifically coimmunoprecipitated ankycorbin1-400 (green arrowhead), whereas syndapin I lacking the SH3 domain (SdpI∆SH3) did not. (B–E) Maximum intensity projections (MIPs) of subcellular recruitments of ankycorbin-GFP (C) and ankycorbin1-400-GFP (D) to mitochondrial membranes of COS-7 cells decorated with syndapin I (Mito-SdpI) as well as MIPs of corresponding control experiments with GFP (B) and with a mitochondrially targeted mutant of syndapin I lacking the SH3 domain (Mito-SdpI∆SH3; E), respectively. Arrows mark examples of colocalization at mitochondrial membranes. Bars, 10 µm. Line scans show all three channels along white line depicted in the merged image. Note the excellent overlap of the Anky.-GFP and Anky.1-400-GFP signals with Mito-SdpI and Mitotracker in intracellular recruitments shown in C and D, whereas controls do not show any overlap of the green channel (B and E). (F) Colocalization of ankycorbin1-400-GFP and Flag-syndapin I in HeLa cells. Bar, 10 µm. Pearson correlation coefficient, 0.9106. (G) Immunoblotting analyses of a specific coimmunoprecipitation of ankycorbin with syndapin I by anti-syndapin I antibodies from mouse (P0) brain lysate. (H and I) Immunoblotting analyses of primary neuronal cultures (DIV2 and DIV14, respectively) and of cultures of glia cells (DIV11) prepared from E18 rats. Note the presence of syndapin I in neurons and that ankycorbin occurs in two variants, of which the smaller variant is predomiantly expressed in glia cells and the longer one in neurons. Small arrowheads mark the positions of the respective proteins. Source data are available for this figure: SourceData F2.
Ankycorbin associates with syndapin I in vivo. (A) Coimmunoprecipitation analyses of Flag-syndapin I (Flag-SdpI) and GFP-ankycorbin1-400 (GFP-Anky.1-400) complexes. Note that syndapin I specifically coimmunoprecipitated ankycorbin1-400 (green arrowhead), whereas syndapin I lacking the SH3 domain (SdpI∆SH3) did not. (B–E) Maximum intensity projections (MIPs) of subcellular recruitments of ankycorbin-GFP (C) and ankycorbin1-400-GFP (D) to mitochondrial membranes of COS-7 cells decorated with syndapin I (Mito-SdpI) as well as MIPs of corresponding control experiments with GFP (B) and with a mitochondrially targeted mutant of syndapin I lacking the SH3 domain (Mito-SdpI∆SH3; E), respectively. Arrows mark examples of colocalization at mitochondrial membranes. Bars, 10 µm. Line scans show all three channels along white line depicted in the merged image. Note the excellent overlap of the Anky.-GFP and Anky.1-400-GFP signals with Mito-SdpI and Mitotracker in intracellular recruitments shown in C and D, whereas controls do not show any overlap of the green channel (B and E). (F) Colocalization of ankycorbin1-400-GFP and Flag-syndapin I in HeLa cells. Bar, 10 µm. Pearson correlation coefficient, 0.9106. (G) Immunoblotting analyses of a specific coimmunoprecipitation of ankycorbin with syndapin I by anti-syndapin I antibodies from mouse (P0) brain lysate. (H and I) Immunoblotting analyses of primary neuronal cultures (DIV2 and DIV14, respectively) and of cultures of glia cells (DIV11) prepared from E18 rats. Note the presence of syndapin I in neurons and that ankycorbin occurs in two variants, of which the smaller variant is predomiantly expressed in glia cells and the longer one in neurons. Small arrowheads mark the positions of the respective proteins. Source data are available for this figure: SourceData F2.
Subcellular recruitment assays with mitochondrially anchored syndapin I (Kessels and Qualmann, 2002) clearly proved that syndapin I/ankycorbin complexes are formed in living cells, as both ankycorbin-GFP and ankycorbin1-400-GFP were specifically recruited to syndapin I–decorated mitochondria. When the syndapin I SH3 domain was deleted from the mitochondrially targeted syndapin I (Mito-SdpI∆SH3), ankycorbin-GFP showed its normal subcellular distribution, i.e., was located at the plasma membrane and throughout the cytosol but not at mitochondria. These results clearly visualized the formation of syndapin I/ankycorbin complexes in intact cells and demonstrated that it was syndapin I SH3 domain-dependent (Fig. 2, B–E).
In line with these results, ankycorbin1-400-GFP and Flag-syndapin I colocalized well at the plasma membrane in HeLa cells (Fig. 2 F).
Specific coimmunoprecipitations of endogenous ankycorbin from lysates of brains of postnatal day 0 (P0) mice with syndapin I demonstrated that the interaction of syndapin I with ankycorbin does occur between endogenous syndapin I and ankycorbin in the developing brain (Fig. 2 G). Interestingly, neurons expressed syndapin I and ankycorbin, whereas only a smaller variant of ankycorbin was detected in glia cell cultures (Fig. 2, H and I).
Ankycorbin and syndapin I interact at liposome membrane surfaces
Syndapin I and ankycorbin both are membrane shapers. The direct membrane-binding and membrane-inserting abilities of both proteins (Wolf et al., 2019; Itoh et al., 2005; Dharmalingam et al., 2009; Wang et al., 2009; Rao et al., 2010; Bai et al., 2012) were reflected by the fact that both purified ankycorbin1-400 as well as syndapin I associated with liposomes, even at increasing salt concentrations suitable for suppressing modest, merely electrostatic membrane associations (Fig. 3, A and B). In combinatory experiments, the membrane association of syndapin I and ankycorbin was not negatively influenced by the respective binding partner (Fig. 3 C).
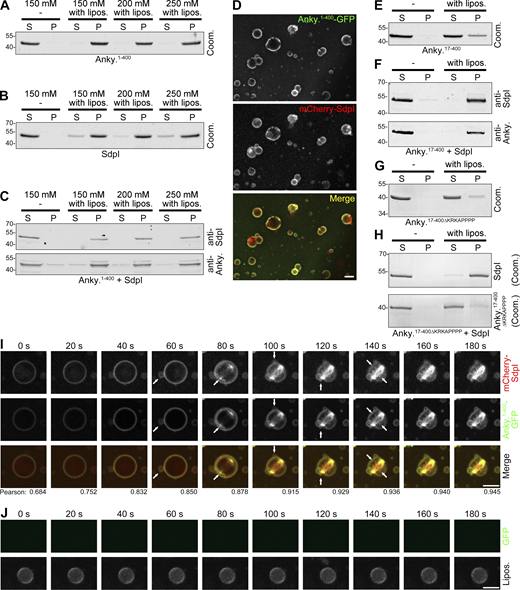
Ankycorbin and syndapin I associate at liposome membrane surfaces. (A–C) Ankycorbin and syndapin I analyzed individually (A and B) and in combination (C) in liposome binding assays and extraction attempts using increasing salt concentrations (150, 200, 250 mM NaCl) evaluated by Coomassie staining of SDS-PAGE gels (A and B) and by immunoblotting (C). S, supernatant; P, pellet. (D) Colocalization of purified mCherry-syndapin I and ankycorbin1-400-GFP at liposome surfaces. Bar, 5 µm. (E–H) Liposome binding assays with ankycorbin17-400 alone (E) and ankycorbin17-400∆KRKAPPPP (G) alone as well as each in combination with syndapin I (F and H). Note that whereas ankycorbin17-400 is unable to effectively bind to liposomes (E), syndapin I recruits it to membranes in a KRKAPPPP-dependent manner (F and H). (For experiments corresponding to E and F demonstrating resistance to salt extraction upon syndapin I presence, see Fig. S2.) Shown are Coomassie staining of individual proteins (E and G) and immunoblottings in the combination of ankycorbin17-400 and syndapin I (F), whereas the combination with the mutant ankycorbin17-400∆KRKAPPPP had to be shown by Coomassie staining (H) as the anti-ankycorbin antibody epitope is lacking in the mutant. (I and J) MIPs of live 3D spinning-disc microscopy of reconstitutions with liposomes and purified, recombinant ankycorbin1-400-GFP and mCherry-syndapin I (I) and of control experiments with GFP (not recruited to Cy5-phosphatidylethanolamine-marked liposomes; J). Arrows in I mark newly appearing, strongly curved membrane structures. Numbers added beneath each frame in I represent Pearson correlation coefficients. Bars, 5 µm. Source data are available for this figure: SourceData F3.
Ankycorbin and syndapin I associate at liposome membrane surfaces. (A–C) Ankycorbin and syndapin I analyzed individually (A and B) and in combination (C) in liposome binding assays and extraction attempts using increasing salt concentrations (150, 200, 250 mM NaCl) evaluated by Coomassie staining of SDS-PAGE gels (A and B) and by immunoblotting (C). S, supernatant; P, pellet. (D) Colocalization of purified mCherry-syndapin I and ankycorbin1-400-GFP at liposome surfaces. Bar, 5 µm. (E–H) Liposome binding assays with ankycorbin17-400 alone (E) and ankycorbin17-400∆KRKAPPPP (G) alone as well as each in combination with syndapin I (F and H). Note that whereas ankycorbin17-400 is unable to effectively bind to liposomes (E), syndapin I recruits it to membranes in a KRKAPPPP-dependent manner (F and H). (For experiments corresponding to E and F demonstrating resistance to salt extraction upon syndapin I presence, see Fig. S2.) Shown are Coomassie staining of individual proteins (E and G) and immunoblottings in the combination of ankycorbin17-400 and syndapin I (F), whereas the combination with the mutant ankycorbin17-400∆KRKAPPPP had to be shown by Coomassie staining (H) as the anti-ankycorbin antibody epitope is lacking in the mutant. (I and J) MIPs of live 3D spinning-disc microscopy of reconstitutions with liposomes and purified, recombinant ankycorbin1-400-GFP and mCherry-syndapin I (I) and of control experiments with GFP (not recruited to Cy5-phosphatidylethanolamine-marked liposomes; J). Arrows in I mark newly appearing, strongly curved membrane structures. Numbers added beneath each frame in I represent Pearson correlation coefficients. Bars, 5 µm. Source data are available for this figure: SourceData F3.
To address whether ankycorbin and syndapin I may associate with distinct liposomes or rather form complexes at individual liposomes, we conducted microscopical experiments. Ankycorbin and syndapin I clearly were not segregated into distinct liposomes irrespective of the size and thus the curvature of liposomes. Instead, they were present together at all liposomes (Fig. 3 D). Ankycorbin1-400 and syndapin I hereby also largely colocalized with each other and usually continuously outlined the membranes (Fig. 3 D).
Deletion of the N terminal amphipathic helix critical for membrane insertion (Wolf et al., 2019) demonstrated that membrane-bound syndapin I can effectively recruit and tightly hold ankycorbin. Ankycorbin17-400, as described earlier (Wolf et al., 2019), was only weakly bound to membranes (Fig. 3 E). Yet, when syndapin I was present, ankycorbin17-400 predominantly coprecipitated with liposomes (Fig. 3 F). Even salt extractions, which lead to a significant loss of ankycorbin17-400 from membranes, did not disrupt syndapin I/ankycorbin17-400 complexes (Fig. S2). In contrast to ankycorbin17-400, the syndapin-I-binding-deficient mutant ankycorbin17-400∆KRKAPPPP, which lacks the anti-ankycorbin epitope and therefore had to be detected by Coomassie staining, was found in the supernatant irrespective of a presence of membrane-associated syndapin I (Fig. 3, G and H). Together, these experiments showed that syndapin I and ankycorbin interact at membrane surfaces and that syndapin I is able to recruit ankycorbin in a KRKAPPPP motif-mediated manner to membrane surfaces and to hold it there tightly.
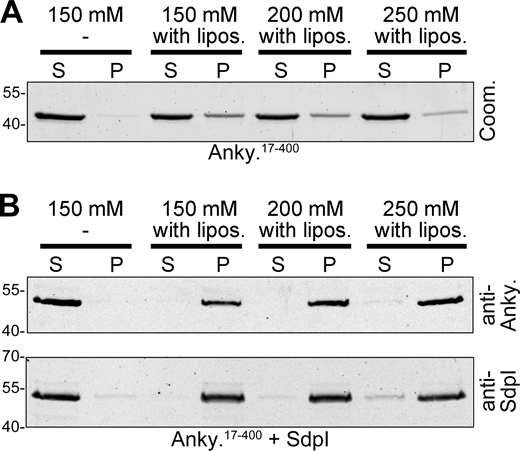
Salt-insensitive binding of ankycorbin17-400to liposomes when syndapin I is present. (A) Liposome binding assays and extraction attempts of ankycorbin17-400 by increasing salt concentrations (150, 200, 250 mM NaCl) analyzed by Coomassie staining of SDS-PAGE gels (corresponding to Fig. 3 E). (B) Similar experiments with presence of syndapin I detected by immunoblotting (corresponding to Fig. 3 F). S, supernatant; P, pellet. Note that syndapin I is able to recruit and salt-insensitively hold ankycorbin17-400 at liposomes. Source data are available for this figure: SourceData FS2.
Salt-insensitive binding of ankycorbin17-400to liposomes when syndapin I is present. (A) Liposome binding assays and extraction attempts of ankycorbin17-400 by increasing salt concentrations (150, 200, 250 mM NaCl) analyzed by Coomassie staining of SDS-PAGE gels (corresponding to Fig. 3 E). (B) Similar experiments with presence of syndapin I detected by immunoblotting (corresponding to Fig. 3 F). S, supernatant; P, pellet. Note that syndapin I is able to recruit and salt-insensitively hold ankycorbin17-400 at liposomes. Source data are available for this figure: SourceData FS2.
In line with this, spinning-disc microscopy 3D live analyses of purified ankycorbin1-400-GFP and mCherry-syndapin I added to liposomes showed that both proteins were rapidly recruited to liposomes (Fig. 3 I). Ankycorbin1-400 and syndapin I hereby displayed an ability to convert regularly shaped, large liposomes into composites of smaller membrane structures, whereas the shape of liposomes without the proteins added remained unchanged (Fig. 3, I and J). At the liposome surfaces, ankycorbin1-400 and syndapin I did not show any transient spatial segregations but instead displayed a usually very good and continuous spatial overlap, as also determined by Pearson correlation coefficients, suggesting tight cooperation of both distinct membrane shapers during dynamic membrane rearrangements (Fig. 3 I).
Ankycorbin/syndapin I complexes cause alterations in membrane topology different from those of ankycorbin or syndapin I alone
We next examined the membrane-shaping functions of syndapin I and ankycorbin alone and in combination with each other (Fig. 4, A–J; and Fig. S3). Transmission EM (TEM) examinations of freeze-fractured liposomes showed that incubations with both ankycorbin and syndapin I individually gave rise to smaller liposomes than those observed in control (buffer) incubations (Fig. 4, A–C). Similar results were obtained by cryoTEM (Fig. S3, A–C).

Ankycorbin/syndapin I complexes cause alterations in membrane topology different from those of ankycorbin or syndapin I alone. (A–F) TEM images of freeze-fractured, platinum- and carbon-shadowed liposomes that were incubated with the indicated proteins and protein combinations or with merely buffer (control) for 30 min. Large (above mean of control; *) and very large (**) liposomes are marked along with examples for (very) small liposomes (≤200 nm; arrows). Bars, 250 nm. (G) Quantitative analyses of liposome diameters in TEM images recorded by systematic screening. Data, mean ± SEM, and individual data points. n numbers, control, 1,811 liposomes (173 images from nine independent assays); ankycorbin1-400 (5 µg), 3,151 liposomes (172 images from nine independent assays); syndapin I (5 µg), 518 liposomes (55 images from three independent assays); syndapin I (5 µg) + ankycorbin1-400 (1 µg), 844 liposomes (45 images from three independent assays); syndapin IΔSH3 (5 µg), 2,649 liposomes (170 images from nine independent assays) and syndapin IΔSH3 (5 µg) + ankycorbin1-400 (1 µg), 751 liposomes (99 images from nine independent assays). (H and I) TEM images of examples of tubule formation in liposome incubations with syndapin I (H) and syndapin IΔSH3 (I). Freeze-fractured tubules are highlighted with magenta lines. Bars, 250 nm. (J) Quantitative determinations of tubule densities in the freeze-fracture/TEM analyses. n numbers 45–172 images, as described above. Data, mean ± SEM, and individual data points. (K) Model showing a membrane tubule decorated by a regular array of syndapin I and of a liposome decorated with syndapin I dimers and ankycorbin1-400 in different orientations. Depicted is a simplified view of F-BAR–mediated syndapin I dimers with their concave membrane-binding interface. Note that the tilde shape (top view) of syndapin I, the SH3 domains attached to the tips of the depicted structure via a presumably unstructured linker as well as syndapin I’s little hydrophobic wedges for membrane insertion were omitted for clarity. Statistical analysis, Kruskal–Wallis + Dunn’s Multiple Comparison test (G and J). *, P < 0.05; **, P < 0.01; ****, P < 0.0001 with exact P values for * and ** reported in the figure.
Ankycorbin/syndapin I complexes cause alterations in membrane topology different from those of ankycorbin or syndapin I alone. (A–F) TEM images of freeze-fractured, platinum- and carbon-shadowed liposomes that were incubated with the indicated proteins and protein combinations or with merely buffer (control) for 30 min. Large (above mean of control; *) and very large (**) liposomes are marked along with examples for (very) small liposomes (≤200 nm; arrows). Bars, 250 nm. (G) Quantitative analyses of liposome diameters in TEM images recorded by systematic screening. Data, mean ± SEM, and individual data points. n numbers, control, 1,811 liposomes (173 images from nine independent assays); ankycorbin1-400 (5 µg), 3,151 liposomes (172 images from nine independent assays); syndapin I (5 µg), 518 liposomes (55 images from three independent assays); syndapin I (5 µg) + ankycorbin1-400 (1 µg), 844 liposomes (45 images from three independent assays); syndapin IΔSH3 (5 µg), 2,649 liposomes (170 images from nine independent assays) and syndapin IΔSH3 (5 µg) + ankycorbin1-400 (1 µg), 751 liposomes (99 images from nine independent assays). (H and I) TEM images of examples of tubule formation in liposome incubations with syndapin I (H) and syndapin IΔSH3 (I). Freeze-fractured tubules are highlighted with magenta lines. Bars, 250 nm. (J) Quantitative determinations of tubule densities in the freeze-fracture/TEM analyses. n numbers 45–172 images, as described above. Data, mean ± SEM, and individual data points. (K) Model showing a membrane tubule decorated by a regular array of syndapin I and of a liposome decorated with syndapin I dimers and ankycorbin1-400 in different orientations. Depicted is a simplified view of F-BAR–mediated syndapin I dimers with their concave membrane-binding interface. Note that the tilde shape (top view) of syndapin I, the SH3 domains attached to the tips of the depicted structure via a presumably unstructured linker as well as syndapin I’s little hydrophobic wedges for membrane insertion were omitted for clarity. Statistical analysis, Kruskal–Wallis + Dunn’s Multiple Comparison test (G and J). *, P < 0.05; **, P < 0.01; ****, P < 0.0001 with exact P values for * and ** reported in the figure.

Examinations of membrane structures in incubations of liposomes and purified proteins using freeze-fracturing and TEM as well as cryoTEM. (A–D) CryoTEM images of liposomes incubated with either merely buffer (A; control), 5 µg ankycorbin1-400 (B; Anky.1-400 (5 µg)), 5 µg syndapin I (C; SdpI (5 µg)), and 5 µg syndapin I with 1 µg ankycorbin1-400 (D; SdpI (5 µg) + Anky.1-400 (1 µg)), respectively. Membrane tubules formed upon incubation with syndapin I are marked by magenta lines. Bars, 200 nm. (E) Quantitation of the diameter of membrane tubules formed by syndapin I, as visualized by cryoTEM. Data, mean ± SEM, and individual data points. n = 41 tubules. (F) Quantitative analyses of the diameters of membrane tubules observed in TEM analyses of freeze-fractured, platinum- and carbon-shadowed liposomes that were incubated with merely buffer (control) or with the indicated proteins and protein combinations. Data, mean ± SEM, and individual data points. n = 13–157 tubules obtained by complete screening of all 45–172 images recorded. Ankycorbin1-400 (5 µg), 97 tubules (172 images from nine independent assays); syndapin I (5 µg), 39 tubules (55 images from three independent assays); syndapin I (5 µg) + ankycorbin1-400 (1 µg), 13 tubules (45 images from three independent assays); syndapin IΔSH3 (5 µg), 157 tubules (170 images from nine independent assays), and syndapin IΔSH3 (5 µg) + ankycorbin1-400 (1 µg), 33 tubules (99 images from nine independent assays). Statistical analysis, Kruskal–Wallis + Dunn’s Multiple Comparison test (F). *, P < 0.05. Exact P value for * is reported directly in the figure.
Examinations of membrane structures in incubations of liposomes and purified proteins using freeze-fracturing and TEM as well as cryoTEM. (A–D) CryoTEM images of liposomes incubated with either merely buffer (A; control), 5 µg ankycorbin1-400 (B; Anky.1-400 (5 µg)), 5 µg syndapin I (C; SdpI (5 µg)), and 5 µg syndapin I with 1 µg ankycorbin1-400 (D; SdpI (5 µg) + Anky.1-400 (1 µg)), respectively. Membrane tubules formed upon incubation with syndapin I are marked by magenta lines. Bars, 200 nm. (E) Quantitation of the diameter of membrane tubules formed by syndapin I, as visualized by cryoTEM. Data, mean ± SEM, and individual data points. n = 41 tubules. (F) Quantitative analyses of the diameters of membrane tubules observed in TEM analyses of freeze-fractured, platinum- and carbon-shadowed liposomes that were incubated with merely buffer (control) or with the indicated proteins and protein combinations. Data, mean ± SEM, and individual data points. n = 13–157 tubules obtained by complete screening of all 45–172 images recorded. Ankycorbin1-400 (5 µg), 97 tubules (172 images from nine independent assays); syndapin I (5 µg), 39 tubules (55 images from three independent assays); syndapin I (5 µg) + ankycorbin1-400 (1 µg), 13 tubules (45 images from three independent assays); syndapin IΔSH3 (5 µg), 157 tubules (170 images from nine independent assays), and syndapin IΔSH3 (5 µg) + ankycorbin1-400 (1 µg), 33 tubules (99 images from nine independent assays). Statistical analysis, Kruskal–Wallis + Dunn’s Multiple Comparison test (F). *, P < 0.05. Exact P value for * is reported directly in the figure.
Quantitative EM analyses demonstrated that ankycorbin1-400 displayed the strongest membrane-shaping effects. The average liposome diameter in incubations with ankycorbin1-400 was only about 200 nm compared with about 370 nm in control incubations (Fig. 4, A, B, and G). These ankycorbin1-400 data were in line with the effects observed with only the N terminal N-Ank domain (ankycorbin1-252; Wolf et al., 2019).
Incubation with syndapin I also clearly resulted in smaller liposomes. Syndapin I gave rise to liposomes with an average diameter of about 290 nm, a value that also was clearly statistically different from control liposome diameters (Fig. 4, C and G; **P = 0.0058). These reconstitutions clearly showed the direct membrane-shaping function of syndapin I.
The freeze-fracturing-immanent focus on proper bilayered membrane structures, which were rapidly cryopreserved in solution, thereby yielded diameters different from the uniform particles of 31 and 34 nm diameter described in EM analyses of negative-stained dried membrane material and syndapin I or an F-BAR domain fragment thereof (Wang et al., 2009; Goh et al., 2012). CryoTEM of liposomes incubated with syndapin I showed non-uniform liposome sizes. Many liposomes had diameters around 200–300 nm, but larger and smaller ones were also present (Fig. S3 C).
A syndapin I deletion mutant lacking the SH3 domain (syndapin IΔSH3) showed similar, albeit minimally stronger membrane-shaping abilities when compared with full-length syndapin I, which may be an effect of improved F-BAR functions when the SH3 domain was not disturbing (autoinhibition release). In line, dotation of the syndapin I reaction (5 µg) with 1 µg of its SH3 domain interaction partner ankycorbin1-400 resulted in liposome curvatures that also were smaller than the syndapin I–generated curvatures and resembled those obtained by syndapin IΔSH3, whereas addition of a small amount of ankycorbin1-400 to syndapin IΔSH3 had no effect (Fig. 4, D–G).
We did not observe any reciprocal disturbances in membrane association of syndapin I and ankycorbin (Fig. 3). If both proteins associate with the membrane, this would, however, mean that ankycorbin molecules would be inserted into membrane-bound syndapin I lattices. In cases of regular syndapin I lattices, such an insertion of ankycorbin may lead to distortions and may thereby affect the curvatures of such regularly aligned syndapin I arrays. This hypothesis can be tested experimentally (Fig. 4, H–J; and Fig. S3). Syndapin I is able to self-associate (Kessels and Qualmann, 2006) and was proposed to form tip-to-tip and laterally aligned regular protein arrays at membrane surface and to thereby promote the formation of membrane tubules reflecting the intrinsic curvature of syndapin I proteins and their arrangements (Wang et al., 2009). Syndapin I indeed induced the formation of freeze-fracturable tubular membrane structures (Fig. 4 J). CryoTEM confirmed that syndapin I indeed induced membrane tubules (Fig. S3, A–D).
Quantitative analyses yielded an average tubule diameter of 82 nm in cryoTEM analyses of syndapin I–incubated liposomes (Fig. S3 E). TEM of freeze-fractured and Pt-coated (2 nm) syndapin I–incubated liposomes yielded an average membrane tubule diameter of 84 nm (Fig. S3 F). The syndapin I–induced curvature of the tubules thus was very accurately determinable by both EM methods. The observed membrane tubule diameters in both cases also were very uniform. This suggested that very regular and spatially defined arrays of the membrane-shaping protein syndapin I mediate the formation of these membrane tubules (Fig. 4 K).
In line with membrane shaping and self-association being mediated by the syndapin I F-BAR domain, also using the deletion mutant syndapin IΔSH3, which mostly represents the F-BAR domain of syndapin I, led to lipid tubules (Fig. 4 I). Membrane tubules formed by syndapin IΔSH3 also had a diameter of about 85 nm (Fig. S3 F).
EM images of freeze-fractured ankycorbin1-400-incubated liposomes rather rarely showed tubules. The tubule density was merely 0.04/µm2 compared with about 2.5/µm2 for syndapin I and the vast majority of the ankycorbin data were thus represented by zero-profiles (Fig. 4 J).
Strikingly, syndapin I–incubated liposomes, dotated with some minor amounts (one-fifth) of ankycorbin1-400, also did not show considerable tubule formation. In contrast to data for syndapin I alone, the mixture of syndapin I and ankycorbin1-400 was predominantly represented by zero-profiles (Fig. 4 J). Thus, the potent membrane shaper ankycorbin did not further increase the unidirectional curvature found in membrane tubules promoted by regularly aligned syndapin I molecules, but was instead actively disrupting this syndapin I–driven unidirectional membrane curvature induction process (Fig. 4 K).
Additional experiments with syndapin IΔSH3 yielded very similar results (Fig. 4, I and J). These results highlighted that, at least in in vitro reconstitutions, with their lack of competition with further membrane components and their high local protein concentration, physical linkage of syndapin I and ankycorbin was not required for ankycorbin’s ability to disrupt the membrane tubulation property of syndapin I, but that in principle already coexistence of the extended ankycorbin N-Ank modules and syndapin I at membranes was sufficient to modulate the membrane-tubulating properties of syndapin I (Fig. 4 K).
Syndapin I and ankycorbin coaccumulate at nascent dendritic branch sites
3D time-lapse analyses in primary hippocampal neurons undergoing dendritic arbor formation using spinning-disc microscopy showed that ankycorbin-GFP and mCherry-syndapin I colocalized at dendritic branch initiation sites during several 10-s frames prior to dendritic branch induction, whereas neighboring dendritic areas showed significantly less ankycorbin and syndapin I fluorescence (Fig. 5 A).

Syndapin I and ankycorbin accumulate at branch induction sites. (A) MIPs of high magnifications of individual frames of a 3D time-lapse recording of a dendritic segment of a DIV7 rat hippocampal neuron coexpressing ankycorbin-GFP (Anky.-GFP) and mCherry-syndapin I (mCherry-SdpI) and corresponding heat maps. Bar, 1 µm. Arrowheads, frames with colocalized accumulation of both ankycorbin and syndapin I. Asterisks mark tip of dendritic branch forming. (B) Quantitative analyses of maximum intensities of fluorescent ankycorbin and syndapin I as well as of control proteins (GFP and mCherry, respectively) at dendritic branch initiation sites prior to protrusion formation in relation to a control ROI at neighboring position at the same dendrite (shown as percent above the respective control ROI). (C) Temporal analyses of the maximal fluorescence intensities of ankycorbin-GFP and mCherry-syndapin I accumulating at dendritic branch induction sites prior to dendritic branch induction. Data, mean ± SEM. (D and E) Anti-ankycorbin, anti-syndapin I, and anti-MAP2 immunofluorescence labeling of the endogenous proteins in dendrites of primary hippocampal neurons DIV7. Two examples of high-power magnifications of dendritic segments with colocalization of ankycorbin and syndapin I are shown. Bars, 2 µm. Data, mean ± SEM, and individual data points (B) and mean ± SEM (C). n numbers as indicated in the figure. Statistical analysis, Kruskal–Wallis + Dunn’s Multiple Comparison test. ****, P < 0.0001.
Syndapin I and ankycorbin accumulate at branch induction sites. (A) MIPs of high magnifications of individual frames of a 3D time-lapse recording of a dendritic segment of a DIV7 rat hippocampal neuron coexpressing ankycorbin-GFP (Anky.-GFP) and mCherry-syndapin I (mCherry-SdpI) and corresponding heat maps. Bar, 1 µm. Arrowheads, frames with colocalized accumulation of both ankycorbin and syndapin I. Asterisks mark tip of dendritic branch forming. (B) Quantitative analyses of maximum intensities of fluorescent ankycorbin and syndapin I as well as of control proteins (GFP and mCherry, respectively) at dendritic branch initiation sites prior to protrusion formation in relation to a control ROI at neighboring position at the same dendrite (shown as percent above the respective control ROI). (C) Temporal analyses of the maximal fluorescence intensities of ankycorbin-GFP and mCherry-syndapin I accumulating at dendritic branch induction sites prior to dendritic branch induction. Data, mean ± SEM. (D and E) Anti-ankycorbin, anti-syndapin I, and anti-MAP2 immunofluorescence labeling of the endogenous proteins in dendrites of primary hippocampal neurons DIV7. Two examples of high-power magnifications of dendritic segments with colocalization of ankycorbin and syndapin I are shown. Bars, 2 µm. Data, mean ± SEM, and individual data points (B) and mean ± SEM (C). n numbers as indicated in the figure. Statistical analysis, Kruskal–Wallis + Dunn’s Multiple Comparison test. ****, P < 0.0001.
Ratiometric measurements demonstrated that the accumulations of both proteins were in average about 50% above neighboring, non-branching sites (Fig. 5 B). The fluorescent tags alone did not show such an accumulation proving that the accumulation at dendritic branch sites is a specific syndapin I and ankycorbin function (Fig. 5 B). The maximal fluorescence of both ankycorbin and syndapin I at dendritic branch induction sites was thereby reached about 30–40 s prior to dendritic branch induction (Fig. 5 C).
Immunolabeling analyses showed that, in line with the live recordings, also endogenous ankycorbin and syndapin I colocalized at discrete sites along dendrites of developing hippocampal neurons that morphologically may represent nascent dendritic branch sites (Fig. 5, D and E).
Syndapin I–mediated dendritic arborization is partially suppressed by a lack of ankycorbin
Non-tubular but multidimensional membrane topologies that often reflect curvatures with diameters higher than the syndapin I–intrinsic protein curvature can be observed during dendritic branch induction. Both syndapin I and ankycorbin play some role in dendritic arborization of developing neurons (Dharmalingam et al., 2009; Wolf et al., 2019). To address whether these findings may reflect critical contributions of ankycorbin to syndapin I–mediated functions, we cotransfected syndapin I–overexpressing primary hippocampal neurons with GFP-reported ankycorbin RNAi and scrambled RNAi plasmids, respectively (Fig. 6, A–D). Interestingly, the significant surplus of dendritic branch points, terminal points, and total dendritic length caused by syndapin I gain-of-function were suppressed upon ankycorbin RNAi to the values found in control cells merely expressing scrambled RNAi alone or were even slightly lower, but did not reach the values of ankycorbin RNAi alone (Fig. 6, E–G). Also, Sholl examinations showed that ankycorbin RNAi caused a clear but partial suppression of syndapin I–mediated functions (Fig. 6 H).

Syndapin I–mediated dendritic arborization is impaired by a lack of ankycorbin. (A–D) MIPs of DIV6 anti-MAP2 immunostained primary hippocampal neurons transfected at DIV4 with (GFP-reported) scrambled RNAi (Scr. RNAi; A), ankycorbin RNAi (B), and with combinations of those together with Xpress-syndapin I (C and D), respectively. Bars, 10 µm. (E–H) Analyses of dendritic arbor complexity by quantitative determinations of dendritic branch points (E), dendritic terminal points (F), total dendritic length (G), and Sholl analyses (H). Data, mean ± SEM, and individual data points (E–G) and mean ± SEM (H) from biologically independent samples (neurons). n numbers of neurons (obtained from two to three independent coverslips each condition and assay; three independent neuronal preparations) as indicated in the figure. Statistical significances, one-way ANOVA/Tukey’s (E–G), two-way ANOVA/Bonferroni’s (H); *P < 0.05; **P < 0.01; ***P < 0.001; ****P < 0.0001. Except for the Sholl analysis (table in H), exact P values for *, **, and *** are reported directly in the figure.
Syndapin I–mediated dendritic arborization is impaired by a lack of ankycorbin. (A–D) MIPs of DIV6 anti-MAP2 immunostained primary hippocampal neurons transfected at DIV4 with (GFP-reported) scrambled RNAi (Scr. RNAi; A), ankycorbin RNAi (B), and with combinations of those together with Xpress-syndapin I (C and D), respectively. Bars, 10 µm. (E–H) Analyses of dendritic arbor complexity by quantitative determinations of dendritic branch points (E), dendritic terminal points (F), total dendritic length (G), and Sholl analyses (H). Data, mean ± SEM, and individual data points (E–G) and mean ± SEM (H) from biologically independent samples (neurons). n numbers of neurons (obtained from two to three independent coverslips each condition and assay; three independent neuronal preparations) as indicated in the figure. Statistical significances, one-way ANOVA/Tukey’s (E–G), two-way ANOVA/Bonferroni’s (H); *P < 0.05; **P < 0.01; ***P < 0.001; ****P < 0.0001. Except for the Sholl analysis (table in H), exact P values for *, **, and *** are reported directly in the figure.
Alternatively, the observed effects can also be viewed as an excess of syndapin I being able to partially restore dendritic arborization affected by ankycorbin loss-of-function. Both interpretations suggest that syndapin I and ankycorbin to a significant extent work together in the same cell biological function—the formation of a proper dendritic arbor in developing neurons.
Ankycorbin-mediated dendritic branching requires ankycorbin’s syndapin I–binding KRKAPPPP motif
The data obtained thus were in line with an important role of ankycorbin in syndapin I–mediated dendritic arborization. Yet, the observations indicated that syndapin I may additionally and/or alternatively also employ other effectors. It was therefore next important to address the functional importance of syndapin I/ankycorbin complex formation in a vice-versa manner, i.e., by analyzing ankycorbin-mediated dendritic arborization.
Ankycorbin’s functions in neuronal development depend on its membrane-binding N-Ank module and its self-association-mediating coiled-coil domain (Wolf et al., 2019). Ankycorbin gain-of-function experiments in developing neurons revealed that ankycorbin’s functions also depend on the KRKAPPPP motif, which we identified as a syndapin I binding site. All three main quantitative dendritic parameters, i.e., number of dendritic branch points, number of terminal points, and dendritic length, were significantly elevated in neurons transfected with ankycorbin (Fig. S4, A–C).

Ankycorbin-mediated dendritic branching requires the syndapin I–binding KRKAPPPP motif. (A–D) Analyses of dendritic arbor complexity by quantitative determinations of dendritic branch point number (A), dendritic terminal point number (B), total dendritic arbor length (C), and Sholl analyses (D). Data, mean ± SEM, and individual data points (A–C) and mean ± SEM (D) of biologically independent samples (neurons). n numbers of neurons (obtained from two independent neuronal preparations of primary hippocampal neurons) as indicated in the figure. Statistical significances, one-way ANOVA/Tukey’s (A–C); two-way ANOVA/Bonferroni’s (D); *P < 0.05; **P < 0.01; ***P < 0.001; ****P < 0.0001. Exact P values for *, **, and *** are reported directly in the figure.
Ankycorbin-mediated dendritic branching requires the syndapin I–binding KRKAPPPP motif. (A–D) Analyses of dendritic arbor complexity by quantitative determinations of dendritic branch point number (A), dendritic terminal point number (B), total dendritic arbor length (C), and Sholl analyses (D). Data, mean ± SEM, and individual data points (A–C) and mean ± SEM (D) of biologically independent samples (neurons). n numbers of neurons (obtained from two independent neuronal preparations of primary hippocampal neurons) as indicated in the figure. Statistical significances, one-way ANOVA/Tukey’s (A–C); two-way ANOVA/Bonferroni’s (D); *P < 0.05; **P < 0.01; ***P < 0.001; ****P < 0.0001. Exact P values for *, **, and *** are reported directly in the figure.
In contrast, in neurons expressing an ankycorbin mutant lacking the KRKAPPPP motif, all dendritic parameters were statistically different from ankycorbin gain-of-function neurons and similar to control values (Fig. S4, A–C). Sholl analyses showed that this lack of ankycorbin functions upon deletion of the KRKAPPPP motif was particularly severe in proximal areas (Fig. S4 D).
Ankycorbin loss-of-function leads to a reduced number of dendritic protrusion initiations, and rescue experiments unravel an importance of ankycorbin’s KRKAPPPP motif for dendritic arborization
Importantly and in line with the importance of the KRKAPPPP motif in the gain-of-function analyses (Fig. S4), an RNAi-insensitive ankycorbin mutant lacking the KRKAPPPP motif (ankycorbin*∆KRKAPPPP) failed to fully rescue the ankycorbin loss-of-function phenotypes in dendritic arborization (Fig. 7, A–H). In line with the literature (Wolf et al., 2019), ankycorbin RNAi led to reduced dendritic branch point numbers, reduced numbers of dendritic terminal points, and less extensive dendritic arbors. Yet, while reexpression of an RNAi-insensitive, wild-type ankycorbin (Anky.RNAi/Anky.*-GFP) was able to fully rescue all of these phenotypes and no differences to control cells were determined, reexpression of ankycorbin*∆KRKAPPPP failed to fully rescue any of the dendritic defects caused by ankycorbin RNAi (Fig. 7, E–H).

An RNAi-insensitive ankycorbin mutant lacking the KRKAPPPP motif fails to fully rescue the ankycorbin loss-of-function phenotypes in dendritic branching. (A–D) MIPs of DIV6 anti-MAP2 immunostained primary hippocampal neurons transfected at DIV4 with scrambled RNAi (A) and ankycorbin RNAi (C) and with combinations of ankycorbin RNAi and RNAi-insensitive ankycorbin-GFP (Anky. RNAi/Anky.*-GFP; B) and a KRKAPPPP motif deletion mutant thereof (Anky. RNAi/Anky.*∆KRKAPPPP-GFP; D), respectively. Bars, 20 µm. (E–H) Analyses of dendritic arbor complexity by quantitative determinations of dendritic branch points (E), dendritic terminal points (F), total dendritic length (G), and Sholl analyses (H). (I and J) Additional evaluations of the dendritic branch impairments caused by ankycorbin loss-of-function at DIV4+1 (I) and DIV2+1 (J) showing a fast onset of the phenotype and its occurrence already early in development. (K) Quantitation of dendritic branch induction events in dendritic segments of ankycorbin RNAi versus scrambled RNAi control cells, as recorded by 3D time-lapse analysis of DIV7 primary hippocampal neurons transfected at DIV6. Data, mean ± SEM, and individual data points (E–G and I–K) and mean ± SEM (H) from biologically independent samples (neurons). n numbers of neurons (obtained from two to five independent coverslips each assay; five (E–H) and two (I–K) independent neuronal preparations) as indicated in the figure. Statistical significances, one-way ANOVA/Tukey’s (E–G), two-way ANOVA/Bonferroni’s (H), Welch’s t test (I), Mann–Whitney (K), and Kruskal–Wallis + Dunn’s Multiple Comparison test (J; not statistically significant; #P < 0.05 and ##P < 0.01, individual comparisons by Mann–Whitney). *P < 0.05; **P < 0.01; ***P < 0.001; ****P < 0.0001. Except for the Sholl analysis (table in H), exact P values for * and *** as well as for # and ## are reported directly in the figure.
An RNAi-insensitive ankycorbin mutant lacking the KRKAPPPP motif fails to fully rescue the ankycorbin loss-of-function phenotypes in dendritic branching. (A–D) MIPs of DIV6 anti-MAP2 immunostained primary hippocampal neurons transfected at DIV4 with scrambled RNAi (A) and ankycorbin RNAi (C) and with combinations of ankycorbin RNAi and RNAi-insensitive ankycorbin-GFP (Anky. RNAi/Anky.*-GFP; B) and a KRKAPPPP motif deletion mutant thereof (Anky. RNAi/Anky.*∆KRKAPPPP-GFP; D), respectively. Bars, 20 µm. (E–H) Analyses of dendritic arbor complexity by quantitative determinations of dendritic branch points (E), dendritic terminal points (F), total dendritic length (G), and Sholl analyses (H). (I and J) Additional evaluations of the dendritic branch impairments caused by ankycorbin loss-of-function at DIV4+1 (I) and DIV2+1 (J) showing a fast onset of the phenotype and its occurrence already early in development. (K) Quantitation of dendritic branch induction events in dendritic segments of ankycorbin RNAi versus scrambled RNAi control cells, as recorded by 3D time-lapse analysis of DIV7 primary hippocampal neurons transfected at DIV6. Data, mean ± SEM, and individual data points (E–G and I–K) and mean ± SEM (H) from biologically independent samples (neurons). n numbers of neurons (obtained from two to five independent coverslips each assay; five (E–H) and two (I–K) independent neuronal preparations) as indicated in the figure. Statistical significances, one-way ANOVA/Tukey’s (E–G), two-way ANOVA/Bonferroni’s (H), Welch’s t test (I), Mann–Whitney (K), and Kruskal–Wallis + Dunn’s Multiple Comparison test (J; not statistically significant; #P < 0.05 and ##P < 0.01, individual comparisons by Mann–Whitney). *P < 0.05; **P < 0.01; ***P < 0.001; ****P < 0.0001. Except for the Sholl analysis (table in H), exact P values for * and *** as well as for # and ## are reported directly in the figure.
While dendritic branch and terminal points showed some partial rescue that was also reflected in the proximal areas of Sholl analyses, total dendritic arbor length and also peripheral Sholl intersections were even more strongly dependent on ankycorbin’s KRKAPPPP motif. Both of these parameters showed a clear and complete failure of rescue when compared with the effects of ankycorbin RNAi alone. Summarized, all dendritic parameters quantitatively determined in rescue attempts with ankycorbin*∆KRKAPPPP remained highly statistically different from those of control neurons and from neurons successfully rescued by reexpression of WT ankycorbin (Fig. 7, E–H).
These findings clearly demonstrated the importance of the KRKAPPPP motif for ankycorbin-mediated dendritic arborization.
Further experiments shed more detailed light on the ankycorbin loss-of-function phenotype. RNAi for only 1 d demonstrated a fast onset of the loss-of-function phenotype. At day in vitro (DIV) 4+2, the difference in dendritic branching in ankycorbin RNAi neurons in comparison to control neurons was almost 60% (Fig. 7 E). At DIV4+1, the loss of dendritic branching already was −40% (Fig. 7 I). The ankycorbin loss-of-function phenotype as well as the dependence on the KRKAPPPP motif was also independent of the exact developmental stage as experiments with very immature neurons (DIV2+1), despite their still much smaller and sparser dendritic tree, yielded results that looked very similar to those at DIV4+2 (Fig. 7 J versus Fig. 7 E).
3D time-lapse analyses of developing dendritic trees of neurons either transfected with ankycorbin RNAi or scrambled RNAi-encoding plasmids, respectively, unraveled the cell biological mechanism behind the observed sparse dendritic trees of ankycorbin RNAi neurons. Ankycorbin deficiency led to a severe reduction in dendritic protrusion initiation attempts (Fig. 7 K).
Ankycorbin’s KRKAPPPP motif-containing hinge region shows a very selective binding to only four SH3 domain proteins, syndapin I, II, and III and SNX18
SH3 domains are often viewed as relatively promiscuous PxxP motif-binding domains (Mayer and Eck, 1995). Thus, the requirement of ankycorbin’s KRKAPPPP motif for its functions in the morphology development of neuronal cells made it necessary to identify the set of binding partners of the KRKAPPPP motif-containing hinge region between its N-Ank module and its coiled-coil domain. We therefore conducted differential mass spectrometry (MS) screens for endogenous binding partners for GST-ankycorbin1-400 and GST-ankycorbin1-252 lacking the KRKAPPPP-motif-containing region. Additional specificity controls were done by screening against GST (Fig. 8, A and B). In the eluates of coprecipitation analyses, which specifically did precipitate endogenous syndapin I from mouse brain lysates, as validated by immunoblotting, we identified a variety of ankycorbin binding partners, but comparisons of the ankycorbin1-400 screening results with those for ankycorbin1-252 surprisingly yielded only four proteins with a very high score. In the order of their differential enrichment, these were syndapin I, SNX18, syndapin III, and syndapin II (Fig. 8, A–C).
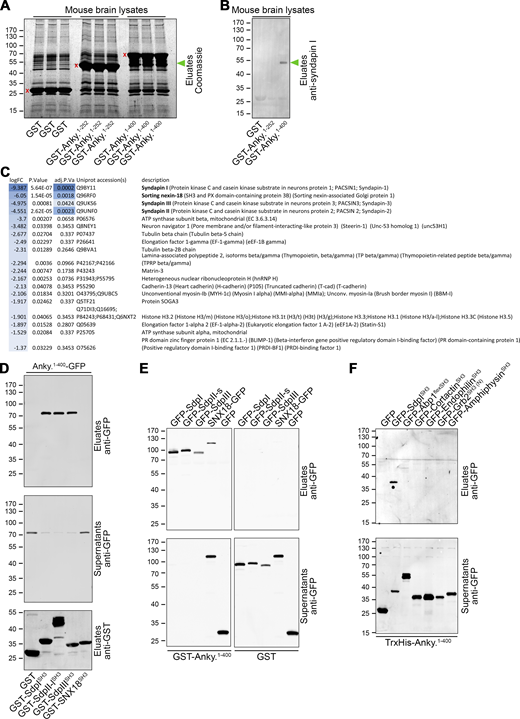
MS screening and biochemical analyses reveal a selective binding of ankycorbin's KRKAPPPP motif-containing hinge region to syndapin I, syndapin II, syndapin III, and SNX18. (A–C) Differential MS analysis for protein interactions with the KRKAPPPP motif-containing hinge region between N-Ank module and coiled-coil domain. (A) Coomassie-stained SDS-PAGE-separated mouse brain proteins eluted from matrices with GST-ankycorbin1-252, GST-ankycorbin1-400, and GST, respectively (in triplicates; red x mark position of each GST-fusion eluted). (B) Validation of MS screening conditions and results by subjection of coprecipitation eluates to anti-syndapin I immunoblotting. Green arrowheads in A and B mark position of syndapin I as a major ankycorbin1-400 interaction partner. (C) List of top differential abundant proteins in eluates from GST-Ankycorbin1-400 versus GST-Ankycorbin1-252 analyzed by quantitative MS. logFC, average log2 fold change between eluates of GST-ankycorbin1-400 and GST-ankycorbin1-252 control for unspecific and non-hinge region (N-Ank) interactions. P value, P value from unpaired, two-sided Student’s t test moderated by the empirical Bayes method. adj.P Val, P value adjusted for multiple testing using the Benjamini–Hochberg method. Note that exclusively syndapin I, syndapin II, syndapin III, and SNX18 were identified as binding partners of the ankycorbin hinge region with a significantly adjusted P value <0.05. (D) Immunoblotting analyses of coprecipitations using immobilized SH3 domains of the four ankycorbin binding partners suggested by MS screening. Note that exclusively the SH3 domains of syndapin family members bind to ankycorbin1-400-GFP. For corresponding control experiment with GFP, see Fig. S5 A. (E) Coprecipitations with immobilized GST-ankycorbin1-400 and GST (control) demonstrating that full-length SNX18 interacts with ankycorbin only modestly, whereas immobilized ankycorbin1-400 depletes GFP-syndapin I, II, and III from cell extracts. (F) Coprecipitation experiments addressing the specificity of the ankycorbin hinge region for syndapin SH3 domain binding with a variety of SH3 domains with in part known overlapping binding partners (Abp1, cortactin, endophilin A1, amphiphysin, and the N-terminal SH3 domain of Grb2). Source data are available for this figure: SourceData F8.
MS screening and biochemical analyses reveal a selective binding of ankycorbin's KRKAPPPP motif-containing hinge region to syndapin I, syndapin II, syndapin III, and SNX18. (A–C) Differential MS analysis for protein interactions with the KRKAPPPP motif-containing hinge region between N-Ank module and coiled-coil domain. (A) Coomassie-stained SDS-PAGE-separated mouse brain proteins eluted from matrices with GST-ankycorbin1-252, GST-ankycorbin1-400, and GST, respectively (in triplicates; red x mark position of each GST-fusion eluted). (B) Validation of MS screening conditions and results by subjection of coprecipitation eluates to anti-syndapin I immunoblotting. Green arrowheads in A and B mark position of syndapin I as a major ankycorbin1-400 interaction partner. (C) List of top differential abundant proteins in eluates from GST-Ankycorbin1-400 versus GST-Ankycorbin1-252 analyzed by quantitative MS. logFC, average log2 fold change between eluates of GST-ankycorbin1-400 and GST-ankycorbin1-252 control for unspecific and non-hinge region (N-Ank) interactions. P value, P value from unpaired, two-sided Student’s t test moderated by the empirical Bayes method. adj.P Val, P value adjusted for multiple testing using the Benjamini–Hochberg method. Note that exclusively syndapin I, syndapin II, syndapin III, and SNX18 were identified as binding partners of the ankycorbin hinge region with a significantly adjusted P value <0.05. (D) Immunoblotting analyses of coprecipitations using immobilized SH3 domains of the four ankycorbin binding partners suggested by MS screening. Note that exclusively the SH3 domains of syndapin family members bind to ankycorbin1-400-GFP. For corresponding control experiment with GFP, see Fig. S5 A. (E) Coprecipitations with immobilized GST-ankycorbin1-400 and GST (control) demonstrating that full-length SNX18 interacts with ankycorbin only modestly, whereas immobilized ankycorbin1-400 depletes GFP-syndapin I, II, and III from cell extracts. (F) Coprecipitation experiments addressing the specificity of the ankycorbin hinge region for syndapin SH3 domain binding with a variety of SH3 domains with in part known overlapping binding partners (Abp1, cortactin, endophilin A1, amphiphysin, and the N-terminal SH3 domain of Grb2). Source data are available for this figure: SourceData F8.
The ankycorbin interactions of all four proteins found in the differential MS screening efforts were validated. Coprecipitation analyses with immobilized SH3 domains of syndapin I, II, III, and SNX18 verified the interaction with syndapins but failed to confirm an interaction with the SNX18 SH3 domain (Fig. 8 D and Fig. S5 A). Further analyses performed with full-length SNX18 in comparison to syndapins showed that SNX18 was interacting with ankycorbin1-400 very weakly. While this observation may be in line with the identification of SNX18 as ankycorbin interaction partner by MS, a significant portion of SNX18 remained unbound in the supernatant (Fig. 8 E). In contrast, immobilized ankycorbin1-400 showed strong binding of all three syndapins, which led to a complete depletion of all syndapins from the cell lysates (Fig. 8 E).
Ankycorbin associates with syndapin II and syndapin III in vivo. (A) GFP control experiment related to the coprecipitation of ankycorbin1-400-GFP with GST and the GST-SH3 domains of syndapin I, II-l (long splice isoform SdpII), and III as well as of SNX18 shown in Fig. 8 D. (B) Coimmunoprecipitations of GFP-ankycorbin1-400 complexes with Flag-syndapin II (Flag-SdpII-s; SdpII-s, short splice isoform of syndapin II) and with Flag-syndapin III (Flag-SdpIII), respectively. Note that GFP-ankycorbin1-400 was specifically coimmunoprecipitated with both syndapin II and syndapin III (lanes 3 and 7 in lower right panel; green arrowhead). Source data are available for this figure: SourceData FS5.
Ankycorbin associates with syndapin II and syndapin III in vivo. (A) GFP control experiment related to the coprecipitation of ankycorbin1-400-GFP with GST and the GST-SH3 domains of syndapin I, II-l (long splice isoform SdpII), and III as well as of SNX18 shown in Fig. 8 D. (B) Coimmunoprecipitations of GFP-ankycorbin1-400 complexes with Flag-syndapin II (Flag-SdpII-s; SdpII-s, short splice isoform of syndapin II) and with Flag-syndapin III (Flag-SdpIII), respectively. Note that GFP-ankycorbin1-400 was specifically coimmunoprecipitated with both syndapin II and syndapin III (lanes 3 and 7 in lower right panel; green arrowhead). Source data are available for this figure: SourceData FS5.
In line with the strong binding of syndapin II and syndapin III to ankycorbin1-400 in these in vitro analyses, the interactions with syndapin II and syndapin III could also be confirmed by coimmunoprecipitation analyses (Fig. S5 B).
The apparent and quite stunning selectivity for interactions with syndapins and SNX18 in the brain was followed up by screening an additional set of SH3 domains for putative interactions with immobilized TrxHis-ankycorbin1-400. Besides the syndapin I SH3 domain, these SH3 domains included SH3 of several proteins that were identified to have similar SH3 domain binding partners as syndapin I, such as Abp1, cortactin, endophilin A1, Grb2, and amphiphysin 1, which, e.g., also bind to Cobl (Schwintzer et al., 2011; Haag et al., 2012), ProSAP1/Shank2 (Schneider et al., 2014; Qualmann et al., 2004; Haeckel et al., 2008; Naisbitt et al., 1999), dynamin (Qualmann et al., 1999; Kessels et al., 2001; McNiven et al., 2000; Simpson et al., 1999; Gout et al., 1993; David et al., 1996), and/or N-WASP (Kessels and Qualmann, 2002; Pinyol et al., 2007; Martinez-Quiles et al., 2004.; Otsuki et al., 2003; Miki et al., 1996), respectively. Yet only the SH3 domain of syndapin I but none of the other five SH3 domains with syndapin-related binding partners was precipitated by ankycorbin1-400 (Fig. 8 F).
Thus, ankycorbin indeed seems to show an unexpected selectivity for the SH3 domains of syndapin family members.
Ankycorbin-mediated dendritic branching strictly relies on syndapin I
Since the KRKAPPPP motif critical for ankycorbin’s functions in dendritic arborization showed an impressive selectivity for the three syndapin family members, we explicitly addressed a putative requirement of syndapin I for ankycorbin’s functions as it is the major syndapin isoform in the nervous system. Primary hippocampal neurons transfected with ankycorbin-GFP and cotransfected with (mCherryF-reported) scrambled RNAi plasmids showed significant increases in dendritic arborization (Fig. 9, A–H). Strikingly, cotransfection of syndapin I RNAi suppressed all of these ankycorbin effects on dendritic arborization very effectively. Dendritic branch points, dendritic terminal points, and total dendritic length all were strongly suppressed upon lack of syndapin I (Fig. 9, E–G). For all dendritic parameters, the relative suppression observed in ankycorbin-GFP and syndapin I RNAi cotransfected cells was much stronger than the rather modest defects caused by syndapin I RNAi alone when compared with control. The values of the suppressed dendritic parameters in all cases thereby remained indistinguishable from those of syndapin I RNAi-transfected neurons (Fig. 9, E–H). These data, therefore, allow the firm conclusion that all aspects of ankycorbin-mediated dendritic branching were fully dependent on ankycorbin’s binding partner syndapin I.

Ankycorbin-mediated dendritic arborization is fully dependent on syndapin I. (A–D) MIPs of DIV6 anti-MAP2 immunostained primary hippocampal neurons transfected at DIV4 with combinations of GFP (A and D) and ankycorbin-GFP (B and C), respectively, together with scrambled RNAi (A and B) and syndapin I RNAi (C and D), respectively. Bars, 20 µm. (E–H) Analyses of dendritic arbor complexity by quantitative determinations of dendritic branch points (E), dendritic terminal points (F), total dendritic length (G), and Sholl analyses (H). Data, mean ± SEM and individual data points (E–G) and mean ± SEM (H) from biologically independent samples (neurons). n numbers of neurons (obtained from five to eight independent coverslips each; three independent neuronal preparations) as indicated in the figure. Statistical significances, one-way ANOVA/Tukey’s (E–G); two-way ANOVA/Bonferroni’s (H); *P < 0.05; **P < 0.01; ***P < 0.001; ****P < 0.0001. Except for the Sholl analyses (table in H), exact P values for *, **, and *** are reported directly in the figure.
Ankycorbin-mediated dendritic arborization is fully dependent on syndapin I. (A–D) MIPs of DIV6 anti-MAP2 immunostained primary hippocampal neurons transfected at DIV4 with combinations of GFP (A and D) and ankycorbin-GFP (B and C), respectively, together with scrambled RNAi (A and B) and syndapin I RNAi (C and D), respectively. Bars, 20 µm. (E–H) Analyses of dendritic arbor complexity by quantitative determinations of dendritic branch points (E), dendritic terminal points (F), total dendritic length (G), and Sholl analyses (H). Data, mean ± SEM and individual data points (E–G) and mean ± SEM (H) from biologically independent samples (neurons). n numbers of neurons (obtained from five to eight independent coverslips each; three independent neuronal preparations) as indicated in the figure. Statistical significances, one-way ANOVA/Tukey’s (E–G); two-way ANOVA/Bonferroni’s (H); *P < 0.05; **P < 0.01; ***P < 0.001; ****P < 0.0001. Except for the Sholl analyses (table in H), exact P values for *, **, and *** are reported directly in the figure.
These results highlighted the importance of the identified ankycorbin/syndapin I interaction and unveiled a cooperative functional relationship between two proteins belonging to two fundamentally different superfamilies of membrane-shapers in the development of proper dendritic arbors of neuronal cells.
Discussion
Elaborate dendritic arbors of neuronal cells are important for proper functioning of vertebrate brains because they have direct consequences for organization and information processing within neuronal networks. Here, we demonstrate that dendritic branch formation is powered by physically coordinated mechanisms of membrane shaping brought about by members of two distinct classes of membrane shapers, the F-BAR protein syndapin I and the N-Ank superfamily protein ankycorbin, which associate with each other and functionally cooperate.
The syndapin/ankycorbin interaction we identified by in silico screening with an SH3 domain consensus generated from the known syndapin binding partners Cobl and Cobl-like (Ahuja et al., 2007; Schwintzer et al., 2011; Izadi et al., 2021) applied to all three members of the syndapin family as underscored by coprecipitations, MS data, and coimmunoprecipitations. The use of syndapin I and mutants with affected SH3 domain functionality (P434L mutation; SH3 domain deletion) in in vitro reconstitutions thereby proved that the interaction is indeed syndapin SH3-domain-mediated and direct. The in vivo relevance of the identified interaction was demonstrated by coimmunoprecipitation studies and syndapin/ankycorbin complex formations at membrane surfaces in intact cells. Importantly, coimmunoprecipitations of the endogenous proteins from brain lysates showed that the interaction of ankycorbin with the brain-enriched member of the syndapin family, syndapin I, clearly is of relevance in the brain.
Corecruitment studies as well as in vitro reconstitutions with purified components clearly demonstrated that syndapin I/ankycorbin complexes can be formed at membrane surfaces. Extraction experiments hereby suggest that both proteins intercalate protein parts into membranes for tight membrane anchoring. This is in line with findings that syndapins use protein wedges for membrane insertion (Wang et al., 2009; Edeling et al., 2009) and ankycorbin uses an N terminal amphipathic helix for membrane insertion (Wolf et al., 2019).
Very much in contrast to the view of SH3 domains as relatively promiscuous protein interaction modules (Mayer and Eck, 1995), ankycorbin’s interactions with syndapins were astonishingly specific as ankycorbin was not coprecipitated by any of the SH3 domains of other proteins reported to have some common binding partners with syndapin I. Also, MS screens identified only the three syndapin family members and SNX18 as binding partners of the KRKAPPPP-motif-containing hinge domain of ankycorbin.
Similar to syndapins, SNX18 also is a membrane-shaping protein. It belongs to the SNX-PX-BAR family (van Weering et al., 2010; Teasdale and Collins, 2012; Shortill et al., 2022) and has been shown to tubulate membranes in endosomal trafficking (Håberg et al., 2008; Søreng et al., 2018) and to share redundant functions with SNX9 at the plasma membrane (Park et al., 2010). Besides the identified syndapin/ankycorbin interactions, the (weaker) SNX18/ankycorbin interaction could represent another example of distinct classes of membrane-shaping proteins working together.
The identified syndapin/ankycorbin interaction was clearly dependent on ankycorbin’s KRKAPPPP motif. In line with its identification as syndapin binding site, the KRKAPPPP motif of ankycorbin is absolutely conserved among a huge variety of species. It furthermore showed some similarity to other mapped syndapin I binding sites, such as those in dynamin I (RRQAPPPP; Anggono and Robinson, 2007), ProSAP1/Shank2 (RKKAPPPPKR; Schneider et al., 2014), and the glycine receptor β subunit (KKPPPAKPVIP; Del Pino et al., 2014; Tröger et al., 2022). This proved that our in silico screening approach was valid and suitable to identify thus far unknown syndapin interactions.
That syndapin I and ankycorbin do not only associate but also cooperate functionally during the dendritogenesis of developing neurons is supported by the finding that the ankycorbin∆KRKAPPPP mutant completely failed to give rise to any of the ankycorbin gain-of-function phenotypes in dendritic arborization in developing neurons and that, in contrast to wild-type ankycorbin, the ankycorbin∆KRKAPPPP mutant was unable to rescue the ankycorbin RNAi phenotypes in dendritogenesis. These results clearly demonstrated that the syndapin binding site is of functional importance for ankycorbin’s role in dendritic arbor formation. In line with this conclusion, the syndapin association-incompetent splice variant X2 lacking the KRKAPPPP motif can be found in a variety of tissues but was virtually absent from brain. It therefore seems that a major molecular mechanistic difference between ankycorbin X1 and its splice variant X2 is the functional coupling to syndapins. In line with this, further analyses demonstrated that ankycorbin-mediated dendritic arbor formation was strictly dependent on syndapin I presence.
It was surprising that the functions of a powerful membrane shaper, such as ankycorbin (Wolf et al., 2019), turned out to rely on a second membrane-shaping component, which also promotes convex membrane curvatures by membrane association. This finding, however, is in line with the fact that both syndapin I (Hou et al., 2015; Izadi et al., 2021) and ankycorbin (Wolf et al., 2019) were observed to accumulate at nascent dendritic branch initiation sites. Ideally, we would have liked to corroborate these findings with similar electron microscopical images of both endogenous syndapin I and ankycorbin. However, while we succeeded with the individual immunogold labelings (Wolf et al., 2019; Izadi et al., 2021), we were unable to establish suitable double-immunogold labeling procedures for freeze-fractured membranes of developing neurons. A reason for this may be steric hindrances arising from the fact that the epitope of the anti-ankycorbin antibody comprises the syndapin-binding KRKAPPPP motif. 3D time-lapse imaging circumvented these technical difficulties with EM approaches and clearly demonstrated that syndapin I and ankycorbin both accumulated in a temporally and spatially coordinated manner at nascent dendritic branch sites about 30–40 s prior to protrusion induction.
The extended ankycorbin N-Ank module exhibited stronger in vitro membrane-curvature-inducing activity than syndapin I. It therefore appeared that beyond syndapin I’s membrane shaping abilities, further properties of syndapin I may be pivotal in ankycorbin-driven dendritic branch formation. An attractive hypothesis is a contribution of syndapin I’s ability to recruit components promoting actin polymerization. This would link the combined membrane-shaping functions of ankycorbin/syndapin complexes to actin filament formation processes providing force to support, maintain, and further propagate dendritic branch induction (Fig. 10). In line with this hypothesis, syndapin I only has one SH3 domain for further interaction but was demonstrated to self-associate and thereby form larger, multivalent arrays (Kessels and Qualmann, 2006). It was experimentally proven that this syndapin I property supports at least two types of ternary complexes involving the syndapin I–binding Arp2/3 complex activator N-WASP (Qualmann et al., 1999), one with the syndapin-binding GTPase dynamin I (Kessels and Qualmann, 2006)—a critical component in vesicle fission processes during endocytosis (Mettlen et al., 2018)—and a second one with the syndapin-binding actin nucleator Cobl (Schwintzer et al., 2011). Recently, it has been shown that syndapin also gives rise to another type of ternary complex and interlinks Cobl with its relative Cobl-like in a Ca2+/CaM-regulated manner (Hou et al., 2015; Izadi et al., 2021). The fact that dendritic branch induction sites, which accumulate ankycorbin and syndapin I prior to branch induction, also showed a transient burst of actin filament formation during branch initiation (Hou et al., 2015; Izadi et al., 2021) is in line with syndapin I–mediated couplings of dendritic branch induction to local actin polymerization (Fig. 10).

Model of syndapin I and ankycorbin working together during dendritic branch induction. Model visualizing the membrane topology at a branch induction site (cut-open mother dendrite with a view at the highly curved membrane at the branch induction site and into the forming dendritic branch). The model depicts how locally accumulated syndapin I proteins (each syndapin I structure represents a dimeric structure with a concave membrane-binding interface; the SH3 domains present near the tips of the structures and the small hydrophobic wedges for membrane-insertion as well as the tilde shape in top view [omitted for clarity]) could support dendritic branching and how coaccumulation of the membrane shaper ankycorbin would give rise to arrays of membrane shapers supporting key membrane curvatures at branch initiation sites. Additionally, the model shows how Cobl and/or Cobl-like, which promote the formation of actin filaments and also play important roles in dendritic branch induction, may be integrated into the protein assembly at branch initiation sites by linkage to syndapin I.
Model of syndapin I and ankycorbin working together during dendritic branch induction. Model visualizing the membrane topology at a branch induction site (cut-open mother dendrite with a view at the highly curved membrane at the branch induction site and into the forming dendritic branch). The model depicts how locally accumulated syndapin I proteins (each syndapin I structure represents a dimeric structure with a concave membrane-binding interface; the SH3 domains present near the tips of the structures and the small hydrophobic wedges for membrane-insertion as well as the tilde shape in top view [omitted for clarity]) could support dendritic branching and how coaccumulation of the membrane shaper ankycorbin would give rise to arrays of membrane shapers supporting key membrane curvatures at branch initiation sites. Additionally, the model shows how Cobl and/or Cobl-like, which promote the formation of actin filaments and also play important roles in dendritic branch induction, may be integrated into the protein assembly at branch initiation sites by linkage to syndapin I.
Vice versa it is worthwhile to consider which critical function ankycorbin may contribute, if syndapin I already can (i) provide links to actin filament formation and (ii) is a powerful membrane shaper by itself. Strikingly, the strongest syndapin I–induced membrane curvatures in vitro were reflected by uniform vesicles of 35 nm (Wang et al., 2009) and the observed formation of membrane tubules of rather uniform diameters of about 82 nm (this study). Yet, in vivo, the membrane curvatures at dendritic branch initiation sites are not uniform but variable. Also, the membrane topologies at dendritic branch induction sites show different spatial orientations of curvature instead of the uniform curvature orientation found at tubules (Fig. 10). Finally, physiological curvatures at these sites are not in the low nanometer range but usually readily observable by light microscopy.
High local syndapin I concentrations would promote tip-to-tip and close lateral self-associations of syndapin I dimers, as deduced from observed packaging of protein crystals (Wang et al., 2009). Similar arrangements into extended lattices have been observed for other F-BAR proteins, such as FBP17 and CIP4 (Shimada et al., 2007). The suggested formation of larger syndapin I lattices is in line with biochemical data, which unveiled higher-order molecular assemblies of syndapin I (Kessels and Qualmann, 2006). Highly organized F-BAR lattices by tip-to-tip arrangements and tight contacts of laterally adjacent dimers also were suggested by single particle helical reconstructions of the CIP4 F-BAR domain at membrane tubules based on cryoEM analyses (Frost et al., 2008). Furthermore, recent molecular dynamics simulations of the syndapin I F-BAR domain also suggested tip-to-tip as well as lateral assemblies of dimers at membranes (Mahmood et al., 2019; Mahmood et al., 2021). It is clear that lateral assemblies, such as those in syndapin I F-BAR crystals, would lead to a tight packaging of syndapin I dimers and thereby exclusively support strong membrane curvatures in one direction, i.e., tubules (Wang et al., 2009; also see model in Fig. 4 K).
High local densities of plasma membrane-associated endogenous syndapin I have indeed been observed in vivo. TEM of immunolabeled freeze-fractured samples visualized syndapin I clusters at plasma membrane areas of nascent branch sites in developing neurons (Izadi et al., 2021) and also in certain head areas of the plasma membrane of dendritic spines in mature neurons (Schneider et al., 2014). In line with a critical functional importance of syndapin I at both of these sites, syndapin I deficiency caused impairments during dendritic arborization as well as in dendritic spine formation and synaptic plasticity, respectively, in both cultures of neurons as well as at the whole animal level (Schneider et al., 2014; Koch et al., 2020).
Yet, both of these sites of syndapin I accumulation and syndapin I–mediated membrane topology modulation show complex membrane curvatures in different orientations, which would not be supported by plasma membrane tubulations (Fig. 10). Importantly, our data show that tubular syndapin I–mediated curvatures are effectively suppressed by ankycorbin integration and that together syndapin I and ankycorbin give rise to membrane curvatures that are much more comparable to those observed in vivo. The different sets of functional examinations demonstrated that such cooperation of two distinct classes of membrane shapers is a pivotal, previously unknown principle for bringing about proper dendritic arbors during neuronal development.
Material and methods
DNA constructs
Plasmids encoding for GST-ankycorbin1-252, ankycorbin-GFP, and GFP-ankycorbin400-979 (CC) were described before (Wolf et al., 2019). GFP- and TrxHis-ankycorbin1-400-encoding plasmids were generated by subcloning from GST-ankycorbin1-400 (Wolf et al., 2019) into pEGFP-C3 (Clontech) and pET32a (+; Merck Millipore), respectively. Plasmids encoding for GST-tagged GFP and GST-ankycorbin1-400-GFP were obtained by subcloning ankycorbin1-400-GFP and GFP, respectively, into pGEX-6P-1 (GE Healthcare). GFP- and GST-tagged ankycorbin1-400∆KRKAPPPP and ankycorbin17-400∆KRKAPPPP as well as ankycorbin1-400-GFP were generated by PCR using the full-length template and cloning into GEX-6P-1 and pEGFP vectors, respectively. The mutation was generated by combining two PCR products replacing the sequence KKRKAPPPPIS containing the KRKAPPPP motif by the codons for G and T (KpnI site introduction). For primers, see Table S1. Full-length ankycorbin∆KRKAPPPP-GFP (∆271–281) was generated by subcloning the mutated N terminus of ankycorbin into wild-type ankycorbin.
Human ankycorbin X1 and X2 isoforms were cloned by PCR from a cDNA mix prepared from HEK293 (RRID: CVCL_0045) and HeLa cells (RRID: CVCL_0030). For primers, see Table S1. The PCR products were inserted into the XhoI and BamHI sites of pEGFP-N3. The deletion mutants hAnky.1-384-GFP and hAnky. isof. X21-355 were generated by PCR and inserted into pEGFP-N2. For primers, see Table S1.
RNAi constructs directed against mouse and rat ankycorbin and the scrambled RNAi sequence serving as control were as previously described and established (Wolf et al., 2019). RNAi-insensitive ankycorbin*-GFP was generated by silent mutagenesis, as described (Wolf et al., 2019). RNAi constructs reexpressing RNAi-resistant ankycorbin*∆KRKAPPPP-GFP were generated by subcloning.
Plasmids encoding for Xpress-syndapin I, GST-syndapin I, GST-syndapin I with a mutated SH3 domain (SdpImut; SdpI P434L), GST-syndapin IΔSH3, and a GST fusion of the syndapin I SH3 domain (aa376–441), respectively, were described before (Qualmann et al., 1999). For easier GST-tag removal, syndapin I and syndapin IΔSH3 were additionally subcloned into pGEX-6P-1 (Izadi et al., 2021). Flag-syndapin I (Qualmann and Kelly, 2000) and Flag-syndapin I∆SH3 (aa1–382; Schneider et al., 2014) were as described. Mito-syndapin I and Mito-syndapin I∆SH3 plasmids also were as published previously (Kessels and Qualmann, 2002). (Flag-tagged) mCherry-syndapin I also was as described (Hou et al., 2015).
Syndapin I RNAi tools (against bp297–317) were as established (Dharmalingam et al., 2009) and driven by a pRNAT vector reported by mCherryF coexpression (Schneider et al., 2014).
Plasmids encoding for GST-mCherry-syndapin I were obtained by cloning mCherry (PCR) into the BamHI site of a GST-syndapin I encoding plasmid (pGEX-6P-1). For primers, see Table S1.
Plasmids encoding for Flag-syndapin II-s were reported previously (Dharmalingam et al., 2009).
GST-syndapin II-l SH3 (aa383–488) and GST-syndapin III SH3 (aa366–425)–encoding plasmid have been described (Qualmann and Kelly, 2000; Seemann et al., 2017). The Flag-syndapin III–encoding plasmid was generated by subcloning syndapin III from GST-syndapin III (Braun et al., 2005) into pCMV-Tag2.
GFP-tagged SH3 domains from amphiphysin, cortactin, syndapin I, endophilin, and Grb2 as well as an elongated sequence comprising the SH3 domain of Abp1 were generated by subcloning from GST-SH3 domain encoding plasmids described before (Kessels et al., 2000; Sparks et al., 1996) into pEGFP-C1 and pEGFP-C2, respectively. SNX18-GFP was as published (Søreng et al., 2018). The SNX18 SH3 domain was cloned by PCR using SNX18-GFP as template and inserting the PCR product into pGEX-6P-1. For primers, see Table S1.
Correct cloning by PCR was verified by sequencing in all cases.
cDNA generations and RT-PCR
Preparations of mRNA from HEK293 and HeLa cells were conducted and used for generating a mixed cDNA collection for cloning of human ankycorbin X1 and X2 isoforms according to procedures described previously (Haag et al., 2012).
For RT-PCR, analyses of the expression of mouse ankycorbin X1 and X2 splice variants, mRNA from a variety of tissues of adult mice was isolated and reversely transcribed as described previously (Haag et al., 2012). To test for the absence of genomic DNA, controls omitting the reverse transcriptase were run in parallel. GAPDH amplifications were done to control for mRNA integrity and cDNA quality, respectively. For primers, see Table S1.
The identities of RT-PCR products were validated by cloning using the pGEM-T Easy vector system (Promega) and subsequent sequencing of plasmids from isolated clones.
Antibodies
Primary and secondary antibodies used in this study are listed in Table S2.
In silico screening
A consensus for PxxP-motifs for syndapin I binding was built from comparisons of the identified binding sites of murine Cobl (Schwintzer et al., 2011) and Cobl-like (Izadi et al., 2021) from 27 species. The consensus obtained (K-[RAGS]-[RKQ]-A-P-[PLAS]-P-P) was run against sequences in UniProtKB/Swiss-Prot, UniProtKB/TrEMBL, and the PDB database. The searches yielded 533 sequences. All non-vertebrate sequences were not considered. The remaining 201 vertebrate sequences were analyzed further.
Purification of recombinant proteins and tag cleavage
GST and TrxHis fusion proteins were expressed in Escherichia coli (BL21) at 37°C for 4 h according to standard methods. GST fusion proteins were purified from E. coli lyzed with PBS containing protease inhibitor Complete EDTA-free (Roche), 1% (vol/vol) Triton X-100, DNase I, and 10 mM MgCl2 using a high-affinity glutathione-resin (antibodies online). TrxHis fusion proteins were purified from E. coli lyzed with 50 mM Na3PO4 (pH 7.0) containing 300 mM NaCl, protease inhibitor complete EDTA-free, 1% (vol/vol) Triton X-100, DNase I, and 10 mM MgCl2 using HisPur Cobalt resin (Thermo Fisher Scientific). Elutions of GST fusion proteins were done with 20 mM reduced glutathione, 50 mM Tris/HCl, and 120 mM NaCl (pH 8.0). Elutions of TrxHis fusion proteins were done with 50 mM Na3PO4 (pH 7.0), 300 mM NaCl, and 150 mM imidazole.
Cleavages of pGEX-6P-1-encoded GST-fusion proteins of GFP, syndapin I and syndapinIΔSH3, mCherry-syndapin I, ankycorbin proteins, and ankycorbin-GFP were essentially performed as described (Wolf et al., 2019). In brief, preScission Protease (GE) cleavage was performed overnight (4°C) during dialysis against HN-buffer (20 mM Hepes, pH 7.4, 150 mM NaCl, 2.5 mM DTT). GST and remaining GST-fusion proteins were removed with glutathione resin (Antibodies-Online).
Protein concentrations were determined by Bradford assay. Successful cleavage and protein integrity were verified by SDS-PAGE and Coomassie staining.
Liposome preparation
Liposomes were prepared from Folch fraction I lipids (Sigma-Aldrich). Dried and subsequently water-saturated lipids were incubated overnight at 37°C in 30 ml cytosol buffer (25 mM Hepes, pH 7.2, 25 mM KCl, 2.5 mM Mg-acetate, and 100 mM K-glutamate), collected at 28°C for 1 h at 33,734 × g and resuspended in 500 μl of the supernatant.
The size distribution of liposomes differs from preparation to preparation (mean usually 300–550 nm), therefore control conditions always were included in all assays addressing liposome sizes and size changes.
Liposome cosedimentation
Untagged wild-type ankycorbin1-400, ankycorbin17-400, ankycorbin17-400∆KRKAPPPP, and full-length syndapin I (aa1–441; 5 µg, i.e., 1.1 µmol each) were either individually or in combination diluted into 25 μl HN-buffer and prespun for 5 min at 200,000 × g. The supernatant was transferred to a fresh tube and incubated with 50 µg of Folch fraction I liposomes (2 mg/ml) for 30 min at RT. Liposomes were then pelleted (200,000 × g, 20 min, 28°C) and the supernatants were collected. The pellets were resuspended in volumes corresponding to the removed supernatants. The pellet and supernatant samples were then analyzed by SDS-PAGE. Coomassie-stained gels and/or Western blot immunosignals were quantified with a LI-COR Odyssey imager and software.
Salt extraction experiments were essentially performed as described above, except that 5 min prior to precipitation, the final NaCl concentration was either left unchanged (150 mM; HN-buffer) or increased to 200 and 250 mM, respectively. The results were then compared by determinations of liposome-cosedimented proteins using an LI-COR Odyssey system.
Time-lapse imaging of fluorescent large unilamellar vesicles (LUVs) and proteins
Fluorescent LUVs for time-lapse imaging were prepared by a gentle swelling procedure as described (Wolf et al., 2019). In brief, solutions of Folch fraction I lipids were supplemented with Cy5-PE (Avanti Polar Lipids; 5% [vol/vol] final) and the solvents were removed under a N2 current. The lipids were then rehydrated and LUVs were formed through gentle swelling in 0.3 M sucrose overnight at 42°C.
5 µg LUVs were incubated with 1 µmol of (each) purified fluorescent (fusion) protein in 300 μl cytosol buffer, mixed, transferred into an open coverslip holder placed in a temperature-controlled incubator built around a spinning-disc microscope based on a motorized Axio Observer (Zeiss) equipped with a spinning-disc unit CSU-X1A 5000, 488 nm/100 mW OPSL laser, and 561 nm/40 mW diode lasers as well as with a QuantEM 512SC EMCCD camera (Zeiss).
The mixture was then imaged at 37°C with a frame rate of 1 multiple color Z-stack per 20 s for 20 min at low laser powers (10 and 5% laser power, respectively; exposure times, 40 ms [488 nm] and 5 ms [561 nm]; 63×/1.20W Korr M27 objective; Zeiss). Image recording and processing were performed using ZEN2012 (PRID: SCR_013672), ImageJ (RRID: SCR_003070), and Adobe Photoshop (RRID: SCR_014199) software.
Culture and transfection, immunostaining of cells, and fluorescence microscopy
HEK293, HeLa, and COS-7 cells (RRID: CVCL_0224) were cultured under standard conditions (37°C with 90% humidity and 5% CO2) and transfected using TurboFect (Thermo Fisher Scientific) according to instructions of the manufacturer. The cell lines are regularly tested for mycoplasma and were mycoplasma-negative.
Immunolabeling procedures were done as described (Kessels et al., 2001; Haag et al., 2012). In brief, COS-7 and HeLa cells were fixed in 4% (vol/vol) PFA for 7 min and quenched with 25 mM glycine in PBS for 30 min. Cells were permeabilized and blocked with 10% (vol/vol) horse serum, 5% (wt/vol) BSA in PBS (blocking solution) supplemented with 0.2% (vol/vol) Triton X-100. Primary and secondary antibody incubations were done in blocking solution for 1 h at RT. Coverslips were washed with PBS, dived in distilled water, and mounted on glass slides using Mowiol 4-88.
In reconstitutions and visualizations of protein complex formations at the surfaces of mitochondria in intact COS-7 cells, the mitochondria were stained with 0.2 µM MitoTracker Deep Red 633 in medium at 37°C for 30 min before cells were fixed and immunolabeled.
Images were recorded as z-stacks using a Zeiss AxioObserver.Z1 microscope (Zeiss) equipped with an ApoTome, Plan-Apochromat 100×/1.4, 63×/1.4, 40×/1.3 and 20×/0.5 objectives and an AxioCam MRm CCD camera (Zeiss). Digital images were recorded by ZEN2012. Image processing was done by Adobe Photoshop. Line scans and Pearson correlation coefficient calculations were done by ImageJ.
Freeze-fracturing, TEM, and quantitative analyses
Protein/liposome interactions were reconstituted with 5 µg of ankycorbin1-400, 5 µg of syndapin I, and 5 µg of syndapin IΔSH3 as well as with combinations of the two latter with 1 µg of ankycorbin1-400, respectively, and 100 μl of liposome suspension in HN-buffer (2 µg/μl). In accordance with established procedures (Beetz et al., 2013; Zobel et al., 2015), the samples were incubated with proteinase to avoid liposomal aggregates. The incubation was conducted with 0.15 µg/μl proteinase K at 45°C for 25 min.
Sample preparation and freeze-fracturing of liposomes were done as established (Zobel et al., 2015; Hofbrucker-MacKenzie et al., 2023). In brief, 2 μl aliquots of liposome suspension were placed between two copper profiles and the sandwich was immediately plunge-frozen in liquid ethane cooled by liquid N2 (−180°C). This procedure results in cooling rates of more than 4,000 K/s (Koch et al., 2012). The frozen samples were then put into a detachable cold table cooled by liquid N2, transferred into the recipient of a BAF400T freeze-fracture unit (BAL-TEC), and freeze-fractured at 1 × 10⁻⁶ mbar and −140°C.
Platinum-shadowing of liposomes was done as described (Hofbrucker-MacKenzie et al., 2023). In brief, fractured liposome membranes were shadowed with 2 nm platinum/carbon at an angle of 35° in the BAF400T freeze-fracture unit. The thickness of the platinum/carbon coating was followed by a thin layer quartz crystal monitor. The replica was then stabilized by a 15–20 nm thick carbon coat, extracted from the machine, thawed, incubated with 3% (vol/vol) sodium hypochlorite in distilled water for 20 min, and then washed with distilled water.
TEM analyses of replica from freeze-fractured liposomes were done as established (Seemann et al., 2017; Wolf et al., 2019). In brief, replicas of freeze-fractured liposomes were collected on uncoated copper grids (300 mesh) and viewed by a Zeiss EM900 electron microscope (Zeiss) run at 80 kV. The grids were explored systematically. Images were recorded by systematic grid explorations using a wide-angle Dual Speed 2K CCD camera (Tröndle).
Images were processed with Adobe Photoshop. Diameters of freeze-fractured liposomes and membrane tubules were measured using ImageJ. Density calculations were based on the full systematic grid explorations (i.e., also null profiles were included).
CryoTEM analyses
CryoTEM analyses of liposome incubations with the respective proteins were essentially done as described previously (Seemann et al., 2017; Wolf et al., 2019). In brief, preparations of reconstitutions of liposome–protein interactions were done on holey gold film-coated gold grids UltrAufoil 1.2/1.3 (Quantifoil), which were then frozen quickly in liquid ethane (about −180°C) and transferred into a precooled cryogenic transmission electron microscope (Phillips CM120) using a Gatan 626-DH cryo-transfer unit (Gatan). The instrument was operated at 120 kV and images were recorded with a 2K CMOS camera (F216; TVIPS).
Diameters of membrane tubules generated upon incubation of liposomes with syndapin I were measured from outer membrane border to outer membrane border to obtain the full diameter using ImageJ. CryoTEM images were processed using Adobe Photoshop.
Coprecipitation assays
HEK293 cells were transfected with plasmids encoding GFP-tagged proteins and lyzed by addition of lysis buffer (10 mM Hepes, pH 7.4, 1 mM EGTA, 0.1 mM MgCl2, 1% [vol/vol] Triton X-100) containing 150 mM NaCl and protease inhibitor Complete.
Coprecipitation analyses using immobilized, purified, recombinant GST fusion proteins were essentially carried out as described (Kessels and Qualmann, 2002). In brief, extracts from HEK293 cells expressing different GFP-fusion proteins were incubated 3 h at 4°C with purified GST-fusion proteins immobilized on glutathione resin. GST-fusion protein binding, lysate incubation, and washing were performed in lysis buffer with 150 mM NaCl. Bound protein complexes were eluted with 20 mM reduced glutathione, 120 mM NaCl, 50 mM Tris/HCl, pH 8.0, or by incubating the samples in SDS sample buffer at 95°C for 5 min and were then analyzed by anti-GFP and anti-GST immunoblotting.
Coprecipitation analyses using immobilized, purified TrxHis-ankycorbin1-400, and GPF-tagged SH3 domains of different proteins were essentially conducted in a similar way except that TrxHis-ankycorbin1-400 was immobilized at a HisPur Cobalt resin and the assay was done in lysis buffer containing 300 mM NaCl. After incubating for 2 h, the matrix-bound protein complexes were washed and eluted. The samples were analyzed by SDS/PAGE and Coomassie staining and by immunoblotting using a LI-COR Odyssey fluorescent Western blot detection system.
In vitro reconstitution of direct protein interactions
Direct protein interactions were demonstrated by coprecipitation assay with purified recombinant proteins. Used were immobilized GST, GST-syndapin I, and GST-syndapin I P434L (GST-SdpImut) in combination with either TrxHis (control) or TrxHis-ankycorbin1-400 according to procedures resembling those described above.
The analysis was conducted by SDS-PAGE and Coomassie staining in combination with immunoblotting to verify the nature of the detected bands.
Heterologous coimmunoprecipitations
Heterologous coimmunoprecipitations were essentially conducted as described (Hou et al., 2018; Izadi et al., 2021). In brief, HEK293 cells cotransfected with Flag-tagged syndapin proteins and GFP-tagged ankycorbin proteins were lyzed by addition of lysis buffer containing 50 mM NaCl and protease inhibitor Complete, and the lysates were incubated at 4°C for 2 h with 5 µg mouse monoclonal anti-Flag antibodies (M2) and with 5 µg unrelated murine IgG (Santa Cruz), respectively. Subsequently, 15 μl of a suspension (1:2 vol/vol in lysis buffer) of protein A/G-agarose (Santa Cruz) was added to each sample, incubated for another 3 h, and then isolated by centrifugation. Protein/antibody complexes bound to the agarose were then washed three times with lysis buffer containing 50 mM NaCl, eluted in 2× SDS-sample buffer, and then analyzed by immunoblotting using rabbit anti-Flag antibodies for detection of immunoprecipitated proteins and rabbit anti-GFP antibodies for detection of coimmunoprecipitated GFP-fusion proteins.
Animals
Mice and rats used to obtain biological material were bred by the animal facility of the Jena University Hospital in strict compliance with the European Union guidelines for animal experiments (approved by Thüringer Landesamt).
No further permission for animal experiments was required for this study because primary neurons and lysates from various tissues and organs were generated from postmortem animals.
Preparation of lysates from mouse brain
Brains from P0 mice were dissected, cut into pieces, and homogenized in a 1:10 (wt/vol) ratio in homogenization buffer (0.32 sucrose, 1 mM EDTA, 5 mM Hepes, pH 7.4, containing protease inhibitor Complete EDTA-free) using a potter (Braun/Sartorius; 15 strokes; 900 rpm). Protein concentrations were determined by BCA assays (Pierce).
Identification of ankycorbin interaction partners by MS
Screenings for interactions with the hinge region of ankycorbin were done in the form of differential coprecipitation analyses using P0 mouse brain samples according to procedures described above. Comparative MS analyses of the eluates from immobilized GST-Anky.1-400 and GST-Anky.1-252 were conducted. Immobilized GST served as specificity control. Each condition was covered by three independent coprecipitation experiments conducted in parallel.
Eluates from coprecipitations were separated by SDS-PAGE on a 10% Neutral gel (Serva) and stained with Imperial Protein stain (Thermo Fisher Scientific). Each gel lane was cut into 10 pieces, reduced with 10 mM DTT for 20 min, and alkylated with 50 mM iodoacetamide for 20 min in the dark. Gel pieces were washed three times with 25 mM (NH4)HCO3, followed by one wash with 70% (vol/vol) acetonitrile, and then dried. The dried gel pieces were soaked in trypsin (Serva) solution (5 ng/μl in digestion buffer composed of 8% (vol/vol) acetonitrile, 25 mM (NH4)HCO3, 1 mM CaCl2). After 40 min incubation, the supernatants were completely removed and the gel pieces covered with digestion buffer. Digestion was performed overnight at 37°C. The supernatants were transferred into fresh vials and the gels extracted in two steps using 0.1% (vol/vol) trifluoroacetic acid, 33% (vol/vol) acetonitrile in water, and 70% (vol/vol) acetonitrile in water for 15 min each. The supernatants from digestion and extractions were combined and evaporated in a vacuum concentrator (Eppendorf) to dryness. For analysis by LC-MS/MS, the samples were dissolved in 5% (vol/vol) acetonitrile, 0.1% (vol/vol) formic acid in water, and pooled into four final fractions per gel lane.
Digested peptides were separated using the nanoAcquity UPLC system (Waters) fitted with a trapping (nanoAcquity Symmetry C18, 5 µm, 180 µm × 20 mm) and an analytical column (nanoAcquity BEH C18, 1.7 µm, 75 µm × 250 mm). The outlet of the analytical column was coupled directly to an Orbitrap Fusion Lumos (Thermo Fisher Scientific) using the Proxeon nanospray source. Solvent A was water, 0.1% (vol/vol) formic acid, and solvent B was acetonitrile, 0.1% (vol/vol) formic acid. The samples were loaded with a constant flow of solvent A at 5 μl/min onto the trapping column. Trapping time was 6 min. Peptides were eluted via the analytical column with a constant flow of 0.3 μl/min. During the elution step, the percentage of solvent B increased in a linear fashion from 3 to 25% in 30 min, then increased to 32% in 5 more min, and finally to 50% in a further 0.1 min. Total runtime was 60 min.
The peptides were introduced into the mass spectrometer via a Pico-Tip Emitter (New Objective) and a spray voltage of 2.2 kV was applied. The capillary temperature was set at 300°C. Full-scan MS spectra with mass range 375–1,500 m/z were acquired in profile mode in the Orbitrap with resolution of 120,000 FWHM (50% of the maximum peak height). The filling time was set at maximum of 50 ms with limitation of 2 × 10⁵ ions. The “Top Speed” method was employed to take the maximum number of precursor ions (with an intensity threshold of 5 × 10³) from the full scan MS for fragmentation using a collision energy of higher-energy collisional dissociation of 30% and quadrupole isolation (1.4 D window) and measurement in the ion trap, with a cycle time of 3 s. The monoisotopic precursor selection peptide algorithm was employed but with relaxed restrictions when too few precursors meeting the criteria were found. The fragmentation was performed after accumulation of 2 × 10³ ions or after a filling time of 300 ms for each precursor ion (whichever occurred first). MS/MS data were acquired in centroid mode, with a Rapid scan rate and a fixed first mass of 120 m/z. Only multiply charged (2+ to 7+) precursor ions were selected for MS/MS. Dynamic exclusion was employed with a maximum retention period of 60 s and relative mass window of 10 ppm. Ions were injected for all available parallelizable time. To improve the mass accuracy, a lock mass correction using a background ion (m/z 445.12003) was applied. Data acquisition was performed using Xcalibur 4.0/Tune 2.1 (Thermo Fisher Scientific).
Raw files were analyzed using MaxQuant (version 1.5.3.30; Cox and Mann, 2008). MS/MS spectra were searched against the Swiss-Prot entries of the Uniprot KB (database release 2016_01) using the Andromeda search engine (Cox et al., 2011). The search criteria were set as follows: full tryptic specificity was required (cleavage after lysine or arginine residues, unless followed by proline); three missed cleavages were allowed; oxidation (M), acetylation (protein N-term), and biotinylation (K) were applied as variable modifications, if applicable; mass tolerance of 20 ppm (precursor) and 0.5 D (fragments).
The reversed sequences of the target database were used as decoy database. Peptide and protein hits were filtered at a false discovery rate of 1% using a target-decoy strategy (Elias and Gygi, 2007). Additionally, only protein groups identified by at least two unique peptides were retained. The iBAQ (Schwanhäusser et al., 2011) values from the proteinGroups.txt output of MaxQuant were used for the identification of differentially enriched proteins, as described in Mackmull et al. (2017). All comparative analyses were performed using R version 3.2.2. The R package MSnbase (Gatto and Lilley, 2012) was used for processing proteomics data, and the included package imputeLCMD was used for imputing missing values based on the definitions for missing at random (MAR) and missing not at random (MNAR) values. MNAR values were defined for each pairwise comparison as values that were (i) missing in three out of three replicates in one sample group, and (ii) present in at least two out of three replicates in the second sample group. Because of their non-random distribution across samples, these values were considered as underlying biological differences between sample groups. MNAR values were computed using the method “MinDet” by replacing values with minimal values observed in the sample. MAR values were consequently defined for each pairwise comparison as values that were missing in one out of three replicates per sample group. MAR values were imputed based on the method “knn” (k-nearest neighbors; Gatto and Lilley, 2012). All the other cases (e.g., protein groups that had fewer than two values in both sample groups) were filtered out because of the lack of sufficient information to perform robust statistical analysis. The data were quantile normalized to reduce technical variations (Gatto and Lilley, 2012). Protein abundance variation was evaluated using the limma package (Smyth 2004). Differences in protein abundances were statistically determined using the Student’s t test with variances moderated by limma’s empirical Bayes method.
Endogenous coimmunoprecipitations from P0 mouse brains
Brains from P0 mice were prepared and cut into small pieces (on ice). 1 g of tissue pieces was supplemented with 3 ml lysis buffer containing protease inhibitor Complete and homogenized using an ultra-turrax (20,500 rpm). The homogenate was centrifuged at 10,000 × g (10 min; 4°C). The supernatant (lysate) was examined for protein concentration (Bradford). Immobilized antibodies were prepared by suspending 15 μl protein A/G agarose in PBS (1:2 vol/vol), incubation with the antibodies in the presence of 5% (wt/vol) BSA (in PBS) for 2 h at 4°C, and washing with PBS (twice) and lysis buffer (twice). Per sample, 4 mg protein content of the lysates was incubated with immobilized guinea pig anti-syndapin I antibodies and guinea pig non-immune antibodies (IgG), respectively. After incubation with the brain lysates (3 h; 4°C), the A/G agarose was washed three times with immunoprecipitation buffer. Finally, bound proteins were eluted into an SDS-PAGE sample buffer and analyzed by immunoblotting.
Analyses of dendrites of primary hippocampal neurons
Primary rat hippocampal neuronal cultures for immunofluorescence analyses were prepared, maintained, and transfected (at DIV4 and at DIV2, respectively) as described (Izadi et al., 2021). In brief, hippocampi were dissected in ice-cold HBSS (Invitrogen), rinsed in HBSS, and trypsinized with 0.05% trypsin/EDTA (Invitrogen) for 15 min at 37°C. The supernatant was exchanged for Neurobasal medium (Gibco) supplemented with 0.5 mM L-alanyl-L-glutamine (GlutaMAX; Gibco), 0.025 mM L-glutamate, B-27 supplement (Gibco), and penicillin/streptomycin (1:100; Gibco). The tissue was dissociated by trituration with 1 ml Pasteur pipettes. The cell suspension was then plated on poly-D-lysine–coated coverslips (60,000 cells per Ø12 mm-coverslip) and maintained at 37°C and 5% CO2.
At DIV3, half of the medium was replaced by fresh medium and supplements without glutamate. Cells were grown at 37°C with 90% humidity and 5% CO2.
After transfection using Lipofectamine 2000 according to instructions of the manufacturer (Invitrogen), neurons were fixed either 1 d later (DIV2+1 and DIV4+1 examinations) or 2 d later (DIV4+2 examinations) with 4% (wt/vol) PFA in PBS, pH 7.4 (4 min at RT). Permeabilization and blocking of cultured neurons were conducted with 10% (vol/vol) horse serum and 5% (wt/vol) BSA in PBS containing 0.25% (vol/vol) Triton X-100. Antibody incubations were done in the same buffer without Triton X-100.
Two to eight independent coverslips per condition per assay were analyzed and neurons of at least two to five independent neuronal preparations were used. Transfected neurons were sampled by systematic coverslip screening. Images were recorded as image stacks using a Zeiss AxioObserver.Z1 microscope equipped with an ApoTome, as described above. Digital images were recorded by ZEN2012. Image processing was done by Adobe Photoshop.
Morphometric measurements were based on anti-MAP2 immunolabelings of transfected neurons. The numbers of dendritic branching points and dendritic terminal points as well as the total length of the dendritic arbor were determined and Sholl analyses (Sholl, 1953) were conducted using Imaris 7.6 and 8.4.0 software (RRID: SCR_007370). The Imaris software settings were as established (Izadi et al., 2021): largest diameter, cell body diameter; thinnest diameter, 0.2 µm; start seed point, 1.5× of cell body diameter; disconnected points, 2 µm; and minimum segment size, 10 µm.
Numerical data of the dendritic parameters determined by Imaris 7.6 and 8.4.0, respectively, were saved and processed by Excel and GraphPad Prism software (SCR_002798).
Preparation of neuronal and glia cell cultures from E18 rats for biochemical analyses
Primary rat neuronal cultures for biochemical analyses were prepared from embryonal day 18 (E18) rats as those for imaging and functional analyses except that the cells were seeded into poly-D-lysine–coated cell culture flasks (10 million cells in 10 ml/75 cm2 flask).
For DIV14 hippocampal neurons, 5 ml of the Neurobasal medium supplemented with 0.5 mM L-alanyl-glutamine, 0.025 mM L-glutamate, B-27 supplement, and penicillin/streptomycin (1:100) was removed and replaced by 10 ml Neurobasal medium supplemented with only 0.5 mM L-alanyl-L-glutamine, B-27 supplement, and penicillin/streptomycin at DIV3. Additionally, 1 µM cytosine β-D-arabinofuranoside (AraC; Sigma-Aldrich) was added at DIV3. At DIV10, 10 ml of the medium was replaced with 10 ml fresh medium containing 0.5 mM L-alanyl-L-glutamine, B-27 supplement, and penicillin/streptomycin as well as AraC. Lysates of the cultured neurons were then generated at DIV14 by scraping cells into ice-cold PBS, centrifugation at 1,000 × g (5 min, 4°C), resuspension in 250 μl lysis buffer containing 150 mM NaCl and protease inhibitor Complete, sonication (10 s), extraction (25 min gentle mixing at 4°C), and centrifugation at 20,000 × g (20 min, 4°C).
DIV2 cortical neurons were prepared from cortices of E18 rats and cultured and lyzed by the same procedures as above except that AraC addition was done at DIV1.
Mixed glia cell cultures were obtained from cortices of E18 rat brains (material of three embryos was pooled per 75 cm2 flask). After brain dissection and removal of meninges and blood vessels under ice-cold HBSS, the cerebral hemispheres were pooled and triturated in HBSS with 0.2 µg/ml DNAse I and 0.25% (wt/vol) trypsin by slowly passing the tissue through a 10-ml serological pipette until the tissue pieces are small enough for the next trituration step using a 1 ml pipette tip. The suspension was then washed in DMEM 20S (Invitrogen), triturated further using a 1-ml pipette tip, strained through a 70-µm cell strainer, triturated further, and passed through the cell strainer again. The obtained cell suspension was then seeded into 75 cm2 flasks. Cells were grown at 37°C with 90% humidity and 5% CO2 in DMEM 20S with medium exchanges every 2–3 d.
Lysates for immunoblotting analyses were generated at DIV11 according to the procedure described above.
3D time-lapse analyses of dendritic branching by spinning-disc microscopy and examinations of dendritic branch starts as well as of protein accumulation at dendritic branch sites
Primary hippocampal neurons for live imaging were prepared as described above except that the medium was replaced by Neurobasal A medium (Gibco) supplemented with 0.5 mM L-alanyl-L-glutamine, 0.025 mM L-glutamate, B-27 supplement, and penicillin/streptomycin 1 h after seeding of the cell suspension. The neurons were transiently transfected with Lipofectamine 2000 at DIV6.
For tracking protein dynamics in relation to dendritic branch development, 3D time-lapse imaging was done essentially as described 14–26 h after transfection (Izadi et al., 2018). In brief, the medium was replaced by a live-imaging buffer adjusted to osmolarity with a freezing point osmometer (Osmomat 3000; Gonotec) and the developing neurons were then imaged using a spinning-disc microscope to ensure fast 3D recordings with minimal phototoxicity.
For analyses of initiations of dendritic protrusions upon ankycorbin RNAi versus scrambled RNAi controls, 3D time-lapse imaging was conducted after longer posttransfection times (24–30 h).
The time-lapse imaging was done in an open coverslip holder in a temperature- and CO2-controlled incubator built around the spinning-disc microscope (see chapter time-lapse imaging of LUVs for more detailed description). Images were recorded using a C-Apochromat objective (63×/1.20W Korr M27) and a QuantEM 512SC EMCCD camera. Images were taken as z-stacks of 7–20 images (depending on cellular morphology) with z-intervals of 0.31 µm. Time intervals were set to 10 s and exposure times were 50–200 ms. Laser power was kept at 3 to maximally 10%.
Images were processed using ZEN2012, IMARIS, ImageJ, and Adobe Photoshop.
Quantitative evaluations of protein dynamics were determined as described before (Izadi et al., 2021). In brief, the degree of accumulation of syndapin I and ankycorbin fused to fluorescent proteins as well as for mCherry as control at dendritic branch initiation sites (morphologically defined by subsequent branch formation) was determined during each frame prior to protrusion start defined as t = 0 (six frames of the 3D imaging with a frame rate of 10 s; i.e., examination time window 1 min). The maximal fluorescence intensity was identified and normalized to a neighboring non-branching control region of interest (ROI) at the same dendrite.
For spatiotemporal analyses, the time points of the frames with the highest accumulation of ankycorbin and syndapin I in a time window of 1 min prior to protrusion induction were averaged. In the rare case that two maxima of equal intensity occurred prior to branch initiation, both time values were considered and averaged. As above, 3D-imaging stacks were recorded every 10 s and six frames prior to protrusion start (defined as t = 0) were evaluated.
Quantitative evaluations of the frequency of dendritic protrusion formation were done in dendritic segments of ≥20 µm length and in time frames of 15 min. Protrusion starts reaching at least 1 µm in length were counted. The frequency of dendritic protrusion starts was then quantitatively expressed as starts per 20 µm dendrite length and min.
Statistics and reproducibility
No statistical methods were used to predetermine sample size. Some functional experiments were repeated/done with an independent experimenter.
DIV4+2 functional assays with developing primary hippocampal neurons were mostly conducted with relatively high numbers of biologically independent samples (n = 43–49 neurons for each condition [Fig. 6]; n = 24–25 neurons for each condition [Fig. S4]; 70–73 neurons for each condition [Fig. 7, A–H]; n = 36–38 neurons for each condition [Fig. 9]). Additional examinations addressing the development of the ankycorbin loss-of-function phenotype were done with n = 31 or 32 neurons (DIV4+1; Fig. 7 I) and n = 29–40 neurons for each condition (DIV2+1; Fig. 7 J), respectively.
Images of these cells were collected by systematic sampling of transfected neurons from two to three coverslips per condition and assay using three independent preparations (Fig. 6), two to five independent coverslips per condition and assay from five independent preparations of primary neurons (DIV4+2 analyses; Fig. 7), from four to five coverslips per condition and assay from two independent preparations of primary cells (Fig. 7, I and J), from four to six coverslips per condition and assay from two independent preparations of primary cells (Fig. S4), and from five to eight coverslips per condition and assay from three independent primary neuronal cultures (Fig. 9), respectively. For numbers of cells used for statistical significance calculations in all experiments, please see figure legends and information directly provided in the figures.
Quantitative EM analyses of freeze-fractured samples were conducted by systematic grid explorations of three to nine independent liposome preparations and incubations resulting in 45–173 images. All liposomes and tubules visible were evaluated. The numbers of liposomes, therefore, were very high and ranged from n = 518–3,151 liposomes, while the numbers of observed tubules were much lower and much more variable, as this depended on the tubulation activity observed in the respective condition and the number of images recorded (n = 13–157; Figs. 4 and S3). Density calculations were based on the full systematic grid explorations (i.e., also null profiles were included; Fig. 4 J).
CryoTEM was not done quantitatively, as this method does not offer sufficiently large fields of view. The diameters of syndapin I–induced tubules were measured and averaged from n = 41 tubules from two independent assays (Fig. S3 E).
Quantitative examinations of the frequency of dendritic protrusion starts in control and ankycorbin RNAi neurons by 3D time-lapse imaging were based on n = 19 dendritic segments per conditions that were recorded from seven and six transfected neurons, respectively. The cells recorded were from three to four independent coverslips and two independent neuronal preparations (Fig. 7 K).
Ratiometric determinations of ankycorbin, syndapin I, and fluorescent control protein accumulations at nascent dendritic branching points were done at 19/19/22 dendritic branch induction sites identified by 3D-time lapse imaging of five to six transfected neurons from three to four independent neuronal preparations (Fig. 5).
No outlier suggestions were computed. No data points were excluded, but all quantitative evaluation data points were taken into account and averaged to fully represent biological and technical variabilities.
Quantitative data shown represent mean and SEM. Quantitative data is usually shown as bar plots with individual data points (exceptions are e.g., the Sholl analyses shown in Figs. 6, 7, 9, and S4, for which this is not useful due to the axis stretching that would be necessary).
Statistical analyses were done using GraphPad Prism software. The normality of data distribution is evident from the statistical tests used. Statistical significance calculations were done by using either one-way ANOVA and Tukey post-tests or by using Kruskal-Wallis and Dunn’s multiple comparisons. Comparisons of only two conditions were done by Welch’s t test and Mann–Whitney test, respectively, or were analyzed by Student’s t test depending on whether the data were normally distributed or not. All Sholl analyses were tested by two-way ANOVA and Bonferroni post-tests. All statistical tests used are specified in detail in the figure legends.
Statistical significances were marked by *P < 0.05, **P < 0.01, ***P < 0.001, and ****P < 0.0001 throughout. Note that, because of the digits limit, the software is unable to report the exact values of P < 0.0001 (****). All other P values are directly reported within the figures.
Online supplemental material
Fig. S1 shows the anti-GST immunoblots of the coprecipitations of the different GFP-ankycorbin fusion proteins by immobilized GST-syndapin I SH3 domain shown in Fig. 1 D and the corresponding control experiment with immobilized GST as well as the anti-GFP immunoblotted supernatants of these experiments. Furthermore, experiments demonstrating that the syndapin I SH3 domain coprecipitates ankycorbin but not a splice variant thereof, which occurs in both mice and man and shows particularly low expression in gall bladder and brain, are shown. These experiments indicate that in the brain, ankycorbin/syndapin I interactions may be of particular importance, whereas in other tissues, additional ankycorbin variants exist that are decoupled from syndapins. Fig. S2 shows that the weak membrane binding of ankycorbin17-400 is susceptible to increasing salt concentrations and that, upon syndapin I presence, ankycorbin17-400 is not only held at the liposomes, as also shown in Fig. 3 F, but is even held at liposomes in a salt-insensitive manner. Fig. S3 displays examinations of membrane structures by incubations of liposomes and purified proteins by cryoTEM and furthermore contains a quantitative analysis of membrane tubule diameters formed by syndapin I in cryoTEM samples as well as quantitative analyses of membrane tubule diameters based on freeze-fracturing/TEM. Fig. S4 shows quantitative evaluations of dendritic branch point number, terminal point number, total dendritic arbor length, and Sholl analyses that demonstrate that ankycorbin-mediated dendritic branching requires the identified syndapin I-binding KRKAPPPP motif. Fig. S5 shows a GFP control experiment related to the coprecipitation of ankycorbin1-400-GFP with GST and the GST-SH3 domains of syndapin I, syndapin II-l, and syndapin III as well as of SNX18 shown in Fig. 8 D and presents coimmunoprecipitations of GFP-ankycorbin1-400 with Flag-syndapin II and Flag-syndapin III showing that besides syndapin I the other members of the syndapin family also interact with ankycorbin. Table S1 lists primers. Table S2 lists antibodies. Data S1 lists all numerical data of all quantitative analyses shown.
Data availability
All data generated or analyzed in this study are included in the manuscript and the supporting supplementary files. Numerical source data are provided as supplementary tables.
Acknowledgments
We thank S. Berr, K. Gluth, A. Kreusch, M. Öhler, M. Röder, B. Schade, and N. Ullrich for excellent technical assistance at different steps of the project. We furthermore thank A.G. Simonsen (Department of Molecular Medicine, Medicine University of Oslo, Oslo, Norway) for providing an SNX18-GFP-encoding plasmid. We gratefully acknowledge support from the Fritz Lipmann Institute Core Facility Proteomics, in particular Dr. K.H. Gührs.
This work was supported by Deutsche Forschungsgemeinschaft grants KE685/7-1 to M.M. Kessels and QU116/9-1 to B. Qualmann.
Author contributions: M. Izadi, D. Wolf, and E. Seemann conducted experiments and interpreted data. A. Ori designed and analyzed MS experiments. L. Schwintzer conducted the initial in silico screens, made tools, and validated screening hits. F. Steiniger helped E. Seemann to operate the cryoTEM. M. Izadi, D. Wolf, E. Seemann, and M.M. Kessels visualized data. M. Izadi co-wrote the manuscript. M.M. Kessels and B. Qualmann conceived the project, designed experiments, interpreted data, provided scientific supervision and funding, and wrote the manuscript.

