


Mitochondria play critical roles in cellular metabolism and to maintain their integrity, they are regulated by several quality control pathways, including mitophagy. During BNIP3/BNIP3L-dependent receptor-mediated mitophagy, mitochondria are selectively targeted for degradation by the direct recruitment of the autophagy protein LC3. BNIP3 and/or BNIP3L are upregulated situationally, for example during hypoxia and developmentally during erythrocyte maturation. However, it is not well understood how they are spatially regulated within the mitochondrial network to locally trigger mitophagy. Here, we find that the poorly characterized mitochondrial protein TMEM11 forms a complex with BNIP3 and BNIP3L and co-enriches at sites of mitophagosome formation. We find that mitophagy is hyper-active in the absence of TMEM11 during both normoxia and hypoxia-mimetic conditions due to an increase in BNIP3/BNIP3L mitophagy sites, supporting a model that TMEM11 spatially restricts mitophagosome formation.
Introduction
Mitochondria play fundamental roles in many cellular processes, including energy production, and are hubs of cellular metabolism. In order to effectively perform these jobs, mitochondria are organized into an extensive tubular network that is distributed throughout the cell. Mitochondria are enclosed by two membrane bilayers and the inner mitochondrial membrane (IMM) forms elaborate cristae invaginations that compartmentalize the process of oxidative phosphorylation (Pfanner et al., 2019). Several interrelated processes contribute to the spatial organization of mitochondria, including dynamic movements along the cytoskeleton, division and fusion of the organelle, cristae shaping and organizing proteins inside mitochondria, and quality control mechanisms that ensure functional integrity of the organelle. However, we still lack a complete mechanistic understanding of each of these individual processes and how they are coordinated to contribute to the homeostasis of the mitochondrial network.
Mitochondria respiratory function is maintained by the physical organization of cristae membranes inside the organelle. Several determinants influence the shape of cristae, including phospholipids, dimerization of ATP synthase, the IMM fusion protein OPA1, and the Mitochondrial Contact Site and Cristae Organizing System (MICOS) complex. The conserved MICOS complex, comprised of seven core subunits in human cells, enriches at cristae junctions, sites of cristae invagination, and is thought to stabilize their architecture (Colina-Tenorio et al., 2020). However, MICOS also associates in a mega-complex, termed the Mitochondrial Bridging Complex (MIB), with proteins on the outer mitochondrial membrane (OMM), including the β-barrel assembly SAM complex (Ott et al., 2012). MICOS/MIB also physically interacts with OMM mitochondrial network shaping proteins such as the mitochondrial motility factor Miro (Li et al., 2021; Modi et al., 2019). Thus, MICOS/MIB spans the intermembrane space and can coordinate mitochondrial internal organization with external determinants.
Mitochondrial function depends not only on the internal shape of cristae membranes but also on processes that maintain the overall performance of the network. Several quality control processes deal with insults such as inappropriate protein targeting or unfolded proteins (Ng et al., 2021). During severe stress that causes the inability of mitochondria to maintain membrane potential, the PINK1/Parkin pathway mediates turnover of the organelle by mitophagy. However, basal mitophagy has been observed in vivo independent of the PINK1/Parkin pathway (Lee et al., 2018; McWilliams et al., 2018). Alternative pathways include receptor-mediated mitophagy, whereby OMM proteins can selectively recruit the autophagy protein LC3 through cytosolically exposed LC3-interacting motifs (LIR domains; Liu et al., 2014). The best characterized of these mitophagy receptors are the BCL2 family members BNIP3 and BNIP3L, which are upregulated to deal with stress insults such as hypoxia and mediate mitophagy during developmental processes (Bellot et al., 2009; Moriyama et al., 2014; Novak et al., 2010; Ordureau et al., 2021; Sandoval et al., 2008; Schweers et al., 2007; Simpson et al., 2021; Zhang et al., 2008). However, BNIP3 and BNIP3L can frequently be detected at lower levels on mitochondria prior to such upregulation (Bellot et al., 2009; Glick et al., 2012; Ordureau et al., 2021), raising the question of how these proteins are regulated at steady state. Additionally, it is not understood if and how these proteins are spatially controlled within the mitochondrial network to locally mediate mitophagy.
Previously, the IMM protein TMEM11 has been functionally implicated in cristae organization, though how it contributes to mitochondrial morphology is unknown. Depletion of TMEM11 in human cells and mutations in the Drosophila homolog of TMEM11 (PMI) cause severe mitochondrial morphology defects, including mitochondrial enlargement and aberrantly elongated cristae (Macchi et al., 2013; Rival et al., 2011). These mitochondrial morphology defects correspond to whole animal physiological defects, and TMEM11/PMI mutant flies have motor neuron defects and reduced lifespan (Macchi et al., 2013). While high throughput yeast two-hybrid interactome data originally implicated TMEM11 as a BNIP3/BNIP3L interactor (Rual et al., 2005), these data are inconsistent with its previously characterized localization to the IMM (Rival et al., 2011). More recently, proteomic analysis of several MICOS components commonly identified TMEM11 as a MICOS interactor and putative auxiliary subunit (Guarani et al., 2015), which is consistent with the mitochondrial morphology defects that occur in its absence.
Here, we explore the functional role of TMEM11 and its contribution to mitochondrial morphology and function in human cells. We find that while TMEM11 associates with the MICOS complex, it localizes to the OMM where it directly interacts and stably forms a complex with the mitophagy receptors BNIP3 and BNIP3L. Further, we find that that BNIP3 and BNIP3L are primarily responsible for the mitochondrial morphology defects of TMEM11-depleted cells and loss of TMEM11 sensitizes cells to mitophagy mediated by BNIP3/BNIP3L. We examine the mitochondrial sub-localization of TMEM11 and BNIP3/BNIP3L during mitophagy induction and discover that they spatially co-enrich at mitophagy sites. Finally, we show that the increase in mitophagy that occurs in the absence of TMEM11 is likely due to an increase in BNIP3/BNIP3L mitophagy sites. Thus, our data are consistent with a model that TMEM11 influences BNIP3/BNIP3L receptor-mediated mitophagy by spatially limiting sites of their activation within the mitochondrial network.
Results
TMEM11 is required for the maintenance of normal mitochondrial morphology
To ascertain the functional role of TMEM11, we utilized CRISPR interference (CRISPRi; Qi et al., 2013) to stably deplete TMEM11 from U2OS cells. Cells constitutively expressing the transcriptional repressor dCas9-KRAB (Le Vasseur et al., 2021) were transduced with an integrating lentiviral plasmid co-expressing TagBFP and either a scrambled control sgRNA or sgRNAs targeting the transcription start site of TMEM11, and TagBFP-positive cells were selected by FACS. Two different stable knockdown lines were generated that exhibited nearly complete depletion of TMEM11 as assayed by Western analysis (Fig. 1 A). We then stained cells with the vital dye Mitotracker and examined mitochondrial morphology by fluorescence microscopy (Fig. 1 B). In accordance with previous work (Rival et al., 2011), more than half of the cells in each TMEM11-depleted cell line exhibited mitochondria that were enlarged and/or bulbous as compared to the narrow tubular mitochondria observed in control cells (Fig. 1, B and C).
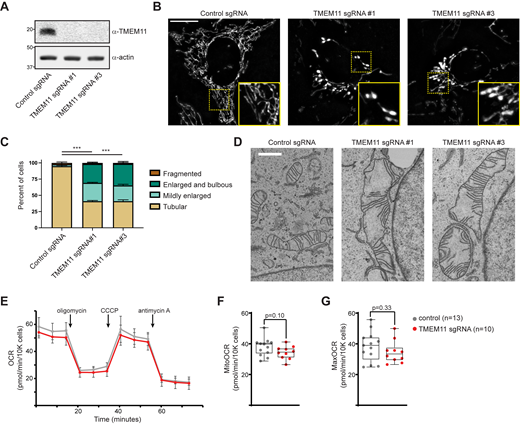
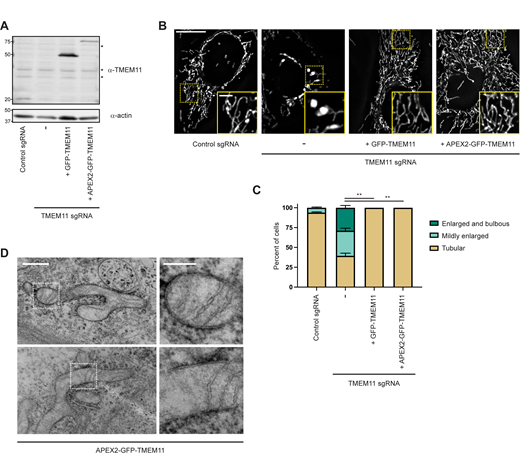
TMEM11 is required for maintenance of normal mitochondrial morphology. (A) Western blot analysis of whole cell lysates from U2OS CRISPRi cells expressing scrambled control sgRNA or sgRNAs targeting TMEM11 and probed with the indicated antibodies. (B) Deconvolved maximum intensity projections of fluorescence microscopy images are shown of U2OS CRISPRi cells stably expressing the indicated sgRNAs and stained with the mitochondrial dye Mitotracker Deep Red. Insets correspond to dotted boxes. Scale bars = 15 µm (3 µm on magnification). (C) A graph of the categorization of mitochondrial morphology from cells as in B. Data shown represent ∼100 cells per condition in each of three independent experiments and bars indicate SEM. Asterisks (***P < 0.001) represent unpaired two-tailed t test. (D) Representative electron micrographs of mitochondria from CRISPRi cells expressing the indicated sgRNA. Scale bar = 1 µm. (E) Representative OCR in CRISPRi cells expressing control sgRNA (gray) or TMEM11 sgRNA #3 (red) from the indicated number of replicates. Mitochondrial inhibitors were injected at the indicated timepoints. (F and G) Quantification of basal mitochondrial OCR (F) and maximal (post-CCCP) OCR (G) in the indicated cell lines. Statistical significance (F and G) was assessed using a two-tailed t test. Source data are available for this figure: SourceData F1.
TMEM11 is required for maintenance of normal mitochondrial morphology. (A) Western blot analysis of whole cell lysates from U2OS CRISPRi cells expressing scrambled control sgRNA or sgRNAs targeting TMEM11 and probed with the indicated antibodies. (B) Deconvolved maximum intensity projections of fluorescence microscopy images are shown of U2OS CRISPRi cells stably expressing the indicated sgRNAs and stained with the mitochondrial dye Mitotracker Deep Red. Insets correspond to dotted boxes. Scale bars = 15 µm (3 µm on magnification). (C) A graph of the categorization of mitochondrial morphology from cells as in B. Data shown represent ∼100 cells per condition in each of three independent experiments and bars indicate SEM. Asterisks (***P < 0.001) represent unpaired two-tailed t test. (D) Representative electron micrographs of mitochondria from CRISPRi cells expressing the indicated sgRNA. Scale bar = 1 µm. (E) Representative OCR in CRISPRi cells expressing control sgRNA (gray) or TMEM11 sgRNA #3 (red) from the indicated number of replicates. Mitochondrial inhibitors were injected at the indicated timepoints. (F and G) Quantification of basal mitochondrial OCR (F) and maximal (post-CCCP) OCR (G) in the indicated cell lines. Statistical significance (F and G) was assessed using a two-tailed t test. Source data are available for this figure: SourceData F1.
Consistent with its function in human cells, the Drosophila TMEM11 homolog PMI is required for the maintenance of normal mitochondrial morphology in flies (Rival et al., 2011). Electron microscopy (EM) analysis of adult brain neuron cell bodies and adult flight muscle from PMI mutant flies revealed that mitochondria were enlarged and exhibited elongated and curved cristae membranes compared to those of wild-type flies (Macchi et al., 2013). We therefore decided to examine cristae morphology in TMEM11-depleted cells by EM. Strikingly, and consistent with our fluorescence microscopy analysis and the previous EM of PMI mutant flies, mitochondria were frequently enlarged in TMEM11-depleted cells (Fig. 1 D). Cristae membranes also were curved and/or highly elongated, frequently spanning the width of the enlarged mitochondria (Fig. 1 D). These data suggest that TMEM11 contributes to mitochondrial morphology in a conserved manner.
To further characterize defects associated with loss of TMEM11 and determine whether the mitochondrial morphology defect of TMEM11 depletion leads to respiratory dysfunction, we analyzed cellular oxygen consumption rates (OCR; Fig. 1 E). Despite severe alterations in mitochondrial morphology, basal OCR (Fig. 1 F) and maximal OCR (Fig. 1 G) were minimally affected in TMEM11-depleted cells. Thus, despite the drastic alteration in mitochondrial morphology in the absence of TMEM11, mitochondrial respiratory function was largely unaffected.
TMEM11 is not required for stability or assembly of the MICOS/MIB complex
Previous proteomic analysis of multiple MICOS subunits identified TMEM11 as a common interacting protein (Guarani et al., 2015). Based on the observed defects of mitochondrial morphology in TMEM11-depleted cells (Fig. 1 D) and its annotated localization to the IMM (Rival et al., 2011) where it interacts with the MICOS complex, we considered the possibility that TMEM11 associates with the assembled MICOS complex. In mammalian cells, because MICOS subunits assemble into a core complex as well as the MIB complex, its subunits compose complexes that range in size between ∼700 kD and ∼2.2 megadaltons in two-dimensional Blue Native PAGE (2D BN-PAGE) gels (Huynen et al., 2016). To compare the relative size of TMEM11, we performed 2D BN-PAGE of digitonin-solubilized mitochondria purified from U2OS CRISPRi cells expressing control sgRNA (Fig. 2 A). While a small amount of TMEM11 assembled into large complexes in contrast-enhanced blots, consistent with the size of MICOS, the majority of TMEM11 appeared at smaller molecular weights between ∼60 and 700 kD.
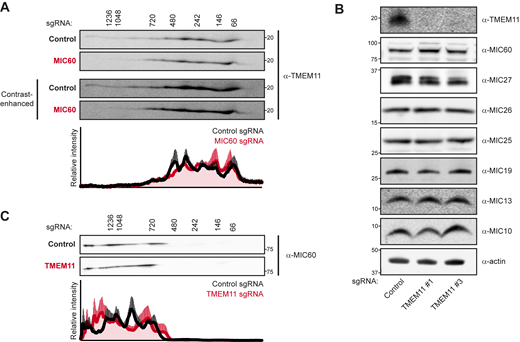
TMEM11 is not required for stability or assembly of the MICOS/MIB complex. (A) Two-dimensional (2D) BN-PAGE and Western analysis of mitochondria isolated from U2OS CRISPRi cells expressing control or MIC60-targeted sgRNAs and probed with TMEM11 antibody. The molecular weight of assemblies as determined by the first dimension of BN-PAGE are displayed vertically above images. Contrast-enhanced blots are displayed at bottom to enable visualization of higher molecular weight assemblies of TMEM11. Blots shown are representative of three independent replicates and the quantification displays the average and SEM of normalized relative intensity profiles for each position along the x-axis of control sgRNA (black line) or MIC60 sgRNA (red line) expressing cells. (B) Western blot analysis of whole cell lysates from cells expressing the indicated sgRNA and probed with the indicated antibodies. (C) 2D BN-PAGE and Western analysis as in A from mitochondria isolated from cells expressing control or TMEM11-targeted sgRNAs and probed with MIC60 antibody. Blots shown are representative of three independent experiments. See also Fig. S2 A. Source data are available for this figure: SourceData F2.
TMEM11 is not required for stability or assembly of the MICOS/MIB complex. (A) Two-dimensional (2D) BN-PAGE and Western analysis of mitochondria isolated from U2OS CRISPRi cells expressing control or MIC60-targeted sgRNAs and probed with TMEM11 antibody. The molecular weight of assemblies as determined by the first dimension of BN-PAGE are displayed vertically above images. Contrast-enhanced blots are displayed at bottom to enable visualization of higher molecular weight assemblies of TMEM11. Blots shown are representative of three independent replicates and the quantification displays the average and SEM of normalized relative intensity profiles for each position along the x-axis of control sgRNA (black line) or MIC60 sgRNA (red line) expressing cells. (B) Western blot analysis of whole cell lysates from cells expressing the indicated sgRNA and probed with the indicated antibodies. (C) 2D BN-PAGE and Western analysis as in A from mitochondria isolated from cells expressing control or TMEM11-targeted sgRNAs and probed with MIC60 antibody. Blots shown are representative of three independent experiments. See also Fig. S2 A. Source data are available for this figure: SourceData F2.
To determine whether the pool of larger TMEM11 assemblies may associate with the MICOS complex, we used multiple sgRNAs to generate cells stably depleted of the core MICOS subunit MIC60 using CRISPRi, loss of which was previously shown to destabilize the MICOS complex (Ott et al., 2015; Stephan et al., 2020). Consistent with published observations, loss of MIC60 led to destabilization of other MICOS subunits and to mitochondrial morphology defects apparent by fluorescence microscopy and EM (Fig. S1). We examined TMEM11 stability in the absence of MIC60 and found that, unlike other MICOS subunits, TMEM11 protein levels were unaffected by MIC60 depletion (Fig. S1 A). We then purified mitochondria from MIC60-depleted cells (sgRNA #1) and asked whether TMEM11 assembly size was affected in 2D BN-PAGE gels. While the majority of TMEM11 was sized less than ∼700 kD, there was a mild but reproducible depletion of the minor amount of TMEM11 that migrated at a larger molecular weight (Fig. 2 A). These data suggest that a small portion of TMEM11 assembles in MICOS/MIB-sized complex in a MICOS-dependent manner.
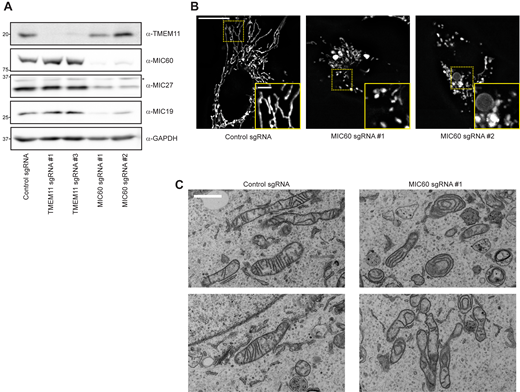
Depletion of the MICOS complex does not affect TMEM11 stability. (A) Western blot analysis of whole cell lysates from U2OS CRISPRi cells expressing scrambled control sgRNA or the indicated sgRNAs targeting TMEM11 or MIC60 and probed with the indicated antibodies. (B) Deconvolved maximum intensity projections of fluorescence microscopy images are shown of U2OS CRISPRi cells stably expressing the indicated sgRNAs and stained with Mitotracker Deep Red. Insets correspond to dotted boxes. Scale bar = 15 µm (3 µm on magnification). (C) Representative electron micrographs of mitochondria from CRISPRi cells expressing control sgRNA (left) or sgRNA targeting MIC60. Scale bar = 1 µm. Source data are available for this figure: SourceData FS1.
Depletion of the MICOS complex does not affect TMEM11 stability. (A) Western blot analysis of whole cell lysates from U2OS CRISPRi cells expressing scrambled control sgRNA or the indicated sgRNAs targeting TMEM11 or MIC60 and probed with the indicated antibodies. (B) Deconvolved maximum intensity projections of fluorescence microscopy images are shown of U2OS CRISPRi cells stably expressing the indicated sgRNAs and stained with Mitotracker Deep Red. Insets correspond to dotted boxes. Scale bar = 15 µm (3 µm on magnification). (C) Representative electron micrographs of mitochondria from CRISPRi cells expressing control sgRNA (left) or sgRNA targeting MIC60. Scale bar = 1 µm. Source data are available for this figure: SourceData FS1.
We next asked whether MICOS protein stability was affected in TMEM11-depleted cells (sgRNA #3), which we reasoned could potentially explain the mitochondrial morphology defect observed in the absence of TMEM11. We examined the stability of each MICOS subunit by Western analysis of whole cell lysates obtained from control and TMEM11-depleted cells. However, depletion of TMEM11 did not affect the stability of any MICOS subunit (Fig. 2 B).
Given that the majority of TMEM11 assembled into smaller-sized complexes than MICOS, we then considered that these may represent sub-complex assemblies of the MICOS complex and that a role of TMEM11 could be to promote MICOS assembly. In this case, MICOS complex assembly rather than individual subunit stability may be affected in the absence of TMEM11. To test this possibility, we performed 2D BN-PAGE analysis and compared the assembly size of each of the core MICOS subunits in control versus TMEM11-depleted mitochondria. However, we observed no changes in the assembly size of MICOS subunits or the MIB proteins SAMM50 or DNAJC11 (Fig. 2 C and Fig. S2 A). Altogether, these data indicate that although TMEM11 can assemble into larger molecular weight complexes that require MICOS for their formation, defects in MICOS stability or assembly do not likely explain the mitochondrial morphology defects observed in the absence of TMEM11.
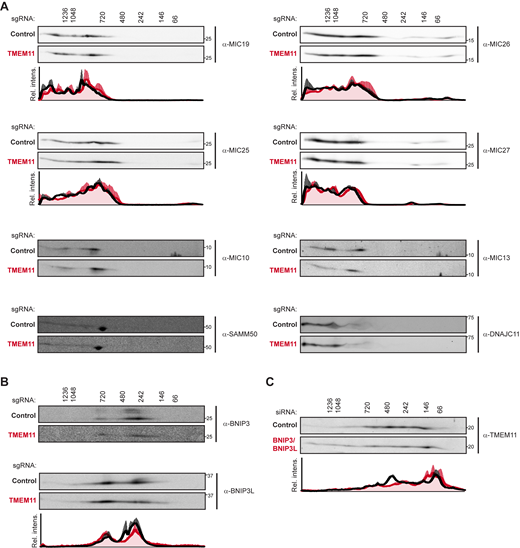
Additional 2D BN-PAGE analyses. (A) 2D BN-PAGE and Western analysis of mitochondria isolated from U2OS CRISPRi cells expressing control (black lines on associated graphs) or TMEM11-targeted (red lines on associated graphs) sgRNAs and probed with the indicated MICOS/MIB antibodies. The molecular weight of assemblies as determined by the first dimension of BN-PAGE are displayed vertically above images. Blots shown are representative of at least two independent replicates. The associated plots display the average and range of normalized relative intensity profiles for each position along the x-axis. Plots are not shown for samples whose low signal-to-noise prevented reliable quantification. (B) As in A for isolated mitochondria probed with antibody against BNIP3 (top) and BNIP3L (bottom). Blots shown are representative of two (BNIP3) or three (BNIP3L) independent experiments and plot displays average and SEM for each position along the x-axis. (C) As in B for mitochondria isolated from U2OS control cells (black lines on associated graph) or mitochondria from cells treated with siRNA targeting BNIP3 and BNIP3L (red lines on associated graph). Blots shown are representative of four independent experiments and graph displays average and SEM for each position along the x-axis. Source data are available for this figure: SourceData FS2.
Additional 2D BN-PAGE analyses. (A) 2D BN-PAGE and Western analysis of mitochondria isolated from U2OS CRISPRi cells expressing control (black lines on associated graphs) or TMEM11-targeted (red lines on associated graphs) sgRNAs and probed with the indicated MICOS/MIB antibodies. The molecular weight of assemblies as determined by the first dimension of BN-PAGE are displayed vertically above images. Blots shown are representative of at least two independent replicates. The associated plots display the average and range of normalized relative intensity profiles for each position along the x-axis. Plots are not shown for samples whose low signal-to-noise prevented reliable quantification. (B) As in A for isolated mitochondria probed with antibody against BNIP3 (top) and BNIP3L (bottom). Blots shown are representative of two (BNIP3) or three (BNIP3L) independent experiments and plot displays average and SEM for each position along the x-axis. (C) As in B for mitochondria isolated from U2OS control cells (black lines on associated graph) or mitochondria from cells treated with siRNA targeting BNIP3 and BNIP3L (red lines on associated graph). Blots shown are representative of four independent experiments and graph displays average and SEM for each position along the x-axis. Source data are available for this figure: SourceData FS2.
TMEM11 is an outer mitochondrial membrane protein that interacts with the mitophagy receptors BNIP3 and BNIP3L
To gain insight into the mechanistic role of TMEM11, we dissected its sub-organelle localization and topology at mitochondria. We transduced TMEM11 CRISPRi cells with integrating lentiviral plasmids expressing GFP- or APEX2-GFP-tagged TMEM11 and selected for GFP-expressing cells by FACS. In both cases, TMEM11 was modestly overexpressed compared to endogenous levels (Fig. S3 A) and both constructs completely alleviated the mitochondrial morphology defects of TMEM11-depleted cells (Fig. S3, B and C). We then examined the mitochondrial sub-localization of TMEM11 by performing super-resolution SoRa confocal microscopy of GFP-TMEM11 expressing cells that were fixed and immunolabeled with antibodies targeting MIC60 as well as the matrix-localized protein HSP60. While MIC60 was concentrated at discrete focal structures consistent with its known enrichment at cristae junctions (Jans et al., 2013; Stoldt et al., 2019), TMEM11 appeared more uniformly distributed along the membrane (Fig. 3 A). However, TMEM11 also occasionally localized to discrete focal structures as compared to HSP60 that did not appear to co-localize with MIC60, suggesting it plays a functional role at distinct sites from the MICOS complex.
Mitochondrial morphology of TMEM11 CRISPRi cells can be rescued by reintroduction of N-terminally tagged TMEM11. (A) Western blot analysis with the indicated antibodies of whole cell lysates of CRISPRi cells expressing (left) control sgRNA or (right) TMEM11 sgRNA #3 cells that were lentivirally transduced with either GFP-TMEM11 or APEX2-GFP-TMEM11. Asterisks indicate cross-reacting bands. (B) Deconvolved fluorescence microscopy images are shown of cells as in A stained with Mitotracker Deep Red. Insets correspond to dotted boxes. Scale bar = 15 µm (3 µm on magnification). (C) A graph of the categorization of mitochondrial morphology from cells as in B. Data shown represent ∼100 cells per condition in each of three independent experiments and bars indicate SEM. Asterisks (**P < 0.01) represent unpaired two-tailed t test. (D) Additional examples of EM images from proximity labeling analysis of TMEM11 CRISPRi cells expressing APEX2-GFP-TMEM11. Enlargements (right) correspond to dotted boxes (left). Scale bar = 500 nm (200 nm on magnification). See also Fig. 3 B. Source data are available for this figure: SourceData FS3.
Mitochondrial morphology of TMEM11 CRISPRi cells can be rescued by reintroduction of N-terminally tagged TMEM11. (A) Western blot analysis with the indicated antibodies of whole cell lysates of CRISPRi cells expressing (left) control sgRNA or (right) TMEM11 sgRNA #3 cells that were lentivirally transduced with either GFP-TMEM11 or APEX2-GFP-TMEM11. Asterisks indicate cross-reacting bands. (B) Deconvolved fluorescence microscopy images are shown of cells as in A stained with Mitotracker Deep Red. Insets correspond to dotted boxes. Scale bar = 15 µm (3 µm on magnification). (C) A graph of the categorization of mitochondrial morphology from cells as in B. Data shown represent ∼100 cells per condition in each of three independent experiments and bars indicate SEM. Asterisks (**P < 0.01) represent unpaired two-tailed t test. (D) Additional examples of EM images from proximity labeling analysis of TMEM11 CRISPRi cells expressing APEX2-GFP-TMEM11. Enlargements (right) correspond to dotted boxes (left). Scale bar = 500 nm (200 nm on magnification). See also Fig. 3 B. Source data are available for this figure: SourceData FS3.
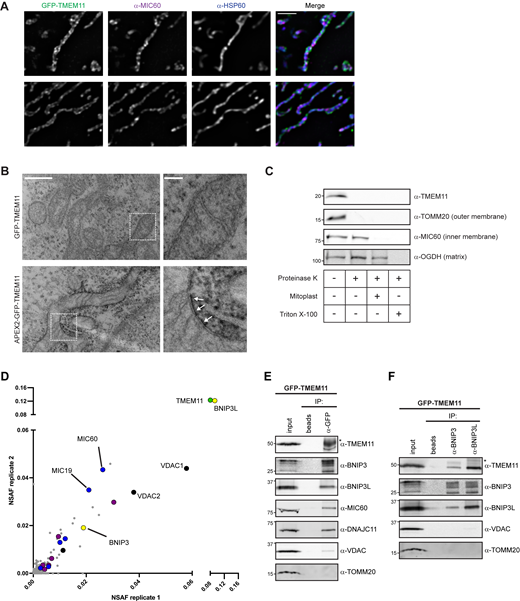
TMEM11 is an outer mitochondrial membrane protein that interacts with the mitophagy receptors BNIP3 and BNIP3L. (A) Single planes of deconvolved SoRa spinning disk confocal microscopy images are shown of U2OS TMEM11 CRISPRi cells expressing GFP-TMEM11 (green; see Fig. S3) that were fixed and immunolabeled with MIC60 (magenta) and the mitochondrial matrix marker HSP60 (blue). Scale bar = 2 µm. (B) Representative electron micrographs are shown from proximity labeling analysis of TMEM11 CRISPRi cells expressing GFP-TMEM11 (top) or APEX2-GFP-TMEM11 (bottom) and treated with DAB and H2O2 post-fixation. White arrows mark sites of DAB precipitation in cells expressing APEX2-GFP-TMEM11. Enlargements (right) correspond to dotted boxes (left). Scale bar = 500 nm (100 nm in magnification). See also Fig. S3 D. (C) Protease protection analysis of mitochondria isolated from wild type U2OS cells. Mitochondria were treated as indicated and Western analysis was performed with the indicated antibodies. Mitoplast sample indicates selective disruption of the OMM by a combination of osmotic swelling and mechanical disruption. OGDH antibody detects the matrix-localized α-ketoglutarate dehydrogenase. (D) A plot of NSAF scores from independent replicates of anti-GFP immunoprecipitation (IP) and mass spectrometry analysis of lysate from TMEM11 CRISPRi cells expressing GFP-TMEM11. TMEM11 self-identification is highlighted in green and BNIP3/BNIP3L are shown in yellow. Identified core MICOS subunits are highlighted in blue. MIB subunits and other MICOS/MIB-associated OMM proteins (SAMM50, MTX2, DNAJC11, MIRO1/2, ARMC1) are highlighted in magenta. VDAC family members are shown in black. See also Table S1. (E) Western analysis with the indicated antibodies of IP of lysates from GFP-TMEM11-expressing cells with anti-GFP antibody or beads alone. 4% of the total input and 10% of the eluate from each IP were loaded. The asterisk indicates IgG heavy chain. (F) IPs were performed as in E with anti-BNIP3 and anti-BNIP3L antibodies. All blots shown in E and F are representative of at least two independent replicates. Source data are available for this figure: SourceData F3.
TMEM11 is an outer mitochondrial membrane protein that interacts with the mitophagy receptors BNIP3 and BNIP3L. (A) Single planes of deconvolved SoRa spinning disk confocal microscopy images are shown of U2OS TMEM11 CRISPRi cells expressing GFP-TMEM11 (green; see Fig. S3) that were fixed and immunolabeled with MIC60 (magenta) and the mitochondrial matrix marker HSP60 (blue). Scale bar = 2 µm. (B) Representative electron micrographs are shown from proximity labeling analysis of TMEM11 CRISPRi cells expressing GFP-TMEM11 (top) or APEX2-GFP-TMEM11 (bottom) and treated with DAB and H2O2 post-fixation. White arrows mark sites of DAB precipitation in cells expressing APEX2-GFP-TMEM11. Enlargements (right) correspond to dotted boxes (left). Scale bar = 500 nm (100 nm in magnification). See also Fig. S3 D. (C) Protease protection analysis of mitochondria isolated from wild type U2OS cells. Mitochondria were treated as indicated and Western analysis was performed with the indicated antibodies. Mitoplast sample indicates selective disruption of the OMM by a combination of osmotic swelling and mechanical disruption. OGDH antibody detects the matrix-localized α-ketoglutarate dehydrogenase. (D) A plot of NSAF scores from independent replicates of anti-GFP immunoprecipitation (IP) and mass spectrometry analysis of lysate from TMEM11 CRISPRi cells expressing GFP-TMEM11. TMEM11 self-identification is highlighted in green and BNIP3/BNIP3L are shown in yellow. Identified core MICOS subunits are highlighted in blue. MIB subunits and other MICOS/MIB-associated OMM proteins (SAMM50, MTX2, DNAJC11, MIRO1/2, ARMC1) are highlighted in magenta. VDAC family members are shown in black. See also Table S1. (E) Western analysis with the indicated antibodies of IP of lysates from GFP-TMEM11-expressing cells with anti-GFP antibody or beads alone. 4% of the total input and 10% of the eluate from each IP were loaded. The asterisk indicates IgG heavy chain. (F) IPs were performed as in E with anti-BNIP3 and anti-BNIP3L antibodies. All blots shown in E and F are representative of at least two independent replicates. Source data are available for this figure: SourceData F3.
Next, to examine TMEM11 localization relative to mitochondria ultrastructure, we utilized proximity-based APEX labeling to visualize TMEM11 localization on EM images (Lam et al., 2015; Martell et al., 2012). We treated both GFP-TMEM11 and APEX2-GFP-TMEM11 expressing cells post-fixation with 3,3′-diaminobenzidine (DAB) and H2O2 before subsequent sample preparation for EM. In contrast to GFP-TMEM11 expressing cells, which had no apparent staining, cells expressing APEX2-GFP-TMEM11 formed a dark precipitate near mitochondria in EM sections (Fig. 3 B and Fig. S3 D). Surprisingly, the DAB precipitate appeared on the exterior of mitochondria, suggesting the APEX2 tag was exposed to the cytosol and consistent with the localization of an OMM protein.
As TMEM11 has previously been reported to localize to the IMM, we next sought to re-assess the localization of endogenous TMEM11 using a protease protection assay. Intact mitochondria were isolated from U2OS cells by differential centrifugation and treated with proteinase K before or after disruption of the OMM. While the IMM protein MIC60 was protected from digestion unless the OMM was ruptured, both TMEM11 and TOMM20 were completely digested by addition of proteinase K to intact mitochondria (Fig. 3 C). Altogether, these data indicate that TMEM11 is an OMM protein with a distinct localization from MICOS/MIB complexes.
Given the localization of TMEM11 to the OMM, we next sought to identify TMEM11 interaction partners to understand its functional role. We performed immunoprecipitations and mass spectrometry–based proteomic analysis of lysate from cells stably expressing GFP-TMEM11 with either anti-GFP antibody coupled to Protein G beads, or beads alone. Proteins that were identified in control samples were background-subtracted and unique interacting proteins were assigned a normalized spectral abundance factor (NSAF) score accounting for protein molecular weight (Zybailov et al., 2006). Consistent with prior proteomic analysis of MICOS subunits (Guarani et al., 2015) and our 2D BN-PAGE analysis, proteomic analysis of TMEM11 robustly identified nearly every core member of the MICOS complex, including MIC60 and MIC19 (Fig. 3 D, blue, and Table S1). However, several proteins annotated to localize to the OMM were identified, including MIB components SAMM50, MTX2, and DNAJC11, and other known MICOS interactors such as MIRO1, MIRO2, and ARMC1 (Fig. 3 D, magenta; Huynen et al., 2016; Modi et al., 2019; Wagner et al., 2019). However, the top scoring interactor was BCL2-interacting protein 3-like (BNIP3L; also known as NIX), a protein implicated in receptor-mediated mitophagy (Fig. 3 D, yellow). Other abundant interactors included BNIP3, a BNIP3L paralog, as well as all three voltage-dependent anion channel (VDAC) family members (Fig. 3 D, black). BNIP3 and BNIP3L were of particular interest as these proteins were previously identified as reciprocal TMEM11 interactors in large-scale yeast two-hybrid screens (Luck et al., 2020).
To validate the results of our proteomic analysis, we performed immunoprecipitations of lysates from GFP-TMEM11 expressing cells with anti-GFP antibody (Fig. 3 E) and immunoblotted for BNIP3L, BNIP3, VDAC, MIC60, DNAJC11, and TOMM20. TMEM11 robustly interacted with both BNIP3 and BNIP3L as well as the MICOS/MIB subunits MIC60 and DNAJC11. A less robust interaction with VDAC could also be detected. The abundant OMM protein TOMM20 failed to interact with TMEM11, indicating that the positive interactions were specific. TMEM11 could also be reciprocally identified from lysates from GFP-TMEM11 expressing cells that were immunoprecipitated with BNIP3 or BNIP3L antibodies (Fig. 3 F).
TMEM11 forms a complex with BNIP3 and BNIP3L
We next ascertained whether BNIP3 and BNIP3L were part of similarly sized molecular weight complexes that we observed for TMEM11 (Fig. 2 A). We performed 2D BN-PAGE analysis of mitochondria isolated from U2OS CRISPRi cells expressing control sgRNA and probed for BNIP3 and BNIP3L. Both BNIP3 and BNIP3L appeared most enriched at ∼400 kD, though migrated as part of both larger and smaller species (Fig. 4 A). While TMEM11 assembled in a wider range of sizes, it also was discretely enriched at a similar size to BNIP3 and BNIP3L (Fig. 4 A, compare black intensity profiles). By comparison, VDAC1 predominantly assembled into slightly larger molecular weight complexes of around ∼600 kD, consistent with previous analysis (Konig et al., 2021).
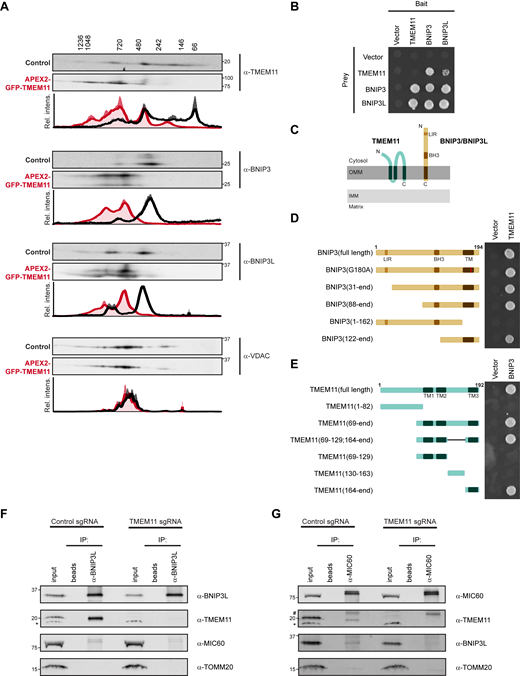
TMEM11 forms a complex with BNIP3 and BNIP3L. (A) 2D BN-PAGE and Western analysis with the indicated antibodies from mitochondria isolated from U2OS CRISPRi control cells (black lines on associated graphs) or cells expressing APEX2-GFP-TMEM11 (red lines on associated graphs). The molecular weight of assemblies as determined by the first dimension of BN-PAGE are displayed vertically above images. Blots shown are representative of two independent replicates and the quantification below each displays the average and range of normalized relative intensity profiles for each position along the x-axis. (B) Yeast two-hybrid growth analysis of strains expressing the indicated bait and prey proteins and spotted on selective (-histidine) plates. (C) A cartoon depicting the topology of BNIP3 and putative topology of TMEM11 based on APEX2 proximity labeling, protease protection assay, and transmembrane domain prediction software. (D) Yeast two-hybrid analysis as in B for the indicated truncations of BNIP3 tested for interaction with TMEM11. (E) Yeast two-hybrid analysis as in B for the indicated truncations of TMEM11 tested for interaction with BNIP3. (F) Western analysis with the indicated antibodies of IP of lysates from U2OS CRISPRi control and TMEM11 sgRNA-expressing cells with BNIP3L antibody or beads alone. 4% of the total input and 20% of the eluate from each IP were loaded. The asterisk marks a cross-reacting band. (G) As in F for IPs with MIC60 antibody. The hashtag indicates IgG. Blots are representative of two independent experiments. Source data are available for this figure: SourceData F4.
TMEM11 forms a complex with BNIP3 and BNIP3L. (A) 2D BN-PAGE and Western analysis with the indicated antibodies from mitochondria isolated from U2OS CRISPRi control cells (black lines on associated graphs) or cells expressing APEX2-GFP-TMEM11 (red lines on associated graphs). The molecular weight of assemblies as determined by the first dimension of BN-PAGE are displayed vertically above images. Blots shown are representative of two independent replicates and the quantification below each displays the average and range of normalized relative intensity profiles for each position along the x-axis. (B) Yeast two-hybrid growth analysis of strains expressing the indicated bait and prey proteins and spotted on selective (-histidine) plates. (C) A cartoon depicting the topology of BNIP3 and putative topology of TMEM11 based on APEX2 proximity labeling, protease protection assay, and transmembrane domain prediction software. (D) Yeast two-hybrid analysis as in B for the indicated truncations of BNIP3 tested for interaction with TMEM11. (E) Yeast two-hybrid analysis as in B for the indicated truncations of TMEM11 tested for interaction with BNIP3. (F) Western analysis with the indicated antibodies of IP of lysates from U2OS CRISPRi control and TMEM11 sgRNA-expressing cells with BNIP3L antibody or beads alone. 4% of the total input and 20% of the eluate from each IP were loaded. The asterisk marks a cross-reacting band. (G) As in F for IPs with MIC60 antibody. The hashtag indicates IgG. Blots are representative of two independent experiments. Source data are available for this figure: SourceData F4.
To further dissect the relationship between TMEM11 and BNIP3/BNIP3L, we took advantage of the increased size of the tandem APEX2-GFP fusion to TMEM11. We reasoned that if BNIP3 and BNIP3L are in a bona fide complex with TMEM11, that their size would correspondingly increase to the increased size of the TMEM11 fusion. Indeed, TMEM11 shifted to a larger molecular weight and was noticeably absent at smaller sizes in 2D BN-PAGE analysis performed on mitochondria isolated from APEX2-GFP-TMEM11 expressing cells (see Fig. 4 A, compare red and black intensity profiles). Likewise, both BNIP3 and BNIP3L correspondingly increased in size to a similar sized complex as TMEM11 (Fig. 4 A). Importantly, VDAC1, while interacting with TMEM11 in our proteomic analysis, was unaffected by expression of APEX2-GFP-TMEM11, indicating that the association between TMEM11 and BNIP3/BNIP3L was specific (Fig. 4 A).
We additionally asked how loss of TMEM11 or BNIP3/BNIP3L impacted the assembly size of the other. The size of BNIP3/BNIP3L assemblies did not appear affected by loss of TMEM11, while a portion of TMEM11 shifted to a lower size in the absence of BNIP3 and BNIP3L (Fig. S2, B and C). However, these data may be explained by the residual amount of protein remaining in respective knockdown cells and also may reflect additional proteins that complex with both TMEM11 and BNIP3/BNIP3L. Regardless, the robust shift toward higher molecular weight complexes we observed in the presence of tagged TMEM11 indicate that TMEM11, BNIP3, and BNIP3L can associate in a protein complex.
Next, to determine whether TMEM11, BNIP3, and BNIP3L could directly interact, we recapitulated published interactome data (Luck et al., 2020) by expressing each construct in a yeast two-hybrid system. While this assay did not detect TMEM11 self-interaction, BNIP3 and BNIP3L interacted with each other and with TMEM11 (Fig. 4 B). Thus, TMEM11 is able to directly interact with BNIP3 and BNIP3L. We then utilized the yeast two-hybrid system to explore the nature of the interaction between TMEM11 and BNIP3/BNIP3L in greater detail. BNIP3 and BNIP3L are anchored in the OMM with a C-terminal transmembrane domain (Fig. 4 C). Based on our proximity labeling analysis (Fig. 3 B) and in silico analysis with transmembrane prediction programs, TMEM11 likely has two soluble regions exposed to the cytosol interspersed with three transmembrane domains, the last at the C-terminus of the protein (Fig. 4 C). Meanwhile, the cytosol-facing soluble domains of BNIP3 and BNIP3L each contain an LIR domain required for LC3 recruitment to mitochondria to promote mitophagy, as well as an atypical BH3 domain (Ney, 2015; Fig. 4 C). Additionally, BNIP3 and BNIP3L mitophagy activity depends on their ability to homo-dimerize through transmembrane domain interactions (Marinkovic et al., 2021).
To test whether the functional domains of BNIP3 are required for an interaction with TMEM11, we expressed a series of BNIP3 truncations as well as a point mutation that blocks BNIP3 dimerization (G180A; Sulistijo et al., 2003) in the yeast two-hybrid system. These experiments suggest that TMEM11 does not require known functional domains of BNIP3 for its interaction (Fig. 4 D). Instead, a C-terminal region of BNIP3 that contains a short soluble fragment and the transmembrane domain is sufficient to interact with TMEM11. We then reciprocally tested TMEM11 truncations for their ability to interact with full length BNIP3. Similar to BNIP3, we found that the TMEM11 C-terminal transmembrane domain and proximal region are sufficient to mediate an interaction with BNIP3 in the yeast two-hybrid system (Fig. 4 E). Altogether, this analysis suggests that BNIP3 and TMEM11 can interact through their transmembrane domains or an immediately proximal region, and that the functional domains of BNIP3 are not required for an interaction.
While our data suggest that tagged overexpressed TMEM11 can form a complex with BNIP3/BNIP3L, and a direct interaction could be detected between the proteins when expressed in yeast, we wanted to validate their interaction under native conditions. We thus performed immunoprecipitation of endogenous BNIP3L from lysates of control CRISPRi cells. In agreement with observations in GFP-TMEM11 overexpressing cells, native BNIP3L robustly interacted with TMEM11 but failed to interact with the OMM protein TOMM20 (Fig. 4 F).
To further explore the relationship between the MICOS complex and TMEM11, we immunoprecipitated MIC60 from control sgRNA-expressing lysates and blotted for TMEM11. Consistent with GFP-TMEM11 overexpressing cells as well as previous observations in HEK 293T cells (Guarani et al., 2015), endogenous MIC60 interacted with TMEM11 (Fig. 4 G), though this interaction was notably less robust than that between TMEM11 and BNIP3L. Interestingly, we also found that both BNIP3L and MIC60 reciprocally interacted to a small degree (Fig. 4, F and G). We considered whether the association between MICOS and BNIP3L could be mediated indirectly through their interaction with TMEM11. We performed immunoprecipitations with BNIP3L and MIC60 in lysates from TMEM11-depleted cells and found that knockdown of TMEM11 reduces, but does not completely prevent, association between MIC60 and BNIP3L (Fig. 4, F and G). Together, our data indicate that endogenous BNIP3L and TMEM11 robustly interact, and that each protein independently associates with the core MICOS subunit MIC60.
BNIP3/BNIP3L knockdown alleviates the mitochondrial morphology defects of TMEM11-depleted cells
Given that BNIP3 and BNIP3L are in a complex with TMEM11, we next asked whether the activity of these proteins could be responsible for the altered mitochondrial morphology observed in TMEM11-depleted cells. We performed knockdown of BNIP3 and BNIP3L either individually or in combination by transient siRNA transfection in U2OS CRISPRi cells expressing control sgRNA or TMEM11-targeted sgRNA. We then assayed mitochondrial morphology by staining with Mitotracker and imaging cells by fluorescence microscopy. In control sgRNA cells depleted for BNIP3 or BNIP3L, mitochondria appearance was largely unaffected, although mitochondria tended to be more elongated in BNIP3/BNIP3L double knockdown cells (Fig. 5). Interestingly, examples of mildly enlarged mitochondria (∼10% of control cells) appeared to be significantly and reproducibly alleviated by depletion of BNIP3, but not BNIP3L, indicative of a functionally active role for BNIP3 (Fig. 5, A and B). As before, TMEM11-depleted cells treated with control siRNA had aberrant mitochondria in over half of cells. Remarkably, depletion of BNIP3, and to a lesser extent, BNIP3L, alleviated the mitochondrial morphology defects of TMEM11-depleted cells (Fig. 5, A and B). Combined depletion of BNIP3 and BNIP3L did not additively improve mitochondrial morphology, suggesting other factors may contribute to the defects in mitochondrial morphology observed in the absence of TMEM11. Alternatively, low levels of BNIP3 and/or BNIP3L remaining after siRNA treatment may contribute to the mitochondrial morphology phenotype. Regardless, these data indicate that BNIP3 and BNIP3L activity contributes to mitochondria morphology differences observed in the absence of TMEM11.
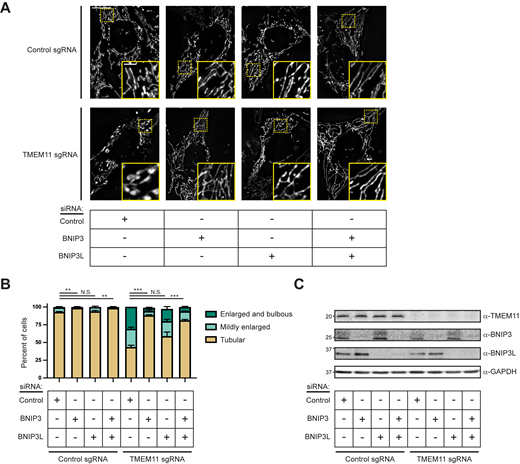
BNIP3/BNIP3L knockdown alleviates the mitochondrial morphology defects of TMEM11-depleted cells. (A) Maximum intensity projection fluorescence microscopy images are shown of U2OS CRISPRi cells stably expressing control sgRNA (top) or TMEM11 sgRNA (bottom) that were transiently transfected with the indicated siRNA and stained with Mitotracker Deep Red. Insets correspond to dotted boxes. Scale bar = 15 µm (3 µm on magnification). (B) A graph of the categorization of mitochondrial morphology from cells as in A. Data shown represent 100 cells per condition in each of three independent experiments and bars indicate SEM. Asterisks (***P < 0.001, **P < 0.01) represent unpaired two-tailed t test. N.S. indicates not statistically significant. (C) Western analysis with the indicated antibodies of whole cell lysates from cells as in A. Source data are available for this figure: SourceData F5.
BNIP3/BNIP3L knockdown alleviates the mitochondrial morphology defects of TMEM11-depleted cells. (A) Maximum intensity projection fluorescence microscopy images are shown of U2OS CRISPRi cells stably expressing control sgRNA (top) or TMEM11 sgRNA (bottom) that were transiently transfected with the indicated siRNA and stained with Mitotracker Deep Red. Insets correspond to dotted boxes. Scale bar = 15 µm (3 µm on magnification). (B) A graph of the categorization of mitochondrial morphology from cells as in A. Data shown represent 100 cells per condition in each of three independent experiments and bars indicate SEM. Asterisks (***P < 0.001, **P < 0.01) represent unpaired two-tailed t test. N.S. indicates not statistically significant. (C) Western analysis with the indicated antibodies of whole cell lysates from cells as in A. Source data are available for this figure: SourceData F5.
Depletion of TMEM11 increases BNIP3/BNIP3L-mediated basal mitophagy
The primary function of BNIP3 and BNIP3L is thought to be in the turnover of mitochondria through recruitment of LC3 (Liu et al., 2014). BNIP3 and BNIP3L are transcriptionally upregulated to promote their activation, for example, during hypoxia. However, BNIP3 and BNIP3L are expressed at lower levels at steady state and our data suggest they can contribute to altered mitochondrial morphology when TMEM11 is depleted. Therefore, we asked whether TMEM11-depleted cells are subjected to increased levels of BNIP3- and BNIP3L-mediated mitophagy. We utilized published HeLa cells (Lazarou et al., 2015) and generated U2OS cells stably expressing the mitophagy reporter mito-mKeima. mKeima is a pH-sensitive fluorophore that, when targeted to the mitochondrial matrix, enables the differential visualization of both active mitochondria as well as those that are targeted to lysosome for degradation depending on the excitation wavelength (Sun et al., 2017). To determine the contribution of TMEM11 to steady-state basal mitophagy, we imaged HeLa and U2OS mito-mKeima cells transfected with control siRNA or siRNA targeting TMEM11. Images were then manually scored for the number of acidified mitochondrial puncta that could be visualized per cell, an indicator that the mitochondria were targeted to lysosomes. Even in the absence of mitophagy stimuli, ∼50% of cells had at least one acidic mitochondrial puncta, suggesting that both HeLa and U2OS mito-mKeima cells undergo basal mitophagy (Fig. 6). Consistent with our results in U2OS CRISPRi cells, depletion of TMEM11 by siRNA caused mitochondria to become more enlarged and bulbous in appearance in both cell lines (Fig. 6, A and E; and Fig. S4 A). Strikingly, TMEM11-depleted cells had significantly higher numbers of acidified mitochondria than in control cells (12% control vs. 22% of TMEM11-depleted cells had 10 or more puncta in HeLa, 8% control vs. 25% TMEM11-depleted in U2OS; Fig. 6, C and G; and Fig. S4 B).
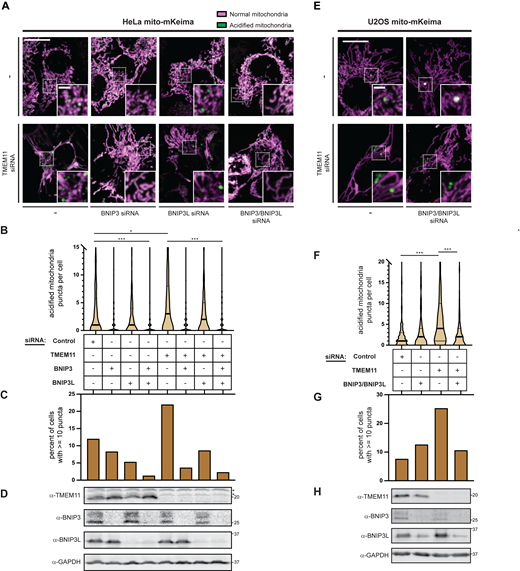
Depletion of TMEM11 increases BNIP3/BNIP3L-mediated basal mitophagy. (A and E) Merged maximum intensity projections of confocal fluorescence microscopy images of HeLa (A) or U2OS (E) mito-mKeima expressing cells that were transiently transfected with siRNAs targeting TMEM11 (bottom row) and BNIP3 and/or BNIP3L, where indicated, and excited with a 471 nm laser (magenta, neutral pH mitochondria) and a 561 nm laser (green, acidified mitochondria). Scrambled control siRNA was used in cases with no other target. Insets correspond to dotted boxes. Scale bars = 15 µm (3 µm on magnification). (B and F) Violin plots depicting the number of acidified mitochondria puncta per cell corresponding to green labeling from cells with the indicated siRNA treatments as in A and E. Data shown represent the summation of three independent experiments with 100 cells from each experiment. Asterisks (***P < 0.001, *P = 0.013) represent unpaired two-tailed t test. Bold horizontal lines mark medians and thin horizontal lines mark quartiles for each condition. For clarity, a small number of cells with high numbers of puncta are not depicted. (C and G) A histogram of the percent of cells from each condition as in B and F with at least 10 puncta. (D and H) Western analysis with the indicated antibodies of whole cell lysates from cells as in A and E treated with the indicated siRNAs. The asterisks indicate cross-reacting bands. See also Fig. S4. Source data are available for this figure: SourceData F6.
Depletion of TMEM11 increases BNIP3/BNIP3L-mediated basal mitophagy. (A and E) Merged maximum intensity projections of confocal fluorescence microscopy images of HeLa (A) or U2OS (E) mito-mKeima expressing cells that were transiently transfected with siRNAs targeting TMEM11 (bottom row) and BNIP3 and/or BNIP3L, where indicated, and excited with a 471 nm laser (magenta, neutral pH mitochondria) and a 561 nm laser (green, acidified mitochondria). Scrambled control siRNA was used in cases with no other target. Insets correspond to dotted boxes. Scale bars = 15 µm (3 µm on magnification). (B and F) Violin plots depicting the number of acidified mitochondria puncta per cell corresponding to green labeling from cells with the indicated siRNA treatments as in A and E. Data shown represent the summation of three independent experiments with 100 cells from each experiment. Asterisks (***P < 0.001, *P = 0.013) represent unpaired two-tailed t test. Bold horizontal lines mark medians and thin horizontal lines mark quartiles for each condition. For clarity, a small number of cells with high numbers of puncta are not depicted. (C and G) A histogram of the percent of cells from each condition as in B and F with at least 10 puncta. (D and H) Western analysis with the indicated antibodies of whole cell lysates from cells as in A and E treated with the indicated siRNAs. The asterisks indicate cross-reacting bands. See also Fig. S4. Source data are available for this figure: SourceData F6.
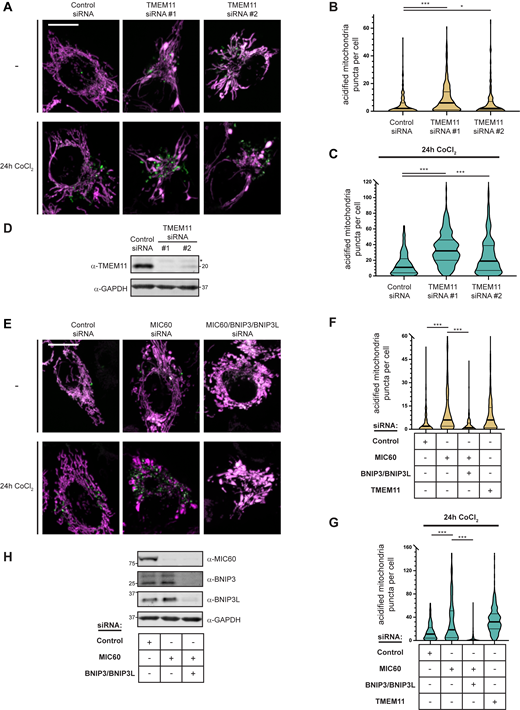
MICOS disruption leads to BNIP3/BNIP3L-mediated mitophagy. (A) Merged maximum intensity projections of confocal images of HeLa mito-mKeima expressing cells that were transiently transfected with two independent siRNAs targeting TMEM11 and excited with a 471-nm laser (magenta, neutral pH mitochondria) and a 561-nm laser (green, acidified mitochondria). The indicated cells were treated with 250 µM CoCl2 for 24 h. (B) A violin plot depicting the number of acidified mitochondria puncta per cell corresponding to green labeling from cells with the indicated siRNA treatments as in A. Data shown represent the summation of three independent experiments with 100 cells from each experiment. Asterisks (***P < 0.001, *P = 0.015) represent unpaired two-tailed t test. Bold horizontal lines mark medians and thin horizontal lines mark quartiles for each condition. (C) As in A and B for cells treated with 250 µM CoCl2 for 24 h. For clarity, a small number of cells are not depicted. (D) Western analysis with the indicated antibodies of whole cell lysates from cells as in A transfected with the indicated siRNAs. The asterisk indicates a cross-reacting band. (E–H) As in A–D for HeLa mito-mKeima cells treated with the indicated siRNAs. BNIP3/BNIP3L-silenced cells were simultaneously treated with Q-VD-OPh to prevent apoptosis. TMEM11 siRNA #1 data was collected simultaneously with Fig. S4, B and C and is redisplayed in Fig. S4, F and G for comparison. Scale bars = 15 µm. Source data are available for this figure: SourceData FS4.
MICOS disruption leads to BNIP3/BNIP3L-mediated mitophagy. (A) Merged maximum intensity projections of confocal images of HeLa mito-mKeima expressing cells that were transiently transfected with two independent siRNAs targeting TMEM11 and excited with a 471-nm laser (magenta, neutral pH mitochondria) and a 561-nm laser (green, acidified mitochondria). The indicated cells were treated with 250 µM CoCl2 for 24 h. (B) A violin plot depicting the number of acidified mitochondria puncta per cell corresponding to green labeling from cells with the indicated siRNA treatments as in A. Data shown represent the summation of three independent experiments with 100 cells from each experiment. Asterisks (***P < 0.001, *P = 0.015) represent unpaired two-tailed t test. Bold horizontal lines mark medians and thin horizontal lines mark quartiles for each condition. (C) As in A and B for cells treated with 250 µM CoCl2 for 24 h. For clarity, a small number of cells are not depicted. (D) Western analysis with the indicated antibodies of whole cell lysates from cells as in A transfected with the indicated siRNAs. The asterisk indicates a cross-reacting band. (E–H) As in A–D for HeLa mito-mKeima cells treated with the indicated siRNAs. BNIP3/BNIP3L-silenced cells were simultaneously treated with Q-VD-OPh to prevent apoptosis. TMEM11 siRNA #1 data was collected simultaneously with Fig. S4, B and C and is redisplayed in Fig. S4, F and G for comparison. Scale bars = 15 µm. Source data are available for this figure: SourceData FS4.
We co-transfected both control and TMEM11 siRNA-treated cells with siRNAs targeting BNIP3 and/or BNIP3L to determine whether the increased prevalence of mitophagy in TMEM11-depleted cells was related to their function. Remarkably, in HeLa cells, acidified mitochondria puncta were greatly reduced in the absence of BNIP3 and nearly abolished in the absence of both BNIP3 and BNIP3L in either control or TMEM11-depleted cells (Fig. 6, A–C). In contrast, in U2OS cells, depletion of BNIP3 and BNIP3L alleviated the increase in mitophagy caused by TMEM11 depletion but did not reduce basal mitophagy (Fig. 6, E–G). These data indicate that BNIP3 and BNIP3L are largely required for low levels of steady-state mitophagy in HeLa, but not U2OS cells. Nevertheless, in both cell lines, depletion of the BNIP3/BNIP3L interactor TMEM11 leads to an increase in BNIP3/BNIP3L-dependent mitophagy.
We considered that the increase in mitophagy may be indirectly due to the defects associated with loss of TMEM11 and not related to an interaction between TMEM11 and BNIP3/BNIP3L. While mitochondrial respiratory function of TMEM11-depleted cells was not appreciably different (Fig. 1, E–G), it is possible that knockdown of TMEM11 causes increased ROS production, leading to increased mitophagy. Thus, we quantitatively assessed mitochondrial content and ROS levels by FACS analysis of U2OS CRISPRi cells stably depleted of TMEM11 and stained with the dyes Mitotracker Deep Red and MitoSOX, respectively. However, there were no significant changes in ROS production in TMEM11-depleted cells (Fig. S5, A–D). We also considered whether bulk autophagy was upregulated in the absence of TMEM11, potentially explaining the increased mitophagy in TMEM11-depleted cells. However, autophagy flux as monitored by LC3 lipidation was not significantly different in the absence of TMEM11 (Fig. S5 E). Thus, these data suggest that the increased basal mitophagy in the absence of TMEM11 may be due to a direct relationship between TMEM11 and BNIP3/BNIP3L.
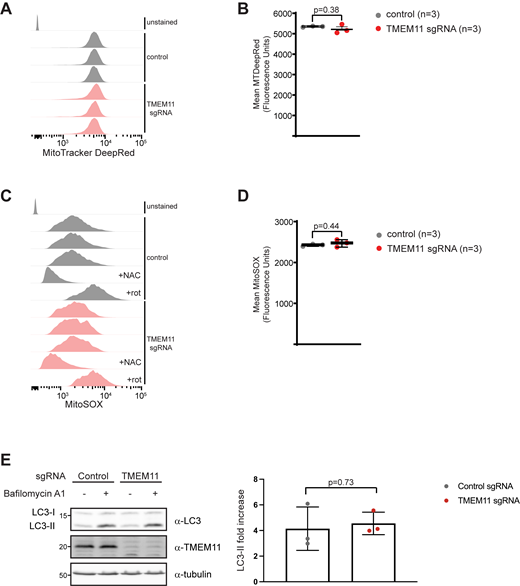
TMEM11 depletion does not lead to elevated ROS or induce higher levels of macroautophagy. (A) Representative FACS profiles for U2OS CRISPRi control (gray) and TMEM11 (red) sgRNA cells stained with MitoTracker Deep Red. (B) Quantitation of mean MitoTracker Deep Red fluorescence values for the indicated cells. (C) Representative FACS profiles for U2OS CRISPRi control (gray) and TMEM11 (red) sgRNA-expressing cells stained with MitoSOX. Where indicated, cells were treated with N-acetylcysteine (+NAC) or rotenone (+rot). (D) Quantification of mean MitoSOX fluorescence values for the indicated cell lines. (E) Left: Western analysis performed with the indicated antibodies of whole cell lysates from U2OS CRISPRi cells expressing control or TMEM11-targeted sgRNAs and treated, where indicated, with 10 nM bafilomycin A1 for 2 h. LC3-II indicates the lipidated, membrane associated isoform. Right: Quantification of the fold increase in LC3-II after 2 h bafilomycin A1 treatment in control versus TMEM11 sgRNA-expressing cells. Data represents three independent experiments and statistical significance (B, D, and E) was assessed using a two-tailed t test. Source data are available for this figure: SourceData FS5.
TMEM11 depletion does not lead to elevated ROS or induce higher levels of macroautophagy. (A) Representative FACS profiles for U2OS CRISPRi control (gray) and TMEM11 (red) sgRNA cells stained with MitoTracker Deep Red. (B) Quantitation of mean MitoTracker Deep Red fluorescence values for the indicated cells. (C) Representative FACS profiles for U2OS CRISPRi control (gray) and TMEM11 (red) sgRNA-expressing cells stained with MitoSOX. Where indicated, cells were treated with N-acetylcysteine (+NAC) or rotenone (+rot). (D) Quantification of mean MitoSOX fluorescence values for the indicated cell lines. (E) Left: Western analysis performed with the indicated antibodies of whole cell lysates from U2OS CRISPRi cells expressing control or TMEM11-targeted sgRNAs and treated, where indicated, with 10 nM bafilomycin A1 for 2 h. LC3-II indicates the lipidated, membrane associated isoform. Right: Quantification of the fold increase in LC3-II after 2 h bafilomycin A1 treatment in control versus TMEM11 sgRNA-expressing cells. Data represents three independent experiments and statistical significance (B, D, and E) was assessed using a two-tailed t test. Source data are available for this figure: SourceData FS5.
TMEM11 depletion sensitizes cells to BNIP3/BNIP3L-mediated mitophagy during CoCl2-induced mitophagy
We next exposed HeLa and U2OS cells to the hypoxia mimetic CoCl2, which promotes increased BNIP3/BNIP3L expression and stimulates BNIP3/BNIP3L-dependent mitophagy (Bellot et al., 2009; Sulkshane et al., 2021). As expected, BNIP3 and BNIP3L protein stability increased upon CoCl2 treatment in both cell lines (Fig. 7, A and E; 250 µM HeLa and 500 µM U2OS for 24 h). In contrast, TMEM11 stability was unaffected by treatment. We then examined whether TMEM11 contributed to mitophagy induction during CoCl2 treatment. Consistent with the increase in BNIP3 and BNIP3L protein stability, CoCl2 treatment stimulated mitophagy and drastically increased the number of acidified mito-mKeima labeled mitochondria in HeLa cells (the median number of acidified puncta increased from 1 to 18 after treatment; compare Fig. 6 B and Fig. 7 C). Notably, in U2OS cells, despite the increase in BNIP3 and BNIP3L stability, the increase in acidified mitochondria after CoCl2 was more moderate. To determine whether the increase in mitophagy was dependent on BNIP3 and/or BNIP3L, we performed knockdowns with siRNA and co-treated with the caspase inhibitor Q-VD-OPh to prevent apoptotic cell death (Bellot et al., 2009). BNIP3 was largely required for CoCl2-induced mitophagy in HeLa cells and combined depletion of both BNIP3 and BNIP3L nearly completely abolished the increase in mitochondrial acidification post-treatment in both HeLa and U2OS cells (Fig. 7, C, D, G, and H).
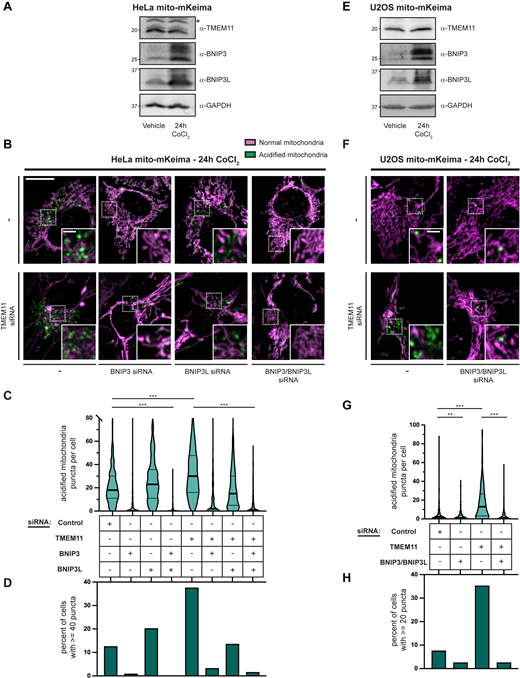
TMEM11 depletion sensitizes cells to BNIP3/BNIP3L-mediated mitophagy during CoCl2-induced mitophagy. (A and E) Western blot analysis with the indicated antibodies of whole cell lysates from HeLa (A) and U2OS (E) mito-mKeima expressing cells treated with vehicle or CoCl2 (250 µM HeLa and 500 µM U2OS; 24 h). The asterisk indicates a cross-reacting band. (B and F) Merged maximum intensity projections of confocal fluorescence microscopy images of HeLa (B) or U2OS (F) mito-mKeima expressing cells that were transiently transfected with siRNAs targeting TMEM11, BNIP3, and/or BNIP3L, where indicated, treated with CoCl2, and excited with a 471 nm laser (magenta, neutral pH mitochondria) and a 561-nm laser (green, acidified mitochondria). BNIP3 and/or BNIP3L-silenced cells were simultaneously treated with Q-VD-OPh to prevent apoptosis. Scrambled control siRNA was used in cases with no other target. Insets correspond to dotted boxes. Scale bars = 15 µm (3 µm on magnification). (C and G) Violin plots depicting the number of acidified mitochondria puncta per cell corresponding to green labeling from cells with the indicated siRNA treatments as in B and F. Data shown represent the summation of three independent experiments with 100 cells from each experiment. Asterisks (***P < 0.001) represent unpaired two-tailed t test. Bold horizontal lines mark medians and thin horizontal lines mark quartiles for each condition. For clarity, the small percentage of cells with more than 80 puncta (C) are not depicted. (D and H) A histogram of the percent of cells from each condition with at least 40 (D) or 20 (H) acidified mitochondrial puncta. See also Fig. S4. Source data are available for this figure: SourceData F7.
TMEM11 depletion sensitizes cells to BNIP3/BNIP3L-mediated mitophagy during CoCl2-induced mitophagy. (A and E) Western blot analysis with the indicated antibodies of whole cell lysates from HeLa (A) and U2OS (E) mito-mKeima expressing cells treated with vehicle or CoCl2 (250 µM HeLa and 500 µM U2OS; 24 h). The asterisk indicates a cross-reacting band. (B and F) Merged maximum intensity projections of confocal fluorescence microscopy images of HeLa (B) or U2OS (F) mito-mKeima expressing cells that were transiently transfected with siRNAs targeting TMEM11, BNIP3, and/or BNIP3L, where indicated, treated with CoCl2, and excited with a 471 nm laser (magenta, neutral pH mitochondria) and a 561-nm laser (green, acidified mitochondria). BNIP3 and/or BNIP3L-silenced cells were simultaneously treated with Q-VD-OPh to prevent apoptosis. Scrambled control siRNA was used in cases with no other target. Insets correspond to dotted boxes. Scale bars = 15 µm (3 µm on magnification). (C and G) Violin plots depicting the number of acidified mitochondria puncta per cell corresponding to green labeling from cells with the indicated siRNA treatments as in B and F. Data shown represent the summation of three independent experiments with 100 cells from each experiment. Asterisks (***P < 0.001) represent unpaired two-tailed t test. Bold horizontal lines mark medians and thin horizontal lines mark quartiles for each condition. For clarity, the small percentage of cells with more than 80 puncta (C) are not depicted. (D and H) A histogram of the percent of cells from each condition with at least 40 (D) or 20 (H) acidified mitochondrial puncta. See also Fig. S4. Source data are available for this figure: SourceData F7.
Given that TMEM11 depletion increased BNIP3/BNIP3L-dependent mitophagy at steady-state and that BNIP3/BNIP3L are transcriptionally upregulated to drive mitophagy upon CoCl2 treatment while TMEM11 remains stable, we next asked whether knockdown of TMEM11 would further sensitize mitochondria to mitophagy upon treatment. Remarkably, TMEM11-depleted cells had drastically higher numbers of acidified mito-mKeima labeled mitochondria compared to control cells 24 h after CoCl2 treatment in both HeLa and U2OS cells (Fig. 7, B–D, and F–H; and Fig. S4, C and D). The increase in mitophagy in the absence of TMEM11 was particularly striking in U2OS cells given the more moderate effect of CoCl2 treatment alone. In both cell lines, the increased mitophagy in the absence of TMEM11 was alleviated by silencing of both BNIP3 and BNIP3L (Fig. 7, B–D, and F–H). Thus, depletion of the BNIP3/BNIP3L-interacting partner TMEM11 sensitized cells to BNIP3/BNIP3L-driven mitophagy under hypoxia-mimicking conditions.
As TMEM11 and BNIP3L both were seen to interact with the MICOS subunit MIC60, we also asked how disruption of MICOS affected mitophagy. We transiently transfected HeLa mito-mKeima cells with control siRNA or MIC60-targeted siRNA and quantified acidified mitochondria during both basal conditions and after treatment for 24 h with CoCl2 (Fig. S4, E–H). Remarkably, depletion of MIC60 leads to a significant increase in basal mitophagy as well as that induced by CoCl2, similar to the increase observed in cells depleted of TMEM11. Importantly, the mitophagy stimulated by the loss of MIC60 was alleviated by depletion of BNIP3 and BNIP3L (Fig. S4, E–H). Thus, association between the MICOS complex and the complex of TMEM11 and BNIP3/BNIP3L may be important for the regulation of BNIP3/BNIP3L-dependent mitophagy induction.
TMEM11 and BNIP3/BNIP3L co-enrich at mitophagosome formation sites on the outer mitochondrial membrane
Given the functional relationship between TMEM11 and BNIP3/BNIP3L in both mitochondrial morphology and mitophagy, we next determined their spatial relationship within mitochondria. We transiently transfected U2OS cells with minimal amounts of GFP-TMEM11 to approximate endogenous localization, fixed, and immunolabeled with BNIP3 or BNIP3L and TOMM20. In otherwise untreated cells, transiently transfected GFP-TMEM11 localized in a semi-punctate pattern similar to stable GFP-TMEM11 expressing cells (Fig. 3 A) as well as endogenous immunolabeled TMEM11 (Fig. S6 A). However, some punctate TMEM11 could be observed that appears to co-localize with BNIP3 or BNIP3L (Fig. 8 A, arrows).

Endogenous TMEM11 and BNIP3/BNIP3L enrich in discrete foci upon induced mitophagy. (A) Maximum intensity projections are shown of confocal images of plain U2OS cells, treated where indicated with 500 µM CoCl2 for 24 h, fixed, and immunolabeled with TOMM20 (magenta) and TMEM11 (green). Dotted boxes correspond to single planes of regions of interest shown at right. (B and C) As in A for cells immunolabeled with TOMM20 (magenta) and BNIP3 (B) or BNIP3L (C; green). Scale bars = 10 µm (2 µm on magnification).
Endogenous TMEM11 and BNIP3/BNIP3L enrich in discrete foci upon induced mitophagy. (A) Maximum intensity projections are shown of confocal images of plain U2OS cells, treated where indicated with 500 µM CoCl2 for 24 h, fixed, and immunolabeled with TOMM20 (magenta) and TMEM11 (green). Dotted boxes correspond to single planes of regions of interest shown at right. (B and C) As in A for cells immunolabeled with TOMM20 (magenta) and BNIP3 (B) or BNIP3L (C; green). Scale bars = 10 µm (2 µm on magnification).

TMEM11 and BNIP3/BNIP3L co-enrich at mitophagosome formation sites on the outer mitochondrial membrane. (A) Maximum intensity projections are shown of confocal images of U2OS cells transiently transfected with GFP-TMEM11, fixed, and immunolabeled with TOMM20 (blue) and BNIP3 (magenta; left) or BNIP3L (magenta; right). Dotted boxes correspond to single planes of regions of interest shown below. Arrows mark sites of co-localized TMEM11 and BNIP3/BNIP3L foci. (B) As in A for cells treated with 500 µM CoCl2 for 24 h. Dotted boxes correspond to insets shown at right. The quantification shown in figure represents the indicated number of enlarged, BNIP3/BNIP3L-enriched foci that are co-enriched with GFP-TMEM11 from a total of 55 cells (BNIP3) or 48 cells (BNIP3L) acquired in two independent experiments. (C) As in B for cells co-transfected with GFP-TMEM11 and mCherry-LC3 (blue), fixed, and immunolabeled with BNIP3 (magenta). The quantification shown in figure represents the indicated number of GFP-TMEM11/BNIP3 co-enriched foci that are co-localized with discrete LC3 foci from a total of 40 cells acquired in two independent experiments. Scale bars = 10 µm (3 µm on magnification [A and B] or 2 µm on magnification [C]). See also Fig. S6.
TMEM11 and BNIP3/BNIP3L co-enrich at mitophagosome formation sites on the outer mitochondrial membrane. (A) Maximum intensity projections are shown of confocal images of U2OS cells transiently transfected with GFP-TMEM11, fixed, and immunolabeled with TOMM20 (blue) and BNIP3 (magenta; left) or BNIP3L (magenta; right). Dotted boxes correspond to single planes of regions of interest shown below. Arrows mark sites of co-localized TMEM11 and BNIP3/BNIP3L foci. (B) As in A for cells treated with 500 µM CoCl2 for 24 h. Dotted boxes correspond to insets shown at right. The quantification shown in figure represents the indicated number of enlarged, BNIP3/BNIP3L-enriched foci that are co-enriched with GFP-TMEM11 from a total of 55 cells (BNIP3) or 48 cells (BNIP3L) acquired in two independent experiments. (C) As in B for cells co-transfected with GFP-TMEM11 and mCherry-LC3 (blue), fixed, and immunolabeled with BNIP3 (magenta). The quantification shown in figure represents the indicated number of GFP-TMEM11/BNIP3 co-enriched foci that are co-localized with discrete LC3 foci from a total of 40 cells acquired in two independent experiments. Scale bars = 10 µm (3 µm on magnification [A and B] or 2 µm on magnification [C]). See also Fig. S6.
We then subjected plain U2OS cells to CoCl2 treatment (500 µM, 24 h) to stimulate mitophagy and asked how endogenous BNIP3 and BNIP3L distribution changed. Despite the increase in their protein expression after CoCl2 treatment, the distribution of BNIP3 and BNIP3L remained mostly punctate on the mitochondrial membrane. However, we noticed that the proteins were regularly enriched in discrete, enlarged focal structures that were also positive, but not enriched, for the OMM marker TOMM20 (Fig. S6, and C). Immunofluorescence of CoCl2-treated cells with endogenous TMEM11 antibody revealed that TMEM11 could also be found enriched in similar enlarged structures (Fig. S6 A).
To determine whether TMEM11 and BNIP3 or BNIP3L were co-enriched at these focal sites, we transiently transfected cells with GFP-TMEM11 and treated them for 24 h with 500 µM CoCl2, fixed, and immunolabeled for BNIP3 or BNIP3L. We observed a total of 141 BNIP3 and 162 BNIP3L-enriched focal structures and observed that the majority (70.9% of BNIP3 foci and 65.4% of BNIP3L foci) were co-enriched for TMEM11 (Fig. 8 B). Thus, TMEM11 co-enriches with BNIP3 and BNIP3L at discrete structures on the OMM during induced BNIP3/BNIP3L-dependent mitophagy.
Our results in mito-mKeima cells suggest that TMEM11 depletion leads to a drastic increase in the amount of BNIP3/BNIP3L-dependent mitophagy. Thus, we reasoned that co-enriched sites of TMEM11 and BNIP3 or BNIP3L could suggest TMEM11 sequesters the mitophagy receptors to inhibit mitophagosome formation. However, the TMEM11/BNIP3/BNIP3L co-enriched sites often appeared in ring-shaped structures, suggestive of mitophagosomes (Fig. 8 B). To test whether TMEM11-enriched sites were indeed mitophagosomes, we tested whether the autophagy machinery was recruited to them. We co-transfected U2OS cells with GFP-TMEM11 and mCherry-LC3, treated cells for 24 h with CoCl2, and fixed and immunolabeled cells with BNIP3. We examined a total of 148 sites co-enriched for BNIP3 and TMEM11 and observed 94.6% were clearly co-localized with mCherry-LC3 (Fig. 8 C).
TMEM11 depletion leads to an increase in mitophagosome formation sites on the mitochondrial membrane
TMEM11 discretely co-enriches with BNIP3 at mitophagosomes, but depletion of TMEM11 leads to higher numbers of acidified mitochondria at steady state. We thus asked how BNIP3 distribution was altered in the absence of TMEM11. To test this, we examined BNIP3 localization relative to TOMM20 by immunofluorescence of U2OS cells acutely depleted of TMEM11 by siRNA. BNIP3 localized in a distributed punctate pattern on the mitochondrial surface relative to TOMM20 in cells treated with control siRNA (Fig. 9 A). However, in rare cases (3.5% of 200 cells), BNIP3 signal enriched in a single larger TOMM20-positive structure resembling a mitophagosome. We then examined U2OS cells depleted of TMEM11 by siRNA. The punctate distribution of BNIP3 found on the majority of mitochondria did not appear different in the absence of TMEM11, nor did the distribution of BNIP3 appear to change on enlarged portions of the mitochondrial network. However, consistent with the increase in acidified mitochondria in TMEM11-depleted mito-mKeima cells, there was a significant increase in BNIP3-enriched structures (13.4% of 232 TMEM11 knockdown cells had at least one BNIP3-enriched structure; Fig. 9, A, C, and D). Thus, the increased basal mitophagy observed in TMEM11-depleted cells (Fig. 6) correlated with an increase in the formation of BNIP3-enriched structures.

TMEM11 depletion leads to an increase in mitophagosome formation sites on the mitochondrial membrane. (A) Maximum intensity projections are shown of confocal images of U2OS cells transiently transfected with control siRNA (top) or TMEM11-targeted siRNA (bottom), fixed, and immunolabeled with TOMM20 (magenta) and BNIP3 (green). Dotted boxes at left correspond to single planes of regions of interest shown at the right. (B) As in A for cells treated for 24 h with 500 µM CoCl2. (C) A violin plot indicating the number of enlarged, BNIP3-enriched foci per cell as in A and B. Data shown represent at least 200 cells per condition (untreated) and 300 cells per condition (CoCl2-treated) and are the summation of three independent experiments. Asterisks (***P < 0.001) represent unpaired two-tailed t test. (D) A histogram displaying the percentage of cells as in A–C with the indicated number of BNIP3-enriched foci. (E) Single plane confocal images of U2OS cells transiently transfected with control siRNA (top) or TMEM11-targeted siRNA (bottom), fixed, and immunolabeled with MIC60 (magenta) and BNIP3 (green). The quantification shown in figure represents the indicated number of enlarged BNIP3-enriched foci that are positive for MIC60 from a total of 61 cells from each condition acquired in two independent experiments. Scale bars = 10 µm (3 µm on magnification; A and B) or 2 µm (E). (F) A model for the role of TMEM11 in BNIP3/BNIP3L-mediated mitophagy.
TMEM11 depletion leads to an increase in mitophagosome formation sites on the mitochondrial membrane. (A) Maximum intensity projections are shown of confocal images of U2OS cells transiently transfected with control siRNA (top) or TMEM11-targeted siRNA (bottom), fixed, and immunolabeled with TOMM20 (magenta) and BNIP3 (green). Dotted boxes at left correspond to single planes of regions of interest shown at the right. (B) As in A for cells treated for 24 h with 500 µM CoCl2. (C) A violin plot indicating the number of enlarged, BNIP3-enriched foci per cell as in A and B. Data shown represent at least 200 cells per condition (untreated) and 300 cells per condition (CoCl2-treated) and are the summation of three independent experiments. Asterisks (***P < 0.001) represent unpaired two-tailed t test. (D) A histogram displaying the percentage of cells as in A–C with the indicated number of BNIP3-enriched foci. (E) Single plane confocal images of U2OS cells transiently transfected with control siRNA (top) or TMEM11-targeted siRNA (bottom), fixed, and immunolabeled with MIC60 (magenta) and BNIP3 (green). The quantification shown in figure represents the indicated number of enlarged BNIP3-enriched foci that are positive for MIC60 from a total of 61 cells from each condition acquired in two independent experiments. Scale bars = 10 µm (3 µm on magnification; A and B) or 2 µm (E). (F) A model for the role of TMEM11 in BNIP3/BNIP3L-mediated mitophagy.
We then examined how CoCl2-induced mitophagy impacted BNIP3 distribution in the presence and absence of TMEM11. We acutely depleted TMEM11 by siRNA in U2OS cells, treated with CoCl2 (24 h, 500 µM), fixed and immunolabeled for BNIP3 and TOMM20. Consistent with our data in GFP-TMEM11-transfected cells, BNIP3 concentrated at enlarged structures in nearly half of CoCl2-treated cells at steady state (45.2% of 310 cells had at least one BNIP3-enrichment; Fig. 9, B–D). However, in the absence of TMEM11, the number of BNIP3 enrichments drastically increased, and many cells exhibited several BNIP3-enriched structures (76.2% of 348 cells had at least one and 9.7% of cells had at least six BNIP3-enrichments; Fig. 9, B–D). Thus, while TMEM11 enriches at BNIP3-positive mitophagosomes, more BNIP3 mitophagosomes form in the absence of TMEM11.
To gain more insight into the role of TMEM11, we further categorized the nature of BNIP3-positive enrichments. We frequently saw BNIP3-enriched sites on the surface of tubular mitochondria, but we also observed BNIP3 enriched on isolated fragments of mitochondria. We reasoned that the increased number of mitophagosomes in the absence of TMEM11 could be due to alterations in the rate of formation of mitophagosomes at a limited number of BNIP3-enriched sites. We therefore categorized whether BNIP3-enriched foci appeared to be attached to the tubular mitochondrial network or on a fragment of mitochondria, which could potentially represent a free mitophagosome. In control siRNA cells treated with CoCl2, the majority of BNIP3-enrichments appeared connected to the mitochondrial network at the resolution of light microscopy (76.5% of 226 mitophagosomes appeared network-attached). Remarkably, loss of TMEM11 did not alter the distribution of BNIP3-enrichements (75% of 812 mitophagosomes appeared network-attached). Because of the limits of resolution of light microscopy, it is possible that there are differences in mitophagosome connectivity to mitochondria that are not possible to resolve. However, our data indicate that the increase in mitophagosome formation that occurs in the absence of TMEM11 is likely due to an increase in the number of BNIP3 mitophagosome formation sites on the OMM.
Finally, we considered the possibility that TMEM11, due to its interaction with the MICOS complex, is responsible for ensuring incorporation of IMM proteins, such as subunits of the MICOS complex, into mitophagosomes. We acutely depleted TMEM11 by siRNA, induced mitophagosome formation with CoCl2 (500 µM, 24 h), fixed, and immunolabeled cells with BNIP3 and MIC60. In control siRNA-treated cells, MIC60 appeared at the interior of the majority of BNIP3-enriched structures (84.5% of 103 BNIP3 enrichments; Fig. 9 E). However, depletion of TMEM11 did not impact MIC60 localization to BNIP3-enriched structures (86.1% of 244 BNIP3 enrichments co-labeled with MIC60; Fig. 9 E). Thus, our data indicate the MICOS complex, and likely other IMM proteins, normally incorporate into BNIP3-enriched mitophagosomes in the presence or absence of TMEM11. Altogether, our data suggest that TMEM11 depletion increases mitophagosome formation sites without influencing IMM incorporation into mitophagosomes.
Discussion
Although PINK1/Parkin-mediated mitophagy is better mechanistically understood, mitochondrial turnover by BNIP3/BNIP3L-dependent receptor-mediated mitophagy is a critical modulator of mitochondrial turnover in the heart, under stress conditions such as hypoxia, during development, and is frequently mis-regulated in cancer cells (Macleod, 2020; Ney, 2015). However, the mechanisms of spatial regulation of BNIP3 and BNIP3L activity are poorly understood. Our data reveal that TMEM11, while originally thought to be a mitochondrial IMM protein, instead localizes to the OMM where it forms a complex with BNIP3 and BNIP3L. TMEM11 co-enriches with BNIP3 and BNIP3L at mitophagy sites within the mitochondrial network, and loss of TMEM11 leads to a dramatic increase in BNIP3-marked mitophagosomes. These data support a model that BNIP3/BNIP3L-mediated mitophagy is spatially restricted on the OMM through an interaction with TMEM11 (Fig. 9 F).
In addition to forming a complex with BNIP3/BNIP3L, our data confirm published observations that TMEM11 interacts with MICOS components (Guarani et al., 2015). This interaction is likely indirect through interactions between TMEM11 and MIB components, such as SAMM50, on the OMM. Interestingly, the interaction between TMEM11 and MIC60 is not as robust as that between TMEM11 and BNIP3/BNIP3L, and consistent with this, TMEM11 does not commonly appear co-localized with the MICOS complex, suggesting the interaction is more transient. However, depletion of MIC60, which destabilizes the MICOS complex, leads to a similar increase in BNIP3/BNIP3L-dependent mitophagy as depletion of TMEM11, suggesting their interaction may cooperatively regulate mitophagy. As opposed to PINK1/Parkin-mediated mitophagy, which is triggered by loss of mitochondrial membrane potential, it is not known the precise mechanisms of dysfunction that lead to BNIP3/BNIP3L-mediated mitophagy. However, our data suggest that BNIP3/BNIP3L are selectively enriched on subregions of the mitochondrial network, begging the question of what dictates the site of mitophagy initiation. The MICOS complex, which enriches at individual cristae junctions on the IMM, is poised to potentially sense dysfunction inside mitochondria and transmit that interaction to the OMM through the MIB complex. While more mechanistic insights are needed to selectively disrupt the TMEM11/MICOS/MIB interaction and test its role, one possibility is that TMEM11 may interact with MICOS/MIB to sense and restrict mitophagy to specific sites of dysfunction on the mitochondrial interior (Fig. 9 F). The MIB component SAMM50 has also been recently implicated in piecemeal mitophagy of MIB/MICOS components by acting as a mitophagy receptor itself (Abudu et al., 2021), and it will be interesting to further examine whether there is a relationship between these two forms of mitophagy.
Our data also indicate that BNIP3 activity leads to a mitochondrial morphology defect that occurs in the absence of TMEM11 in both HeLa and U2OS cells. Interestingly, BNIP3 and BNIP3L have been previously associated with hypoxia-associated mitochondria enlargement, at least in certain cell types (Chiche et al., 2010). Stimulation of mitophagy by CoCl2 treatment in HeLa and U2OS mito-Keima cells also empirically causes an apparent increase in mitochondrial enlargement, however only in a subset of cells. We also observed that under basal conditions, a small percentage of U2OS cells appear to have mildly enlarged mitochondria that are also reproducibly alleviated by depletion of BNIP3 (Fig. 5 B). However, the functional relationship between BNIP3/BNIP3L-dependent mitochondrial enlargement and mitophagy is not clear as the morphology defect in the absence of TMEM11 is not strictly correlated with the amount of mitophagy induction. Chiche et al. (2010) propose that the BNIP3/BNIP3L-dependent enlargement of mitochondria they observed during hypoxia protects against apoptotic induction. An additional possibility is the increased diameter of the enlarged mitochondria may protect functional parts of the mitochondrial network against selective mitophagy.
Finally, our data also reveal key differences between two immortalized cell lines, U2OS and HeLa, in the induction of mitophagy. Depletion of BNIP3 and BNIP3L nearly completely abolish basal mitophagy in HeLa mito-mKeima expressing cells, while in U2OS mito-mKeima cells, basal mitophagy appears to be unchanged. However, in U2OS cells, BNIP3 and BNIP3L are expressed at low basal levels and can lead to increased mitophagy and mitochondrial morphology defects in the absence of TMEM11. One possibility is that other mitophagy receptors or low amounts of PINK1/Parkin mediate basal mitophagy in U2OS cells or, alternatively, such other pathways can compensate for loss of BNIP3/BNIP3L. However, it is clear that additional factors must also positively modulate BNIP3/BNIP3L function. For example, in HeLa cells treated with CoCl2, BNIP3 is responsible for the majority of mitophagy even though BNIP3L is highly expressed. Both BNIP3 and BNIP3L are extensively post-translationally modified and these modifications have been shown to be necessary to regulate mitophagy (Poole et al., 2021; Rogov et al., 2017; Zhu et al., 2013). One possibility is that distinct types of stress lead to differential activation of BNIP3 versus BNIP3L-dependent basal mitophagy. Dimerization of BNIP3L has also been suggested to be necessary for its ability to mediate mitophagy (Marinkovic et al., 2021), and it will be interesting to determine if TMEM11 modulates BNIP3 or BNIP3L dimerization, potentially locally at mitophagy sites. Finally, BNIP3L is specifically upregulated to eliminate mitochondria from maturing erythrocytes and keratinocytes (Sandoval et al., 2008; Schweers et al., 2007; Simpson et al., 2021), and an outstanding question is whether TMEM11 plays a role in these processes.
Materials and methods
Cell culture
U2OS cells and derivatives (a kind gift of Jodi Nunnari; Le Vasseur et al., 2021), HeLa mito-mKeima cells (a kind gift of Richard Youle; Lazarou et al., 2015), and HEK 293T cells (a kind gift of Jodi Nunnari; Le Vasseur et al., 2021) were cultured in DMEM (D5796; Sigma-Aldrich) supplemented with 10% fetal bovine serum (Sigma-Aldrich), 25 mM HEPES, 100 units/ml penicillin, and 100 µg/ml streptomycin. All experiments using CRISPRi cells were performed on early passages (<10) after sorting. Cell lines were routinely tested for mycoplasma contamination.
Plasmids and siRNA oligonucleotides
Individual TMEM11 sgRNA and MIC60 sgRNA vectors were generated by annealing the following forward and reverse oligonucleotides and ligating into pU6-sgRNA Ef1α-Puro-T2A-BFP (Horlbeck et al., 2016) digested with BstXI and BlpI.
TMEM11 sgRNA #1 forward: 5′-TTGGGAAGGAGGCGTCTTGGCCCGTTTAAGAGC-3′; TMEM11 sgRNA #1 reverse: 5′-TTAGCTCTTAAACGGGCCAAGACGCCTCCTTCCCAACAAG-3′; TMEM11 sgRNA #3 forward: 5′-TTGGCGAGAGAGGTGAGATCCAAGTTTAAGAGC-3′; TMEM11 sgRNA #3 reverse: 5′-TTAGCTCTTAAACTTGGATCTCACCTCTCTCGCCAACAAG-3′; MIC60 sgRNA #1 forward: 5′-TTGGCGCGGCGGCGCGAGTTAAGGTTTAAGAGC-3′; MIC60 sgRNA #1 reverse: 5′-TTAGCTCTTAAACCTTAACTCGCGCCGCCGCGCCAACAAG-3′; MIC60 sgRNA #2 forward: 5′-TTGGTGGTGGACTCGAGCTGCCGGTTTAAGAGC-3′; MIC60 sgRNA #2 reverse: 5′-TTAGCTCTTAAACCGGCAGCTCGAGTCCACCACCAACAAG-3′.
pGFP-TMEM11 was generated by PCR amplifying TMEM11 from human cDNA and cloning into the XhoI/BamHI sites of pAcGFP1-C1 (Takara) by isothermal assembly. To generate pLVX-Puro GFP-TMEM11, the GFP-TMEM11 cassette was subsequently sub-cloned into the Xho/BamHI sites of pLVX-Puro (Takara). pLVX-Puro APEX2-GFP-TMEM11 was generated by PCR amplifying the GFP-TMEM11 cassette and the APEX2 cassette from pcDNA3 Connexin43-GFP-APEX2 (kindly provided by Alice Ting; #49385; Addgene; Lam et al., 2015) and cloning into the Xho/BamHI sites of pLVX-Puro by isothermal assembly.
mCherry-LC3 was cloned by first replacing the GFP cassette of pAcGFP1-C1 with mCherry, and subsequently digesting the mouse Map1LC3b cassette from mCitrine-LC3 (Graef et al., 2013) and cloning it into the XhoI/BamHI sites.
pGADT7-TMEM11 and pGBKT7-TMEM11 were generated by PCR amplifying the TMEM11 cassette from pGFP-TMEM11 and ligating it into NdeI/BamHI sites of pGADT7 and pGBKT7 plasmids (Takara), respectively, by isothermal assembly. pGADT7-BNIP3 and pGBKT7-BNIP3 were generated by PCR amplifying the BNIP3 cassette from pDEST40-BNIP3 (a gift from Angelique Whitehurst, University of Texas Southwestern, Dallas, TX, USA) and ligating it into the NdeI/BamHI sites in pGADT7 and pGBKT7, respectively, by isothermal assembly. pGADT7-BNIP3L and pGBKT7-BNIP3L were generated by PCR amplifying the BNIP3L cassette from pDEST40-BNIP3L (a gift from Angelique Whitehurst) and ligating it into NdeI/BamHI sites in pGADT7 AD and pGBKT7, respectively, by isothermal assembly.
pGBKT7-TMEM11(1–82), pGBKT7-TMEM11(69–end), pGBKT7-TMEM11(69–129), pGBKT7-TMEM11(130–163), and pGBKT7-TMEM11(164–end) were generated by PCR amplifying the indicated coding regions of TMEM11 from pGFP-TMEM11 and cloning into the NdeI/BamHI sites of pGBKT7 by isothermal assembly. pGBKT7-TMEM11(69–end; 164–end) was generated by PCR amplifying the TMEM11(69–129) and TMEM11(164–192) coding regions (connected by a 12 amino acid linker) from pGFP-TMEM11 and cloning into pGBKT7 plasmid by isothermal assembly. pGADT7-BNIP3(31–end), pGADT7-BNIP3(88–end), pGADT7-BNIP3(1–162), and pGADT7-BNIP3(122–end) were generated by PCR amplifying the indicated coding regions of BNIP3 from pDEST40-BNIP3 and cloning into the NdeI/BamHI sites of pGADT7 by isothermal assembly. pGADT7-BNIP3(G180A) was generated by site-directed mutagenesis of pGADT7-BNIP3.
For siRNA depletion, Silencer Select siRNAs (Negative control no. 2—4390846; TMEM11 (#1)—s16855; TMEM11 (#2)—s16857; BNIP3—s2060; BNIP3L s2063; MIC60—s21633; Thermo Fisher Scientific) were used for all treatments. If not indicated otherwise, TMEM11 siRNA #1 was used in all experiments. Sequences of siRNAs are as follows:
TMEM11 (#1): s16855: 5′-GAUUAUUCCCACUACAUUUTT-3′; TMEM11 (#2): s16857: 5′-GAGACUGCACAACACGAUATT-3′; BNIP3: s2060: 5′-CCCAUAGCAUUGGAGAGAATT-3′; BNIP3L: s2063: 5′-GAUUCUUUUGGAUGCACAATT-3′; MIC60: s21633: 5′-GAAUGACCCUAGAAACGAATT-3′.
Lentivirus production and generation of stable cell lines
Lentivirus of sgRNA-expressing plasmids, TMEM11-expressing plasmids, and mito-mKeima-expressing plasmid, was generated as previously described (Le Vasseur et al., 2021). Briefly, HEK 293Ts were transfected with standard packaging plasmids (0.1 µg of pGag/Pol, 0.1 µg of pREV, 0.1 µg of pTAT, and 0.2 µg of pVSVG) and 1.5 µg of lentiviral vector using TransIT-LT1 Transfection Reagent (Mirus). Lentiviral supernatant was harvested and filtered through a 0.45-µm PES filter.
To generate CRISPRi stable lines, U2OS dCas9 cells were seeded into a 6-well plate (200,000 cells per well) and incubated for 24 h with 750 µl viral supernatant of sgRNA-expressing plasmids supplemented with 5.33 µg/ml polybrene. After infection, cells were allowed to grow and the top 50% of TagBFP expressing cells were sorted by FACS in the UTSW Flow Cytometry Core Facility. Control sgRNA-expressing U2OS CRISPRi cells were previously described (Le Vasseur et al., 2021).
GFP-TMEM11 and APEX2-GFP-TMEM11 lentiviral plasmids were transduced as above (100 µl viral supernatant) into U2OS CRISPRi cells stably expressing TMEM11 sgRNA #3. The bottom 33% of GFP-expressing cells was sorted by FACS in the UTSW Flow Cytometry Core.
To generate U2OS mito-mKeima cells, U2OS cells were seeded into a 6-well plate (200,000 cells per well) and incubated for 24 h with 25 µl viral supernatant of pHAGE-mt-mKeima (kindly provided by Richard Youle; #131626; Addgene; Vargas et al., 2019) supplemented with 5.33 µg/ml polybrene. After infection, cells were allowed to grow and the bottom 50% of mKeima expressing cells was sorted by FACS in the UTSW Flow Cytometry Core.
Whole-cell lysates and Western analysis
To prepare whole-cell lysates, cells were trypsinized, harvested, washed once with DPBS, and lysed in 1× RIPA buffer (150 mM NaCl, 50 mM Tris HCl, pH 7.5, 1% Na-deoxycholate, 0.1% SDS, 1% NP-40, and 1 mM EDTA) supplemented with 1× protease inhibitor cocktail (539131; MilliporeSigma). Protein concentration was determined using a Bradford or BCA assay and normalized before adding 6× Laemmli buffer (6% SDS (w/v), 21.6% glycerol (v/v), 0.18 M Tris HCl, pH 6.8, 0.01% bromophenol blue (w/v), and 10% β-mercaptoethanol (v/v)) to a final concentration of 1×. Samples were heated for 5 min at 95°C, and equal amounts of lysate were loaded on Tris-Glycine or Tricine polyacrylamide gels. After electrophoresis, proteins were electroblotted on PVDF membranes (0.45 µm pore size) or nitrocellulose membranes (0.2 µm pore size), and immunoblotted with the following primary antibodies: rabbit anti-TMEM11 (16564-1-AP; Proteintech), mouse anti-actin (66009-1-Ig; Proteintech), rabbit anti-MIC10 (84969; Abcam), rabbit anti-MIC13 (25515-1-AP; Proteintech), rabbit anti-MIC19 (HPA042935; Atlas Antibodies), rabbit anti-MIC25 (20639-1-AP; Proteintech), mouse anti-MIC26 (MA515493; Thermo Fisher Scientific), rabbit anti-MIC27 (PA5-51427; Thermo Fisher Scientific), rabbit anti-MIC60 (10179-1-AP; Proteintech), rabbit anti-OGDH (15212-1-AP; Proteintech), anti-BNIP3 (sc-56167; Santa Cruz [mouse] or 44060; Cell Signaling Technology [rabbit]), rabbit anti-BNIP3L (12396; Cell Signaling Technology), rabbit anti-VDAC1/2 (10866-1-AP; Proteintech), mouse anti-GAPDH (60004-1-Ig; Proteintech), mouse anti-TOMM20 (Abcam 56783), rabbit anti-SAMM50 (Proteintech 20824-1-AP or Abcam 133709), rabbit anti-DNAJC11 (Abcam 183518), rabbit anti-LC3 (Proteintech 14600-1-AP), mouse anti-alpha Tubulin (66031-1-Ig; Proteintech). Secondary antibodies (anti-rabbit DyLight 800 [SA5-35571; Thermo Fisher Scientific], goat anti-mouse DyLight 800 [SA5-35521; Thermo Fisher Scientific], goat anti-rabbit DyLight 680 [35568; Thermo Fisher Scientific], or goat anti-mouse DyLight 680 [35518; Thermo Fisher Scientific]) were used and visualized with an Odyssey Infrared Imaging System (LI-COR) or a ChemiDoc MP Imaging System (BioRad). Linear adjustments (and nonlinear adjustments for contrast enhancement, where stated) to images were made using Adobe Photoshop. Quantification of unprocessed images was performed with ImageJ or ImageStudioLite.
Mitochondria isolation
Mitochondria were isolated by differential centrifugation as previously described (Hoppins et al., 2011b) with the following modifications. U2OS cells were grown to confluency on 15 cm dishes, rinsed with DPBS, and harvested by scraping into warm DPBS and centrifugation (200 × g, 5 min). Cells were resuspended in 5–10 pellet volumes of cold mitochondria isolation buffer (10 mM Tris/MOPS, pH 7.4, 0.25 M sucrose, and 1 mM EGTA) and lysed with 25 strokes of a glass Dounce homogenizer fitted with a tight pestle. Unbroken cells and nuclei were pelleted by centrifugation (600 × g, 10 min, 4°C). This process was repeated, and cellular lysate was pooled. Crude mitochondria were then isolated by centrifugation (10,000 × g, 15 min, 4°C) and resuspended in cold mitochondria isolation buffer. Mitochondria concentration was measured by a Bradford assay and 100 µg aliquots were flash frozen in liquid nitrogen and stored at −80°C.
In Fig. S2 C (silencing of BNIP3/BNIP3L), mitochondria were isolated from U2OS cells that were subjected to two rounds of transfection with the indicated siRNAs. U2OS cells were seeded at 2,000,000/dish in 10 cm dishes 12–16 h prior to transient transfection with the indicated siRNAs (20 nM) with Lipofectamine RNAiMAX (Thermo Fisher Scientific). The liposome/siRNA mixture was added to culture media for 24 h, then ∼4,000,000 cells were passaged to a 15 cm dish and allowed to adhere 12–16 h prior to a second round of transfection as above. After the second transfection, mitochondria were isolated as described above.
2D BN-PAGE analysis
Mitochondria aliquots (100 µg) were thawed on ice, pelleted by centrifugation (21,000 × g, 10 min, 4°C), and resuspended in 20 µl of 1× NativePAGE Sample Buffer (Thermo Fisher Scientific) supplemented with 1× protease inhibitor cocktail and digitonin (SigmaMillipore) to a final detergent:protein ratio of 6 g/g. Samples were solubilized on ice for 15 min and subjected to centrifugation (21,000 × g, 30 min, 4°C). The supernatant containing solubilized mitochondria was supplemented with Coomassie Blue G-250 dye to a final detergent:dye ratio of 16 g/g before running on a 3–12% NativePAGE Mini Protein Gel (Thermo Fisher Scientific) according to manufacturer’s directions. Protein complex sizes were standardized with NativeMark Unstained Protein Standard (ThermoFisher). For the second-dimension SDS-PAGE, entire lanes were excised and incubated in 10 ml of denaturing buffer (0.12 M Tris-HCl, pH 6.8, 4% SDS, 20% glycerol, and 10% β-mercaptoethanol) for 25 min (Fiala et al., 2011). Gel slices were microwaved for 10 s halfway through incubation. Each gel slice was loaded horizontally on a denaturing Tris-Glycine polyacrylamide gel and sealed into position by overlaying with 0.75% agarose in SDS-PAGE running buffer. Western blotting was performed as described above. Intensity plot profiles were generated in ImageJ by aligning and cropping each blot according to molecular weight standards, subtracting background signal, and normalizing the signal at each x-axis position as a percentage of the total signal for each blot.
Protease protection assay
Mitochondria were isolated from U2OS cells by differential centrifugation as described above, except cells were lysed with a single set of 10 strokes with a glass Dounce homogenizer and crude mitochondria were obtained by lower speed centrifugation (7,400 × g, 10 min, 4°C). Protease protection analysis was performed as previously described (Hoppins et al., 2011a) with the following modifications. Mitochondria (25 µg) were resuspended in 500 µl mitochondria isolation buffer (10 mM Tris/MOPS, pH 7.4, 0.25 M sucrose, and 1 mM EGTA), mitoplast/swelling buffer (10 mM Tris/MOPS, pH 7.4), or solubilization buffer (mitochondria isolation buffer containing 1% Triton X-100). The mitoplast/swelling sample was incubated 15 min on ice and then vigorously pipetted 15 times to disrupt the OMM. Proteinase K (100 µg/ml) was then added to the indicated samples and incubated on ice for 15 min. Protease digestion was stopped by addition of PMSF (2 mM) and incubating the samples on ice for 5 min. The Triton X-100 solubilized sample was immediately subjected to TCA precipitation (12.5%). The remaining samples were subjected to centrifugation (10,400 × g, 15 min, 4°C), supernatants were discarded, and pellets were resuspended in 50 µl mitochondria isolation buffer supplemented with 1× protease inhibitor cocktail. Proteases were denatured (65°C, 10 min) and samples were TCA precipitated. All protein pellets were washed in acetone, dried, and resuspended in 1× MURB sample buffer (100 mM MES, pH 7.0, 3 M urea, 1% SDS, and 10% β-mercaptoethanol) prior to Western analysis.
Immunoprecipitations
The indicated cell lines were grown to confluency in 15 cm dishes and harvested by trypsinization and centrifugation. Cells were washed in DPBS and lysed by incubation for 30 min on ice in three pellet volumes of immunoprecipitation lysis buffer (IPLB; 20 mM HEPES-KOH, pH 7.4, 150 mM KOAc, 2 mM Mg(Ac)2, 1 mM EGTA, and 0.6 M sorbitol) supplemented with 1% digitonin and 1× protease inhibitor cocktail. Cell lysate was then recovered after centrifugation (11,500 × g, 10 min, 4°C) and protein concentration was measured with a Bradford assay before lysate was stored at −80°C.
For mass spectrometry, immunoprecipitation was performed on two independently prepared samples. Equivalent amounts of thawed lysate (5 mg replicate 1, 10 mg replicate 2) were incubated for 4 h at 4°C with 5 µg anti-GFP antibody (ab290; Abcam) or mock-treated as a control. Antibodies were captured with 100 µl of μMACS protein G beads (Miltenyi) for 4 h at 4°C. Beads were isolated with μ columns and a μMACS separator (Miltenyi), washed three times with 800 µl of IPLB supplemented with 0.1% w/v digitonin and 1× protease inhibitor cocktail, and two times with 500 µl of IPLB. Samples were eluted using on-bead trypsin digestion with 25 µl of elution buffer-I (2 M urea, 50 mM Tris-HCl, pH 7.5, 1 mM DTT, and 5 µg/ml trypsin) for 30 min followed by 2 × 50 µl elution buffer-II (2 M urea, 50 mM Tris-HCl, pH 7.5, and 5 mM 2-chloroacetamide) and incubated overnight. Samples were quenched by addition of 1 µl trifluoroacetic acid and submitted to the UT Southwestern Proteomics Core for liquid chromatography/tandem MS analysis. Analysis of the samples and raw MS data files were performed as previously described (Tirrell et al., 2020), except peptide identification was performed against the Homo sapiens protein database from UniProt. Abundance values for each identified protein were calculated as the sum of the peak intensities for each peptide identified for that protein. Proteins were included in analysis (see Table S1) that were identified with >40-fold abundance enrichment in GFP-treated samples relative to beads alone and had at least five peptide spectral matches in either experiment. NSAF was then calculated for each replicate (the total number of spectral counts [SpC]) identifying a protein, divided by the protein’s length (L), divided by the sum of SpC/L for all proteins in each experiment (Zhu et al., 2010).
For Western analysis, immunoprecipitations were performed as above using 1.4 mg lysate per each sample. The following amounts of antibody were used: 2.5 µg rabbit anti-GFP (ab290; Abcam), 0.07 µg rabbit anti-BNIP3 (44060; Cell Signaling Technology), 0.92-1.84 µg rabbit anti-BNIP3L (12396; Cell Signaling Technology), and 1.5 µg rabbit anti-MIC60 (10179-1-AP; Proteintech). Antibodies were captured with 25 µl of μMACS protein G beads. Proteins were eluted with 2 × 25 µl of 2× Laemmli buffer pre-warmed to 95°C.
Yeast two hybrid analysis
Yeast two-hybrid analysis was performed with the Matchmaker Gold Yeast Two-Hybrid System (Takara). Y2H Gold and Y187 yeast strains were transformed with bait (pGBKT7 plasmids and derivatives) and prey (pGADT7 plasmids and derivatives), respectively, by lithium acetate transformation. Haploid bait- and prey-expressing strains were mated on YPD plates (1% yeast extract, 2% peptone, and 2% glucose) for 24 h and diploids were subsequently selected on synthetic dextrose (SD; 0.7% yeast nitrogen base, 2% glucose, and amino acids) -leu-trp plates. Cells were grown to exponential phase in SD-leu-trp media, normalized to 0.5 OD 600 per ml, and cells were spotted on SD-leu-trp (permissive) and SD-leu-trp-his (selection) plates. Plates were then incubated at 30°C prior to analysis.
Electron microscopy analysis
To determine mitochondrial ultrastructure in CRISPRi cells, 100,000 cells were plated onto glass-bottom dishes (MatTek), allowed to adhere for ∼16 h, and fixed with 2.5% (v/v) glutaraldehyde in 0.1 M sodium cacodylate buffer and submitted to UTSW Electron Microscopy Core Facility for further processing. After five rinses in 0.1 M sodium cacodylate buffer, they were post-fixed in 1% osmium tetroxide and 0.8% K3[Fe(CN6)] in 0.1 M sodium cacodylate buffer for 1 h at 4°C. Cells were rinsed with water and en bloc stained with 2% aqueous uranyl acetate overnight at 4°C. After five rinses with water, specimens were dehydrated with increasing concentration of ethanol at 4°C, infiltrated with Embed-812 resin and polymerized in a 60°C oven overnight. Embed-812 discs were removed from MatTek plastic housing by submerging the dish in liquid nitrogen. Pieces of the disc were glued to blanks with super glue and blocks were sectioned with a diamond knife (Diatome) on a Leica Ultracut UCT (7) ultramicrotome (Leica Microsystems) and collected onto copper grids and post-stained with 2% uranyl acetate in water and lead citrate. Images were acquired on a JEM-1400 Plus transmission electron microscope equipped with a LaB6 source operated at 120 kV using an AMT-BioSprint 16 M CCD camera.
For proximity labeling, cells stably expressing APEX2-GFP-TMEM11 or GFP-TMEM11 were processed as previously described (Datta et al., 2019) with the following modifications. Briefly, 50,000 cells were plated on gridded glass bottom dishes (MatTek) and allowed to adhere for ∼16 h prior to fixation with 2.5% glutaraldehyde in cacodylate buffer (100 mM sodium cacodylate with 2 mM CaCl2, pH 7.4) for 30 min. Fixed cells were incubated in DAB solution (1.3 mM DAB, 10 mM H2O2 in PBS) for 10 min at room temperature and washed three times with PBS. Coordinates of DAB-stained cells were determined by brightfield microscopy. Then, cells were processed and imaged as described above except without post-staining.
Analysis of mitochondrial morphology by fluorescence microscopy
To analyze mitochondrial morphology, untreated CRISPRi cells were grown directly to ∼60% confluency on glass-bottom dishes (Cellvis). For transient knockdowns, the indicated siRNAs were transfected at a final concentration of 20 nM with Lipofectamine RNAiMAX (Thermo Fisher Scientific). The liposome/siRNA mixture was added directly to culture media for 24 h. Then, cells were passaged to glass bottom dishes for morphology analysis or culture dishes for whole cell lysate preparation to confirm knockdown efficiency by Western blotting. Cells were incubated for an additional 12–16 h prior to analysis. Cells were treated 25 nM Mitotracker Deep Red FM (Thermo Fisher Scientific) for 30 min, washed once with growth media, and imaged at 37°C with a Nikon Eclipse Ti inverted epifluorescence microscope equipped with a Hamamatsu Orca-Fusion sCMOS camera and a Nikon 100× 1.45-NA objective and acquired with Nikon Elements. All images were deconvolved using AutoQuant X3 (10 iterations, blind deconvolution, and low noise), and linear adjustments were made with Fiji. All data analysis/quantification was performed on non-deconvolved images using Fiji (see below). All z-series images were obtained using a 0.2-µm step size, and maximum projection images are shown. Samples were blinded prior to imaging and subsequent analysis and cells were manually categorized as fragmented, tubular, mildly enlarged, and severely enlarged or bulbous based on their mitochondrial morphology. Images were collected from three independent experiments, and ∼100 cells were analyzed per experiment. Statistical comparison was performed between each sample by unpaired two-tailed t test of the combination of mild and severe mitochondrial enlargement morphology categories.
Mito-mKeima mitophagy assay
HeLa mito-mKeima or U2OS mito-mKeima cells were seeded at 200,000/well in a 6-well plate 12–16 h prior to transient transfection with the indicated siRNAs (20 nM) with Lipofectamine RNAiMAX (Thermo Fisher Scientific). The liposome/siRNA mixture was added to culture media for 24 h, then 200,000 cells were passaged to 6-well plates and allowed to adhere 12–16 h prior to a second round of transfection as above. After the second transfection, 75,000 cells were passaged into glass-bottom dishes and the remainder of cells was passaged to culture dishes for Western analysis to confirm knockdown at the end of the experiment. For untreated cells, cells were allowed to grow an additional 36 h prior to imaging. To mimic hypoxia, cells were allowed to adhere for 12 h and treated with CoCl2 (250 µM HeLa and 500 µM U2OS; Sigma-Aldrich) for 24 h prior to analysis. CoCl2-treated samples where BNIP3 and/or BNIP3L were depleted were simultaneously treated with 20 µM Q-VD-OPh (Apexbio) to prevent apoptotic cell death. Imaging was performed using a Zeiss Axio Observer microscope equipped with a Yokogawa CSU-W1 spinning disk module and a Photometrics Prime 95B sCMOS camera and a Zeiss 63× objective. Z-series images were acquired with a 0.2-µm step size. Detection of neutral mito-mKeima and acidified mito-mKeima were made using dual excitation with 473 nm (pH 7) and 561 nm (pH 4) lasers, respectively, and a 617/73 nm (73-nm bandpass filter centered at 617 nm) emission filter. Samples were blinded prior to analysis and the number of acidified mito-mKeima puncta per cell was manually counted in Fiji by examining single plane images throughout z-series of individual cells. Images were collected from three independent experiments, and 100 cells were analyzed per experiment. Data depicted graphically are the collective sum of data from all experiments. Statistical comparison was performed between each sample by unpaired two-tailed t test.
Immunofluorescence and analysis of TMEM11 localization relative to MIC60, BNIP3/BNIP3L, and LC3
For all immunofluorescence assays, cells grown on glass-bottom cover dishes (CellVis) were fixed in 4% paraformaldehyde solution in PBS (15 min, room temperature). Fixed cells were permeabilized (0.1% Triton X-100 in PBS), blocked (10% FBS and 0.1% Triton X-100 in PBS), and then incubated for either 30 min or overnight at 4°C with the indicated primary antibodies (mouse anti-TOMM20 [56783; Abcam], rabbit anti-HSP60 [15282-1-AP; Proteintech], rabbit anti-BNIP3 [44060; Cell Signaling Technology], rabbit anti-BNIP3L [12396; Cell Signaling Technology], rabbit anti-TMEM11 [HPA062854; Atlas Antibodies], and/or mouse anti-MIC60 [110329;Abcam]) in blocking buffer. After several washes in PBS, cells were incubated with secondary antibodies (Goat anti-rabbit Alexa Fluor Plus 488 [A-32731; Thermo Fisher Scientific], donkey anti-rabbit Alexa Fluor 647 Plus [PIA32795; Thermo Fisher Scientific], donkey anti-mouse Alexa Fluor 647 [A-31571; Thermo Fisher Scientific], donkey anti-rabbit Alexa Fluor 555 [A-31572; Thermo Fisher Scientific], and/or donkey anti-mouse Alexa Fluor 555 [A-31570; Thermo Fisher Scientific]) in blocking buffer for 30 min. Cells were subsequently washed several times in PBS prior to imaging. Images were acquired on a Nikon Ti2 microscope equipped with Yokogawa CSU-W1 spinning disk confocal and SoRa modules, a Hamamatsu Orca-Fusion sCMOS camera and a Nikon 100× 1.45 NA objective. All images were acquired using a 0.2-µm step size with the spinning disk module, except where noted below, and image adjustments were made with ImageJ/Fiji.
For analysis of TMEM11 localization relative to MIC60 (Fig. 3), cells stably expressing GFP-TMEM11 were grown to ∼50% confluency on glass bottom cover dishes and processed as described above. Z-series images were acquired using the SoRa module (additional 2.8 optical magnification) using a 0.2-µm step size. Images were deconvolved using AutoQuant X3 (10 iterations, blind deconvolution, and low noise).
For analysis of GFP-TMEM11 localization relative to BNIP3, BNIP3L, and/or mCherry-LC3 (Fig. 8), plain U2OS cells were transiently transfected with GFP-TMEM11 and, where indicated, with mCherry-LC3. The liposome/plasmid DNA mixture was prepared using 100 ng of the indicated plasmid and Lipofectamine 3000 (Thermo Fisher Scientific) according to manufacturer’s instructions and added to culture media for 5 h. Then, 80,000 cells were passaged into glass-bottom dishes. For untreated cells, cells were allowed to grow an additional 36 h prior to fixation. To mimic hypoxia, cells were allowed to adhere for 12 h and treated with CoCl2 (500 µM; Sigma-Aldrich) for 24 h prior to fixation. Immunofluorescence was performed as described above prior to imaging with the spinning disk module. To determine the co-enrichment of TMEM11 with BNIP3 or BNIP3L, enlarged foci enriched for BNIP3 or BNIP3L signal were manually counted in Fiji by examining single plane images throughout z-series of individual cells blinded to the corresponding TMEM11 image and vice versa, followed by assessment of whether TMEM11 was co-enriched. To determine whether TMEM11/BNIP3 co-enrichments were positive for mCherry-LC3, TMEM11/BNIP3 enrichment sites were first identified blind to mCherry signal by manually examining single plane images throughout the z-series of individual cells.
For analysis of BNIP3 localization in the presence or absence of TMEM11 (Fig. 9), U2OS cells were seeded at 200,000/well in a 6-well plate 12–16 h prior to transient transfection with the indicated siRNAs (20 nM) with Lipofectamine RNAiMAX (Thermo Fisher Scientific) according to manufacturer’s instructions. The liposome/siRNA mixture was added to culture media for 24 h, then 200,000 cells were passaged to 6-well plates and allowed to adhere 12–16 h prior to a second round of transfection as above. After the second transfection, 80,000 cells were passaged into glass-bottom dishes and the remainder of cells was passaged to culture dishes for Western analysis to confirm knockdown at the end of the experiment. For untreated cells, cells were allowed to grow an additional 36 h prior to fixation. To mimic hypoxia, cells were allowed to adhere for 12 h and treated with CoCl2 (500 µM) for 24 h prior to fixation. Immunofluorescence was performed as described above prior to imaging with the spinning disk module. Samples were then blinded prior to analysis, and the number of enlarged BNIP3-enriched foci per sample was manually counted in Fiji by examining single plane images throughout z-series of individual cells. Enrichments were simultaneously scored as being attached to the mitochondrial network or on a fragment of mitochondria. To determine MIC60 localization to BNIP3 enrichments, BNIP3 enrichments were identified blind to MIC60 signal and were scored blinded to sample identity.
For analysis of endogenous TMEM11 or BNIP3/BNIP3L localization (Fig. S6), plain U2OS cells were grown to ∼50% confluency on glass-bottom cover dishes, treated where indicated with CoCl2 for 24 h (500 µM), and processed for immunofluorescence as described above and imaged with the spinning disk confocal module.
Mitochondrial reactive oxygen species (ROS)
For mitochondrial ROS analysis, trypsinized cells were resuspended in HBSS with 5 μM final concentration MitoSOX (M36008; Thermo Fisher Scientific), and then incubated at 37°C for 30 min. After incubation, cells were washed and resuspended in HBSS, followed by immediate FACS analysis. For mitochondrial mass analysis, cells were resuspended in HBSS with 500 nM final concentration MitoTracker Deep Red (M22426; Thermo Fisher Scientific), and then incubated at 37°C for 30 min. After incubation, cells were washed and resuspended in HBSS, followed by immediate FACS analysis. All analysis was performed at the Moody Foundation Flow Cytometry Facility at UT Southwestern Medical Center on a FACS Aria flow cytometer (BD Biosciences). Data were analyzed by FACSDiva (BD Biosciences) or FlowJo (Version10.6.1) software. Statistical significance was assessed using an unpaired two-tailed t test.
Extracellular flux (Seahorse) assay
Trypsinized cells were counted and 10,000 cells per well were plated in Seahorse XFe96 cell culture plates and allowed to attach overnight. The following day, cells were washed twice with assay medium (DMEM [D5030; Sigma-Aldrich] with 10 mM glucose, 2 mM L-glutamine, 1 mM sodium pyruvate, and 1% penicillin/streptomycin), and 150 μl assay medium (final volume) was added to each well after the second wash. Cells were transferred to a 37°C, CO2-free incubator for 1 h. Oxygen consumption rate (OCR) measurements were performed in a Seahorse XFe96 instrument using a 3 min mix, 3 min measure cycle with three measurements recorded at baseline and after injection of each compound. The following inhibitors were sequentially injected at the indicated final concentrations: 2 μM oligomycin, 1 μM CCCP, and 2 μM antimycin A. Data collection was performed with WAVE (v.2.4.1.1) software. At the completion of the experiment, cells were fixed with formalin, stained with DAPI, and cell counts were measured per well using a Celigo imaging cytometer (Nexcelom Bioscience, 5.1.0.0). Mitochondrial OCR was calculated as basal (pre-oligomycin) OCR – baseline (post-antimycin) OCR. Maximal OCR was calculated as CCCP-stimulated OCR – baseline (post-antimycin) OCR. Mitochondrial and maximal OCR values were normalized by the cell count per well. Statistical significance was assessed using a two-tailed t test.
Statistical analyses
Statistical significance of data as described above was assessed using an unpaired two-tailed t test with Welch’s correction using GraphPad Prism 9 software. Data distribution was assumed to be normal, but this was not formally tested.
Online supplemental material
Fig. S1 characterizes MIC60-depleted cells. Fig. S2 shows additional 2D Blue Native PAGE analyses. Fig. S3 shows characterization of GFP-TMEM11 and APEX2-GFP-TMEM11 expressing cells. Fig. S4 shows analysis of TMEM11- and MIC60-depleted HeLa mito-mKeima expressing cells. Fig. S5 shows additional characterization of TMEM11-depleted cells. Fig. S6 shows endogenous localization of TMEM11 and BNIP3/BNIP3L before and after CoCl2 treatment. Table S1 shows raw data from IP/MS analysis of GFP-TMEM11 expressing cells.
Acknowledgments
We thank Richard Youle (National Institutes of Health; NIH) for generously providing HeLa mito-mKeima cells. We thank Mike Henne and Angelique Whitehurst (University of Texas Southwestern) for sharing plasmids and helpful discussions. The UTSW Flow Cytometry Core Facility provided experimental support for stable cell line generation. The UTSW Proteomics Core Facility performed mass spectrometry analysis.
The UTSW EM facility prepared samples for analysis and is supported by NIH grant 1S10OD021685-01A1. The UTSW Quantitative Light Microscopy Facility, which is supported in part by NIH grant P30CA142543, provided access to the Nikon SoRa microscope (purchased with NIH grant 1S10OD028630-01 to Kate Luby-Phelps) and deconvolution software. This work was supported by grants from the NIH to J. Friedman (R00HL133372 and R35GM137894), to P. Mishra (1DP2ES030449 and 1R01AR073217), and the UTSW Endowed Scholars Program.
Author contributions: Conceptualization and methodology: J.R. Friedman, M.O. Gok, and P. Mishra; Investigation: M.O. Gok, O.M. Connor, X. Wang, C.J. Menezes, and C.B. Llamas; Formal analysis: M.O. Gok, X. Wang, C.J. Menezes, and C.B. Llamas; Writing—original draft: J.R. Friedman, M.O. Gok; Writing—review and editing: J.R. Friedman, M.O. Gok, and P. Mishra; Funding acquisition and supervision: J.R. Friedman and P. Mishra.

