


Sphingomyelin plays a key role in cellular cholesterol homeostasis by binding to and sequestering cholesterol in the plasma membrane. We discovered that synthesis of very long chain (VLC) sphingomyelins is inversely regulated by cellular cholesterol levels; acute cholesterol depletion elicited a rapid induction of VLC-sphingolipid synthesis, increased trafficking to the Golgi apparatus and plasma membrane, while cholesterol loading reduced VLC-sphingolipid synthesis. This sphingolipid–cholesterol metabolic axis is distinct from the sterol responsive element binding protein pathway as it requires ceramide synthase 2 (CerS2) activity, epidermal growth factor receptor signaling, and was unaffected by inhibition of protein translation. Depletion of VLC-ceramides reduced plasma membrane cholesterol content, reduced plasma membrane lipid packing, and unexpectedly resulted in the accumulation of cholesterol in the cytoplasmic leaflet of the lysosome membrane. This study establishes the existence of a cholesterol–sphingolipid regulatory axis that maintains plasma membrane lipid homeostasis via regulation of sphingomyelin synthesis and trafficking.
Introduction
The most abundant lipids of the plasma membrane (PM) are sphingolipids (SPLs) and cholesterol, which together can constitute up to 40 mol% of PM lipids (Lorent et al., 2020; van Meer et al., 2008). The most abundant SPL is sphingomyelin (SM), and it binds to cholesterol within a membrane bilayer (Finean, 1953; Goñi, 2022; Lönnfors et al., 2011; Slotte, 1992), favoring the liquid-ordered membrane phase (Courtney et al., 2018). Acute depletion of cholesterol from cells or pharmacological inhibition of cholesterol trafficking from the ER to the Golgi apparatus results in an increase in the rate of SM synthesis (Lagace et al., 1999; Leppimäki et al., 1998; Perry and Ridgway, 2006), underscoring the close relationship between cholesterol and SPLs. However, the mechanisms that regulate the amounts of cholesterol and SPLs in organelle membranes are poorly understood.
Cholesterol exists in two forms in organelle membranes: “bound” and “unbound.” The bound pool is associated with membrane phospholipids, notably SM, and integral membrane proteins such that it is shielded from recognition by soluble cholesterol-binding proteins (Das et al., 2014; Lange and Steck, 2016). The unbound cholesterol pool, which is also termed “accessible,” “free,” and “active,” is susceptible to exogenous cholesterol oxidation (Lange and Steck, 2016; Lange et al., 2004), association with soluble cholesterol-binding proteins (Das et al., 2013; Farrand et al., 2015; Infante and Radhakrishnan, 2017), and extraction from the membrane (Das et al., 2014; Litz et al., 2016). Herein, we use the term “free” to refer to this pool of cholesterol. Within the PM, cholesterol preferentially binds SM (Lönnfors et al., 2011), implying that the abundance of SM is a key determinant of the relative sizes of the bound and free cholesterol pools.
SPLs are broadly classified according to the identity of the N-linked fatty acid that is attached to the long-chain sphingoid base (sphingosine or sphinganine) to form ceramides, the metabolic precursors to SM, and hexosylceramides. Whereas “long chain” (LC) SPLs contain 14–20-carbon fatty acyl chains, “very long chain” (VLC) SPLs contain 22–26-carbon fatty acyl chains. In the de novo SPL synthesis pathway, ceramides are produced by ER resident ceramide synthases (CerS), which exhibit preferences for fatty acid–acyl-CoA substrates of differing lengths (Levy and Futerman, 2010). Ceramide synthesis is coupled to its transport to the Golgi apparatus, where the enzymes that catalyze addition of SM and glycolipid headgroup reside (Pothukuchi et al., 2021). A soluble ceramide transport protein, CERT (Hanada et al., 2003; Kumagai et al., 2005), and a soluble cholesterol transfer protein, oxysterol-binding protein (Levine, 2004), mediate non-vesicular transport of ceramide and cholesterol, respectively, from the ER to the trans cisterna and trans-Golgi network (trans/TGN) of the Golgi apparatus at the ER–Golgi membrane contact site (ER–Golgi MCS). The homeostatic mechanisms that maintain the amounts of LC- and VLC-SPLs and cholesterol in organelle membranes are poorly understood.
In this study, we asked, does the cell regulate the synthesis of SM with regard to cellular cholesterol content? We observed that acute depletion of cholesterol elicited an increase in the rate of VLC-SM synthesis, but no change in the rate of LC-SPL synthesis. Conversely, cholesterol loading of cells resulted in a decrease in VLC-SPL synthesis, but no change in LC-SPL synthesis. Surprisingly, the increase in VLC-SPLs facilitated the recovery of PM cholesterol content by supporting egress of low-density lipoprotein (LDL)–derived cholesterol from the lysosome. These results reveal a metabolic SPL–cholesterol axis that inversely regulates synthesis of VLC-SPLs in relation to cellular cholesterol levels.
Results
Homeostasis of cholesterol-dependent PM lipid order
To investigate PM cholesterol and SPL homeostasis, we first monitored localization of a fluorescent-soluble cholesterol-binding protein, GFP-D4YDA (Liu et al., 2017), in HeLa cells acutely depleted of cholesterol by incubation with methyl-β-cyclodextrin (MβCD; Fig. 1, A and B; and Fig. S1, A and B). For these experiments, a stable HeLa cell line expressing GFP-D4YDA from an inducible promoter was used so that cells would be naïve to GFP-D4YDA expression before initiating the experiment, and hence it would not affect the proportion of bound cholesterol. We monitored intracellular localization of GFP-D4YDA over time after cholesterol depletion or, as a control, after addition of U18666A, a pharmacologic inhibitor of the lysosomal NPC1 cholesterol transporter, which has been previously shown to result in depletion of PM cholesterol (Lim et al., 2019; Liscum and Faust, 1989). Treatment with MβCD was estimated to remove ∼50% of cell-associated cholesterol within 30 min of incubation (Fig. S1, A and B). In unperturbed cells, GFP-D4YDA localized prominently to the inner leaflet of the PM but it translocated to the cytosol within 30 min of MβCD or U18666A treatments (Fig. 1 A). PM localization of GFP-D4YDA was restored within 4–8 h after incubating cholesterol-depleted cells in complete growth medium containing serum as a source of LDL-derived free cholesterol (i.e., cholesterol-replete medium; Fig. 1 B). Under identical conditions, the localization of a GFP-tagged reporter of phosphatidylserine (GFP-Lact-C2; Yeung et al., 2008) was unaffected.

PM cholesterol is required for establishing proper PM lipid order. (A) Acute cholesterol depletion reduces PM localization of the GFP-D4YDA cholesterol probe. Cells expressing GFP-D4YDA (D4YDA) or GFP-Lact-C2 (Lact-C2) were monitored by live cell spinning disc confocal fluorescence microscopy during incubation with 5 mM MβCD. To validate a requirement for PM cholesterol in GFP-D4YDA localization, cells were incubated with the NPC1 inhibitor (U18666A, 1 µg/ml) for 18 h prior to imaging (Lim et al., 2019; Liscum and Faust, 1989). m., minutes. (B) After depletion of cholesterol from the PM, the cytoplasmic GFP-D4YDA cholesterol probe was recruited back to the PM cells growing in the presence of LDL-cholesterol. Cells expressing GFP-D4YDA were treated with MβCD (5 mM) for 30 min and then the cells were incubated with medium containing 10% FBS. GFP-D4YDA fluorescence was monitored at 37°C by confocal fluorescence microscopy. Representative micrographs of three independent experiments are shown. (C) PM lipid order is reduced by cholesterol depletion and recovered by incubation in cholesterol-replete medium. Cells were mock treated, treated with MβCD (5 mM, 30 min), or treated with 5 mM MβCD before incubating in complete medium (10% FBS, 4 h). After the indicated treatment, the outer leaflet of the PM was loaded with di-4 (5 µM) and visualized by fluorescence spectral imaging microscopy. GP (i.e., membrane order) values of each pixel were calculated and were pseudo-colored using a three-color scale: blue for disordered, −1; white for intermediate, 0; red for ordered, 1. The distribution of pixel GP values is shown below the micrographs. Mean GP values of pixels from control were set to 0. Images from two independent experiments were analyzed. Histograms show mean values (dots) and distribution (error bars as vertical lines). (D) PM lipid order is gradually restored after transfer to cholesterol-replete medium. Cells grown in 96-well imaging plates were mock treated (control), treated with MβCD (5 mM, 30 min), or MβCD treated then incubated with 10% FBS in DMEM for specified times (recovery). Cells were stained with di-4 and fluorescence spectrum was measured by microplate fluorometer. The mean GP value of control cells was set to 0. Three independent experiments were performed and their values, means, and SD were shown as dots, bars, and error bars, respectively.
PM cholesterol is required for establishing proper PM lipid order. (A) Acute cholesterol depletion reduces PM localization of the GFP-D4YDA cholesterol probe. Cells expressing GFP-D4YDA (D4YDA) or GFP-Lact-C2 (Lact-C2) were monitored by live cell spinning disc confocal fluorescence microscopy during incubation with 5 mM MβCD. To validate a requirement for PM cholesterol in GFP-D4YDA localization, cells were incubated with the NPC1 inhibitor (U18666A, 1 µg/ml) for 18 h prior to imaging (Lim et al., 2019; Liscum and Faust, 1989). m., minutes. (B) After depletion of cholesterol from the PM, the cytoplasmic GFP-D4YDA cholesterol probe was recruited back to the PM cells growing in the presence of LDL-cholesterol. Cells expressing GFP-D4YDA were treated with MβCD (5 mM) for 30 min and then the cells were incubated with medium containing 10% FBS. GFP-D4YDA fluorescence was monitored at 37°C by confocal fluorescence microscopy. Representative micrographs of three independent experiments are shown. (C) PM lipid order is reduced by cholesterol depletion and recovered by incubation in cholesterol-replete medium. Cells were mock treated, treated with MβCD (5 mM, 30 min), or treated with 5 mM MβCD before incubating in complete medium (10% FBS, 4 h). After the indicated treatment, the outer leaflet of the PM was loaded with di-4 (5 µM) and visualized by fluorescence spectral imaging microscopy. GP (i.e., membrane order) values of each pixel were calculated and were pseudo-colored using a three-color scale: blue for disordered, −1; white for intermediate, 0; red for ordered, 1. The distribution of pixel GP values is shown below the micrographs. Mean GP values of pixels from control were set to 0. Images from two independent experiments were analyzed. Histograms show mean values (dots) and distribution (error bars as vertical lines). (D) PM lipid order is gradually restored after transfer to cholesterol-replete medium. Cells grown in 96-well imaging plates were mock treated (control), treated with MβCD (5 mM, 30 min), or MβCD treated then incubated with 10% FBS in DMEM for specified times (recovery). Cells were stained with di-4 and fluorescence spectrum was measured by microplate fluorometer. The mean GP value of control cells was set to 0. Three independent experiments were performed and their values, means, and SD were shown as dots, bars, and error bars, respectively.

Measurement of lipid extraction by MβCD treatment. (A) MβCD treatment extracts alkyne cholesterol (Alk.Chol.). Cells were incubated with alkyne cholesterol for 2 d. Cells were treated with DMEM containing 5 mM MβCD for designated times. Lipids were extracted from cells or used medium. Lipids were reacted with click chemistry reagents containing coumarine azide (fluorophore). Coumarine-conjugated lipids were separated and visualized on TLC. Positions of alkyne cholesterol and alkyne cholesterol ester (Alk.CE) were found by reference alkyne cholesterol-coumarine conjugates. (B) MβCD treatment depletes ∼50% of cellular cholesterol within 20 min. The mean values (SD) of two independent determinations are shown. m., minutes. (C) Acute cholesterol depletion elicits increased synthesis of SM. Cells were pulse labeled with pacSph for 1 h prior to incubation with 5 mM MβCD for 2 h. Lipids quantifications are expressed as proportions of total pacSPL products (excluding the substrate, pacSph). (D) MβCD treatment does not extract detectable amounts of pacSPL. pacSph 3 µM was given to cells for 1 h. Cells were washed and metabolites were chased for 2 h. Cells were treated with DMEM or DMEM containing MβCD for 30 min. The used medium and cells were collected for lipid extraction. Lipids were treated and visualized as A. (E) Cholesterol depletion induces a transient accumulation of pacSPLs in the Golgi apparatus. Fluorescent pacSph adducts and a Golgi resident (p230) were visualized by confocal fluorescence microscopy. Fluorescence of pacSPL conjugates within p230-defined ROIs were calculated in arbitrary units (A.U.). The single cell datapoints (>2,000 Golgi area) from independent experiments (n = 4) are collectively depicted as dots. The black-outlined dots indicate mean intensities of pacSPL conjugates from four independent experiments. One-way ANOVA analysis and post hoc Tukey’s multiple comparisons were used (P value <0.01, **; <0.001, ***; <0.0001, ****).
Measurement of lipid extraction by MβCD treatment. (A) MβCD treatment extracts alkyne cholesterol (Alk.Chol.). Cells were incubated with alkyne cholesterol for 2 d. Cells were treated with DMEM containing 5 mM MβCD for designated times. Lipids were extracted from cells or used medium. Lipids were reacted with click chemistry reagents containing coumarine azide (fluorophore). Coumarine-conjugated lipids were separated and visualized on TLC. Positions of alkyne cholesterol and alkyne cholesterol ester (Alk.CE) were found by reference alkyne cholesterol-coumarine conjugates. (B) MβCD treatment depletes ∼50% of cellular cholesterol within 20 min. The mean values (SD) of two independent determinations are shown. m., minutes. (C) Acute cholesterol depletion elicits increased synthesis of SM. Cells were pulse labeled with pacSph for 1 h prior to incubation with 5 mM MβCD for 2 h. Lipids quantifications are expressed as proportions of total pacSPL products (excluding the substrate, pacSph). (D) MβCD treatment does not extract detectable amounts of pacSPL. pacSph 3 µM was given to cells for 1 h. Cells were washed and metabolites were chased for 2 h. Cells were treated with DMEM or DMEM containing MβCD for 30 min. The used medium and cells were collected for lipid extraction. Lipids were treated and visualized as A. (E) Cholesterol depletion induces a transient accumulation of pacSPLs in the Golgi apparatus. Fluorescent pacSph adducts and a Golgi resident (p230) were visualized by confocal fluorescence microscopy. Fluorescence of pacSPL conjugates within p230-defined ROIs were calculated in arbitrary units (A.U.). The single cell datapoints (>2,000 Golgi area) from independent experiments (n = 4) are collectively depicted as dots. The black-outlined dots indicate mean intensities of pacSPL conjugates from four independent experiments. One-way ANOVA analysis and post hoc Tukey’s multiple comparisons were used (P value <0.01, **; <0.001, ***; <0.0001, ****).
Within a membrane bilayer, cholesterol increases phospholipid fatty acyl chain order, thereby increasing lipid packing (Chakraborty et al., 2020; Mouritsen and Zuckermann, 2004). Acute depletion of cholesterol results in a severe reduction in PM lipid order (i.e., viscosity; Owen et al., 2006), a result corroborated in this study using spectral imaging fluorescence microscopy of cells incubated with di-4-ANEPPDHQ (di-4), a solvatochromic dye that incorporates into the exofacial PM leaflet (Fig. 1 C; Owen et al., 2006, 2011). To determine if the decrease of PM lipid packing due to cholesterol depletion is reversible, we measured PM lipid order, expressed as generalized polarization (GP) values, after incubating cholesterol-depleted cells in complete growth medium. Fig. 1 C shows representative pseudo-colored images of di-4–labeled cells treated with MβCD and of cells treated with MβCD and then transferred to cholesterol-replete medium for 4 h. In agreement with published studies (Owen et al., 2006, 2011), cholesterol depletion resulted in a severe loss of PM order that recovered to near control GP values within 4 h of incubation in cholesterol-replete medium (Fig. 1 C). In an alternative protocol, di-4 fluorescence of populations of cells (confluent cells in 96-well plates) was used to calculate GP values during the recovery period. As with the single-cell analyses, we observed that PM lipid order was gradually restored over 4–8 h, which parallels the time course of GFP-D4YDA recruitment to the PM (Fig. 1 D). These observations establish that MβCD treatment reduces PM lipid order by extracting cholesterol, but not SPLs, and that PM lipid order and cholesterol levels are restored within 4–8 h after providing cells with serum LDL. We speculate that this response reveals a homeostatic response to cholesterol depletion that ultimately replenishes the free pool of PM cholesterol and possibly other organelle membranes that are affected by MβCD treatment.
Cholesterol depletion induces SPL metabolic flow toward VLC species
It has been reported that acute cholesterol depletion by MβCD increases the rate of SM synthesis (Leppimäki et al., 1998; Perry and Ridgway, 2006). To monitor SPL metabolic changes upon cholesterol depletion comprehensively, targeted sphingolipidomic analysis was used (Fig. 2, A and B). Lipids were extracted from MβCD-treated (2 h) or control cells, and the quantity of SPLs was measured by liquid chromatography–mass spectrometry/mass spectrometry. These determinations revealed significant (P < 0.05) increases in the amounts of three saturated VLC SM species (22 carbon-saturated fatty acid, C22:0, 28%; C24:0, 44%; C26:0, 52% increase compared to each SM content in control) and one LC SM (C18:0 SM). We also observed significant (P < 0.05) decreases in the amounts of C24 dihydroceramide and C22:0 ceramide.

Acute cholesterol deletion elicits increased metabolic flow toward VLC-SM synthesis. (A) Sphingolipidome changes elicited by acute cholesterol depletion. Cells were incubated for 2 h in medium containing 5 mM MβCD prior to lipid extraction. Lipid amounts were quantified by liquid chromatography–mass spectrometry/mass spectrometry. Fold changes of SPLs pmol per cells (log2, MβCD-treated/non-treated cells) and P values that were calculated from Student’s t test (negative log) are shown. One dotted line is drawn to denote P = 0.05 and one to denote 0 values of fold change. Lipid species with P < 0.05 are shown in bigger dots; lipids with >0.05 shown in smaller dots as statistical significance test (Sig.Test). Types of SPLs are denoted in different colors (Cer, ceramide; MonoHex, monohexosylceramide; SM, sphingomyelin; DHCer, dihydroceramide; DHMonoHex, dihydromonohexosylceramide; DHSM, dihydrosphingomyelin; Sphingosine 1P, sphingosine-1-phosphate; Sphinganine 1P, sphinganine-1-phosphate). (B) Data in A presented in heatmaps. Red-white-blue color codes denote the fold changes of SPLs pmol per cells from high to low (log2FC, MβCD-treated/non-treated cells). Black-white color codes denote low-to-high P values. P values <0.05 are denoted as gray gradients; P values >0.05 white. (C) TLC analysis of pacSph metabolism. Cells were pulse labeled with pacSph for 1 h and chased in pacSph-free medium for the indicated amounts of time. The positions of individual pacSph-derived products were determined from lipid standards and are indicated on the right of the chromatogram. (D) SMS1 is responsible for pacVLC- and pacLC-SM synthesis. pacSph pulse-chase analysis of cholesterol-depleted SMS1 null cells subjected to acute cholesterol depletion (2 h chase with or without MβCD). Product percentages of pacVLC- and pacLC-SM are shown. (E) pacSph pulse-chase experiments were performed with cholesterol-depleted or cholesterol-excessive conditions. Product percentages of pacVLC- and pacLC-SM are shown. (F) pacSph pulse-chase analysis of cells depleted of cholesterol by saponin treatment. Product percentages of pacVLC- and pacLC-SM are shown. For D–F, datapoints from independent experiments are represented as dots, mean values as bars, SD as error bars. One-way ANOVA analyses were used. Then datasets that have <0.05 of ANOVA P value were subjected to Šídák’s (D) or Tukey’s (E and F) multiple comparisons (P value >0.05, ns; <0.05, *; <0.01, **; <0.001, ***; <0.0001, ****).
Acute cholesterol deletion elicits increased metabolic flow toward VLC-SM synthesis. (A) Sphingolipidome changes elicited by acute cholesterol depletion. Cells were incubated for 2 h in medium containing 5 mM MβCD prior to lipid extraction. Lipid amounts were quantified by liquid chromatography–mass spectrometry/mass spectrometry. Fold changes of SPLs pmol per cells (log2, MβCD-treated/non-treated cells) and P values that were calculated from Student’s t test (negative log) are shown. One dotted line is drawn to denote P = 0.05 and one to denote 0 values of fold change. Lipid species with P < 0.05 are shown in bigger dots; lipids with >0.05 shown in smaller dots as statistical significance test (Sig.Test). Types of SPLs are denoted in different colors (Cer, ceramide; MonoHex, monohexosylceramide; SM, sphingomyelin; DHCer, dihydroceramide; DHMonoHex, dihydromonohexosylceramide; DHSM, dihydrosphingomyelin; Sphingosine 1P, sphingosine-1-phosphate; Sphinganine 1P, sphinganine-1-phosphate). (B) Data in A presented in heatmaps. Red-white-blue color codes denote the fold changes of SPLs pmol per cells from high to low (log2FC, MβCD-treated/non-treated cells). Black-white color codes denote low-to-high P values. P values <0.05 are denoted as gray gradients; P values >0.05 white. (C) TLC analysis of pacSph metabolism. Cells were pulse labeled with pacSph for 1 h and chased in pacSph-free medium for the indicated amounts of time. The positions of individual pacSph-derived products were determined from lipid standards and are indicated on the right of the chromatogram. (D) SMS1 is responsible for pacVLC- and pacLC-SM synthesis. pacSph pulse-chase analysis of cholesterol-depleted SMS1 null cells subjected to acute cholesterol depletion (2 h chase with or without MβCD). Product percentages of pacVLC- and pacLC-SM are shown. (E) pacSph pulse-chase experiments were performed with cholesterol-depleted or cholesterol-excessive conditions. Product percentages of pacVLC- and pacLC-SM are shown. (F) pacSph pulse-chase analysis of cells depleted of cholesterol by saponin treatment. Product percentages of pacVLC- and pacLC-SM are shown. For D–F, datapoints from independent experiments are represented as dots, mean values as bars, SD as error bars. One-way ANOVA analyses were used. Then datasets that have <0.05 of ANOVA P value were subjected to Šídák’s (D) or Tukey’s (E and F) multiple comparisons (P value >0.05, ns; <0.05, *; <0.01, **; <0.001, ***; <0.0001, ****).
We hypothesized that the observed increases in the amounts of VLC SPLs after cholesterol depletion were due to increased synthesis of VLC- relative to LC-SPL synthesis. To test this, we performed metabolic pulse-chase labeling experiments using pac-sphingosine (pacSph), a modified sphingosine reagent containing a “click chemistry handle” that allows it to be used to monitor SPL metabolism and trafficking in cultured cells (Gerl et al., 2016; Sundberg et al., 2019a; Fig. 2 C). We optimized thin-layer chromatography (TLC) conditions to allow us to clearly distinguish LC-SM and VLC-SM species (Fig. S2), though we were unable to distinguish LC and VLC ceramide or glycolipid species, chiefly due to their low abundances. Quantitation of the relative amounts of pacSph-derived products, including pacCeramide (pacCer), pacGlucosylCeramide (pacGlcCer), pacVLC-SM, and pacLC-SM, are presented in Fig. S2. SM synthesis was confirmed by assaying SM synthase 1 (SMS1) null cells (Fig. 2 D). Throughout this manuscript, we refer to pacSph-derived SPLs as “sphingolipids” except when needed for clarity. The results of these pulse-chase experiments corroborated the sphingolipidome analyses; MβCD treatment resulted in increased flow of pacSph-derived metabolites toward VLC-SM (pacVLC-SM; Fig. 2, D and E) and also increased the relative amount of pacSMs (Fig. S1 C), as observed previously in metabolic radiolabeling experiments (Perry and Ridgway, 2006). MβCD treatment did not extract detectable amounts of pacSPLs (Fig. S1 D), demonstrating that the observed increase of VLC-SM is due to increased synthesis. Importantly, acute depletion of cholesterol by a different reagent, saponin (Raghupathy et al., 2015), elicited an increase in the metabolic flow to pacVLC-SM that was identical in magnitude to MβCD-mediated cholesterol depletion, further confirming that cholesterol is the relevant depleted lipid (Fig. 2 F). Of note, the increase in SM synthesis upon cholesterol depletion was previously attributed to an elevated rate of CERT-mediated ceramide trafficking from the ER to the Golgi apparatus at the ER–Golgi MCS (Perry and Ridgway, 2006). However, siRNA-mediated depletion of CERT or VAPA and VAPB, two redundant ER resident proteins required for the ER–Golgi MCS, reduced the amount of LC-SM, mainly (Fig. S3, C and D). These results show that cholesterol depletion elicited increased synthesis of VLC-SM via a biosynthetic pathway that is independent of CERT- and VAPA/B. In the context of our observations, it is pertinent that the size of the ceramide binding pocket of CERT accommodates LC- (≤C20) but not VLC-ceramides (Kudo et al., 2008).

pacSph pulse-chase experimental results. pacSph pulse-chase experiments were performed with specific cell lines or conditions as described in the figure. Product percentages of pacCer (black), pacGlcCer (gray 1), pacVLC-SM (gray 2), and pacLC-SM (gray 3) are described as stacked bars (total 100%, pacSphingolipid). Three or more independent experiments were performed and mean values were used for the size of the bars; SD for error bars. (A) pacSph pulse-chase experimental results with control and SMS1-null cells (supplementary to Fig. 2 D). (B) Results from cells treated with MβCD or excessive cholesterol (Fig. 2 E). (C) Results from cells treated with MβCD or saponin (Fig. 2 F). (D) Results from cells treated with MβCD, siNT, siCerS2, or siCerS6 (Fig. 3 A). (E) Results from cells expressing eGFP or Sar1b-H79G (Fig. 4 A). (F) Results from cells treated with MβCD, siNT, or siCERT (Fig. S3 C). (G) Results from cells treated with MβCD, siNT, or siVAPA + siVAPB (Fig. S3 D). (H and I) Results from cells treated with MβCD or MβCD + following recovery (Fig. 5 A). (J) Results from cells treated with MβCD and/or cycloheximide (CHX; Fig. S4 A). (K) Results from cells treated with MβCD, siNT, or siCerS5 (Fig. S3 G). (L) Results from cells treated with different concentrations of EGF (Fig. S5 A). (M) Results from cells treated with MβCD or Gefitinib (Fig. S5 B).
pacSph pulse-chase experimental results. pacSph pulse-chase experiments were performed with specific cell lines or conditions as described in the figure. Product percentages of pacCer (black), pacGlcCer (gray 1), pacVLC-SM (gray 2), and pacLC-SM (gray 3) are described as stacked bars (total 100%, pacSphingolipid). Three or more independent experiments were performed and mean values were used for the size of the bars; SD for error bars. (A) pacSph pulse-chase experimental results with control and SMS1-null cells (supplementary to Fig. 2 D). (B) Results from cells treated with MβCD or excessive cholesterol (Fig. 2 E). (C) Results from cells treated with MβCD or saponin (Fig. 2 F). (D) Results from cells treated with MβCD, siNT, siCerS2, or siCerS6 (Fig. 3 A). (E) Results from cells expressing eGFP or Sar1b-H79G (Fig. 4 A). (F) Results from cells treated with MβCD, siNT, or siCERT (Fig. S3 C). (G) Results from cells treated with MβCD, siNT, or siVAPA + siVAPB (Fig. S3 D). (H and I) Results from cells treated with MβCD or MβCD + following recovery (Fig. 5 A). (J) Results from cells treated with MβCD and/or cycloheximide (CHX; Fig. S4 A). (K) Results from cells treated with MβCD, siNT, or siCerS5 (Fig. S3 G). (L) Results from cells treated with different concentrations of EGF (Fig. S5 A). (M) Results from cells treated with MβCD or Gefitinib (Fig. S5 B).
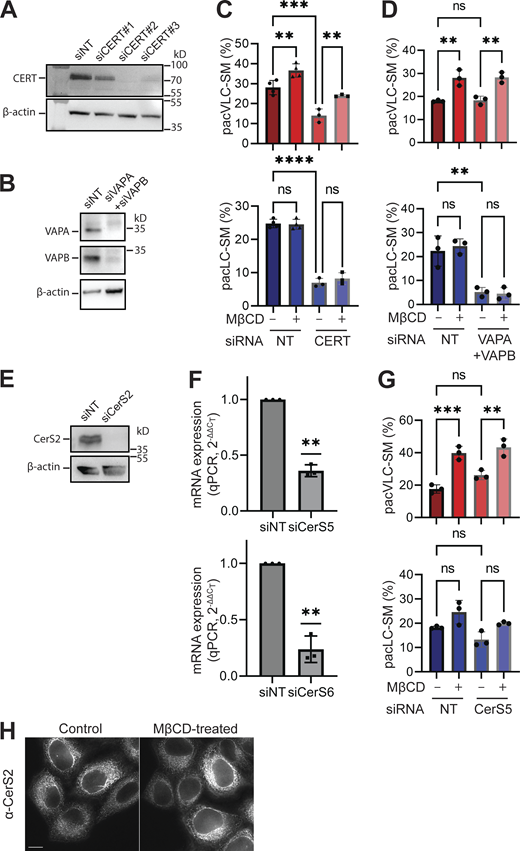
Downregulating ER-Golgi MCS or CerS5 does not affect VLC-SM synthesis. (A and B) Immunoblot analysis shows that siCERT #2 and siVAPA + siVAPB treatment significantly reduced levels of respective proteins. Three independent experiments were performed and representative blots are shown. (C) Depletion of CERT reduces SM synthesis but maintains the increased metabolic toward VLC-SM upon MβCD treatment. Cells were treated with siNT or siCERT (siRNA #2, efficiency verified in A). Cells were treated with MβCD or control conditions. pacSph pulse-chase experiments were performed. Product percentages of pacVLC- and pacLC-SM are described. (D) Depletion of both VAPA and VAPB reduces LC-SM synthesis. Cells were treated with siNT or siVAPA + siVAPB. Other experimental conditions were the same as C. (E) siCerS2 reduces CerS2 expression in immunoblot analysis. Anti-CerS2 antibody was used. (F) siCerS5 or siCerS6 reduces CerS5 or CerS6 expression, respectively. Cells were treated with siNT, siCerS5, or siCerS6. mRNA levels were analyzed by using gene-specific primers and RT-qPCR (ΔΔCT method). One sample Student’s t test from value 1 was used (P value <0.01, **). (G) Reducing CerS5 expression did not affect significant levels of SM metabolic flow. siCerS5 was used to reduce CerS5 expression. Other experimental conditions were the same as C. For C, D, and G, statistical significance was evaluated by one-way ANOVA analysis and post hoc Šídák’s multiple comparisons were performed (P value >0.05, ns; <0.01, **; <0.001, ***; <0.0001, ****). (H) Acute cholesterol depletion does not change subcellular localization of CerS2. Immunofluorescence images for CerS2 show an apparent ER-like network tubules, and it does not change by acute cholesterol depletion. Confocal fluorescence microscopy was used to image cells stained with anti-CerS2 antibody. The scale bar is 10 µm. Source data are available for this figure: SourceData FS3.
Downregulating ER-Golgi MCS or CerS5 does not affect VLC-SM synthesis. (A and B) Immunoblot analysis shows that siCERT #2 and siVAPA + siVAPB treatment significantly reduced levels of respective proteins. Three independent experiments were performed and representative blots are shown. (C) Depletion of CERT reduces SM synthesis but maintains the increased metabolic toward VLC-SM upon MβCD treatment. Cells were treated with siNT or siCERT (siRNA #2, efficiency verified in A). Cells were treated with MβCD or control conditions. pacSph pulse-chase experiments were performed. Product percentages of pacVLC- and pacLC-SM are described. (D) Depletion of both VAPA and VAPB reduces LC-SM synthesis. Cells were treated with siNT or siVAPA + siVAPB. Other experimental conditions were the same as C. (E) siCerS2 reduces CerS2 expression in immunoblot analysis. Anti-CerS2 antibody was used. (F) siCerS5 or siCerS6 reduces CerS5 or CerS6 expression, respectively. Cells were treated with siNT, siCerS5, or siCerS6. mRNA levels were analyzed by using gene-specific primers and RT-qPCR (ΔΔCT method). One sample Student’s t test from value 1 was used (P value <0.01, **). (G) Reducing CerS5 expression did not affect significant levels of SM metabolic flow. siCerS5 was used to reduce CerS5 expression. Other experimental conditions were the same as C. For C, D, and G, statistical significance was evaluated by one-way ANOVA analysis and post hoc Šídák’s multiple comparisons were performed (P value >0.05, ns; <0.01, **; <0.001, ***; <0.0001, ****). (H) Acute cholesterol depletion does not change subcellular localization of CerS2. Immunofluorescence images for CerS2 show an apparent ER-like network tubules, and it does not change by acute cholesterol depletion. Confocal fluorescence microscopy was used to image cells stained with anti-CerS2 antibody. The scale bar is 10 µm. Source data are available for this figure: SourceData FS3.
If increased synthesis of VLC-SM upon cholesterol depletion represents a homeostatic response to cholesterol levels, cholesterol loading of cells is expected to decrease the rate of VLC-SM synthesis. Indeed, a specific reduction in VLC-SM synthesis was observed when cells were incubated with cholesterol-MβCD (Fig. 2 E). The increased amount of VLC-SM measured by pacSph metabolic labeling was not affected by incubation of cells in cycloheximide, whereas cycloheximide did prevent the increase in the amount of β-hydroxy β-methylglutaryl-Coenzyme A reductase (HMGCR), a prominent upregulated target of the Sterol Regulatory Element Binding Protein (SREBP) pathway (Fig. S4). Taken together, the results point to the existence of a sphingolipid–cholesterol homeostasis axis that is distinct from the SREBP cholesterol homeostasis pathway and adjusts the amount of VLC-SM in accordance with cholesterol levels.
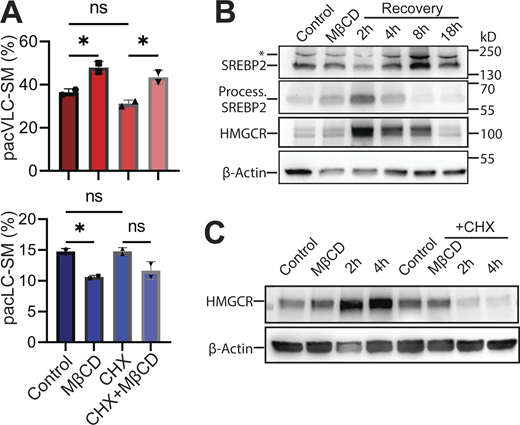
Changes in VLC-SM metabolic flux by MβCD treatment are independent of SREBP2 pathway. (A) Cycloheximide (CHX) treatment does not abolish the increase of VLC-SM synthesis upon cholesterol depletion. Cells were treated with MβCD (5 mM) and/or CHX (10 µg/ml) as indicated. pacSph pulse-chase experiments were performed. Product percentages of pacVLC- and pacLC-SM are described. Statistical significance was evaluated by one-way ANOVA analysis and post hoc Šídák’s multiple comparisons were performed (P value >0.05, ns; <0.05, *). (B) SREBP2 proteolytic processing and HMGCR expression after cholesterol depletion. Cholesterol was acutely depleted by incubation with 5 mM MβCD for 30 min followed by incubation of cells in cholesterol-replete medium (10% FBS) for the indicated periods of time. Immunoblotting was used to compare the amounts of the pro- and proteolytic-processed SREBP and the amounts of HMGCR. β-actin was used for loading control. (C) Inhibition of protein synthesis prevents upregulation of HMGCR expression upon cholesterol depletion. Cells were incubated with CHX (10 µg/ml) prior to cholesterol depletion. The levels of HMGCR and β-actin were monitored by immunoblotting. For B and C, three independent experiments were performed and the results of one representative experiment are shown. Source data are available for this figure: SourceData FS4.
Changes in VLC-SM metabolic flux by MβCD treatment are independent of SREBP2 pathway. (A) Cycloheximide (CHX) treatment does not abolish the increase of VLC-SM synthesis upon cholesterol depletion. Cells were treated with MβCD (5 mM) and/or CHX (10 µg/ml) as indicated. pacSph pulse-chase experiments were performed. Product percentages of pacVLC- and pacLC-SM are described. Statistical significance was evaluated by one-way ANOVA analysis and post hoc Šídák’s multiple comparisons were performed (P value >0.05, ns; <0.05, *). (B) SREBP2 proteolytic processing and HMGCR expression after cholesterol depletion. Cholesterol was acutely depleted by incubation with 5 mM MβCD for 30 min followed by incubation of cells in cholesterol-replete medium (10% FBS) for the indicated periods of time. Immunoblotting was used to compare the amounts of the pro- and proteolytic-processed SREBP and the amounts of HMGCR. β-actin was used for loading control. (C) Inhibition of protein synthesis prevents upregulation of HMGCR expression upon cholesterol depletion. Cells were incubated with CHX (10 µg/ml) prior to cholesterol depletion. The levels of HMGCR and β-actin were monitored by immunoblotting. For B and C, three independent experiments were performed and the results of one representative experiment are shown. Source data are available for this figure: SourceData FS4.
Increased VLC-sphingolipid synthesis facilitates recovery of PM membrane lipid order
The fatty acid chain length specificity in SPL metabolism depends on CerS that exhibit marked substrate preferences for fatty acids of differing chain lengths (Levy and Futerman, 2010). The immediate precursors to LC- and VLC-sphingolipids (VLC-SPL), LC- and VLC-ceramides, are produced by ER-localized CerS1–6 in mammals. Published transcript profiling of HeLa cells detected CERS2, CERS6, and possibly CERS5 transcripts, but not CERS1, CERS3, and CERS4 transcripts (Uhlén et al., 2015). Validated siRNAs were used to deplete expression of CerS2, CerS5, and CerS6 from cells (Fig. S3, E and F), and the levels of LC-and VLC-SMs that were produced before and after cholesterol depletion were determined by pacSph pulse-chase assays. Cells depleted of CerS2 showed a decrease in VLC-SM synthesis but no change in LC-SM synthesis, identifying CerS2 as the major source of VLC-ceramides for VLC-SM. Depletion of CerS6 decreased LC-SM synthesis but had no effect on VLC-SM synthesis (Fig. 3 A). Depletion of CerS5 resulted in no changes in LC- and VLC-SPLs (Fig. S3 G). Of note, depletion of CerS2 eliminated cholesterol-regulated VLC-SPL synthesis but depletion of CerS6 did not, distinguishing a role for CerS2 but not CerS6 in cholesterol-regulated VLC-SPL synthesis.

VLC-sphingolipid synthesis promotes PM lipid order. (A) Treatment of siRNA targeting CerS2, but not CerS6, reduces VLC-SM synthesis and its cholesterol-dependent upregulation of VLC-SM synthesis. Cells were transfected with siRNAs targeting CerS2, CerS6, or a non-target (NT) control. pacSph pulse-chase experiment was performed. During chase period, cells were mock-treated (control) or treated with MβCD (5 mM, 30 min). Product percentages of pacVLC- and pacLC-SM are shown. (B) Depletion of CerS2 expression reduces PM lipid order and eliminates the recovery of PM lipid order upon return to LDL-cholesterol replete medium. Cells were treated with siRNAs targeting CerS2, CerS6, or a non-target control. Cells were mock-treated (control), treated with MβCD (5 mM, 30 min), or treated with MβCD and then incubated with LDL-cholesterol replete medium (serum-containing) for 4 h (recovery). Cells were stained with di-4 and their GP values were calculated as Fig. 1 D. For A and B, datapoints from independent experiments are represented as dots, mean values as bars, SD as error bars. One-way ANOVA analysis was performed (P < 0.05). Datasets were subject to Šídák’s multiple comparisons (P value >0.05, ns; <0.05, *; <0.01, **).
VLC-sphingolipid synthesis promotes PM lipid order. (A) Treatment of siRNA targeting CerS2, but not CerS6, reduces VLC-SM synthesis and its cholesterol-dependent upregulation of VLC-SM synthesis. Cells were transfected with siRNAs targeting CerS2, CerS6, or a non-target (NT) control. pacSph pulse-chase experiment was performed. During chase period, cells were mock-treated (control) or treated with MβCD (5 mM, 30 min). Product percentages of pacVLC- and pacLC-SM are shown. (B) Depletion of CerS2 expression reduces PM lipid order and eliminates the recovery of PM lipid order upon return to LDL-cholesterol replete medium. Cells were treated with siRNAs targeting CerS2, CerS6, or a non-target control. Cells were mock-treated (control), treated with MβCD (5 mM, 30 min), or treated with MβCD and then incubated with LDL-cholesterol replete medium (serum-containing) for 4 h (recovery). Cells were stained with di-4 and their GP values were calculated as Fig. 1 D. For A and B, datapoints from independent experiments are represented as dots, mean values as bars, SD as error bars. One-way ANOVA analysis was performed (P < 0.05). Datasets were subject to Šídák’s multiple comparisons (P value >0.05, ns; <0.05, *; <0.01, **).
To address potential roles of CerS2 and VLC-SPLs in PM lipid homeostasis, di-4 spectral imaging fluorescence microscopy analyses were used to compare the overall PM lipid order of cells depleted of CerS2 or CerS6 before and after cholesterol depletion and serum add-back (Fig. 3 B). GP values for both CerS2- and CerS6-depleted cells were decreased compared with control cells growing in cholesterol-replete medium, a finding that underscores the contributions of SPLs to overall PM lipid order. Importantly, whereas the mean GP value of CerS6-depleted cells recovered to the starting value within 4 h (P < 0.01), the mean GP of CerS2-depleted cells did not (P > 0.05). These results reveal a specific, critical role for CerS2 and VLC-SPLs in facilitating PM lipid homeostasis after cholesterol depletion.
Cholesterol depletion increases the rate of sphingolipid trafficking within the secretory pathway
The synthesis of LC-SPLs in the Golgi apparatus relies on trafficking of LC-ceramide from the ER to the trans/TGN by CERT. However, the mechanism of ER-to-Golgi trafficking of VLC-ceramides has not been established. Previously, it was speculated that bulk membrane trafficking mediates delivery of VLC-ceramide from the ER to the Golgi apparatus (Funato et al., 2020; Loizides-Mangold et al., 2012). Export of secreted proteins from the ER is dependent upon the coatomer-II (COPII) membrane coat protein complex. To test if ER-to-Golgi trafficking of VLC lipids also relies on COPII, we monitored LC- and VLC-SM synthesis by pacSph pulse-chase assays of cells that expressed a dominant inhibitory form of the Sar1 GTPase, Sar1b-H79G, which has previously been shown to interfere with COPII coat assembly, resulting in the accumulation of biosynthetic protein cargo in the ER (Aridor et al., 1995). We observed that expression of Sar1b-H79G inhibited the accumulation of VLC-SM but had no effect on the amount of LC-SM after acute cholesterol depletion (Fig. 4 A). Since LC-SM synthesis is unaffected by expression of Sar1b-H79G, but VLC-SM synthesis is decreased, the results suggest that VLC-ceramide must be transported to the Golgi apparatus via COPII-dependent export from the ER.

Cholesterol depletion increases sphingolipid flow through the secretory pathway. (A) Expression of Sar1b-H79G, an inhibitor of COPII-dependent ER export of proteins, prevents the cholesterol-dependent increase of VLC-SM synthesis. Cells were transfected with plasmids that directly express Sar1b-H79G or eGFP (control). OE, overexpression. pacSph pulse-chase experiments were performed. Product percentages of pacVLC- and pacLC-SM are shown. Datapoints from independent experiments are represented as dots, mean values as bars, and SD as error bars. Statistical significance was evaluated by one-way ANOVA analysis and post hoc Šídák’s multiple comparisons were performed (P value >0.05, ns; <0.01, **; <0.001, ***). (B) In situ analysis of pacSPL trafficking. Cells were pulse labeled with pacSph (1 µM; 15 min), incubated in 5 mM MβCD-containing medium or normal medium for 30 min (Chase 30 m.), and then fixed for immunofluorescence. For longer chase periods (Chase 2 h. or 4 h.), cells were further incubated for designated time in normal medium and fixed. Anti-p230 immunostaining was used to delimit the Golgi apparatus (magenta). pacSph-containing lipids were visualized in situ by fluorescence microscopy of pacSph-containing lipids (green) that were labeled with Alexa Fluor 647 azide. Cells were visualized after fixation by deconvolution fluorescence microscopy. Inset images were from magnified ROIs in 4-h-chase images (white squares). The scale bar indicates 10 µm. (C) Cholesterol depletion induces accumulation of diacylglycerol at the Golgi apparatus. MβCD-treated/non-treated cells expressing a resident protein (GalT-BFP, magenta) of trans/TGN Golgi compartments and a reporter of DAG (C1A-RFP, green) were visualized by live cell confocal fluorescence microscopy. Cells were incubated with 5 mM MβCD-containing medium and imaged with 405 and 546 nm lasers for 90 min. The white lines delimit the Golgi ROI. Note that C1A-RFP localizing to nuclei is excluded from analysis. (D) Accumulation of the C1A-RFP DAG probe in the Golgi apparatus requires the SM synthesis by SMS1 and SMS2. Cells treated with siRNAs (siNT, non-target; siSMS1+siSMS2, siRNAs targeting SMS1 or SMS2 were mixed), and/or MβCD were imaged as described in C and the fluorescence intensities of the DAG probe in masks defined by GalT-BFP (Golgi ROI) were graphed. Mean fluorescence intensities in Golgi ROI were normalized by setting the initial intensities to 1. The mean DAG probe intensities of 20 cells from three independent experiments are presented as dots. The color-shaded areas indicate 95% confidence intervals. (E) BODIPY-Cer and its downstream metabolites (BODIPY-Cer/SPL) undergo exocytosis via secretory carriers containing an SM-binding protein, EQ-SM. Cells were loaded with BODIPY-Cer-BSA complex (5 uM; 4°C; 30 min) and TIRF microscopy was used to determine the proportion of exocytic events where BODIPY-Cer/SPL and EQ-SM or EQ-sol that were released from the same carrier. A secreted soluble reporter protein of bulk secretion, EQ-sol, served as a control. More than 300 events for each condition from three independent experiments were assessed. Each dot represents the means of each independent experiment (n = 3) and SDs are presented as error bars. (F) The number of BODIPY-Cer/SPL exocytosis per µm2 is increased after acute cholesterol depletion. Data are presented as E. The Student’s t test was used for E and F to calculate P values (P value <0.05, *; <0.01, **).
Cholesterol depletion increases sphingolipid flow through the secretory pathway. (A) Expression of Sar1b-H79G, an inhibitor of COPII-dependent ER export of proteins, prevents the cholesterol-dependent increase of VLC-SM synthesis. Cells were transfected with plasmids that directly express Sar1b-H79G or eGFP (control). OE, overexpression. pacSph pulse-chase experiments were performed. Product percentages of pacVLC- and pacLC-SM are shown. Datapoints from independent experiments are represented as dots, mean values as bars, and SD as error bars. Statistical significance was evaluated by one-way ANOVA analysis and post hoc Šídák’s multiple comparisons were performed (P value >0.05, ns; <0.01, **; <0.001, ***). (B) In situ analysis of pacSPL trafficking. Cells were pulse labeled with pacSph (1 µM; 15 min), incubated in 5 mM MβCD-containing medium or normal medium for 30 min (Chase 30 m.), and then fixed for immunofluorescence. For longer chase periods (Chase 2 h. or 4 h.), cells were further incubated for designated time in normal medium and fixed. Anti-p230 immunostaining was used to delimit the Golgi apparatus (magenta). pacSph-containing lipids were visualized in situ by fluorescence microscopy of pacSph-containing lipids (green) that were labeled with Alexa Fluor 647 azide. Cells were visualized after fixation by deconvolution fluorescence microscopy. Inset images were from magnified ROIs in 4-h-chase images (white squares). The scale bar indicates 10 µm. (C) Cholesterol depletion induces accumulation of diacylglycerol at the Golgi apparatus. MβCD-treated/non-treated cells expressing a resident protein (GalT-BFP, magenta) of trans/TGN Golgi compartments and a reporter of DAG (C1A-RFP, green) were visualized by live cell confocal fluorescence microscopy. Cells were incubated with 5 mM MβCD-containing medium and imaged with 405 and 546 nm lasers for 90 min. The white lines delimit the Golgi ROI. Note that C1A-RFP localizing to nuclei is excluded from analysis. (D) Accumulation of the C1A-RFP DAG probe in the Golgi apparatus requires the SM synthesis by SMS1 and SMS2. Cells treated with siRNAs (siNT, non-target; siSMS1+siSMS2, siRNAs targeting SMS1 or SMS2 were mixed), and/or MβCD were imaged as described in C and the fluorescence intensities of the DAG probe in masks defined by GalT-BFP (Golgi ROI) were graphed. Mean fluorescence intensities in Golgi ROI were normalized by setting the initial intensities to 1. The mean DAG probe intensities of 20 cells from three independent experiments are presented as dots. The color-shaded areas indicate 95% confidence intervals. (E) BODIPY-Cer and its downstream metabolites (BODIPY-Cer/SPL) undergo exocytosis via secretory carriers containing an SM-binding protein, EQ-SM. Cells were loaded with BODIPY-Cer-BSA complex (5 uM; 4°C; 30 min) and TIRF microscopy was used to determine the proportion of exocytic events where BODIPY-Cer/SPL and EQ-SM or EQ-sol that were released from the same carrier. A secreted soluble reporter protein of bulk secretion, EQ-sol, served as a control. More than 300 events for each condition from three independent experiments were assessed. Each dot represents the means of each independent experiment (n = 3) and SDs are presented as error bars. (F) The number of BODIPY-Cer/SPL exocytosis per µm2 is increased after acute cholesterol depletion. Data are presented as E. The Student’s t test was used for E and F to calculate P values (P value <0.05, *; <0.01, **).
As the synthesis of SM mainly occurs in the trans/TGN by SMS1 activity (Fig. 2 D), we postulated that the increase of VLC-SM synthesis is reflected as accumulation of the lipids in the Golgi apparatus or post-Golgi organelles where SMS1 localizes. To test this, cells were pulse chase labeled with pacSph; the pacSph-containing lipids were derivatized with a fluorescent dye using click chemistry and then pacSph adducts were visualized in situ by confocal fluorescence microscopy (Fig. 4 B). At the end of the 30-min chase period, pacSPLs were localized predominantly to the ER and Golgi apparatus, and with increasing chase time, pacSPLs accumulated transiently in the Golgi apparatus before exiting the Golgi in vesicles and tubules, as observed previously (Sundberg et al., 2019a). Changes in the amounts of pacSPLs in the Golgi apparatus were quantified by measuring mean fluorescence intensities of pixels within a Golgi mask (Fig. S1 E). We observed a significant increase in the Golgi localized pool of pacSPLs after acute cholesterol depletion, consistent with parallel increases in the rate of VLC-SM synthesis. Taken together, the results confirm that pacSph-derived ceramides are trafficked from the ER to the trans/TGN where they are converted to SM and glycolipids.
VLC-sphingolipids are trafficked from the Golgi apparatus to the PM via the “SM secretion” pathway
At extended chase times after cholesterol depletion (2, 4 h), pacSph adducts could be detected in Golgi-derived cytoplasmic vesicles that are putative secretory carriers (Fig. 4 B). Compared with control cells, cholesterol-depleted cells had more vesicles, and these were observed to exit the Golgi earlier, suggesting that export of complex SPLs may be upregulated after cholesterol depletion. We confirmed that pacSM was exported from the Golgi by determining relative changes in the Golgi pool of diacylglycerol (DAG), which is produced in equivalent amounts to SM by SM synthase. We used the C1a domain of protein kinase D fused to a red fluorescent protein (C1a-RFP) as a DAG reporter (Baron and Malhotra, 2002), allowing us to observe how MβCD treatment impacts DAG levels in the Golgi (Fig. 4, C and D). The mean fluorescence intensities of pixels within a Golgi mask were measured over time following MβCD treatment. Cholesterol depletion resulted in an increase in the amount of Golgi-localized DAG probe concomitantly with the accumulation of pacSPLs in the Golgi (Fig. 4, C and D). The observed increase in the Golgi-localized DAG reporter was decreased approximately twofold in cells depleted of SMS1 and SMS2 by siRNAs, indicating that the active pool of DAG in the Golgi apparatus of MβCD-treated cells was due to increased rates of SM synthesis. This result confirms that cholesterol depletion results in increased SM and DAG synthesis.
We have previously described an SM secretion pathway that traffics an engineered SM-binding reporter and selects native proteins from the Golgi apparatus to the PM (Deng et al., 2016, 2018; Sundberg et al., 2019b), and we speculated that the VLC-SM produced in response to cholesterol depletion is trafficked to the PM via the SM secretion pathway. As a first test of this hypothesis, we monitored exocytosis of BODIPY-C5 FL-ceramide (BODIPY-Cer), a short-chain fluorescent ceramide molecule that has been used to investigate SPL metabolism and trafficking within cells (Chazotte, 2012; Lipsky and Pagano, 1983; van Meer et al., 1987). Incubation of this soluble SPL reporter with cells results in its accumulation in the Golgi apparatus, its conversion to SM and other complex SPLs, and subsequent incorporation into the PM via fusion of Golgi-derived secretory vesicles (Lipsky and Pagano, 1983). We first determined the proportion of exocytosed vesicles containing BODIPY-ceramide and EQ-SM, a reporter of the SM secretion pathway, or “EQ-sol,” which is a reporter of bulk flow protein secretion. Cells constitutively expressing EQ-SM or EQ-sol were loaded with BODIPY-Cer, and two-color total internal reflection microscopy was used to determine the cargo loads (i.e., BODIPY-Cer, EQ-SM, or EQ-sol of exocytic vesicles) of individual exocytic vesicles as they fused with the PM. Whereas ∼75% of BODIPY-Cer-containing vesicles also contained EQ-SM, ∼40% of BODIPY-Cer-containing vesicles also contained EQ-sol (Fig. 4 E). In addition, the number of BODIPY-Cer exocytic events was increased ∼2.5-fold after MβCD treatment (Fig. 4 F). These results indicate that a rapid increase in the rate of BODIPY-Cer exocytic events that is elicited by cholesterol depletion, can be attributed to an increased rate of secretion via the SM secretion pathway.
VLC-sphingolipids promote PM cholesterol homeostasis
CerS2 depletion impairs the ability of cells to maintain PM lipid homeostasis (Fig. 3 B), raising the question, is the distribution of cholesterol affected in these cells? We hypothesized that reduced VLC-SPL synthesis impairs the interorganellar distribution of cholesterol. For cells grown in serum-containing culture medium, LDL is a significant source of cholesterol via endocytosis and trafficking to the lysosome, where it is processed to yield free cholesterol, which is exported from the lysosome and trafficked to the PM and other organelles via poorly characterized pathways (Ikonen and Zhou, 2021). First, we tested if serum-supplied cholesterol can restore homeostatic levels of VLC-SM synthesis upon acute cholesterol depletion. In pulse-chase assays, we observed that the increase of VLC-SM that was elicited by cholesterol depletion began to decrease within 2 h after transfer to cholesterol-replete medium and returned to control levels within 4–8 h—approximately the same time required for recovery of PM localized GFP-D4YDA (Fig. 5 A). The reduction in VLC-SM synthesis was not observed when medium containing delipidated FBS was used for the “recovery” experiments (Fig. 5 A), indicating that serum-derived cholesterol was used to restore PM cholesterol levels.

Depletion of CerS2 expression results in depletion of cholesterol from the PM and its accumulation in the membrane of the lysosome. (A) Serum-derived cholesterol (LDL derived) supports restoration of upregulated VLC-SM synthesis within 8 h. Cells were treated with mock (control) or 5 mM MβCD for 30 min (MβCD) and then pacSph pulse-chase experiments were performed. In separate cell cultures, MβCD-treated cells were incubated with 10% FBS (or delipidated FBS) in DMEM for defined periods (recovery for 2, 4, or 8 h), then pacSph pulse-chase experiments were performed. Product percentages of pacVLC-SM are shown. Datapoints from independent experiments are represented as dots, mean values as bars, and SD as error bars. One-way ANOVA analysis and post hoc Šídák’s multiple comparisons were performed (P value >0.05, ns; <0.05, *; <0.01, **; <0.001, ***; <0.0001, ****). (B) CerS2 promotes cholesterol localization to the PM. Cells expressing the GFP-D4YDA cholesterol probe were treated with siRNA targeting CerS2 or CerS6 (72 h) and then visualized by confocal fluorescence microscopy. (C) Quantification of the proportions of the GFP-D4YDA cholesterol probe on the PM. Cells were treated with siRNA as B. The PM was delimited by using CellMask and the ratios of the mean intensities of GFP in the PM versus the whole cell were calculated. Independent experiments (n = 3) are depicted in different colors. The black-outlined dots indicate mean intensities of independent experiments. Single-cell data points are shown in smaller dots. For mean intensities, one-way ANOVA analysis and post hoc Tukey’s multiple comparisons were performed (P value <0.05, *; <0.001, ***). (D) The GFP-D4YDA cholesterol probe localizes prominently to the lysosome membrane in cells depleted of CerS2. Cells were treated with siRNA (72 h) targeting CerS2. Anti-Lamp1 immunostaining was used to identify lysosomes by confocal fluorescence microscopy. The dotted yellow outline in the composite image depicts the outline of the cell. The scale bar indicates 10 µm. (E) Reducing CerS2 expression suppresses translocalization of GFP-D4YDA from the cytosol to the PM. GFP-D4YDA–expressing cells were treated with a NPC1 inhibitor (U18666A, 1 µM, overnight) and siRNAs targeting CerS2 or a non-targeted (NT) control. After washing out the NPC1 inhibitor, GFP-D4YDA fluorescence was visualized by live cell confocal fluorescence microscopy. Representative images from three independent experiments are presented. The scale bar indicates 10 µm. (F) Quantification of the PM-localized GFP-D4YDA upon washout of U18666A. The fluorescence images showing GFP-D4YDA signals in indicated conditions were analyzed to calculate the ratio of mean GFP intensities between PM and cytosol. The PM and cytosol were manually traced. The ratio of D4YDA fluorescence on the PM over fluorescence on in the cytosol were calculated. 20 individual cells from three independent experiments were analyzed. Mean ratios of PM over cytosol GFP intensities were described as dots. 95% confidence interval was described as shades with respective colors.
Depletion of CerS2 expression results in depletion of cholesterol from the PM and its accumulation in the membrane of the lysosome. (A) Serum-derived cholesterol (LDL derived) supports restoration of upregulated VLC-SM synthesis within 8 h. Cells were treated with mock (control) or 5 mM MβCD for 30 min (MβCD) and then pacSph pulse-chase experiments were performed. In separate cell cultures, MβCD-treated cells were incubated with 10% FBS (or delipidated FBS) in DMEM for defined periods (recovery for 2, 4, or 8 h), then pacSph pulse-chase experiments were performed. Product percentages of pacVLC-SM are shown. Datapoints from independent experiments are represented as dots, mean values as bars, and SD as error bars. One-way ANOVA analysis and post hoc Šídák’s multiple comparisons were performed (P value >0.05, ns; <0.05, *; <0.01, **; <0.001, ***; <0.0001, ****). (B) CerS2 promotes cholesterol localization to the PM. Cells expressing the GFP-D4YDA cholesterol probe were treated with siRNA targeting CerS2 or CerS6 (72 h) and then visualized by confocal fluorescence microscopy. (C) Quantification of the proportions of the GFP-D4YDA cholesterol probe on the PM. Cells were treated with siRNA as B. The PM was delimited by using CellMask and the ratios of the mean intensities of GFP in the PM versus the whole cell were calculated. Independent experiments (n = 3) are depicted in different colors. The black-outlined dots indicate mean intensities of independent experiments. Single-cell data points are shown in smaller dots. For mean intensities, one-way ANOVA analysis and post hoc Tukey’s multiple comparisons were performed (P value <0.05, *; <0.001, ***). (D) The GFP-D4YDA cholesterol probe localizes prominently to the lysosome membrane in cells depleted of CerS2. Cells were treated with siRNA (72 h) targeting CerS2. Anti-Lamp1 immunostaining was used to identify lysosomes by confocal fluorescence microscopy. The dotted yellow outline in the composite image depicts the outline of the cell. The scale bar indicates 10 µm. (E) Reducing CerS2 expression suppresses translocalization of GFP-D4YDA from the cytosol to the PM. GFP-D4YDA–expressing cells were treated with a NPC1 inhibitor (U18666A, 1 µM, overnight) and siRNAs targeting CerS2 or a non-targeted (NT) control. After washing out the NPC1 inhibitor, GFP-D4YDA fluorescence was visualized by live cell confocal fluorescence microscopy. Representative images from three independent experiments are presented. The scale bar indicates 10 µm. (F) Quantification of the PM-localized GFP-D4YDA upon washout of U18666A. The fluorescence images showing GFP-D4YDA signals in indicated conditions were analyzed to calculate the ratio of mean GFP intensities between PM and cytosol. The PM and cytosol were manually traced. The ratio of D4YDA fluorescence on the PM over fluorescence on in the cytosol were calculated. 20 individual cells from three independent experiments were analyzed. Mean ratios of PM over cytosol GFP intensities were described as dots. 95% confidence interval was described as shades with respective colors.
Next, we tested if CerS2 depletion impairs cholesterol distribution in cells. We determined GFP-D4YDA localization in cells depleted of CerS2 or CerS6 to investigate the cholesterol distribution (Fig. 5, B–D). In CerS2-depleted cells grown in a complete medium containing serum, GFP-D4YDA did not decorate the PM but rather it massively decorated intracellular compartments that were coincident with LAMP1 staining, revealing them to be lysosomes. The lysosomes of CerS2-depleted cells were clustered and appeared larger than lysosomes of control cells. In contrast, CerS6 depletion only modestly reduced the amount of GFP-D4YDA decorating the PM, and there were far fewer lysosomes that were decorated by the probe compared with CerS2-depleted cells.
These observations suggest that VLC-SPLs contribute to PM cholesterol homeostasis in part by supporting lysosome-to-PM trafficking and/or retention of cholesterol within the PM. To distinguish between these possibilities, we monitored GFP-D4YDA mobilization after inhibition of the major lysosome cholesterol exporter, NPC1, by U18666A, which has been shown to reduce PM cholesterol content (Lim et al., 2019; Liscum and Faust, 1989) and cause dissociation of GFP-D4YDA probes from the PM (Fig. 1 A and Fig. 5 E). In control cells, washout of U18666A led to restoration of GFP-D4YDA PM localization within just 10 min (Fig. 5, E and F). In cells depleted of CerS2, however, washout of U18666A did not restore GFP-D4YDA PM localization, even 30 min after washout. Therefore, VLC-SPLs play a critical role in cholesterol egress from the lysosome and/or trafficking to the PM.
Discussion
Previous studies observed that acute cholesterol depletion by MβCD elicited an increase in the rate of SM synthesis (Leppimäki et al., 1998; Perry and Ridgway, 2006), and here, we showed that this increase is due entirely to increased VLC-SPL synthesis. Importantly, loading of cells with cholesterol suppressed VLC-SPL synthesis without affecting LC-SPL synthesis, revealing an SPL–cholesterol homeostasis axis that adjusts VLC-SPL metabolism in concert with changes in cellular cholesterol content. The interplay between cholesterol and SPL synthesis and trafficking described herein is distinct from the SREBP cholesterol homeostasis pathway because it does not rely on protein synthesis and ceramide synthase genes are not subject to SREBP-dependent transcriptional regulation (Horton et al., 2002). We speculate that the homeostasis axis that we have described here complements the SREBP cholesterol homeostasis by modulating the pool of free cholesterol in the PM and likely other organelles of the endo-lysosome network.
De novo synthesis of SPLs is initiated in the ER by the synthesis of ketosphinganine by serine palmitoyltransferase (SPT), whose activity is regulated by a complex regulatory network of interactions involving proteins that are associated with SPT (i.e., ORM/ORMDL proteins) and by feedback regulation by ceramide (Davis et al., 2019). In budding yeast (Saccharomyces cerevisiae) cells, SPT activity is stimulated by mechanical stress to the PM via TOR complex 2–mediated signaling to ORM proteins, which mediates inhibition of SPT activity (Aronova et al., 2008; Berchtold et al., 2012; Breslow et al., 2010). Importantly, by assaying pacSph metabolism in this study, we addressed SPL metabolic steps that are regulated downstream of SPT. Hence, the increase in VLC-SM levels upon cholesterol depletion can be due to an increase in the rate of VLC-ceramide synthesis, an increase in the rate of ER-to-TGN trafficking of VLC-ceramide, or by regulating the specificities of SMS1 or SMS2 to confer selectivity for VLC-ceramides over LC-ceramides as substrates. To our knowledge, there is no evidence demonstrating substrate specificity (i.e., for LC- versus VLC-ceramides) of SMS1 or SMS2. We did not observe a change in the localization of CerS2 within the ER network (e.g., accumulation of COPII-mediated ER exit sites [Fig. S3 H] or of localization of SMS1-GFP and SMS2-GFP), leading us to speculate that enzymatic activity of CerS2 is regulated. Curiously, there are four phosphorylated serine/threonine residues located near the predicted active site of CerS2 (based on a predicted structure; Jumper et al., 2021) that are required for its activity (Sassa et al., 2016); phosphorylation of these residues may therefore contribute to regulation of CerS2 activity in the SPL–cholesterol homeostatic axis that we identified. These observations raise the possibility that cholesterol-dependent regulation of VLC-SPL synthesis may be regulated by a protein phosphorylation network. Sassa et al. (2016) reported that pharmacologic inhibition of casein kinase 2 led to reduced activity of HA-epitope-tagged CerS2 in vitro (Sassa et al., 2016); however, we observed that the inhibitor used in that study (CX-4945) had no effect on VLC-SM synthesis before or after cholesterol depletion. Clues to the regulatory mechanism of VLC-SM synthesis may lie in our serendipitous observation that treatment of cells with epidermal growth factor (EGF) elicited an increase in VLC-SPL synthesis but no effect on LC-SM synthesis (Fig. S5 A), and conversely, that inhibition of EGF receptor (EGFR) signaling downregulated VLC-SM synthesis (Fig. S5 B). These observations suggest that VLC-SPL synthesis is coordinated with cell growth regulation, and it is intriguing to note that in this context, the EGFR itself could function as a PM cholesterol sensor since EGFR dimerization is enhanced in the PM by cholesterol depletion (Chen and Resh, 2002).

EGF increases metabolic flux toward VLC-SM synthesis. (A) Incubation of cells with EGF results in increased VLC-SM synthesis. Cells were incubated with the indicated amounts of EGF (0.3–100 ng/ml) during the pacSph chase period. Product percentages for pacVLC- and pacLC-SM are described. (B) An EGFR kinase inhibitor, Gefitinib, inhibits cholesterol-dependent increase of VLC-SM synthesis. Cells were incubated with 10 μM Gefitinib overnight. pacSph pulse-chase experiments were performed and product percentages for pacVLC- and pacLC-SM are described. Statistical significance was evaluated by one-way ANOVA analysis and post hoc Dunnett’s (A) or Šídák’s (B) multiple comparisons were performed (P value >0.05, ns; <0.05, *; <0.01, **).
EGF increases metabolic flux toward VLC-SM synthesis. (A) Incubation of cells with EGF results in increased VLC-SM synthesis. Cells were incubated with the indicated amounts of EGF (0.3–100 ng/ml) during the pacSph chase period. Product percentages for pacVLC- and pacLC-SM are described. (B) An EGFR kinase inhibitor, Gefitinib, inhibits cholesterol-dependent increase of VLC-SM synthesis. Cells were incubated with 10 μM Gefitinib overnight. pacSph pulse-chase experiments were performed and product percentages for pacVLC- and pacLC-SM are described. Statistical significance was evaluated by one-way ANOVA analysis and post hoc Dunnett’s (A) or Šídák’s (B) multiple comparisons were performed (P value >0.05, ns; <0.05, *; <0.01, **).
What is the significance of increased VLC-SPLs in the PM and lysosome membrane? In asymmetric synthetic vesicle membranes containing C24 SM in just one leaflet (similar in this regard to the PM) and C16 phosphatidylcholine in the other leaflet, cholesterol partitioned in the leaflet opposite the C24 SM (Courtney et al., 2018). In the context of the PM, this asymmetry would favor cholesterol accumulation in the cytoplasmic leaflet, where it is accessible to cytoplasmic factors and for distribution to other organelles. We observed that the cholesterol-dependent recovery of PM lipid order is delayed in CerS2-depleted cells due unexpectedly to inefficient egress of cholesterol from the lysosome and/or trafficking to the PM. Cholesterol LTPs that may play a role in cholesterol egress from the lysosome and trafficking to the PM include ORP1S (Zhao et al., 2020) and ORP2, which are reported to mediate non-vesicular cholesterol trafficking from late to recycling endosomes and eventually the PM (Ikonen and Zhou, 2021; Olkkonen and Ikonen, 2022; Takahashi et al., 2021; Wang et al., 2019). CerS2-depleted cells also show clustered lysosomes compared with control cells. Morphology and positioning of lysosomes are highly dynamic (Ballabio and Bonifacino, 2020). ORP1L was proposed to sense cholesterol levels in the membrane of the late endosome via a conformational change upon binding of cholesterol, which induced Rab7-RILP binding and recruitment of dynein-based motors, resulting in accumulation of late endosome to the microtubule minus end (Rocha et al., 2009). Alternatively, the fusion of vesicular/tubular carriers derived from the endo-lysosome could provide an influx of lysosomal cholesterol to the PM.
Genetic depletion of CerS2 induces the unfolded protein response and autophagy (Spassieva et al., 2009), and haploinsufficiency results in steatohepatitis and insulin resistance in mouse models (Raichur et al., 2014). In mouse-based studies, the maturation of insulin-containing dense-core storage granules produced by pancreatic β cells was deficient, possibly due to inefficient ER-to-Golgi trafficking of the insulin processing enzyme, PCSK1, resulting in depletion of PCSK1 from the Golgi, where insulin granules are produced (Griess et al., 2022). Given that there are broad impacts of altered SPL metabolism on cellular and organismal levels, it is critical to understand how cells regulate SPL and membrane homeostasis. This study provides new insights into the physiological roles of SPLs in cholesterol trafficking within the endo-lysosome network and in PM lipid homeostasis.
Materials and methods
Cell culture and transfection
All cell-based assays utilized HeLa cells that were purchased from CSL cell line service (300194/p772_HeLa), grown in DMEM (11965-092; Gibco) supplemented with 10% FBS (16140-071; Gibco), and maintained at 37°C with 5% CO2, unless otherwise noted. Delipidated FBS was produced by fumed silica (S5505; Sigma-Aldrich) and biphasic extraction as described previously (Agnese et al., 1983). The use of pacSph requires cell lines that lack sphingosine-1-phosphate-lyase 1 (SGPL1) to restrict pacSph metabolism to SPL biosynthetic pathways (Gerl et al., 2016). SGPL1 null HeLa cells are previously characterized in Deng et al. (2018). The piggyBac transposon-based gene insertion system was used (Grabundzija et al., 2010) to generate cells that stably express GFP-D4YDA under doxycycline regulation. After transfection of cells with piggyBac system plasmids, the cells were selected with G418 and puromycin. The regulated expression of target proteins upon doxycycline induction was confirmed by fluorescence microscopy or immunoblotting. Lipofectamine 2000 (11668-019; Invitrogen) was used in accordance with the manufacturer’s instructions. Lipofectamine RNAiMAX (13778-150; Invitrogen) was used for siRNA experiments according to the manufacturer’s instructions. The effectiveness of siRNAs targeting CERT, VAPA, VAPB, and CerS2 was confirmed by immunoblotting (Fig. S3, A, B, and E). All cell lines were routinely screened for mycoplasma contamination using a mycoplasma detection kit (30-1012K; ATCC).
Plasmids and siRNAs
The following plasmids were used to transiently express respective proteins: pBFP-GalT (kindly provided by J. Rothman); pTagRFP-PKD-C1A (kindly provided by V. Malhotra); pLact-C2-GFP (Fairn et al., 2011); pGFP-D4YDA; pSS-EQ-SM-mKate2 (Deng et al., 2018); pSS-EQ-Sol-mKate2 (Deng et al., 2018); pSar1b(H79G) (Aridor et al., 1995). The pD4YDA gene was (Liu et al., 2017) inserted into the piggyBac plasmid for generation of stable cell lines. The following siRNA sequences were used: non-specific target, 5′-CGTTAATCGCGTATAATAC-3′; CerS2, 5′-GGAACAGATCATCCACCAT-3′ (Spassieva et al., 2009); CerS5, 5′-GGATTGGAATGTCCGAAAA-3′, designed by Integrated DNA Technologies IDT; CerS6, 5′-AACGCTGGTCCTTTGTCTT-3′ (Senkal et al., 2010); VAPA pool of 4 siRNAs (#1 5′-CCACAGACCTCAAATTCAA-3′, #2 5′-GGCAAAACCTGATGAATTA-3′, #3 5′-CCTGAGAGATGAAGGTTTA-3′, #4 5′-CAAGGAAACTAATGGAAGA-3′; Venditti et al., 2019); VAPB pool of four siRNAs (#1 5′-GTAAGAGGCTGCAAGGTGA-3′, #2 5′-CCACGTAGGTACTGTGTGA-3′, #3 5′-TGTTACAGCCTTTCGATTA-3′, #4 5′-GTAATTATTGGGAAGATTG-3′; Venditti et al., 2019); SMS1, 5′-GACGGCAGCTTCAGCATCA-3′ (Deng et al., 2018); SMS2, 5′-TCAATAGTGGGACGCAGAT-3′ (Deng et al., 2018); CERT #2, 5′-GGATGAACTTCAAAGGGAT-3′. All siRNAs were purchased from Integrated DNA Technologies IDT.
Statistical analyses and data presentation
GraphPad Prism 9 was used for statistical analyses and presentation of quantitative data. The probability values are listed in the figure legends. Fluorescence microscopy images were processed using FIJI (Schindelin et al., 2012) and Adobe Illustrator.
Quantitative PCR (qPCR)
Cells were treated by siRNA targeting non-specific gene or CerS6 for 72 h. Total RNA was extracted by using RNeasy RNA extraction kit (74004; Qiagen). cDNA was synthesized by olido dT, using RevertAid First Strand cDNA Synthesis kit (K1621; Thermo Fisher Scientific). qPCRs (CFX96; Bio-Rad) used gene-specific primers were used to test siRNA efficiency for CerS6 expression. For GAPDH, forward: 5′-TGCACCACCAACTGCTTAGC-3′, reverse: 5′-GGCATGGACTGTGGTCATGAG-3′. For CerS5, forward: 5′-GCCATCGGAGGAATCAGGAC-3′, reverse: 5′-GCCAGCACTGTCGGATGTC-3′. For CerS6, forward: 5′-TTCAAGAGGCAAGGTGTCCAAGGAT-3′, reverse: 5′-TGGTGGTTGTCGCAGTGTGGG-3′.
Immunoblotting
Whole-cell lysates were prepared by dispersing washed cell pellets in SDS-PAGE sample buffer containing 250 mM Tris-HCl, pH 6.8, 50% glycerol, 10% sodium dodecyl sulfate, 10% β-mercaptoethanol, 0.025% bromophenol blue or radioimmunoprecipitation assay buffer containing 50 mM Tris-HCl, pH 8, 1 mM EDTA, 150 mM NaCl, 1% NP40, 0.25% sodium deoxycholate with protease inhibitor cocktails (4693116001; Sigma-Aldrich). Protein content was measured by Coomassie-protein quantification solution (23200; Pierce). Proteins were resolved by SDS-PAGE and then transferred to nitrocellulose membranes (1620115; Bio-Rad), prior to blocking in 5% bovine serum albumin (A9647; Sigma-Aldrich) in PBS with 0.1% tween 20 (PBST) or 5% skim milk in PBST. Membranes were incubated in primary antisera in blocking buffer at the indicated dilutions. The antibodies used in this study are as following; anti-β-actin (1:1,000, 3700S; CST); anti-HMGCR (1:1,000, NBP2-61616; Novus Biologicals); anti-SREBP2 (1:1,000, sc-13552; Santa Cruz); anti-CerS2 (1:1,000, HPA027262; Sigma-Aldrich); anti-CERT (1:1,000, HPA035645; Sigma-Aldrich); anti-VAPA (1:1,000, SAB1402460-100G; Sigma-Aldrich); anti-hVAPB (1:2,000, MAB58551; R&D systems); anti-rabbit-IgG (1:10,000, 7074S; CST); or anti-mouse-IgG (1:10,000, 7076S; CST). HRP substrates were used according to the manufacturer's instructions (170-5060; Bio-Rad; 34096, Thermo Fisher Scientific). Blots were imaged using Molecular Imager ChemiDoc XRS+ System (Bio-Rad). Immunoblot bands were quantified using ImageLab (version 5.2; Bio-Rad).
pacSph metabolic labeling
Metabolic pacSph pulse-chase labeling experiments were performed using SGPL1 null HeLa cells as described in Haberkant et al. (2016) with minor genetic and experimental modifications. Cells were incubated with 3 μM pacSph (900600; Avanti Polar Lipids) in DMEM containing 10% charcoal-stripped FBS (A3382101; Gibco) at 37°C for 1 h, except where noted. Cells were washed and incubated with DMEM containing 10% FBS or other defined conditions during chase periods. Pilot experiments established linear incorporation of pacSph into SM for 2 h, plateauing within a 5-h chase period in pacSph-free medium (>10% of total pacSL product). For acute cholesterol depletion, cells were incubated in 5 mM MβCD in DMEM containing 10% FBS for 30 min, unless otherwise noted. For saponin treatment, cells were incubated in DMEM or 0.05% saponin (47036; Sigma-Aldrich)-containing DMEM for the chase period. For Gefitinib (13166; Cayman) treatment, the cells were incubated in 10 μM Gefitinib for 18 h (Zheng et al., 2019) prior to initiating pacSph labeling. For EGF (10605-HNAE, Sino Biological) treatment, the cells were incubated in DMEM for 16 h, given 3 μM pacSph in DMEM for 1 h (pulse), then given DMEM containing EGF with denoted concentrations for 1 h. At the end of the treatment, cells were harvested and stored at −80°C until downstream lipid analysis. In the PM recovery experiments, cells were incubated in 5 mM MβCD in DMEM containing 10% FBS for 30 min. The medium was then replaced with DMEM containing 10% FBS or 10% delipidated FBS. After the specified recovery period, pulse-chase experiments were performed. For alkyne-cholesterol (700146; Avanti Polar Lipids) labeling of cells, cells were grown in DMEM containing 10 μM alkyne-cholesterol and 10% FBS for 3 d. Cells were treated with 5 mM MβCD (AC377110050; Acros) in DMEM for up to 60 min before harvesting.
TLC
Lipids were extracted from pacSph-labeled cells as described previously (Haberkant et al., 2016). The lower phase containing chloroform and extracted lipids was recovered and dried in glass tubes using nitrogen gas. The following research grade organic solvents were used: chloroform (9180-01; JT Baker), methanol (9070-05; JT Baker), and acetic acid (9508-00; JT Baker). For alkyne-cholesterol labeling experiments, total cell and medium (MβCD bound) lipids were extracted with solvents containing chloroform (9180-01; JT Baker), methanol (9070-05; JT Baker), and water (purified by Millipore Water System) by 1:1:0.9 (vol/vol) based on a modified Bligh-Dyer method (Bligh and Dyer, 1959). Extracted pacSPLs and alkyne-cholesterol were reacted with 3-azido-7-hydroxycoumarine (CLK-FA047-1; Jena Bioscience) in the click reaction buffer containing chloroform, ethanol (E7023; Sigma-Aldrich), and Tetrakis-(acetonitrile)-copper(I) tetrafluoroborate (677892; Sigma-Aldrich) for 4 h at 42°C (Gerl et al., 2016) prior to TLC analysis. Coumarin-conjugated pacSPLs and alkyne-cholesterol were applied to silica plates (1.05721.0001; Supelco) and separated by sequentially applying two solvents mixtures: (1) chloroform, methanol, water, and acetic acid in 65:25:4:1 ratio (vol/vol); (2) hexane (9304-03; JT Baker) and ethyl acetate (9282-33; JT Baker) in 1:1 ratio (vol/vol). Coumarin-conjugated alkyne-cholesterol was separated by hexane, diethyl ether (E1381; Thermo Fisher Scientific), and acetic acid in 70:30:1 ratio (vol/vol). Alkyne-cholesterol (700146; Avanti Polar Lipids), pacSph (900600; Avanti Polar Lipids), or pacCer (pacFA ceramide, 900404; Avanti Polar Lipids) were used as references to identify specific lipids and their retention time on the TLC plates. Separated lipids were visualized using Bio-Rad Molecular Imager ChemiDoc XRS+ system, and the proportions of pacSph-containing lipid species were quantified using ImageLab software (Bio-Rad).
Lipidomics
SPLs were measured as described previously (Cai et al., 2016). Briefly, cells were trypsinized and washed with ice-cold 1X PBS twice. Cells were centrifuged at 4,200 × g at 4°C for 5 min. Pellets were resuspended in ice-cold methanol and internal standards were added. Tubes were then sonicated in a water bath and chloroform was added at a 1:2 ratio of chloroform: methanol. Samples were incubated at 48°C overnight. The next day, samples were centrifuged at 4,200 × g at 4°C for 5 min. Samples were then decanted into clean glass tubes and dried using N2. Once dry, 500 μl of MeOH was added to each tube and samples were sonicated prior to centrifugation at 4,200 × g at 4°C for 5 min. The samples were then transferred to appropriate vials completing the lipid extraction process. SPL abundances were measured by liquid chromatography electrospray ionization tandem mass spectrometry (5500 QTRAP; ABI; Green et al., 2021). SPL levels were determined as pmol/cell number.
pacSphingolipid in situ localization
The experiments were performed as described previously (Sundberg et al., 2019a). Briefly, 1 million SGPL1 null cells were seeded into glass-bottom dishes (P35G-1.5-20-C; Mattek) and experiments were initiated within 16 h after plating. Cells were pulse-labeled for 15 min with 1 μM pacSphingosine (pulse) and chased for the indicated time period. Cells were fixed in 4% PFA in PBS (15710; Electron Microscopy Sciences) for 15 min and permeabilized with 0.05% saponin for 5 min (control sample for non-labeling). After processing cells for immunofluorescence with antisera to the indicated proteins, cells were incubated with click labeling reagents (C10269; Invitrogen) and Alexa Fluor 647 azide (A10277; Invitrogen) according to the manufacturer’s protocols.
Fluorescence microscopy and live cell imaging
The florescence micrographs shown in all figures are representative of at least three independent experiments. The micrographs displayed in Fig. 4 B were captured using a DeltaVision workstation (Applied Precision) based on an inverted microscope (IX-70; Olympus) using a 100×, 1.4 NA or 60×, 1.4 NA oil immersion lens. Three-dimensional image stacks of cells were collected at 0.2-μm z increments with an sCMOS camera (CoolSnap HQ; Photometrics) and deconvolved with softWoRx version 6.0 using the iterative-constrained algorithm and the measured point spread function. Z-stack images were combined as max-projection. Images were processed by background subtraction, denoised, and adjusted in brightness/contrast/gamma using Fiji (Schindelin et al., 2012). The micrographs displayed or analyzed in Fig. 1, A and B, Fig. 3 H, Fig. 4 C, and Fig. 5 B, D, and E, were captured using a SoRa CSU-W1 (Yokogama) spinning disk confocal workstation (Nikon) based on an inverted microscope (Nikon Ti2-E) and ORCA-FusionBT back-thinned camera (Hamamatsu). Images were captured using 60× oil lens (N.A. 1.4) and NIS-Elements Advanced Research Package (Nikon). The images displayed in the figures were adjusted in brightness/contrast/gamma using Fiji (Schindelin et al., 2012). All confocal fluorescence images were from single focal plane images. For live cell imaging, cells were maintained in DMEM containing Hepes buffer (21063029; Gibco) containing 10% FBS.
Total internal reflectance fluorescence (TIRF) microscopy (Fig. 4, E and F) was performed on a Nikon Ti2-E inverted motorized microscope stand with a motorized stage with stage-top Piezo, Nikon H-TIRF, Agilent laser combiner with 488 and 561 nm, sCMOS camera (Prime 95B; Photometrics), 100× TIRF objective with an NA of 1.49, and temperature control system at 37°C (Oko Lab). Images were acquired for 90 min with 0.5-s intervals using Nikon Elements and analyzed in Fiji (Schindelin et al., 2012).
For immunofluorescence microscopy, cells were cultured in glass-bottom dishes (P35G-1.5-20-C; Mattek) as indicated, fixed for 5 min with 4% PFA, and permeabilized using 0.05% saponin in PBS. Samples were blocked with 5% FBS in PBS, incubated with primary antibodies and then secondary antibodies. Primary antibodies used in this study include anti-P230 (611281; BD Biosciences), anti-CerS2 (1:1,000, HPA027262; Sigma-Aldrich), and anti-Lamp1 (9091S; CST). Secondary antibodies were purchased from Invitrogen. Cells were imaged using deconvolution or confocal microscopy as indicated.
Fluorescence image analyses of lipids and lipid probes
To measure accumulation of pacSPL in the Golgi apparatus, pacSPL-labeled cells were labeled with anti-p230 antibody (trans-Golgi marker). Confocal fluorescence microscopy based on SoRa CSU-W1 (Yokogama) spinning disk confocal workstation (Nikon) was used to generate images. Region of interest (ROI) for trans-Golgi was defined by using p230 signals above mean plus two SD of whole image pixel intensities. Trans-Golgi ROI was used to measure the mean fluorescence intensities of pacSPL conjugates in a single Golgi apparatus (arbitrary unit). Datapoints from Golgi apparatus in an independent experiment were used to generate a mean pacSPL-conjugate intensity. Image analysis was carried out in Fiji (Schindelin et al., 2012). More than 2,000 datapoints from four independent experiments were used for statistical analysis. One-way ANOVA analysis and following Tukey’s or Dunnett’s multiple comparisons were performed by GraphPad 9.
To quantitate changes in Golgi-localized DAG in living cells (Fig. 4, C and D), cells transiently expressing the TagRFP-PKD-C1A DAG probe (C1A-RFP) and BFP-GalT, a Golgi trans/TGN resident protein, were imaged at 3-min intervals for 90 min. Using Fiji (Schindelin et al., 2012), ROIs were defined using the mean plus two times the SD of BFP-GalT fluorescence values. Within the Golgi area, the mean intensities of TagRFP fluorescence values were measured through time course. TagRFP intensity at the initial time point was set to 1 to normalize the data. More than 30 cells from the same condition from three independent experiments were analyzed.
To quantify the GFP-D4YDA cholesterol probe within cells (Fig. 5, B, D, and E), a stable cell line expressing GFP-D4YDA from a doxycycline-inducible promoter was used. CellMask (C10045; Invitrogen) was used to identify the PM according to the manufacturer’s protocol. Confocal microscopy and image analysis were done as described in the preceding paragraph. Single-cell areas were delineated from the CellMask fluorescence by using the Find Maxima function in Fiji (Schindelin et al., 2012). PM area from single cells was defined by wavelength (546 nm)-specific Point Spread Function–based Gaussian Blur protocol as described by Wills et al. (2021). A mean intensity value of GFP signals within a PM ROI was divided by mean intensities within the corresponding cell to generate a relative “D4YDA signal from PM/Whole Cell” value. Mean values from independent experiments were calculated and subjected to statistical analysis. One-way ANOVA analysis and following Tukey’s or Dunnett’s multiple comparisons were performed by GraphPad 9. For Fig. 5 E, a stable cell line expressing GFP-D4YDA was incubated with NPC1 inhibitor, U18666A (U3633; Sigma-Aldrich), at 1 µM overnight. Cells were washed and observed with confocal fluorescence microscopy for 30 min in live cell setting (see above). CellMask was not used to identify PM in live cell imaging because it was endocytosed within a few minutes. Instead, GFP-D4YDA intensity was measured by plotting a cell-crossing line covering the PM and the cytosol. PM was defined as a point with maximum GFP intensity within 0.5 µm from outside of cells (PM signal). Cytosol was defined as a line excluding PM and cytosolic GFP intensities were defined as mean GFP intensities within the defined line (cytosol signal). Then PM/cytosol ratio was calculated.
BODIPY-ceramide exocytosis test by TIRF
Cells were cultured in glass-bottom dishes (P35G-1.5-20-C; Mattek) and loaded with BODIPY-Cer (B22650; Invitrogen; 5 µM) by incubation at 4°C for 15 min. Cells were washed with 37°C PBS and immediately transferred to the microscope stage. For co-exocytosis assays, cells were transfected with EQ-SM-mKate2 and EQ-sol-mKate2. BODIPY-Cer exocytosis events were counted manually according to experimental limitations. For co-exocytosis assays, EQ-SM-mKate2 or EQ-sol-mKate2 fusion events were used to search for co-fusion events with BODIPY signals at the same region and time.
Spectral fluorescence imaging
Membrane lipid order measurements of cell populations
Cells growing in 96-well plates were incubated with di-4 (5 µM) for 20 min at room temperature and a fluorescence plate reader (SpectraMax, Molecular Devices) was used to excite the dye at 488 nm and to scan from 530 to 750 nm with 10 nm intervals. The 540–560 nm fluorescence intensity values were summed as ordered phase signals (I540∼560) and 660–680 nm signals were summed as disordered phase signals (I660∼680) to calculate GP values (Gutowska-Owsiak et al., 2020; Owen et al., 2011). Data are presented as GP values that are calculated from the ratio of fluorescent spectra, where −1 represents the minimum and +1 represents the maximum lipid packing.
Online supplemental material
Fig. S1 displays TLC data that shows that acute cholesterol depletion by MβCD treatment extracts alkyne cholesterol from cells, but not pacSphingolipids and that acute cholesterol depletion increases SPL metabolic flow toward pacSM synthesis and increases pacSphingolipid content in the Golgi apparatus. Fig. S2 shows the relative quantities of pacSphingolipid products (ceramide, glucosylceramide, VLC-SM, and LC-SM) that were observed in pacSph pulse-chase experiments and that acute cholesterol depletion does not affect the localization of CerS2. Fig. S3 presents pacSph pulse-chase data for cells depleted of the indicated proteins by siRNAs and shows that downregulation ER–Golgi MCS or CerS5 depletion does not significantly affect VLC-SM synthesis, and anti-CerS2 immunofluorescence data showing that MβCD treatment does not significantly affect CerS2 localization. Fig. S4 shows that SREBP2-dependent transcriptional changes or cycloheximide treatment (i.e., protein synthesis) do not contribute to cholesterol-dependent SPL regulation. Fig. S5 shows that incubation of cells with EGF treatment to cells increases VLC-SM synthesis and that an EGFR kinase inhibitor (Gefitinib) treatment reduces VLC-SM synthesis.
Data availability
All data are available in the published article and its online supplemental material.
Acknowledgments
We are grateful to colleagues for discussions and critical reading of the manuscript. We thank Devin Fuller, Charlotte Ford, and Xiaolei Su for technical contributions. We are also grateful Xiaolei Su, Julia von Blume, and James Rothman (Department of Cell Biology, Yale School of Medicine, New Haven, CT, USA) for sharing reagents and facilities.
This work is supported by funds from the National Institute of General Medical Sciences of the National Institutes of Health under award numbers GM144096 and GM095766-08S1 (C.G. Burd) and National Cancer Institute R37CA239532 (C.E. Senkal).
Author contributions: C.G. Burd and C.E. Senka conceptualized and supervised this study. C.G. Burd and C.E. Senka secured research funding. G. Mavodza and C.E. Senka performed lipidomic experiments. G. Mavodza, C.E. Senka, and Y. Kim analyzed lipidomic data and Y. Kim visualized the data. Y. Kim and C.G. Burd investigated the subject, formally analyzed the data, and visualized the data. Y. Kim and C.G. Burd wrote the original draft. Y. Kim, C.G. Burd, and C.E. Senka reviewed and edited the manuscript.

