


Current models posit that nuclear speckles (NSs) serve as reservoirs of splicing factors and facilitate posttranscriptional mRNA processing. Here, we discovered that ribotoxic stress induces a profound reorganization of NSs with enhanced recruitment of factors required for splice-site recognition, including the RNA-binding protein TIAR, U1 snRNP proteins and U2-associated factor 65, as well as serine 2 phosphorylated RNA polymerase II. NS reorganization relies on the stress-activated p38 mitogen-activated protein kinase (MAPK) pathway and coincides with splicing activation of both pre-existing and newly synthesized pre-mRNAs. In particular, ribotoxic stress causes targeted excision of retained introns from pre-mRNAs of immediate early genes (IEGs), whose transcription is induced during the stress response. Importantly, enhanced splicing of the IEGs ZFP36 and FOS is accompanied by relocalization of the corresponding nuclear mRNA foci to NSs. Our study reveals NSs as a dynamic compartment that is remodeled under stress conditions, whereby NSs appear to become sites of IEG transcription and efficient cotranscriptional splicing.
Introduction
Nuclear speckles (NSs) are punctate-like granules located in the interchromatin region of nuclei, characterized by high concentrations of small nuclear ribonucleoproteins (snRNPs), the core subunits of the spliceosome, as well as numerous splicing-associated factors, especially serine/arginine (SR)-proteins such as SRSF2 (SC35; Galganski et al., 2017; Spector and Lamond, 2011). While NSs appear not to contain DNA, active genes were shown to locate in the immediate periphery of NSs (Brown et al., 2008; Huang and Spector, 1991; Khanna et al., 2014; Moen et al., 2004; Smith et al., 1999; Xing et al., 1995). These observations led to a widely held model wherein the periphery of NSs is a privileged area for transcription and cotranscriptional splicing, and NSs serve as a reservoir for splicing factors (Chen and Belmont, 2019). However, based on the finding that active spliceosomes, marked by phosphorylated splicing factor 3b subunit 1 (SF3B1), are located not only in the periphery of NSs, but to a smaller extent also within NSs (Girard et al., 2012), NSs may also be sites of posttranscriptional pre-mRNA splicing. Notably, components of the N6-methyladenosine mRNA modification machinery and the transcription-export (TREX) complex also localize in NSs, indicating that NSs play additional roles in later steps of mRNA biogenesis before mRNAs are released from NSs through the activity of the export machinery (Dias et al., 2010; Galganski et al., 2017; Wang et al., 2018). While NSs are increasingly recognized as hubs that facilitate consecutive steps in the posttranscriptional processing of mRNAs, relatively little is known about their role during stress responses when gene expression is acutely rewired.
The family of RNA binding T-cell intracellular antigen (TIA) proteins is tightly associated with stress responses. Both family members, TIA1 and TIA1-related (TIAR), contain three RNA recognition motifs (RRMs) and a C-terminal glutamine-rich, prion-like domain (QRD), and bind to single-stranded RNA with a preference for U-rich sequences (Dember et al., 1996; López de Silanes et al., 2005; Meyer et al., 2018). The TIA proteins are predominantly localized in the nucleoplasm, where they regulate alternative splicing by binding to intronic sequences and facilitate splicing at weak 5′ splice sites (Aznarez et al., 2008; Del Gatto-Konczak et al., 2000; Förch et al., 2000). For TIA1, splicing activation was found to occur through the direct association of TIA1 with U1 small nuclear ribonucleoprotein C (U1C), a subunit of the U1-snRNP responsible for 5′ splice site recognition during the early steps of spliceosome assembly (Förch et al., 2002).
Under stress conditions, TIA proteins are rapidly exported to the cytoplasm, where they suppress the translation of specific transcripts, e.g., upon DNA damage or amino acid starvation (Damgaard and Lykke-Andersen, 2011; Mazan-Mamczarz et al., 2006). Through their aggregation-prone QRD, TIA proteins further contribute to the assembly of cytosolic stress granules (SGs; Gilks et al., 2004; Kedersha et al., 1999), a membrane-less compartment that forms by liquid–liquid phase separation. SGs act as a hub for cell signaling (Kedersha et al., 2013) and a timer to adjust protein synthesis to the cellular protein folding capacity (Cherkasov et al., 2013).
TIAR has an additional function as an inhibitor of cell proliferation (Reyes et al., 2009), especially under conditions of DNA damage and replication stress, where TIAR is required for G2/M checkpoint activation (Lafarga et al., 2019; Reinhardt et al., 2010). This activity of TIAR involves the assembly of subnuclear foci we termed G2/M transition granules (GMGs), which form in the nuclei of cells arrested at the G2/M checkpoint (Lafarga et al., 2019). Interestingly, TIAR mediates recruitment of the central mitotic kinase CDK1 to GMGs and exerts an inhibitory effect on CDK1, thereby preventing cells from entering mitosis.
In this study, we turned our attention to the stress response induced by ribotoxins, compounds that are released from fungi and bacteria, and inhibit eukaryotic protein synthesis by directly binding to ribosomes. We found that TIAR is recruited to NSs upon exposure of human HeLa and U2OS cells to ribotoxins, which led us to the discovery that NSs are profoundly reorganized during the early phase of the ribotoxic stress response. Our analysis revealed that NS reorganization is dependent on the stress-activated p38-mitogen-activated protein kinase (MAPK) and coupled to activating the splicing of pre-mRNAs with retained introns transcribed from immediate early genes (IEGs).
Results
TIAR relocalizes to NSs upon ribotoxic stress
Anisomycin (ANI) inhibits eukaryotic translation by directly binding to the peptidyl-transfer center of the 60S large ribosomal subunit (Garreau de Loubresse et al., 2014). In response to ribotoxic stress, cells activate the p38 MAPK pathway (Hazzalin et al., 1996; Vind et al., 2020), as illustrated by p38 MAPK phosphorylation when HeLa cells were treated with a moderate dose of ANI (0.1 µg/ml) for 2 h (Fig. 1 A). As a downstream read-out of the ribotoxic stress response, we monitored cell-cycle arrest reflected by loss of histone H3 phosphorylation at serine 10 (p-H3), a marker for mitotic cells (Hans and Dimitrov, 2001). Indeed, we observed a complete loss of p-H3 after 2 h of treatment with ANI, while pretreatment for 1 h with the p38 MAPK inhibitor SB202190 prevented the loss of p-H3 (Fig. 1 A). This was confirmed with a second p38 MAPK inhibitor, SB203580, whereas the JNK inhibitor SP600125 did not prevent the loss of p-H3 (Fig. 1 A and Fig. S1 A). p38 MAPK-dependent loss of p-H3 was confirmed with two other ribotoxins, cycloheximide (CHX) and harringtonine (HT; Fig. S1 B), demonstrating the general importance of p38 MAPK in the ribotoxic stress response.
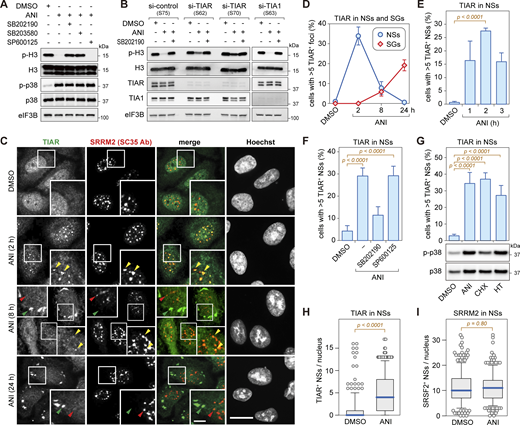
p38 MAPK-dependent relocalization of TIAR to nuclear speckles upon ribotoxic stress. (A) HeLa cells were treated with DMSO or anisomycin (ANI, 0.1 µg/ml) for 2 h and pretreated for 1 h with p38 MAPK inhibitors (SB202190, SB203580) or JNK inhibitor (SP600125, final concentration 10 µM each) where indicated. The phosphorylation of histone H3 (Ser10) and p38 MAPK (Thr180/Tyr182) was assessed by Western blot analysis; eIF3B serves as loading control. (B) HeLa cells were transfected with siRNAs for 48 h, followed by treatment as indicated and Western blot analysis. (C) HeLa cells were treated with either DMSO or ANI (0.1 µg/ml), and subcellular localization of TIAR was assessed by immunofluorescence (IF) microscopy at indicated time points. The α-SRRM2 (SC35 Ab) signal serves as a marker for nuclear speckles (NSs); scale bar = 20 µm; inset scale bar = 5 µm. (D) Percentage of cells with TIAR localizing in either NSs (α-SRRM2) or stress granules (SGs, α-G3BP1) was quantified by IF microscopy at indicated timepoints after treatment with ANI (0.1 µg/ml). Shown are mean values ± SEM; N ≥ 3 independent experiments. (E) Percentage of cells with TIAR localizing in NSs was quantified as in D; N = 4 independent experiments. Statistical testing was performed using beta regression. (F) Percentage of cells with TIAR localizing in NSs was quantified as in E. Cells were treated with ANI (0.1 µg/ml) for 2 h with or without 1-h pretreatment with indicated kinase inhibitors; N ≥ 3. (G) Top: Percentage of cells with TIAR localizing in NSs was quantified as in E. Cells were treated with ribotoxins for 2 h (ANI, 0.1 µg/ml; cycloheximide [CHX], 100 µg/ml; harringtonine [HT], 2 µg/ml); N = 4. Bottom: Phosphorylation of p38 MAPK (Thr180/Tyr182) was assessed by Western blot analysis. (H) Box-and-whisker plots depicting the number of TIAR-positive NSs per nucleus; the median is shown in blue together with the 25–75% interquartile range (box) and 5–95% percentile (whiskers). An ImageJ macro was used for automated quantification of IF micrographs; N = 3; DMSO (n = 504), ANI (n = 575). N, number of biological repeat experiments; n, total number of cells quantified in all biological repeats. Statistical testing was performed by a two-sided Wilcoxon rank sum test. (I) The number of SRMM2-positive NSs per nucleus was quantified as in H; N = 3; DMSO (n = 504), ANI (n = 575). Source data are available for this figure: SourceData F1.
p38 MAPK-dependent relocalization of TIAR to nuclear speckles upon ribotoxic stress. (A) HeLa cells were treated with DMSO or anisomycin (ANI, 0.1 µg/ml) for 2 h and pretreated for 1 h with p38 MAPK inhibitors (SB202190, SB203580) or JNK inhibitor (SP600125, final concentration 10 µM each) where indicated. The phosphorylation of histone H3 (Ser10) and p38 MAPK (Thr180/Tyr182) was assessed by Western blot analysis; eIF3B serves as loading control. (B) HeLa cells were transfected with siRNAs for 48 h, followed by treatment as indicated and Western blot analysis. (C) HeLa cells were treated with either DMSO or ANI (0.1 µg/ml), and subcellular localization of TIAR was assessed by immunofluorescence (IF) microscopy at indicated time points. The α-SRRM2 (SC35 Ab) signal serves as a marker for nuclear speckles (NSs); scale bar = 20 µm; inset scale bar = 5 µm. (D) Percentage of cells with TIAR localizing in either NSs (α-SRRM2) or stress granules (SGs, α-G3BP1) was quantified by IF microscopy at indicated timepoints after treatment with ANI (0.1 µg/ml). Shown are mean values ± SEM; N ≥ 3 independent experiments. (E) Percentage of cells with TIAR localizing in NSs was quantified as in D; N = 4 independent experiments. Statistical testing was performed using beta regression. (F) Percentage of cells with TIAR localizing in NSs was quantified as in E. Cells were treated with ANI (0.1 µg/ml) for 2 h with or without 1-h pretreatment with indicated kinase inhibitors; N ≥ 3. (G) Top: Percentage of cells with TIAR localizing in NSs was quantified as in E. Cells were treated with ribotoxins for 2 h (ANI, 0.1 µg/ml; cycloheximide [CHX], 100 µg/ml; harringtonine [HT], 2 µg/ml); N = 4. Bottom: Phosphorylation of p38 MAPK (Thr180/Tyr182) was assessed by Western blot analysis. (H) Box-and-whisker plots depicting the number of TIAR-positive NSs per nucleus; the median is shown in blue together with the 25–75% interquartile range (box) and 5–95% percentile (whiskers). An ImageJ macro was used for automated quantification of IF micrographs; N = 3; DMSO (n = 504), ANI (n = 575). N, number of biological repeat experiments; n, total number of cells quantified in all biological repeats. Statistical testing was performed by a two-sided Wilcoxon rank sum test. (I) The number of SRMM2-positive NSs per nucleus was quantified as in H; N = 3; DMSO (n = 504), ANI (n = 575). Source data are available for this figure: SourceData F1.
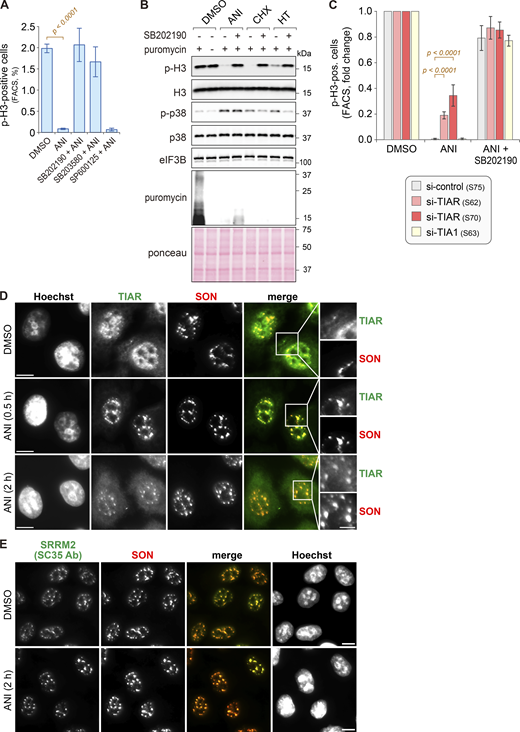
Effect of ribotoxins on mitotic entry and nuclear speckles. (A) For quantification of the mitotic cell population, HeLa cells were treated as in Fig. 1 A, and the percentage of serine 10 phosphorylated histone 3 (p-H3)-positive cells was measured by flow cytometry (mean ± SEM; N ≥ 3). P values were determined by beta regression. (B) HeLa cells were treated with DMSO, ANI (0.1 µg/ml), CHX (100 µg/ml), or HT (2 µg/m) for 2 h, with or without 1-h pretreatment with the p38 MAPK inhibitor SB202190 (10 µM). Puromycin (10 µg/ml) was added 10 min prior to cell harvesting. Phosphorylation of histone H3 (Ser10) and p38 MAPK (Thr180/Tyr182) was assessed by Western blot analysis; eIF3B serves as a loading control. De novo protein synthesis was visualized using α-puromycin antibody; Ponceau staining serves as a control for the total protein amount. (C) HeLa cells were transfected with the indicated siRNAs for 48 h, followed by treatment with ANI, with or without SB202190 pretreatment. Mitotic cell populations were quantified as in A; N ≥ 3. P values were determined by beta regression. (D) HeLa cells were treated with either DMSO or ANI (0.1 µg/ml). Subcellular localization of TIAR and SON, a marker of NSs, was assessed by IF microscopy at indicated time points; scale bar = 10 µm; inset scale bar = 5 µm. (E) IF microscopy was performed as in D to visualize the subcellular localization of SRRM2 (SC35 Ab) and SON; scale bar = 10 µm. Source data are available for this figure: SourceData FS1.
Effect of ribotoxins on mitotic entry and nuclear speckles. (A) For quantification of the mitotic cell population, HeLa cells were treated as in Fig. 1 A, and the percentage of serine 10 phosphorylated histone 3 (p-H3)-positive cells was measured by flow cytometry (mean ± SEM; N ≥ 3). P values were determined by beta regression. (B) HeLa cells were treated with DMSO, ANI (0.1 µg/ml), CHX (100 µg/ml), or HT (2 µg/m) for 2 h, with or without 1-h pretreatment with the p38 MAPK inhibitor SB202190 (10 µM). Puromycin (10 µg/ml) was added 10 min prior to cell harvesting. Phosphorylation of histone H3 (Ser10) and p38 MAPK (Thr180/Tyr182) was assessed by Western blot analysis; eIF3B serves as a loading control. De novo protein synthesis was visualized using α-puromycin antibody; Ponceau staining serves as a control for the total protein amount. (C) HeLa cells were transfected with the indicated siRNAs for 48 h, followed by treatment with ANI, with or without SB202190 pretreatment. Mitotic cell populations were quantified as in A; N ≥ 3. P values were determined by beta regression. (D) HeLa cells were treated with either DMSO or ANI (0.1 µg/ml). Subcellular localization of TIAR and SON, a marker of NSs, was assessed by IF microscopy at indicated time points; scale bar = 10 µm; inset scale bar = 5 µm. (E) IF microscopy was performed as in D to visualize the subcellular localization of SRRM2 (SC35 Ab) and SON; scale bar = 10 µm. Source data are available for this figure: SourceData FS1.
Given that TIAR is important for cell-cycle arrest upon DNA damage and replication stress (Lafarga et al., 2019; Reinhardt et al., 2010), we explored whether TIAR also plays a role during the response to ribotoxic stress. Knockdown (KD) of TIAR with two different siRNAs (S62, S70) partially prevented loss of p-H3 as determined by both Western blot (Fig. 1 B) and FACS analysis (Fig. S1 C). Interestingly, cell-cycle arrest was not compromised in TIA1 KD (S63) cells (Fig. 1 B and Fig. S1 C). These results indicate that TIAR, but not TIA1, functions downstream of p38 MAPK in mediating cell cycle arrest upon ribotoxic stress.
Next, we explored the subcellular localization of TIAR in response to ribotoxic stress by immunofluorescence (IF) microscopy. While TIAR has a nucleoplasmic distribution with some small puncta in control cells, we observed that TIAR concentrates in larger nuclear foci 2 h after the addition of ANI (Fig. 1 C). Given their colocalization with the signal of a SC35 monoclonal antibody (Ab), which stains NSs (Fu and Maniatis, 1990) and primarily recognizes the SR protein SRRM2 (Ilik et al., 2020), the nuclear TIAR foci were identified as NSs. Co-staining for another NS core protein, SON, confirmed the identity of nuclear TIAR foci as NSs (Fig. S1, D and E). Later in the ribotoxic stress response, TIAR shuttles to cytoplasmic SGs as indicated by colocalization with G3BP1 after 8 and 24 h of ANI treatment (Fig. S2 A). Localization of TIAR in NSs was observed as early as 30 min (Fig. S1 D) after ANI treatment and was found to be transient (Fig. 1, D and E). During the 24-h ANI time-course, the levels of TIAR did not change (Fig. S2 B). Notably, inhibition of p38 MAPK, but not JNK, antagonized the localization of TIAR to NSs (Fig. 1 F and Fig. S2 C). Similar to ANI, other ribotoxins such as CHX and HT, which also cause p38 MAPK activation, led to the recruitment of TIAR into NSs (Fig. 1 G and Fig. S2 D).
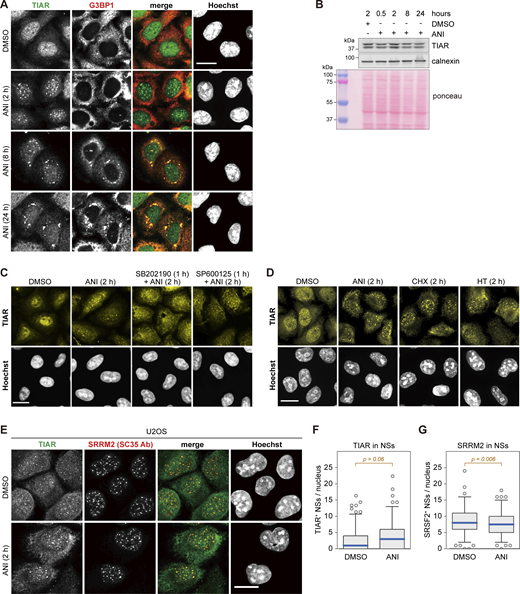
Subcellular localization of TIAR upon ribotoxic stress. (A) HeLa cells were treated with either DMSO or ANI (0.1 µg/ml), and subcellular localization of TIAR was assessed by immunofluorescence (IF) microscopy at indicated time points. The α-G3BP1 signal serves as a marker for stress granules. (B) TIAR protein levels were assessed by Western blot analysis of total protein lysates from HeLa cells treated with DMSO or ANI (0.1 µg/ml) as indicated. Calnexin and total protein staining with Ponceau were used as loading controls. (C) Subcellular localization of TIAR in HeLa cells was determined by IF microscopy after 2-h treatment with DMSO or ANI (0.1 µg/ml), with or without 1-h pre-treatment with the p38 MAPK inhibitor SB202190 (10 µM) or the JNK inhibitor SP600125 (10 µM). The same sample stained with a different primary and secondary antibody is shown in Fig. S3 A. (D) Subcellular localization of TIAR in HeLa cells was determined by IF microscopy after 2-h treatment with ANI (0.1 µg/ml), CHX (100 µg/ml) or HT (2 µg/m). (E) Subcellular localization of TIAR in U2OS cells treated with DMSO or ANI (0.1 µg/ml) for 2 h. The α-SRRM2 (SC35 Ab) signal serves as marker for NSs. In A and C–E, scale bar = 20 µm. (F) Box-and-whisker plots depicting the number of TIAR-positive NSs per nucleus in U2OS cells. An ImageJ macro was used for automated quantification of IF micrographs; N = 3; DMSO (n = 142), ANI (n = 137). (G) The number of SRRM2-positive NSs per nucleus of U2OS cells was quantified as in B; N = 3, DMSO (n = 142), ANI (n = 137). In F and G, P values were determined by two-sided Wilcoxon rank sum test. Source data are available for this figure: SourceData FS2.
Subcellular localization of TIAR upon ribotoxic stress. (A) HeLa cells were treated with either DMSO or ANI (0.1 µg/ml), and subcellular localization of TIAR was assessed by immunofluorescence (IF) microscopy at indicated time points. The α-G3BP1 signal serves as a marker for stress granules. (B) TIAR protein levels were assessed by Western blot analysis of total protein lysates from HeLa cells treated with DMSO or ANI (0.1 µg/ml) as indicated. Calnexin and total protein staining with Ponceau were used as loading controls. (C) Subcellular localization of TIAR in HeLa cells was determined by IF microscopy after 2-h treatment with DMSO or ANI (0.1 µg/ml), with or without 1-h pre-treatment with the p38 MAPK inhibitor SB202190 (10 µM) or the JNK inhibitor SP600125 (10 µM). The same sample stained with a different primary and secondary antibody is shown in Fig. S3 A. (D) Subcellular localization of TIAR in HeLa cells was determined by IF microscopy after 2-h treatment with ANI (0.1 µg/ml), CHX (100 µg/ml) or HT (2 µg/m). (E) Subcellular localization of TIAR in U2OS cells treated with DMSO or ANI (0.1 µg/ml) for 2 h. The α-SRRM2 (SC35 Ab) signal serves as marker for NSs. In A and C–E, scale bar = 20 µm. (F) Box-and-whisker plots depicting the number of TIAR-positive NSs per nucleus in U2OS cells. An ImageJ macro was used for automated quantification of IF micrographs; N = 3; DMSO (n = 142), ANI (n = 137). (G) The number of SRRM2-positive NSs per nucleus of U2OS cells was quantified as in B; N = 3, DMSO (n = 142), ANI (n = 137). In F and G, P values were determined by two-sided Wilcoxon rank sum test. Source data are available for this figure: SourceData FS2.
Automated image analysis confirmed that TIAR is recruited to NSs upon ribotoxic stress (Fig. 1 H), whereas SRRM2 (SC35 Ab) is a constitutive component of NSs (Fig. 1 I). A similar result was obtained with U2OS osteosarcoma cells, where we also observed enhanced localization of TIAR in NSs upon ANI-induced ribotoxic stress (Fig. S2, E–G). Taken together, these experiments revealed dynamic shuttling of TIAR from a nucleoplasmic distribution in unperturbed conditions to NSs early after ribotoxic stress, followed by redistribution of TIAR in cytoplasmic SGs as a delayed response to ANI treatment.
Core spliceosomal components are recruited to NSs upon ribotoxic stress
TIA proteins were shown to bind U1C within the U1 snRNP and thereby promote 5′ splice-site recognition (Aznarez et al., 2008; Förch et al., 2002). Therefore, we explored whether spliceosomal components may also change their localization upon treatment with ribotoxins. Indeed, U1C was mostly nucleoplasmic in control cells and colocalized with TIAR in NSs when cells were treated with ANI, CHX, or HT (Fig. 2, A and B). Pretreatment with SB202190, but not SP600125, prevented U1C from localizing to NSs, demonstrating that the localization of U1C in NSs is also dependent on p38 MAPK activation and recapitulates the localization of TIAR (Fig. S3 A). Similar to U1C, U1-70K was also nucleoplasmic under basal conditions and strongly recruited to NSs upon ANI treatment (Fig. 2 C and Fig. S3 B).

Reorganization of nuclear speckles upon ribotoxic stress. HeLa cells were treated with DMSO or indicated ribotoxins for 2 h (ANI, 0.1 µg/ml; CHX, 100 µg/ml; HT, 2 µg/ml). (A) Subcellular localization of U1C and TIAR was assessed by IF microscopy; scale bar = 20 µm. (B) Box-and-whisker plots depicting the number of U1C-positive NSs per nucleus. An ImageJ macro was used for automated quantification of IF micrographs; N = 2; DMSO (n = 128), ANI (n = 128), CHX (n = 133), and HT (n = 142). (C) Number of U1-70K-positive NSs per nucleus; N = 2; DMSO (n = 210), ANI (n = 199). (D) Number of U1A-positive NSs per nucleus; N = 2; DMSO (n = 125), ANI (n = 124). (E) Number of U2AF65-positive NSs per nucleus; N = 2; DMSO (n = 224), ANI (n = 223). (F) Number of PRPF3-positive NSs per nucleus; N = 2; DMSO (n = 376), ANI (n = 386). (G) Number of PRP19-positive NSs per nucleus; N = 2; DMSO (n = 184), ANI (n = 224). (H) Number of pS2-RPOL2A-positive NSs per nucleus; N = 1; DMSO (n = 42), ANI (n = 83). (I) Subcellular localization of pS2-RPOL2A was assessed by IF microscopy; scale bar = 20 µm; scale bar inset = 5 µm. In B–H, P values were determined by a two-sided Wilcoxon rank sum test. N, number of biological repeat experiments; n, total number of cells quantified in all biological repeats.
Reorganization of nuclear speckles upon ribotoxic stress. HeLa cells were treated with DMSO or indicated ribotoxins for 2 h (ANI, 0.1 µg/ml; CHX, 100 µg/ml; HT, 2 µg/ml). (A) Subcellular localization of U1C and TIAR was assessed by IF microscopy; scale bar = 20 µm. (B) Box-and-whisker plots depicting the number of U1C-positive NSs per nucleus. An ImageJ macro was used for automated quantification of IF micrographs; N = 2; DMSO (n = 128), ANI (n = 128), CHX (n = 133), and HT (n = 142). (C) Number of U1-70K-positive NSs per nucleus; N = 2; DMSO (n = 210), ANI (n = 199). (D) Number of U1A-positive NSs per nucleus; N = 2; DMSO (n = 125), ANI (n = 124). (E) Number of U2AF65-positive NSs per nucleus; N = 2; DMSO (n = 224), ANI (n = 223). (F) Number of PRPF3-positive NSs per nucleus; N = 2; DMSO (n = 376), ANI (n = 386). (G) Number of PRP19-positive NSs per nucleus; N = 2; DMSO (n = 184), ANI (n = 224). (H) Number of pS2-RPOL2A-positive NSs per nucleus; N = 1; DMSO (n = 42), ANI (n = 83). (I) Subcellular localization of pS2-RPOL2A was assessed by IF microscopy; scale bar = 20 µm; scale bar inset = 5 µm. In B–H, P values were determined by a two-sided Wilcoxon rank sum test. N, number of biological repeat experiments; n, total number of cells quantified in all biological repeats.

Subcellular localization of spliceosomal components upon anisomycin treatment. (A) Subcellular localization of U1C in HeLa cells was determined by immunofluorescence (IF) microscopy after a 2-h treatment with DMSO or ANI (0.1 µg/ml), with or without 1-h pretreatment with the p38 MAPK inhibitor SB202190 (10 µM) or the JNK inhibitor SP600125 (10 µM). The same sample stained with a different primary and secondary antibody is shown in Fig. S2 C. (B–F) HeLa cells were treated with DMSO or ANI (0.1 µg/ml) for 2 h. Subcellular localization of indicated proteins was determined by IF microscopy. (B) Subcellular localization of U1-70K and TIAR. (C) Subcellular localization of U1A and TIAR. (D) Subcellular localization of U2AF65 and TIAR. (E) Subcellular localization of PRPF3 and TIAR. (F) Subcellular localization of PRP19 and TIAR. In panels A–F, scale bar = 20 µm. (G) Subcellular localization of CASC3 and SRRM2 (SC35 Ab) upon treatment of HeLa cells with DMSO or ANI (0.1 µg/ml) for 0.5 or 2 h; scale bar = 10 µm.
Subcellular localization of spliceosomal components upon anisomycin treatment. (A) Subcellular localization of U1C in HeLa cells was determined by immunofluorescence (IF) microscopy after a 2-h treatment with DMSO or ANI (0.1 µg/ml), with or without 1-h pretreatment with the p38 MAPK inhibitor SB202190 (10 µM) or the JNK inhibitor SP600125 (10 µM). The same sample stained with a different primary and secondary antibody is shown in Fig. S2 C. (B–F) HeLa cells were treated with DMSO or ANI (0.1 µg/ml) for 2 h. Subcellular localization of indicated proteins was determined by IF microscopy. (B) Subcellular localization of U1-70K and TIAR. (C) Subcellular localization of U1A and TIAR. (D) Subcellular localization of U2AF65 and TIAR. (E) Subcellular localization of PRPF3 and TIAR. (F) Subcellular localization of PRP19 and TIAR. In panels A–F, scale bar = 20 µm. (G) Subcellular localization of CASC3 and SRRM2 (SC35 Ab) upon treatment of HeLa cells with DMSO or ANI (0.1 µg/ml) for 0.5 or 2 h; scale bar = 10 µm.
U1A was already visible in NSs in unperturbed cells, yet the association with NSs became more prominent upon ANI treatment (Fig. 2 D and Fig. S3 C). U2AF65, an RNA binding protein essential for 3′ splice site recognition, was similar to U1A in showing enhanced recruitment to NSs in ANI-treated cells (Fig. 2 E and Fig. S3 D). In contrast, two proteins required for later steps of splicing, PRPF3 (associated with the U4/U6 snRNP) and PRP19 (a component of the nineteen complex), showed prominent localization to speckles in unperturbed cells, which did not further increase upon exposure to ANI (Fig. 2, F and G; and Fig. S3, E and F). On the other hand, CASC3 (also termed MLN51 or Barentsz), a component of the exon junction complex, did not show an association with NSs under control or ANI conditions (Fig. S3 G).
Since the majority of introns are spliced in a cotranscriptional manner (Herzel et al., 2017), we also explored the relationship between RNA polymerase II and NSs in cells subjected to ribotoxic stress. Interestingly, we observed that elongating RNA polymerase II phosphorylated at serine 2 of its C-terminal domain prominently colocalizes with TIAR in NSs after exposing cells to ANI, whereas it has a more diffuse and patchy appearance in unperturbed cells (Fig. 2, H and I). Taken together, our results reveal prominent relocalization of elongating RNA polymerase II, U1 snRNP components, and U2AF65 to NSs in ANI-treated cells, suggesting that ribotoxic stress may cause changes in early steps of cotranscriptional splicing.
Splicing efficiency increases upon ribotoxic stress via p38 MAPK activation
To explore whether ribotoxic stress causes alterations in splicing, we treated HeLa-TREx-TIARr cells expressing endogenous levels of TIAR for 2 h with ANI, with or without pretreatment for 1 h with the p38 MAPK inhibitor SB202190, and performed paired-end RNA-Seq of total RNA. We then assessed exon and intron coverage, whereby regions annotated as introns or exons in different transcript isoforms were assigned to the category “both.” The global analysis revealed that the vast majority of significant changes upon ANI treatment were caused by alterations in intron coverage (Fig. 3 A and Table S1). When we looked more closely at the differential coverage of individual introns, it became apparent that reduced coverage is the predominant phenomenon in ANI treatment, involving thousands of introns (Fig. 3 B).

Decrease in intron coverage upon anisomycin treatment. HeLa-TREx-TIARr cells (clone #5F) expressing endogenous levels of TIAR were transfected with control siRNAs for 48 h and treated with either DMSO, ANI (2 h), or SB202190 (SB, 1-h pretreatment) + ANI (2 h). Total RNA was subjected to RNA-Seq, and results were mapped to the human reference genome (GRCh38) followed by alternative splicing analysis using DEXSeq. (A) Fraction of annotations classified as either exonic, intronic or both within the group of total annotations (left), annotations without significant changes in coverage (middle) and annotations with significant changes in coverage (right) upon ANI treatment. (B) MA plot depicting the change in intron coverage upon ANI treatment. Intronic annotations with an adjusted P value (Padj) <0.01 are indicated in green. (C) Read coverage of exons (left) and introns (right) according to the position within the gene, following treatment of cells with DMSO (gray), ANI (blue), or SB202190 + ANI (orange). P values were determined by Kolmogorov–Smirnov test.
Decrease in intron coverage upon anisomycin treatment. HeLa-TREx-TIARr cells (clone #5F) expressing endogenous levels of TIAR were transfected with control siRNAs for 48 h and treated with either DMSO, ANI (2 h), or SB202190 (SB, 1-h pretreatment) + ANI (2 h). Total RNA was subjected to RNA-Seq, and results were mapped to the human reference genome (GRCh38) followed by alternative splicing analysis using DEXSeq. (A) Fraction of annotations classified as either exonic, intronic or both within the group of total annotations (left), annotations without significant changes in coverage (middle) and annotations with significant changes in coverage (right) upon ANI treatment. (B) MA plot depicting the change in intron coverage upon ANI treatment. Intronic annotations with an adjusted P value (Padj) <0.01 are indicated in green. (C) Read coverage of exons (left) and introns (right) according to the position within the gene, following treatment of cells with DMSO (gray), ANI (blue), or SB202190 + ANI (orange). P values were determined by Kolmogorov–Smirnov test.
We then assessed exon and intron coverage according to the position within the gene, i.e., separately for all first, second, third, and fourth exons and introns, and found that ANI treatment causes a pronounced reduction of the coverage of the second, third, and fourth introns, whereas the coverage of the first introns was reduced to a lesser extent (Fig. 3 C). Also, this analysis confirmed that ANI-induced reduction in intron coverage is prevented by pretreatment with SB202190. On the other hand, the coverage of exons was barely affected by ANI treatment (Fig. 3 C). The difference in coverage between the first and the ensuing introns may suggest that the recruitment of splicing factors to the elongating RNA polymerase II becomes more efficient upon ANI treatment. This interpretation is in agreement with our observation that spliceosomal components essential for splice site recognition show enhanced colocalization with elongating RNA polymerase II in NSs upon ANI treatment (Fig. 2).
Next, we approximated the gene-specific splicing efficiency by dividing, for every gene, the number of exonic reads by the number of intronic reads (Fig. 4 A). Across all genes, we observed that ANI treatment leads to an increase of the log10-based median exon/intron ratio from 2.06 to 2.14 (Fig. 4 B), suggestive of an increase in splicing efficiency. Notably, the log10-based exon/intron ratio remains at 2.03 when cells were pretreated with SB202190 before ANI treatment, demonstrating that the increase in splicing efficiency is p38 MAPK-dependent.

Assessment of global splicing efficiency by RNA-Seq. (A) Schematic diagram illustrating the reads (red) used for calculating splicing efficiencies. For exon/intron ratios, alignments fully contained within exonic or intronic regions were counted. Junction/boundary ratios were calculated from reads spanning exon–exon junctions or covering exon–intron boundaries. (B) Density plot depicting the splicing efficiency (exon/intron ratio) distribution of all expressed genes upon treatment with DMSO, ANI (2 h), or SB202190 (SB, 1-h pretreatment) + ANI (2 h). The dashed line shows the median value in DMSO-treated cells. (C) Changes of junction/boundary ratios versus changes of exon/intron ratios upon 2 h of ANI treatment (N = 4). The blue dashed line shows the total-least-squares regression. (D) Density plot depicting the splicing efficiency (junction/boundary ratio) distribution for all expressed genes upon treatment with DMSO, ANI (2 h), or SB202190 (SB, 1-h pretreatment) + ANI (2 h); the dashed line shows the median value in DMSO-treated cells. (E) Box-and-whisker plot of mRNA half-lives (HL) determined by transcriptional shut-off using actinomycin D in DMSO- and ANI-treated cells. (F) Changes in mRNA abundance versus changes in mRNA HL upon ANI treatment. (G) Kinetics of predicted change in mRNA abundance induced only by a change in mRNA HL for two hypothetical mRNAs with a resulting HL of 5.1 h (blue) or 9.0 h (red). (H) Observed change in mRNA abundance versus the predicted change in mRNA abundance induced only by the observed change in mRNA HL upon ANI treatment. (I) Change in exon/intron ratio versus change in mRNA HL upon ANI treatment. (J) Change in exon/intron ratio versus predicted change in mRNA abundance induced only by the observed change in mRNA HL upon ANI treatment; r, Pearson’s correlation coefficient. In B and D, P values were determined by paired, two-sided Wilcoxon rank sum test.
Assessment of global splicing efficiency by RNA-Seq. (A) Schematic diagram illustrating the reads (red) used for calculating splicing efficiencies. For exon/intron ratios, alignments fully contained within exonic or intronic regions were counted. Junction/boundary ratios were calculated from reads spanning exon–exon junctions or covering exon–intron boundaries. (B) Density plot depicting the splicing efficiency (exon/intron ratio) distribution of all expressed genes upon treatment with DMSO, ANI (2 h), or SB202190 (SB, 1-h pretreatment) + ANI (2 h). The dashed line shows the median value in DMSO-treated cells. (C) Changes of junction/boundary ratios versus changes of exon/intron ratios upon 2 h of ANI treatment (N = 4). The blue dashed line shows the total-least-squares regression. (D) Density plot depicting the splicing efficiency (junction/boundary ratio) distribution for all expressed genes upon treatment with DMSO, ANI (2 h), or SB202190 (SB, 1-h pretreatment) + ANI (2 h); the dashed line shows the median value in DMSO-treated cells. (E) Box-and-whisker plot of mRNA half-lives (HL) determined by transcriptional shut-off using actinomycin D in DMSO- and ANI-treated cells. (F) Changes in mRNA abundance versus changes in mRNA HL upon ANI treatment. (G) Kinetics of predicted change in mRNA abundance induced only by a change in mRNA HL for two hypothetical mRNAs with a resulting HL of 5.1 h (blue) or 9.0 h (red). (H) Observed change in mRNA abundance versus the predicted change in mRNA abundance induced only by the observed change in mRNA HL upon ANI treatment. (I) Change in exon/intron ratio versus change in mRNA HL upon ANI treatment. (J) Change in exon/intron ratio versus predicted change in mRNA abundance induced only by the observed change in mRNA HL upon ANI treatment; r, Pearson’s correlation coefficient. In B and D, P values were determined by paired, two-sided Wilcoxon rank sum test.
To confirm that the ratio of exonic to intronic reads indeed reflects the mRNA to pre-mRNA ratio, we determined the number of reads spanning exon–exon junctions as an exclusive measure for spliced mRNA, and the number of reads covering exon–intron boundaries as an exclusive measure for un-spliced pre-mRNA. Considering that the number of reads covering exon–intron boundaries is low, the junction/boundary ratio correlates well with the exon/intron ratio (Fig. 4 C; Pearson’s correlation coefficient r = 0.56), reflecting the spliced/unspliced mRNA ratio. Using the junction/boundary ratio, ANI treatment showed a p38 MAPK-dependent increase in splicing efficiency (Fig. 4 D), as observed with the exon/intron ratio (Fig. 4 B).
The ratio of spliced to unspliced mRNA does not only depend on splicing efficiency but can also be affected by changes in mRNA half-life (HL; Gaidatzis et al., 2016). Therefore, we measured transcriptome-wide mRNA HL under control conditions and after 2 h treatment with ANI using transcriptional shut-off with actinomycin D. ANI treatment led to a global, ∼1.75-fold stabilization of mRNAs, with an increase in median mRNA HL from 5.1 to 9.0 h (Fig. 4 E). Transcript-specific mRNA HL showed only a weak correlation with changes in mRNA abundance (Fig. 4 F, r = 0.16). This can be explained by the fact that after 2 h of ANI treatment, gene expression is still far away from steady-state conditions (Fig. 4 G), especially when considering the longer mRNA HL in ANI-treated cells. By using the predicted change in mRNA abundance based on the measured changes in mRNA HL, correlation with the observed changes in mRNA abundance is markedly increased (Fig. 4 H, r = 0.27). Changes in the exon/intron ratio, however, do not correlate with changes in mRNA HL (Fig. 4 I) or the expected changes in mature mRNA abundance due to changes in HL (Fig. 4 J). From this we concluded that the observed increase in exon/intron ratios upon ANI treatment is not a mere consequence of mRNA stabilization.
Splicing of IEGs is derepressed upon ribotoxic stress
We then interrogated the RNA-Seq data for genes that display p38 MAPK-dependent changes in gene expression (mRNA levels) and placed these in relation with the changes in splicing efficiency (Fig. 5 A). The analysis revealed 161 genes with p38 MAPK-dependent changes in mRNA levels (blue), 301 genes with p38 MAPK-dependent changes in splicing efficiency (green), and a distinct set of 32 genes with significant changes in both mRNA levels and splicing efficiency (yellow; Fig. 5, A and B; and Table S2). Compared with all genes, the increase in splicing efficiency upon ANI treatment was much more pronounced for the 333 genes with statistically significant p38 MAPK-dependent changes in splicing efficiency (Fig. 5 C). A strong increase in splicing efficiency was also observed with the junction/boundary ratio, though this analysis could only be applied to a smaller number of p38 MAPK-dependent genes due to the low abundance of boundary reads (Fig. 5 D).

Gene-based analysis of splicing efficiency by RNA-Seq. (A) Dot plot depicting ANI-induced changes in splicing efficiency (exon/intron ratio) in relation to changes in mRNA levels; r, Pearson’s correlation coefficient. Genes with statistically significant, p38 MAPK-dependent changes in splicing efficiency (green), mRNA level (blue), or both (yellow) are indicated. (B) Pie chart depicting the proportion and number of genes with statistically significant, p38 MAPK-dependent changes in splicing efficiency (green), mRNA level (blue), or both (yellow). (C) Density plot depicting the splicing efficiency (exon/intron ratio) distribution for all genes with statistically significant, p38 MAPK-dependent changes in splicing efficiency; the dashed line shows the median value of the splicing efficiency of all expressed genes in DMSO-treated cells. (D) Same as in panel C, depicting the junction/boundary ratio-based splicing efficiency distribution. (E) Metabolic RNA labeling with 4-thiouridine (4sU) was either performed in parallel to ANI treatment to determine splicing efficiencies of unlabeled (pre-existing) mRNA or during the last 30 min of ANI treatment for nascent mRNA. (F) Proportion of intronic reads or reads covering exon–exon junctions among pre-existing or nascent bulk mRNA from all genes. (G) Same as in F for all genes with a p38-dependent change in splicing efficiency and/or mRNA level. (H) Fraction of immediate early genes (IEGs) among all expressed genes or among genes with statistically significant, p38 MAPK-dependent changes in splicing efficiency, mRNA level, or both. (I) Density plot depicting the splicing efficiency (exon/intron ratio) distribution for all IEGs with statistically significant, p38 MAPK-dependent changes in both splicing efficiency and mRNA levels; the dashed line shows the median value of the splicing efficiency of all expressed genes in DMSO-treated cells. (J) Same as in I depicting the junction/boundary ratio-based splicing efficiency distribution. In panels C, D, I, and J, P values were determined by paired, two-sided Wilcoxon rank sum test.
Gene-based analysis of splicing efficiency by RNA-Seq. (A) Dot plot depicting ANI-induced changes in splicing efficiency (exon/intron ratio) in relation to changes in mRNA levels; r, Pearson’s correlation coefficient. Genes with statistically significant, p38 MAPK-dependent changes in splicing efficiency (green), mRNA level (blue), or both (yellow) are indicated. (B) Pie chart depicting the proportion and number of genes with statistically significant, p38 MAPK-dependent changes in splicing efficiency (green), mRNA level (blue), or both (yellow). (C) Density plot depicting the splicing efficiency (exon/intron ratio) distribution for all genes with statistically significant, p38 MAPK-dependent changes in splicing efficiency; the dashed line shows the median value of the splicing efficiency of all expressed genes in DMSO-treated cells. (D) Same as in panel C, depicting the junction/boundary ratio-based splicing efficiency distribution. (E) Metabolic RNA labeling with 4-thiouridine (4sU) was either performed in parallel to ANI treatment to determine splicing efficiencies of unlabeled (pre-existing) mRNA or during the last 30 min of ANI treatment for nascent mRNA. (F) Proportion of intronic reads or reads covering exon–exon junctions among pre-existing or nascent bulk mRNA from all genes. (G) Same as in F for all genes with a p38-dependent change in splicing efficiency and/or mRNA level. (H) Fraction of immediate early genes (IEGs) among all expressed genes or among genes with statistically significant, p38 MAPK-dependent changes in splicing efficiency, mRNA level, or both. (I) Density plot depicting the splicing efficiency (exon/intron ratio) distribution for all IEGs with statistically significant, p38 MAPK-dependent changes in both splicing efficiency and mRNA levels; the dashed line shows the median value of the splicing efficiency of all expressed genes in DMSO-treated cells. (J) Same as in I depicting the junction/boundary ratio-based splicing efficiency distribution. In panels C, D, I, and J, P values were determined by paired, two-sided Wilcoxon rank sum test.
To investigate whether p38 MAPK-dependent changes affect co- or posttranscriptional splicing events, we performed 4-thiouridine (4sU) labeling either during the entire period or during the last 30 min of the 2-h ANI treatment (Fig. 5 E), which allows us to distinguish effects on newly synthesized and pre-existing RNA. When looking at all genes, splicing efficiency increases more strongly for newly synthesized than for pre-existing mRNA (Fig. 5 F). When focusing on genes with p38 MAPK-dependent changes, we also observed a pronounced increase in the splicing efficiency of pre-existing mRNA (Fig. 5 G). This indicates widespread activation of cotranscriptional splicing, whereby genes induced in a p38 MAPK-dependent manner also seem to benefit from enhanced posttranscriptional splicing.
Among the 32 genes with significant p38 MAPK-dependent changes in both mRNA level and splicing efficiency, the vast majority (30) showed an increase in mRNA expression and splicing efficiency upon ANI treatment (Fig. 5 A; yellow). This group is of particular interest since we found it to be strongly enriched for IEGs (Fig. 5 H), a class of genes characterized by rapid induction within 30 min of stimulation (Arner et al., 2015). Notably, under basal conditions, the splicing efficiency of the 24 IEGs within this group was distinctly below that of all genes (log10-based median exon/intron ratio of 1.47 compared with 2.13), and ANI treatment led to a strong, p38 MAPK-dependent increase in the splicing efficiency of these IEGs (Fig. 5 I; compared with Fig. 4 B). The same was observed when using the junction/boundary ratio as a measure of splicing efficiency (Fig. 5 J). From these results, we concluded that the splicing of many IEGs is repressed under basal conditions and derepressed in response to ribotoxic stress.
Retained introns are excised upon ribotoxic stress
Inspection of gene tracks revealed a predominant pattern among the 24 IEGs with significant changes in both mRNA level and splicing efficiency: 21 of them showed intron retention under control (DMSO) conditions and loss of intron retention upon ANI treatment in a strictly p38 MAPK-dependent manner (Fig. 6, A–D, Fig. S4, A–R, and Table S3). In contrast, splicing of a control gene such as GAPDH was efficient under basal conditions and not affected by ANI treatment (Fig. 6 E).

p38 MAPK-dependent loss of intron retention upon ribotoxic stress. (A) Pie chart depicting the proportion of IEGs with p38 MAPK-dependent regulation of intron retention upon treatment of HeLa cells with ANI. (B) RNA-Seq read coverage along the gene track of ZFP36 in HeLa cells upon treatment with DMSO, ANI (2 h) or SB202190 (SB, 1-h pre-treatment) + ANI (2 h). (C) Same analysis as in B for FOS. (D) Same analysis as in B for NR4A2. (E) Same analysis as in panel B for GAPDH. (F) Quantification of ZFP36 mRNA and pre-mRNA levels by RT-qPCR. Total RNA samples were collected upon treatment with DMSO, ANI (2 h), or SB202190 (SB, 1 h pretreatment) + ANI (2 h). RNA samples were reverse transcribed into cDNA using random hexamers followed by quantitative PCR. Primer pairs spanning exon–exon junctions or exon–intron boundaries are indicated schematically. Expression values were normalized to GAPDH and scaled relative to the expression level in DMSO-treated cells. The ratio between mRNA and pre-mRNA levels serves as an indicator of splicing efficiency (mean ± SEM; N = 3). (G) Same analysis as in F for FOS. (H) Same analysis as in F for NR4A2. (I) Quantification of ZFP36 mRNA and pre-mRNA levels by RT-qPCR upon treatment with DMSO or ANI for 0.5 h, as in F (mean ± SEM; N = 3). (J) Same analysis as in I for FOS. (K) Same analysis as in I for NR4A2.
p38 MAPK-dependent loss of intron retention upon ribotoxic stress. (A) Pie chart depicting the proportion of IEGs with p38 MAPK-dependent regulation of intron retention upon treatment of HeLa cells with ANI. (B) RNA-Seq read coverage along the gene track of ZFP36 in HeLa cells upon treatment with DMSO, ANI (2 h) or SB202190 (SB, 1-h pre-treatment) + ANI (2 h). (C) Same analysis as in B for FOS. (D) Same analysis as in B for NR4A2. (E) Same analysis as in panel B for GAPDH. (F) Quantification of ZFP36 mRNA and pre-mRNA levels by RT-qPCR. Total RNA samples were collected upon treatment with DMSO, ANI (2 h), or SB202190 (SB, 1 h pretreatment) + ANI (2 h). RNA samples were reverse transcribed into cDNA using random hexamers followed by quantitative PCR. Primer pairs spanning exon–exon junctions or exon–intron boundaries are indicated schematically. Expression values were normalized to GAPDH and scaled relative to the expression level in DMSO-treated cells. The ratio between mRNA and pre-mRNA levels serves as an indicator of splicing efficiency (mean ± SEM; N = 3). (G) Same analysis as in F for FOS. (H) Same analysis as in F for NR4A2. (I) Quantification of ZFP36 mRNA and pre-mRNA levels by RT-qPCR upon treatment with DMSO or ANI for 0.5 h, as in F (mean ± SEM; N = 3). (J) Same analysis as in I for FOS. (K) Same analysis as in I for NR4A2.

RNA-Seq read coverage along immediate early gene tracks. (A) Gene track of AREG showing RNA-Seq read coverage in HeLa cells upon treatment with DMSO, ANI (2 h), or SB202190 (SB, 1-h pretreatment) + ANI (2 h). Regions with regulated intron retention are marked in red. (B) Gene track of ATF3. (C) Gene track of CTGF (CCN2). (D) Gene track of CXCL8 (IL8). (E) Gene track of CYR61 (CCN1). (F) Gene track of DUSP2. (G) Gene track of DUSP5. (H) Gene track of EDN1. (I) Gene track of ERRFI1. (J) Gene track of FOSL1. (K) Gene track of IL6. (L) Gene track of LIF. (M) Gene track of NR4A1. (N) Gene track of NR4A3. (O) Gene track of PTGS2. (P) Gene track of SGK1. (Q) Gene track of SOCS3. (R) Gene track of TNFAIP3.
RNA-Seq read coverage along immediate early gene tracks. (A) Gene track of AREG showing RNA-Seq read coverage in HeLa cells upon treatment with DMSO, ANI (2 h), or SB202190 (SB, 1-h pretreatment) + ANI (2 h). Regions with regulated intron retention are marked in red. (B) Gene track of ATF3. (C) Gene track of CTGF (CCN2). (D) Gene track of CXCL8 (IL8). (E) Gene track of CYR61 (CCN1). (F) Gene track of DUSP2. (G) Gene track of DUSP5. (H) Gene track of EDN1. (I) Gene track of ERRFI1. (J) Gene track of FOSL1. (K) Gene track of IL6. (L) Gene track of LIF. (M) Gene track of NR4A1. (N) Gene track of NR4A3. (O) Gene track of PTGS2. (P) Gene track of SGK1. (Q) Gene track of SOCS3. (R) Gene track of TNFAIP3.
To corroborate these findings, we focused on three IEGs, ZFP36, FOS, and NR4A2, and measured both mature mRNA and pre-mRNA levels by quantitative RT-qPCR using exon–exon and exon–intron spanning primers, respectively. The analysis showed that 2-h ANI treatment causes a much stronger increase in mature mRNA levels than pre-mRNA levels of ZFP36, FOS, and NR4A2, as reflected by a 6- to 80-fold increase in the mRNA/pre-mRNA ratio (Fig. 6, F–H). The results were almost identical when using oligo-dT primers for the RT reaction (Fig. S5 A) instead of random hexamers (Fig. 6, F–H).

Splicing and subcellular localization IEG mRNAs. (A) Quantification of IEG mRNA and pre-mRNA levels by RT-qPCR. HeLa cells were treated with DMSO or ANI (0.1 µg/ml) for 2 h. RNA samples were reverse-transcribed to cDNA by using oligo-dT followed by quantitative PCR. Primer pairs spanning exon–exon or exon–intron junctions are indicated schematically. Expression values of ZFP36, FOS, and NR4A2 were normalized to GAPDH and scaled relative to the expression level in DMSO-treated cells. The ratio between mRNA and pre-mRNA levels serves as an indicator of splicing efficiency (mean ± SEM; N = 3). (B) HeLa cells were treated with DMSO or ANI (0.1 µg/ml) for 2 h. ZFP36 mRNA was visualized by RNA-FISH, in combination with NS visualization using SON staining by IF microscopy. Intensity profiles of ZFP36 mRNA and SON protein were plotted from left to right along the white line in the merged image; scale bar = 10 µm. (C) Subcellular localization of ZFP36 mRNA along with U1C protein was visualized as in panel B. (D) Visualization of FOS mRNA (upper) and NR4A2 mRNA (lower) by RNA-FISH in HeLa cells after treatment for 0.5 or 2 h with ANI (0.1 µg/ml), DMSO serves as control; scale bar = 20 µm. (E) Subcellular localization of FOS mRNA along with U1C protein was visualized in HeLa cells treated with DMSO or ANI (0.1 µg/ml) for 0.5 h, as in panel B. (F) HeLa cells were treated with DMSO or ANI (0.1 µg/ml) for 0.5 h. Where indicated, p38 MAPK inhibitor (SB202190) or JNK inhibitor (SP600125) was added 1 h prior to ANI treatment. Subcellular localization of NR4A2 mRNA was assessed by RNA-FISH, in combination with NS visualization using SRRM2 (SC35 Ab) staining by IF microscopy; scale bar = 20 µm; inset scale bar = 5 µm. (G) Quantification of HeLa cells with NR4A2 mRNA localizing in NSs marked by SRRM2 (SC35 Ab) staining (mean ± SEM; N ≥ 3). P values were determined by beta regression.
Splicing and subcellular localization IEG mRNAs. (A) Quantification of IEG mRNA and pre-mRNA levels by RT-qPCR. HeLa cells were treated with DMSO or ANI (0.1 µg/ml) for 2 h. RNA samples were reverse-transcribed to cDNA by using oligo-dT followed by quantitative PCR. Primer pairs spanning exon–exon or exon–intron junctions are indicated schematically. Expression values of ZFP36, FOS, and NR4A2 were normalized to GAPDH and scaled relative to the expression level in DMSO-treated cells. The ratio between mRNA and pre-mRNA levels serves as an indicator of splicing efficiency (mean ± SEM; N = 3). (B) HeLa cells were treated with DMSO or ANI (0.1 µg/ml) for 2 h. ZFP36 mRNA was visualized by RNA-FISH, in combination with NS visualization using SON staining by IF microscopy. Intensity profiles of ZFP36 mRNA and SON protein were plotted from left to right along the white line in the merged image; scale bar = 10 µm. (C) Subcellular localization of ZFP36 mRNA along with U1C protein was visualized as in panel B. (D) Visualization of FOS mRNA (upper) and NR4A2 mRNA (lower) by RNA-FISH in HeLa cells after treatment for 0.5 or 2 h with ANI (0.1 µg/ml), DMSO serves as control; scale bar = 20 µm. (E) Subcellular localization of FOS mRNA along with U1C protein was visualized in HeLa cells treated with DMSO or ANI (0.1 µg/ml) for 0.5 h, as in panel B. (F) HeLa cells were treated with DMSO or ANI (0.1 µg/ml) for 0.5 h. Where indicated, p38 MAPK inhibitor (SB202190) or JNK inhibitor (SP600125) was added 1 h prior to ANI treatment. Subcellular localization of NR4A2 mRNA was assessed by RNA-FISH, in combination with NS visualization using SRRM2 (SC35 Ab) staining by IF microscopy; scale bar = 20 µm; inset scale bar = 5 µm. (G) Quantification of HeLa cells with NR4A2 mRNA localizing in NSs marked by SRRM2 (SC35 Ab) staining (mean ± SEM; N ≥ 3). P values were determined by beta regression.
Interestingly, pre-mRNA levels showed a much stronger increase than mRNA levels when the same RT-qPCR analysis was performed after 0.5 h of ANI treatment (Fig. 6, I–K), arguing that transcriptional induction precedes the full activation of splicing. Taken together, these experiments revealed that ANI, in addition to the transcriptional response, strongly promotes the splicing of many IEG pre-mRNAs whose introns are retained under basal conditions. Hence, loss of intron retention appears as a rapid means to enhance the synthesis of mature IEG mRNAs and correlates with the accumulation of spliceosomal components in NSs.
ZFP36 and FOS mRNAs relocalize to NSs upon ribotoxic stress
To explore whether the altered composition of NSs observed upon ribotoxic stress (Figs. 1 and 2) might be linked to splicing activation, we assessed the localization of SF3B1 phosphorylated at threonine 313. SF3B1 is a core subunit of U2 snRNP and becomes hyperphosphorylated during the catalytic cycle of the spliceosome (Girard et al., 2012). In unperturbed HeLa cells, phospho-T313-SF3B1 was found to localize predominantly in areas closely surrounding NSs, though a smaller fraction was also observed within NSs and linked to posttranscriptional splicing (Girard et al., 2012). Under conditions of ribotoxic stress, we observe a strong increase of the phospho-T313-SF3B1 signal and prominent colocalization with NSs, especially early (0.5 h) after ANI treatment (Fig. 7, A and B).

Early increase of SF3B1 phosphorylation upon ANI treatment. HeLa cells were treated with either DMSO (2 h) or ANI (0.1 µg/ml) for 0.5 or 2 h. (A) Subcellular localization of SRRM2 (SC35 Ab) and SF3B1 phosphorylated at Thr313 was assessed by IF microscopy; scale bar = 10 µm. (B) Box-and-whisker plots depicting the phospho-T313-SF3B1 intensity per nucleus; N = 1; DMSO (n = 326), ANI 0.5 h (n = 396), ANI 2 h (n = 325). P values were determined using a two-sided Wilcoxon rank sum test.
Early increase of SF3B1 phosphorylation upon ANI treatment. HeLa cells were treated with either DMSO (2 h) or ANI (0.1 µg/ml) for 0.5 or 2 h. (A) Subcellular localization of SRRM2 (SC35 Ab) and SF3B1 phosphorylated at Thr313 was assessed by IF microscopy; scale bar = 10 µm. (B) Box-and-whisker plots depicting the phospho-T313-SF3B1 intensity per nucleus; N = 1; DMSO (n = 326), ANI 0.5 h (n = 396), ANI 2 h (n = 325). P values were determined using a two-sided Wilcoxon rank sum test.
Finally, we examined the localization of ZFP36 mRNA by RNA-fluorescence in situ hybridization (RNA-FISH) in relation to the NS marker SRRM2 (SC35 Ab). In control (DMSO-treated) cells, the ZFP36 transcription loci were clearly visible as two nuclear foci by RNA-FISH, yet these foci did not overlap with NSs (Fig. 8 A). Strikingly, the ZFP36 transcription foci showed very prominent colocalization with NSs after 2 h of ANI treatment (Fig. 8 A). This finding was corroborated by plotting the ZFP36 mRNA signal intensity across a line scan together with the SRRM2 signal (Fig. 8 B), the SON signal (Fig. S5 B), and the U1C signal (Fig. S5 C). In contrast to ZFP36, the transcription foci of GAPDH, whose splicing is not activated by ANI (Fig. 6 E), did not colocalize with NSs under either condition (Fig. 8 C). Importantly, treatment of cells with the p38 MAPK inhibitor SB202190, but not with the JNK inhibitor SP600125, prevented ANI-induced colocalization of ZFP36 transcription foci with NSs (Fig. 8, A and D), in line with the suppressive effect of p38 MAPK inhibition on NS reorganization and splicing activation. As NS reorganization is coincident with activation of ZFP36 pre-mRNA splicing and relocalization of ZFP36 transcription foci to NSs, we concluded that targeted excision of retained introns most likely occurs at NSs following their reorganization upon ANI treatment.

Subcellular localization of ZFP36 mRNA upon ribotoxic stress. (A) HeLa cells were treated with DMSO or ANI (0.1 µg/ml) for 2 h. Where indicated, p38 MAPK inhibitor (SB202190) or JNK inhibitor (SP600125) was added 1 h prior to ANI treatment. Subcellular localization of ZFP36 mRNA was assessed by fluorescence in situ hybridization (RNA-FISH), in combination with NS visualization using SRRM2 (SC35 Ab) staining by IF microscopy; scale bar = 20 µm; inset scale bar = 5 µm. (B) Same analysis as in A for cells treated with DMSO or ANI for 2 h. Intensity profiles of ZFP36 mRNA and SRRM2 protein signals were plotted from left to right along the white line in the merged image; scale bar = 10 µm. (C) Subcellular localization of GAPDH mRNA relative to NSs, as in A; scale bar = 20 µm; inset scale bar = 5 µm. (D) Quantification of cells with ZFP36 mRNA localizing in NSs marked by SRRM2 (SC35 Ab) staining (mean ± SEM; N ≥ 3). P values were determined by beta regression.
Subcellular localization of ZFP36 mRNA upon ribotoxic stress. (A) HeLa cells were treated with DMSO or ANI (0.1 µg/ml) for 2 h. Where indicated, p38 MAPK inhibitor (SB202190) or JNK inhibitor (SP600125) was added 1 h prior to ANI treatment. Subcellular localization of ZFP36 mRNA was assessed by fluorescence in situ hybridization (RNA-FISH), in combination with NS visualization using SRRM2 (SC35 Ab) staining by IF microscopy; scale bar = 20 µm; inset scale bar = 5 µm. (B) Same analysis as in A for cells treated with DMSO or ANI for 2 h. Intensity profiles of ZFP36 mRNA and SRRM2 protein signals were plotted from left to right along the white line in the merged image; scale bar = 10 µm. (C) Subcellular localization of GAPDH mRNA relative to NSs, as in A; scale bar = 20 µm; inset scale bar = 5 µm. (D) Quantification of cells with ZFP36 mRNA localizing in NSs marked by SRRM2 (SC35 Ab) staining (mean ± SEM; N ≥ 3). P values were determined by beta regression.
We then conducted RNA-FISH for FOS and NR4A2 mRNA, and observed that the transcription foci of these genes are prominently visible earlier in the response, 0.5 h after ANI treatment (Fig. 9 A; and Fig. S5, D and E). Similar to ZFP36, FOS transcription foci showed a p38 MAPK-dependent relocalization to NSs upon ANI treatment (Fig. 9 B), albeit to a lesser degree than ZFP36 (Fig. 9 C, compared with Fig. 8 D). In contrast to ZFP36 and FOS, NR4A2 transcription foci appeared to localize predominantly at the nuclear periphery and did not show substantial colocalization with NSs under any of the conditions tested (Fig. S5, F and G). These results indicate that NS reorganization underlies splicing activation of some, but not all transcripts that are regulated by targeted intron excision in response to ribotoxic stress.

Subcellular localization of FOS mRNA upon ribotoxic stress. (A) HeLa cells were treated with DMSO or ANI (0.1 µg/ml) for 0.5 h. Subcellular localization of FOS mRNA was assessed by RNA-FISH, in combination with NS visualization using SRRM2 (SC35 Ab) staining by IF microscopy. Intensity profiles of FOS mRNA and SRRM2 protein signals were plotted from left to right along the white line in the merged image; scale bar = 10 µm. (B) HeLa cells were treated with DMSO or ANI (0.1 µg/ml) for 0.5 h. Where indicated, p38 MAPK inhibitor (SB202190) or JNK inhibitor (SP600125) was added 1 h prior to ANI treatment. Subcellular localization of FOS mRNA was assessed by RNA-FISH, in combination with NS visualization using SRRM2 (SC35 Ab) staining by IF microscopy; scale bar = 20 µm; inset scale bar = 5 µm. (C) Quantification of cells with FOS mRNA localizing in NSs (mean ± SEM; N ≥ 3). P values were determined by beta regression.
Subcellular localization of FOS mRNA upon ribotoxic stress. (A) HeLa cells were treated with DMSO or ANI (0.1 µg/ml) for 0.5 h. Subcellular localization of FOS mRNA was assessed by RNA-FISH, in combination with NS visualization using SRRM2 (SC35 Ab) staining by IF microscopy. Intensity profiles of FOS mRNA and SRRM2 protein signals were plotted from left to right along the white line in the merged image; scale bar = 10 µm. (B) HeLa cells were treated with DMSO or ANI (0.1 µg/ml) for 0.5 h. Where indicated, p38 MAPK inhibitor (SB202190) or JNK inhibitor (SP600125) was added 1 h prior to ANI treatment. Subcellular localization of FOS mRNA was assessed by RNA-FISH, in combination with NS visualization using SRRM2 (SC35 Ab) staining by IF microscopy; scale bar = 20 µm; inset scale bar = 5 µm. (C) Quantification of cells with FOS mRNA localizing in NSs (mean ± SEM; N ≥ 3). P values were determined by beta regression.
Discussion
Intron retention was discovered in the 1990s as a form of alternative splicing used by human immunodeficiency virus and other retroviruses, whereby intron-containing mRNAs are exported from the nucleus as a means to increase the repertoire of proteins expressed from a viral genome of limited size (Rekosh and Hammarskjold, 2018). In mammalian genomes, most introns are considerably longer than the average exon. Consequently, the retention of an intron typically prevents export of the mRNA from the nucleus, a process also referred to intron detention, or causes degradation of the mRNA by nonsense-mediated mRNA decay due to termination codons within the retained intron (Wegener and Muller-McNicoll, 2018). Indeed, nuclear retention followed by degradation of intron-containing mRNAs was described as a mechanism to suppress ectopic and precocious gene expression during neuronal differentiation (Yap et al., 2012). Moreover, efficient excision of retained introns was observed during neuronal activation (Mauger et al., 2016).
Mouse embryonic stem cells were found to express a surprisingly large number of intron-containing mRNAs that are retained and stable in the nucleus (Boutz et al., 2015), indicating that the delayed, post-transcriptional splicing of these introns may represent a mode of gene activation. A beautiful example of such a mechanism was observed during the trans-meiotic differentiation of male germ cells in mice, where intron-containing mRNAs are stored in the nucleus of spermatocytes until their splicing is activated in post-meiotic spermatids, allowing for the induction, nuclear export, and translation of specific mRNAs at a stage when transcription is silent (Naro et al., 2017). Intron retention was also found to be regulated during the response to heat shock, where the retention of numerous introns is induced during the recovery phase, possibly as a mechanism to suppress the expression of these genes while their transcription is maintained (Ninomiya et al., 2020). In this case, the underlying mechanism could be tied to the phosphorylation of serine- and arginine-rich splicing factor 9 (SRSF9) by CDC-like kinase 1 (CLK1) in nuclear stress bodies, a nuclear subdomain specifically induced upon heat shock (Ninomiya et al., 2020). Additionally, the maturation of CLK1 pre-mRNA itself is also mediated by the excision of a retained intron during heat shock (Ninomiya et al., 2011).
In the above examples, intron retention affects individual—typically single—introns within a gene. This is different from the mode of intron retention we describe here for IEGs, where all introns of the gene are affected by intron retention under basal conditions, yet efficiently spliced during the response to ribotoxic stress (Figs. 6 and S4). This indicates that the underlying mechanism is not associated with the recognition of particular splice sites by splicing factors and/or the spliceosome. We rather envision that a peculiar feature of either the promoter, the elongating RNA polymerase or the chromatin structure, dictates inefficient splicing of IEGs under basal conditions and efficient splicing once transcription is activated. Given that we observed enhanced splicing of both pre-existing and newly synthesized IEG transcripts upon ANI treatment (Fig. 5 G), our results suggest that IEGs generate a pool of unspliced pre-mRNAs that remain stable in the nucleus, and that IEG induction upon ribotoxic stress involves not only a transcriptional pulse but also excision of the retained introns through post- and cotranscriptional splicing. This process is dependent on p38 MAPK signaling, and post-transcriptional splicing of pre-existing pre-mRNAs would provide for an immediate release of mature mRNAs that is independent of de novo transcription, rendering IEG induction faster and more robust.
IEGs are commonly defined as genes whose mRNA expression is induced within 30 min of a stimulus and does not require protein synthesis. Interestingly, many IEGs are subject to a phenomenon termed superinduction, whereby their mRNA expression is further enhanced by the application of translation inhibitors—especially ribotoxins such as ANI or CHX (Radulovic and Tronson, 2008). Several mechanisms are thought to account for superinduction, including chromatin changes, prolonged promoter activity, and stabilization of the corresponding mRNAs. It is plausible that the targeted excision of retained introns, as demonstrated here for ANI treatment, further contributes to the superinduction of IEGs. Notably, superinduction is observed at very low doses of translation inhibitors, far below concentrations required for a strong inhibition of protein synthesis (Mahadevan and Edwards, 1991). These observations can now be conceptualized by the recent discovery that low doses of ribotoxins cause ribosome collisions, which trigger a cascade involving the ribosome-associated quality control pathway (Brandman and Hegde, 2016; D’Orazio and Green, 2021) as well as activation of p38 MAPK via the ribosome-associated kinase ZAK (Vind et al., 2020; Wu et al., 2020).
Our study connects the targeted excision of retained introns with the reorganization of NSs under conditions of ribotoxic stress. We found that ANI treatment causes enhanced recruitment of numerous splicing factors to NSs, including factors required for 5′ splice site recognition (the U1 snRNP components U1C, U1-70K, and U1A), 5′ splice site activation (TIAR), and 3′ splice site recognition (U2AF65; Figs. 1 and 2; and Figs. S2 and S3). Interestingly, factors involved in later steps of spliceosome assembly such as PRPF3 as part of the U4/U6 snRNP and PRP19 as part of the nineteen complex were already present in NSs under basal conditions, indicating that the recruitment of early factors of the splicing cycle is critical for activating the splicing of pre-mRNAs with retained introns. In line with this model, we observed a strong increase of phospho-T313-SF3B1, which is part of the U2 snRNP and a marker of catalytically active spliceosomes (Girard et al., 2012), at NSs early after ANI treatment (Fig. 7).
Notably, the nascent mRNA concentrated at the transcription foci of ZFP36 and FOS showed prominent colocalization with NSs after, but not before, induction of ribotoxic stress (Figs. 8 and 9), concomitant with the targeted excision of their retained introns (Fig. 6). These findings are well in line with the earliest description of NS-associated gene activation, where FOS mRNA was detected in close proximity to NSs in serum-stimulated cells (Huang and Spector, 1991). Since we also observed enhanced recruitment of elongating RNA polymerase II to NSs (Fig. 2, H and I), ribotoxic stress appears to activate NSs to become sites of IEG transcription and cotranscriptional splicing. This model should be further scrutinized as it contradicts the current concept that NSs, at least under normal conditions, are dedicated to the posttranscriptional splicing and processing of mRNAs (Galganski et al., 2017; Spector and Lamond, 2011).
Based on our results, one possibility is that IEGs relocalize to NSs upon ribotoxic stress and that NS reorganization facilitates the efficient cotranscriptional splicing of the synthesized pre-mRNAs. This model is consistent with a recent study demonstrating that the stress-induced transcription factor TP53 mediates enhanced relocalization of target genes such as CDKN1A (p21) to the vicinity of NSs and that NS association is important for inducing the expression of TP53 target genes (Alexander et al., 2021). Alternatively, IEGs may be organized in “transcription factories,” which recruit splicing-associated factors upon transcriptional induction and thereby assemble “active” NSs. Distinguishing these two models will require tracing of activated gene loci in live cells. Introducing key features of IEGs such as their promoters into reporter genes tailored to the analysis of pre-mRNA splicing at a single-molecule level (Coulon et al., 2014; Vargas et al., 2011) will help to assess more precisely the relationship between NSs, IEG transcription, and activation of co- or posttranscriptional splicing.
Regardless of the specific mechanism, p38 MAPK-dependent reorganization of NSs under stress conditions enlarges our view on the dynamic nature of this nuclear compartment, where stress-induced recruitment of splicing regulators and core spliceosomal components is connected to splicing activation of IEG pre-mRNAs that are poorly spliced under basal conditions. This adds an important dimension to our understanding of how poised genes are efficiently induced at multiple levels in response to stimulation.
Materials and methods
Cell culture and drug treatment
HeLa cells were maintained in Dulbecco’s modified Eagle’s medium (DMEM; Gibco) supplemented with 10% fetal bovine serum (FBS; Gibco), 2 mM L-glutamine (PAN-Biotech), 100 U/ml penicillin (PAN-Biotech), and 0.1 mg/ml streptomycin (PAN-Biotech). HeLa-TREx cell lines were maintained in DMEM supplemented with 10% tetracyclin-free FBS (Clontech), 2 mM L-glutamine, 100 U/ml penicillin, and 0.1 mg/ml streptomycin. For HeLa-TREx cells, 5 µg/ml blasticidin (Invitrogen) and 100 µg/ml zeocin (Invitrogen) were added to the medium to maintain expression of the Tet repressor and YFP-fused TIAR. All cells were cultured at 37°C in 5% CO2. ANI (Sigma-Aldrich) was used at 0.1 µg/ml, CHX (Roth) at 100 µg/ml, and HT (Sigma-Aldrich) at 2 µg/ml. SB202190, SB203580, and SP600125 (all Sigma-Aldrich) were used at 10 µM.
Plasmids and cloning
pEYFP-TIAR (p2181) was kindly provided by Nancy Kedersha and Paul Anderson (Harvard Medical School, Boston, MA, USA), it contains the human TIAR cDNA (TIAL1, short isoform, NM_003252.4) cloned into the BglII-EcoRI sites of plasmid pEYFP-C1 (Clontech). To generate plasmid pEYFP-TIARr (p3158), four silent point mutations were introduced into pEYFP-TIAR (p2181) by site-directed mutagenesis using primers G2845/G2846 and Quikchange II (Agilent Technologies) according to the manufacturer’s instructions, thereby rendering expression from this plasmid resistant to siRNA S62. For pcDNA4/TO-YFP-TIARr (p3380), YFP-TIARr was first amplified by PCR using primers G3288 and G3289, and cloned into the HindIII and EcoRI sites of plasmid pcDNA4/TO (p2430; Invitrogen). Primers used for cloning are listed in Table S4.
Stable cell line generation
To generate stable cell lines expressing siRNA-resistant TIAR fused to YRF, plasmid pcDNA4/TO-YFP-TIARr (p3380) was transfected into HeLa-TREx cells using Lipofectamine 2000 (Invitrogen) according to the manufacturer’s instructions. Transfected cells were reseeded into a 10-cm dish containing selection medium (10 µg/ml blasticidin, 200 µg/ml zeocin). The selection medium was changed every 3–4 d until colonies became visible. Cell colonies were isolated and expanded in antibiotic-free medium. Expression levels of YFP-TIARr and the percentage of YFP-TIARr-positive cells were determined by Western blot and IF analysis, respectively. Cells were FACS-sorted to maintain a high percentage of YFP-TIARr expressing cells, giving rise to the HeLa-TREx-YFP-TIARr clone #5F. The cells were subsequently cultured in DMEM supplemented with 10% tetracyclin-free FBS (Clontech Laboratories), 5 µg/ml blasticidin, and 100 µg/ml zeocin.
Antibodies
Goat anti-TIAR (C-18; sc-1749), goat anti-TIA1 (sc-1671), goat anti-eIF3B (eIF3eta; sc-16377), rabbit anti-p38 MAPK (sc-535), and mouse anti-G3BP (sc-81940) are from Santa Cruz; mouse anti-phospho-RPOL2A (Ser2; H5; ab24758), mouse anti-U1A (ab55751), rat anti-U1C (ab122901), rabbit anti-H3 (ab1791), rabbit anti-PRP19 (ab27692), rabbit anti-PRPF3 (ab187535), and rabbit anti-U2AF65 (ab37530) are from Abcam; rabbit anti-phospho-H3 (Ser10; #9701), rabbit anti-phospho-p38 MAPK (Thr180/Tyr182; #9211), and rabbit anti-phospho-SF3B1 (Thr313; #25009) are from Cell Signaling Technology; mouse anti-U1-70K (05-1588) and mouse anti-puromycin (MABE343) are from Millipore; mouse anti-SC35 (S4045), rabbit anti-SON (HPA031755), and rabbit anti-CASC3 (HPA050262) are from Sigma-Aldrich; and rabbit anti-Calnexin polyclonal antibody (ADI-SPA-860-F) is from Enzo.
Western blot analysis
Cells were washed with phosphate-buffered saline (PBS) followed by trypsinization. Cell pellets were then lysed at 4°C in RIPA buffer (50 mM Tris-HCl, pH 8.0, 0.5% Na-deoxycholate, 0.1% sodium dodecyl sulfate [SDS], 120 mM NaCl) and supplemented with protease inhibitors (Complete tablets; Roche) and phosphatase inhibitors (10 mM NaF, 100 nM okadic acid, 1 mM phenylmethylsulfonyl fluoride [PMSF], and 1 mM Na-vanadate). Cell lysates were vortexed and placed on ice for 15 min for complete homogenization. An equal volume of 2× SDS sample buffer (125 mM Tris-HCl, 20% glycerol, 4% SDS, and 10% 2-mercaptoethanol) was added to the lysates followed by incubation at 95°C for 10 min. Protein samples were resolved by SDS-polyacrylamide gel electrophoresis (PAGE) and blotted onto 0.2-µm pore size nitrocellulose membrane (Peqlab). Membranes were blocked in PBS containing 5% skimmed milk and incubated in PBS containing primary antibody (1:500–1:1,000 dilution) and 0.01% sodium azide at 4°C for 1 h with constant agitation. Membranes were washed three times with tris-buffered saline (TBS; 150 mM NaCl, 50 mM Tris-Cl, pH 7.5) containing 0.1% Tween 20 (TBST), incubated in HPR-coupled secondary antibody (Cat #sc-2357; Santa Cruz and Cat #705-035-003; 715-035-150; 711-035-152; Jackson ImmunoResearch) diluted 1:10,000 in TBST at room temperature for 30 min, and washed again three times with TBST. Western Lightning Plus-ECL Enhanced Luminol Reagent (Perkin Elmer) was used as chemiluminescence substrate, and signals were recorded using X-ray films or a ChemiDoc Touch Imaging System (Bio-Rad).
FACS and cell cycle analysis
Cells were washed with PBS, fixed with 2% paraformaldehyde (PFA; AppliChem) diluted in PBS at 37°C for 10 min, and permeabilized with 100% ice-cold ethanol. Cells were resuspended in PBS containing 4 µg/ml propidium iodide (PI; AppliChem) and 50 µg/ml RNase A (AppliChem) followed by an hour incubation at 37°C protected from light. Cell cycle distribution was analyzed using a FACSCanto II flow cytometer (BD Biosciences). Individual cell cycle stages were defined by manual gating according to the PI (DNA content) signals. For quantification of mitotic cells, cells were blocked with PBS containing 1% FBS and stained with p-H3 antibody (anti-phospho histone H3 [Ser10], Alexa Fluor 647 conjugate, Cat #06-570-AF647; Millipore) followed by PI staining and RNAse A treatment for 1 h. The p-H3-positive cell population was gated manually.
IF microscopy and RNA-FISH
10-mm coverslips (No. #1.5; Neolab) were placed in six-well plates and incubated in an antibiotic-free medium for 30 min prior to cell seeding. For fixation, cells were washed twice with PBS and fixed with ice-cold methanol at room temperature for 3 min. Cells were washed seven times with PBS after fixation to remove traces of methanol. For IF microscopy, cells were blocked in PBS containing 3% bovine serum albumin (Gibco) for 30 min and then incubated in PBS containing primary antibody (diluted at 1:250–1:1,000) overnight at 4°C with constant agitation. Coverslips were washed three times with PBS followed by incubation with PBS containing 1:10,000 diluted Cy2-, Cy3-, or Cy5-conjugated secondary antibodies (Cat #715-225-150, 711-225-152, 705-225-147, 712-225-153, 711-165-152, 715-165-150, 712-175-153; Jackson ImmunoResearch) and Hoechst 33342 dye (1 µg/ml) at room temperature for 30 min. After three washes with PBS, coverslips were mounted on glass microscope slides (Thermo Fisher Scientific) with Fluoromount G (Southern Biotech). Images were acquired at room temperature using 60× oil immersion objectives (numerical aperture: 1.3) on a Leica DM 5000 microscope with an Andor charge-coupled camera.
For RNA-FISH, CAL Fluor Red 610 amidite-conjugated probes recognizing FOS (Cat #VSMF-2133-5) and GAPDH (Cat #VSMF-2149-5) mRNA were purchased from LGC Biosearch Technologies. The probes recognizing ZFP36 and NR4A2 mRNA were custom-designed from LGC Biosearch Technologies, containing 30 distinct probes for ZFP36 and 48 for NR4A2. Hybridization was performed according to the Stellaris RNA-FISH protocol available on the company's webpage. In short, cells were fixed with 3.7% (vol/vol) formaldehyde in PBS for 10 min followed by two times washing with PBS. Cells were then permeabilized with 0.1% Triton X-100 in PBS for 5 min at room temperature followed by two times washing with PBS. Coverslips were transferred to a humidified chamber and incubated in dark with a hybridization buffer containing primary antibodies and fluorescent probes for 4 h. After two washes with commercial washing buffers, coverslips were incubated with fluorescent secondary antibodies and Hoechst 33342 dye, as for IF microscopy. Coverslips were mounted on glass microscope slides (Thermo Fisher Scientific) with Fluoromount G (Southern Biotech). Images were acquired at room temperature using 60× oil immersion objectives (numerical aperture: 1.3) on an Olympus IX83 microscope with a scientific CMOS (SCMOS) camera. Acquisition of images was done using the cellSens software (version 1.16) and the following filter settings: Hoechst 33342: excitation 387/11 HC (Semrock), beam splitter DA/FI/TR/Cy5-A-OMF (Semrock), and emission 440/40 HC (Semrock); AlexaFluor 488: excitation 485/20 HC (Semrock), beam splitter DA/FI/TR/Cy5-A-OMF (Semrock), and emission 525/30 HC (Semrock); AlexaFluor 568: 525/30 HC (Semrock), beam splitter DA/FI/TR/Cy5-A-OMF (Semrock), and emission 607/36 HC (Semrock).
siRNA transfection
siRNAs used in this study were purchased from Eurofins MWG Operon and directed against the following target sequences (sense strand): si-TIAR (S62; Mazan-Mamczarz et al., 2006), 5′-GGGCUAUUCAUUUGUCAGA-3′; si-TIAR (S70; Izquierdo et al., 2011), 5′-GUCCUUAUACUUCAGUUGU-3′; si-TIA1 (S63; López de Silanes et al., 2005), 5′-CGAUUUGGGAGGUAGUGAA-3′; si-TIA1/R (S71; Damgaard and Lykke-Andersen, 2011), 5′-UUCCAGAGAUGUGACAGAA-3′. In addition, si-control (S75) represents the AllStars control siRNA (Qiagen). All siRNAs were transfected at a final concentration of 50 nM using Lipofectamine RNAiMAX (Invitrogen) according to the manufacturer’s instructions.
RNA isolation and RT-qPCR
Total RNA was purified using the universal RNA purification kit (EURx) according to the manufacturer’s instructions. 2 µg of total RNA was reverse transcribed using MMLV reverse transcriptase (Promega) and random hexamers (Fermentas). Real-time quantitative PCR was performed using the QuantStudio 5 Real-Time PCR-System (Applied Biosystems) and PowerUp SYBR Green Master Mix (Applied Biosystems). Acquired CT values were calibrated based on the primer efficiency of individual primer sets. Primers used for RT-qPCR and the corresponding primer efficiency values are listed in Table S4.
RNA-Seq analysis
HeLa-TREx-YFP-TIARr cells (clone #5F) were transfected with si-control (S75), si-TIA1 (S63), or si-TIAR (S62) siRNAs for 48 h. Cells were treated with either DMSO, ANI, or SB202190 (SB) + ANI for 1.5 h (whereby SB was added 1 h prior to ANI treatment). Total RNA was purified with the GeneMATRIX universal RNA purification kit (EURx), including a DNase (Promega) on-column digestion step. 350 ng of total RNA, as quantified by Qubit (Invitrogen), was used for subsequent RNA-Seq. Ribosomal RNA was depleted with the Ribo Zero Human Gold Kit (Illumina), and libraries were prepared using the TruSeq Directional RNA LT Preparation Kit (Illumina). To obtain reads from pre-mRNA, we omitted the mRNA (oligo dT) enrichment step. 1 µl of 1/100 diluted set 1 ERCC RNA spike-ins (Invitrogen) were added to each sample before library preparation. Library preparation and paired-end sequencing of 80-nt long reads were performed by the CellNetworks Deep Sequencing Core Facility at Heidelberg University using a NextSeq 500-System (Illumina). Sequencing results were mapped to the Human RefSeq genome GRCh38.p10 using STAR v2.4.2a; GENCODE V27 was used for gene annotation. Sequencing data are available in the GEO database under the accession number GSE231521.
To identify differentially expressed genes, including long non-coding RNA genes, sequencing results were subject to DESeq2 (Love et al., 2014). Genes with low expression levels (exon base mean <100), small expression differences (log2 fold change [FC] <1), and large variations (Benjamini-Hochberg test, Padj <0.1) were removed from further analysis. To identify p38 MAPK-dependent changes in gene expression, we compared the ANI versus DMSO and the ANI versus SB+ANI datasets. Genes whose expression changes in both datasets in the same direction (log2FC [ANI versus DMSO] × log2FC [ANI versus SB+ANI] >0) and to a similar degree (Abs [log2FC (ANI versus DMSO) − log2FC (ANI versus SB+ANI)] <0.7 × Abs [log2FC (ANI versus DMSO)]) were defined as differentially expressed in a p38 MAPK-dependent manner.
Splicing efficiency analysis
For alternative splicing analysis, sequencing results were subject to DEXseq (Anders et al., 2012). Spike-ins and annotations with low read numbers (exon base mean <100) and large variations (Benjamini-Hochberg test, Padj >0.1) were removed from further analysis. To calculate intron and exon coverage, we computed the average coverage as the ratio of the read number divided by the region length. For this analysis, only genes with a sum of >1,000 intronic reads across all libraries were considered. To assess the splicing efficiency of individual genes, read numbers acquired from DEXSeq analysis were first transformed to transcript per million reads (TPM) by normalizing to the fragment length and the library size. Normalized TPMs were then categorized into exonic or intronic, and ambiguous annotations mapping to introns or exons in different transcript isoforms or different genes were removed from further analysis. Exonic and intronic TPMs annotated to the same gene were summed up, and the resulting values were used to calculate the ratio between exons and introns. The exon/intron ratio was then taken as the splicing efficiency, and log2 fold changes in splicing efficiency between different datasets (DMSO, ANI, and SB+ANI) were calculated. Genes whose fold change in splicing efficiency exceeds 2 (log2FC >1), show the same directionality (log2FC [ANI versus DMSO] × log2FC [ANI versus SB+ANI] >0), and occur to a similar degree (Abs [log2FC (ANI versus DMSO) − log2FC (ANI versus SB+ANI)] <0.6 × Abs [log2FC (ANI versus DMSO)]) were defined as genes with p38 MAPK-dependent changes in splicing efficiency.
As an alternative approach to assessing splicing efficiency, the ratio of exon–exon junction read to exon–intron boundary read counts was measured. The number of reads supporting each exon–exon junction was determined with the -J option of featureCounts (Liao et al., 2014). The number of reads covering exon–intron boundaries was determined only for unambiguous boundaries (i.e., boundaries that are present in all isoforms of a gene to avoid contamination by intronic or exonic reads). It should be noted that genes with strong alternative splicing are therefore lost from the analysis. Only boundaries one or two nucleotides apart in different isoforms were tolerated (as is the case for ZFP36). Reads that overlap boundaries by at least 5 nt on each side were counted using the R package GenomicFeatures (Lawrence et al., 2013) and featureCounts (Liao et al., 2014). Genes with a sum of >120 boundary and junction reads in all samples were considered. The average number of reads covering each exon–exon junction was divided by the average number of reads covering each exon–intron boundary.
Analysis of splicing efficiencies within nascent and pre-existing RNA
To distinguish the effect of ANI treatment on splicing efficiencies of pre-existing and nascent mRNA, HeLa cells were incubated with 4sU (200 µM) for 2 h in parallel to ANI treatment (0.1 µg/ml) or during the last 30 min of ANI treatment. RNA was extracted with the GeneMatrix universal RNA purification kit (Roboklon) and rRNA was depleted with the NEBNext rRNA Depletion Kit (E6350L; NEB). To enhance the efficiency of 4sU-to-C conversion, RNA was fragmented to an average length of ∼200 nt by alkaline hydrolysis at pH 10.0 for 7 min at 95°C. Conversion of 4sU to C was induced by treatment with 10 mM NaIO4 in 600 mM NH4Cl (pH 8.5) for 15 min at 40°C as described previously for ribosome-protected fragments (Schott et al., 2021). Sequencing libraries were prepared with the NEBnext Ultra II Directional RNA Library Prep Kit (omitting the fragmentation step of the manufacturer’s protocol) and sequenced single-end on a NextSeq550 device (Illumina). The 30-min and 2-h time point libraries were sequenced to a length of 150 and 80 nt, respectively, to account for the lower 4sU incorporation rate after 30 min of 4sU treatment.
Reads were mapped with STAR v2.5.3a (Dobin et al., 2013), a reference of the human genome (hg38), providing the basic set of Gencode V27 for transcript annotation, allowing up to 10 mismatches for 150-nt long reads and 5 mismatches for 80-nt long reads. Potential T-to-C single nucleotide polymorphisms (SNPs) were determined from the RNA-Seq data of the four replicates from non-labeled cells in Fig. 3, using samtools mpileup (Danecek et al., 2021). Positions with at least five T-to-C mismatches affecting at least 20% of the reads that cover this position were considered putative T-to-C SNPs, and alignments overlapping these positions were removed. To identify reads originating from mature mRNA, only reads were retained that contain “N” in the CIGAR string. These reads were assigned to genes (Gencode V27) using featureCounts of the subread package v1.6.3 (Liao et al., 2014). Their read IDs and matching annotations were extracted using the -R option of featureCounts. Likewise, intronic reads were identified as alignments that are entirely contained within purely intronic regions. The number of T-to-C transitions depending on the number of Ts in the reference was determined with an in-house developed Perl script, separately for spliced and intronic reads. The proportion of nascent reads, the probability of a T-to-C transition within nascent reads, and the background probability of such transitions within non-nascent reads were estimated using a binomial mixture model (Jürges et al., 2018). The proportion of nascent reads within intronic or spliced reads was then used to reconstruct the proportion of intronic or spliced reads within nascent or pre-existing reads.
Transcriptional shut-off and RNA half-life measurements
Exon/intron ratios were determined from the same experiment using featureCounts (Liao et al., 2014) to summarize, at the gene level, reads that are fully contained within purely exonic or intronic regions of the gene.
Statistical procedures
Statistical testing was performed with R. For comparing percentages in experiments with a binary outcome, we performed beta regression using the R package betareg (Cribari-Neto and Zeileis, 2010). When at least one sample displayed a count of zero, we transformed all the counts of the experiments using the equation (y · (n − 1) + 0.5)/n, as suggested by Smithson and Verkuilen (2006).
Online supplemental material
Fig. S1 shows additional effects of ribotoxins on mitotic entry and NSs. Fig. S2 provides additional micrographs on the localization of TIAR in SGs and NSs, and documents TIAR expression levels upon ANI treatment. Fig. S3 shows micrographs on the localization of different splicing-associated factors upon ANI treatment. Fig. S4 shows RNA-Seq read coverage along the tracks of different IEGs. Fig. S5 shows the splicing efficiency of three IEGs by oligo-dT-primed RT-qPCR analysis and subcellular localization of IEG mRNAs by RNA-FISH. Table S1 shows the number of intronic and exonic annotations altered upon ANI treatment. Table S2 shows all genes with ANI-induced, p38 MAPK-dependent changes in splicing efficiency and/or mRNA level. Table S3 shows all genes with ANI-induced, p38 MAPK-dependent changes in splicing efficiency and mRNA level. Table S4 describes all primers used in the study. Table S5 provides cell counts of IF microscopy analyses.
Data availability
Sequencing data was submitted to GEO and is available under the accession number GSE231521. Custom code developed for the analysis of splicing efficiencies within nascent or pre-existing RNA is available in our GitHub repository: https://github.com/johannaschott/NascentPerFeature_Sung_et_al.
Acknowledgments
We would like to thank Nancy Kedersha and Paul Anderson (both Harvard Medical School, Boston, MA, USA) for sharing plasmids and antibodies, Holger Lorenz from the ZMBH imaging core facility for assistance with microscopy and providing macros for IF quantification, Monika Langlotz from the ZMBH FACS facility as well as Karen Bieback and Stefanie Uhlig from the FlowCore facility at the Medical Faculty Mannheim of Heidelberg University for help with flow cytometry, the NGS Core Facility at the Institute of Clinical Chemistry of the Medical Faculty Mannheim as well as David Ibberson from the Deep Sequencing Core Facility at BioQuant (Heidelberg University) for library preparation and RNA sequencing, and Gijsbert Jacob Christiaan van Belle from the Institute of Cardiovascular Physiology at the Universitätsmedizin Göttingen for help with IF microscopy.
This work was supported by a doctoral fellowship from the Heidelberg Biosciences International Graduate School to H.-M. Sung, a postdoctoral fellowship from Vrije Universiteit Brussel (SRP34) to J. Messens, grants TRR 186 and TRR 319 from the Deutsche Forschungsgemeinschaft (DFG) to G. Stoecklin; grant GRK 2727 from the DFG to J. Schott and G. Stoecklin; grant SFB 1190 from the DFG to I. Bogeski; grant SPP 1935 from the DFG to U. Ohler and G. Stoecklin; and by funds from the German national bioinformatics infrastructure (BMBF de.NBI, RNA bioinformatics center) to P. Boss and U. Ohler.
Author contributions: H.-M. Sung made the key findings and performed most experiments. H.-M. Sung, J. Schott, and G. Stoecklin designed the study, analyzed the data, and wrote the manuscript. J. Schott and P. Boss performed bioinformatics analysis of RNA sequencing data. J.A. Lehmann, M. Hardt, and D. Lindner carried out RNA labeling and decay experiments. U. Ohler, J. Messens, and I. Bogeski provided resources, input for data analysis and suggestions on manuscript writing.

