


The intricate neuronal wiring during development requires cytoskeletal reorganization orchestrated by signaling cues. Because cytoskeletal remodeling is a hallmark of cell migration, we investigated whether metastatic cancer cells exploit axon guidance proteins to migrate. Indeed, in breast cancer patients, we found a significant correlation between mesenchymal markers and the expression of dihydropyrimidinase-like 2 (DPYSL2), a regulator of cytoskeletal dynamics in growing axons. Strikingly, DPYSL2 knockout in mesenchymal-like breast cancer cells profoundly inhibited cell migration, invasion, stemness features, tumor growth rate, and metastasis. Next, we decoded the molecular mechanism underlying this phenomenon and revealed an interaction between DPYSL2 and Janus kinase 1 (JAK1). This binding is crucial for activating signal transducer and activator of transcription 3 (STAT3) and the subsequent expression of vimentin, the promigratory intermediate filament. These findings identify DPYSL2 as a molecular link between oncogenic signaling pathways and cytoskeletal reorganization in migrating breast cancer cells.
Introduction
Cell migration is a tightly regulated process implicated in diverse pivotal physiological and pathological conditions such as development and metastasis (Seetharaman and Etienne-Manneville, 2020). To traverse a substantial distance, the metastatic cancer cells undergo profound alterations in cellular characteristics (Brabletz et al., 2021), proposed to be induced by the epithelial–mesenchymal transition (EMT) program (Yang et al., 2020). By responding to extracellular cues such as interleukin 6 (IL-6; Dongre and Weinberg, 2019), this program triggers cytoskeletal remodeling, which enhances migratory and invasive capabilities (Williams et al., 2019). Overall, since cytoskeletal reorganization is an essential event toward a more aggressive state, understanding its dynamics may reveal new regulators of tumor progression.
Another cellular system that requires steering to distal targets in response to environmental signals is axon guidance (Seiradake et al., 2016). In this process, the growing tip of the axon responds to attractive and repulsive signals via a set of specific receptors, such as the roundabout guidance receptor (ROBO) family (Tong et al., 2019) and neuropilins (NRP; Raimondi and Ruhrberg, 2013) which interact with the slit guidance ligand (SLIT; Pasterkamp and Kolodkin, 2013) and the semaphorins (Jongbloets and Pasterkamp, 2014), respectively. Furthermore, upon binding to their ligands, these receptors induce structural rearrangements in the highly dynamic axonal growth cone (Dent et al., 2011) by activating downstream cytoskeletal modulators such as the collapsin response mediator protein (CRMP) family (Moutal et al., 2019). Altogether, in both cancer cells and neural development, the cells’ ability to migrate is achieved by orchestrating the cytoskeletal remodeling accurately.
The striking similarities between axon guidance and cancer cell migration prompted us to systematically analyze their expression in tumors. We found that the axon guidance protein dihydropyrimidinase-like 2 (DPYSL2, also known as CRMP2) is highly expressed in mesenchymal-like breast cancer cells and plays a critical role in their migration. Furthermore, we revealed that this protein binds to the signaling molecule Janus kinase 1 (JAK1), a crucial interaction for activating the downstream transcription factor signal transducer and activator of transcription 3 (STAT3; Siersbæk et al., 2020). Subsequently, STAT3 induces the expression of the intermediate filament, vimentin (Wang et al., 2018), an established EMT marker (Mendez et al., 2010), and a critical regulator of cancer cell migration (Strouhalova et al., 2020; Leduc and Etienne-Manneville, 2015). Thus, we identified DPYSL2/JAK1/STAT3/vimentin as a central axis in breast cancer cell migration, which may serve as a potential biomarker and therapeutic target for breast cancer metastasis.
Results
DPYSL2 expression correlates with mesenchymal markers
We sought to identify the axon guidance molecules that are differentially expressed in mesenchymal and epithelial cancer samples. Previously, we segregated the cancer cell lines of the MERAV database (http://merav.wi.mit.edu/; Shaul et al., 2016) into epithelial and mesenchymal groups according to their transcriptomes (Shaul et al., 2014). Here, we analyzed these two groups for their expression of 126 axon guidance genes, as identified by the Kyoto Encyclopedia of Genes and Genomes (KEGG) database (https://www.genome.jp/dbget-bin/www_bget?pathway:hsa04360; Kanehisa et al., 2002, 2012; KEGG ID: hsa04360). As a result, we found 10 axon guidance genes that were significantly upregulated (mesenchymal-up) and five downregulated (mesenchymal-down) in mesenchymal cell lines (Fig. S1 A). The upregulated set included genes known to participate in cancer cell aggressiveness, including SLIT2, ROBO1 (Tseng et al., 2010), NRP1 (Luo et al., 2016), FYN proto-oncogene (FYN; Xie et al., 2016), and cofilin 2 (CFL2; Collazo et al., 2014), supporting our bioinformatics analysis. Furthermore, since DPYSL2 exhibited the highest expression level in mesenchymal cells, and its function in cancer is not yet established, we decided to characterize its contribution to cancer cell migration (Fig. 1, A and B).
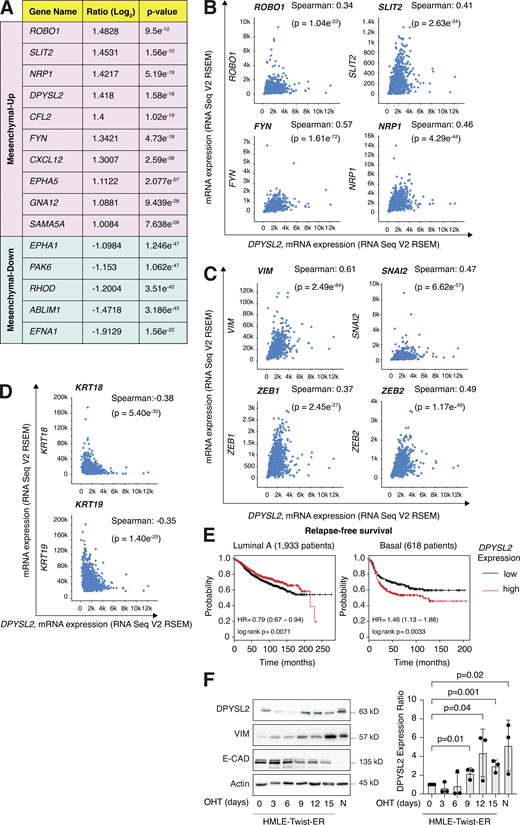
DPYSL2 expression is elevated in mesenchymal-like cells. (A) A table representing the expression ratio and the P values of the selected axon guidance genes between epithelial and mesenchymal cell lines. The ratio was determined by comparing the mean expression of the selected genes (log2) in mesenchymal cells to their expression in epithelial cells. Mesenchymal up, genes upregulated in the mesenchymal cell lines (cutoff ratio of log2 > 1); mesenchymal down, genes downregulated in the mesenchymal cell lines (cutoff ratio of log2 < −1). The P values were determined by Student’s t test. All data were obtained from the MERAV web-based tool. (B) DPYSL2 expression correlates with axon guidance genes in breast cancer. Patients’ gene expression data were generated by the TCGA project (study name: Breast Invasive Carcinoma, TCGA, Cell 2015) and analyzed using the cBioportal webtool (https://www.cbioportal.org). DPYSL2 expression positively and significantly correlated with axon guidance genes (ROBO1, SLIT2, FYN, and NRP1). The Pearson’s and Spearman’s correlation coefficients and P value were calculated by the analysis tool. (C) DPYSL2 expression positively and significantly correlated with known mesenchymal markers (VIM, SNAI2, ZEB1, and ZEB2). The data sets and the analyses were conducted as in B. (D) DPYSL2 expression negatively and significantly correlated with known epithelial markers (KRT18 and KRT19). The data sets and the analyses were conducted as in B. (E)DPYSL2 expression is associated with poor relapse-free survival in basal cancers. Kaplan–Meier survival plots for patients with breast cancer were divided into high DPYSL2 expression (red) and low (black). The numbers in parentheses indicate the total number of patients. These plots were generated by the Kaplan–Meier plotter website. The DPYSL2 (200762_at Affymetrix ID symbol) was used for all the analyses. The P value (p) and HR were determined by the analysis tool. (F) DPYSL2 expression is upregulated during the EMT program. HMLE-Twist-ER cells were treated with OHT to induce EMT for a total of 15 d. Left: Every 3 d, cells were collected, lysed, and subjected to immunoblotting using the indicated antibodies. Right: Quantification of the DPYSL2 immunoblots relative to day 0. Each bar represents the value ± SD for n = 3. The P values were determined by Student’s t test. N- (NAMEC), an HMLE-derived cell line that spontaneously acquired the mesenchymal state. Source data are available for this figure: SourceData FS1.
DPYSL2 expression is elevated in mesenchymal-like cells. (A) A table representing the expression ratio and the P values of the selected axon guidance genes between epithelial and mesenchymal cell lines. The ratio was determined by comparing the mean expression of the selected genes (log2) in mesenchymal cells to their expression in epithelial cells. Mesenchymal up, genes upregulated in the mesenchymal cell lines (cutoff ratio of log2 > 1); mesenchymal down, genes downregulated in the mesenchymal cell lines (cutoff ratio of log2 < −1). The P values were determined by Student’s t test. All data were obtained from the MERAV web-based tool. (B) DPYSL2 expression correlates with axon guidance genes in breast cancer. Patients’ gene expression data were generated by the TCGA project (study name: Breast Invasive Carcinoma, TCGA, Cell 2015) and analyzed using the cBioportal webtool (https://www.cbioportal.org). DPYSL2 expression positively and significantly correlated with axon guidance genes (ROBO1, SLIT2, FYN, and NRP1). The Pearson’s and Spearman’s correlation coefficients and P value were calculated by the analysis tool. (C) DPYSL2 expression positively and significantly correlated with known mesenchymal markers (VIM, SNAI2, ZEB1, and ZEB2). The data sets and the analyses were conducted as in B. (D) DPYSL2 expression negatively and significantly correlated with known epithelial markers (KRT18 and KRT19). The data sets and the analyses were conducted as in B. (E)DPYSL2 expression is associated with poor relapse-free survival in basal cancers. Kaplan–Meier survival plots for patients with breast cancer were divided into high DPYSL2 expression (red) and low (black). The numbers in parentheses indicate the total number of patients. These plots were generated by the Kaplan–Meier plotter website. The DPYSL2 (200762_at Affymetrix ID symbol) was used for all the analyses. The P value (p) and HR were determined by the analysis tool. (F) DPYSL2 expression is upregulated during the EMT program. HMLE-Twist-ER cells were treated with OHT to induce EMT for a total of 15 d. Left: Every 3 d, cells were collected, lysed, and subjected to immunoblotting using the indicated antibodies. Right: Quantification of the DPYSL2 immunoblots relative to day 0. Each bar represents the value ± SD for n = 3. The P values were determined by Student’s t test. N- (NAMEC), an HMLE-derived cell line that spontaneously acquired the mesenchymal state. Source data are available for this figure: SourceData FS1.
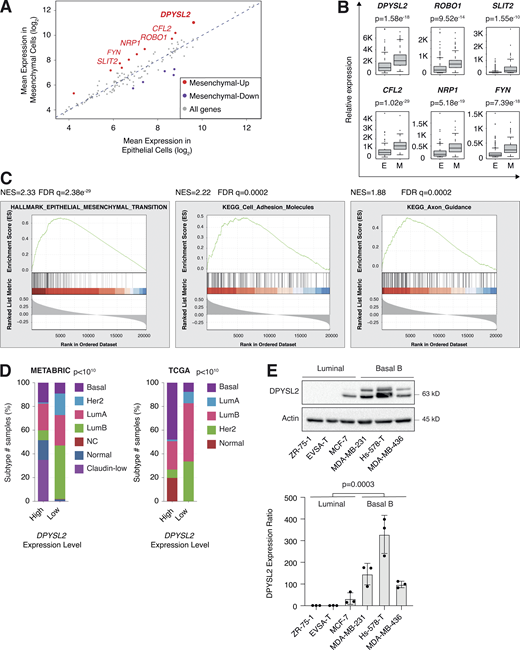
DPYSL2 expression is elevated in mesenchymal-like cells. (A) Several axon guidance genes demonstrated elevated expression in mesenchymal cells. Cancer cell lines were divided into epithelial (n = 378 cell lines) and mesenchymal (n = 150 cell lines) groups based on the expression of known mesenchymal markers. The mean expression of the 126 axon guidance genes was compared between groups. Mesenchymal-up, genes (red) upregulated in the mesenchymal cell lines (cutoff ratio log2 > 1); mesenchymal-down, genes (purple) downregulated in the mesenchymal cell lines (cutoff ratio log2 < −1). (B) Expression levels of selected mesenchymal-up axon guidance genes in mesenchymal cell lines. Box plots represent the actual expression levels of the indicated genes in each group (as determined in A). The P value was determined by Student’s t test. E, epithelial cell lines; M, mesenchymal cell lines. (C)DPYSL2 expression in breast cancer patients correlates with the hallmark of EMT, cell adhesion molecules, and axon guidance. Breast cancer patients’ gene expression data were generated by the TCGA (PanCancer Atlas project) and analyzed using the cBioportal webtool (https://www.cbioportal.org). In these samples, the expression of DPYSL2 was compared to the whole transcriptome (∼20,000 genes). The genes were then ranked based on the obtained Spearman correlation coefficient and subjected to GSEA. The GSEA software computed the normalized enrichment score (NES) and FDR values. (D)DPYSL2 expression is elevated in the aggressive breast cancer subtypes. Breast cancer samples were divided into two groups based on high and low DPYSL2 expression (1 SD above or below the mean). For each group, the percentage of breast cancer subtypes is color coded. The breast cancer data were obtained from the METABRIC (left) or the TCGA (PanCancer Atlas project; right) databases, and the P values were calculated by the cBioportal. Lum, luminal. (E) The DPYSL2 protein level is upregulated in mesenchymal breast cancer cell lines. Top: Cells were lysed and subjected to immunoblotting using the indicated antibodies. Bottom: Quantification of DPYSL2 expression ratio relative to ZR-75-1. Each bar represents the value ± SD for n = 3. The P value was determined by Student’s t test. Source data are available for this figure: SourceData F1.
DPYSL2 expression is elevated in mesenchymal-like cells. (A) Several axon guidance genes demonstrated elevated expression in mesenchymal cells. Cancer cell lines were divided into epithelial (n = 378 cell lines) and mesenchymal (n = 150 cell lines) groups based on the expression of known mesenchymal markers. The mean expression of the 126 axon guidance genes was compared between groups. Mesenchymal-up, genes (red) upregulated in the mesenchymal cell lines (cutoff ratio log2 > 1); mesenchymal-down, genes (purple) downregulated in the mesenchymal cell lines (cutoff ratio log2 < −1). (B) Expression levels of selected mesenchymal-up axon guidance genes in mesenchymal cell lines. Box plots represent the actual expression levels of the indicated genes in each group (as determined in A). The P value was determined by Student’s t test. E, epithelial cell lines; M, mesenchymal cell lines. (C)DPYSL2 expression in breast cancer patients correlates with the hallmark of EMT, cell adhesion molecules, and axon guidance. Breast cancer patients’ gene expression data were generated by the TCGA (PanCancer Atlas project) and analyzed using the cBioportal webtool (https://www.cbioportal.org). In these samples, the expression of DPYSL2 was compared to the whole transcriptome (∼20,000 genes). The genes were then ranked based on the obtained Spearman correlation coefficient and subjected to GSEA. The GSEA software computed the normalized enrichment score (NES) and FDR values. (D)DPYSL2 expression is elevated in the aggressive breast cancer subtypes. Breast cancer samples were divided into two groups based on high and low DPYSL2 expression (1 SD above or below the mean). For each group, the percentage of breast cancer subtypes is color coded. The breast cancer data were obtained from the METABRIC (left) or the TCGA (PanCancer Atlas project; right) databases, and the P values were calculated by the cBioportal. Lum, luminal. (E) The DPYSL2 protein level is upregulated in mesenchymal breast cancer cell lines. Top: Cells were lysed and subjected to immunoblotting using the indicated antibodies. Bottom: Quantification of DPYSL2 expression ratio relative to ZR-75-1. Each bar represents the value ± SD for n = 3. The P value was determined by Student’s t test. Source data are available for this figure: SourceData F1.
We then assessed the DPYSL2 expression profile in patient-derived breast cancer samples. Therefore, we analyzed the cancer genome atlas data (study name: Breast Invasive Carcinoma, TCGA; Ciriello et al., 2015) available on cBioportal (https://www.cbioportal.org; Gao et al., 2013; Cerami et al., 2012). Specifically, we determined Spearman’s correlation coefficient of DPYSL2 mRNA expression to the whole transcriptome (∼20,000 genes). Then, we ranked the genes based on their Spearman’s correlation coefficient and subjected them to gene set enrichment analyses (GSEA; Subramanian et al., 2005). These analyses revealed that DPYSL2 expression significantly correlated with the hallmark of EMT, cell adhesion molecules, and axon guidance gene set (Fig. 1 C). We detected a significant correlation between DPYSL2 expression and the axon guidance molecules ROBO, SLIT2, FYN, and NRP1 in breast cancer samples (Fig. S1 B). Moreover, DPYSL2 also significantly correlated with the EMT markers (snail family transcriptional repressor 2 [SNAI2], zinc finger E-box binding homeobox 1 and 2 [ZEB1, ZEB2], and vimentin [VIM]), while the latter demonstrated the highest Spearman’s correlation coefficient (0.61; Fig. S1 C). In contrast, DPYSL2 expression anticorrelated significantly with the epithelial markers keratin 18 (KRT18) and keratin 19 (KRT19; Thiery and Lim, 2013; Fig. S1 D). Furthermore, by analyzing both the METABRIC (study name: Breast Cancer METABRIC; Curtis et al., 2012) and TCGA (study name: Breast Invasive Carcinoma; Hoadley et al., 2018) datasets, we found that samples highly expressing DPYSL2 (DPYSL2-high) are significantly enriched with high-grade breast cancer subtypes (basal and claudin-low) in comparison to DPYSL2-low samples (Fig. 1 D). Additionally, using the Kaplan–Meier Plotter tool (http://kmplot.com/analysis/; Wang et al., 2010), we identified a significant association between high DPYSL2 expression levels and poor relapse-free survival rate (Györffy et al., 2010) in the basal samples (Fig. S1 E). Interestingly, this adverse clinical outcome associated with high DPYSL2 expression was more severe in patients with basal subtypes (hazard ratio [HR] = 1.46) than in those with low-grade subtypes (luminal A; HR = 0.79). Together, these findings reveal that DPYSL2 expression correlates with high-grade subtypes in patients and cancer cell lines.
Next, we assessed DPYSL2 protein levels in various breast cancer–derived cell lines. We found a significant elevation in DPYSL2 expression in mesenchymal-like (basal B) cell lines relative to epithelial (luminal; Fig. 1 E). Additionally, we used the established human mammary epithelial cell line (HMLE)–based model to induce the EMT program. In this system, the cells ectopically express twist family BHLH transcription factor 1 (Twist1), conjugated to the estrogen receptor (HMLE-Twist-ER). Upon 4-hydroxytamoxifen (OHT) treatment, the Twist-ER translocates into the nucleus and expresses EMT-related genes (Shaul et al., 2014; Mani et al., 2008). Indeed, this treatment significantly promoted DPYSL2 expression, which correlated with the mesenchymal marker, vimentin, and anticorrelated with the epithelial marker, E-cadherin (Fig. S1 F). Moreover, DPYSL2 expression was also elevated in the naturally arising mesenchymal cells (NAMECs), an HMLE-derived cell line that spontaneously acquired the mesenchymal state (Tam et al., 2013). Altogether, this indicates that the EMT program regulates DPYSL2 expression, implying its role in breast cancer aggressiveness.
DPYSL2 is a potent regulator of breast cancer aggressiveness
To further demonstrate the contribution of DPYSL2 to cancer aggressiveness, we knocked out DPYSL2 from the basal B breast cancer cell line, MDA-MB-231 (DPYSL2-KO), using the CRISPR-Cas9 system (Figs. 2 A and S2 A). Then we subjected the wild-type (DPYSL2-WT) and knockout (KO) cells to a comparative CEL-seq analysis (Hashimshony et al., 2016; Table S1), which identified a set of genes that demonstrated a significant differential expression attributed to DPYSL2 loss (significantly changed gene; Fig. S2 B). To systematically determine the biological role of these genes, we exclusively selected those that exhibited at least a fourfold change and segregated them into two groups, significantly upregulated genes (log2 ≥ 2) and significantly downregulated genes (log2 ≤ −2). Finally, we subjected these two groups to function and pathway enrichment analyses using the Metascape webtool (https://metascape.org/; Zhou et al., 2019; Figs. 2 B and S2 C). Interestingly, we found that the significantly downregulated gene group in the DPYSL2-KO cells is associated with migration and cellular signaling (Fig. 2 B).
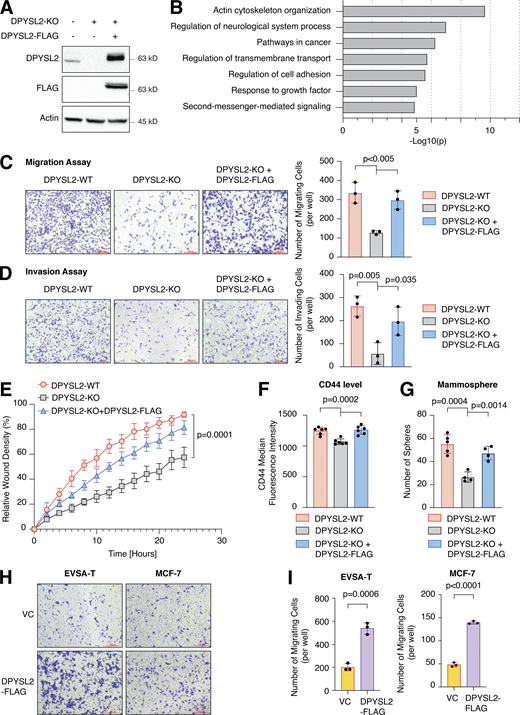
DPYSL2 is a potent regulator of breast cancer aggressiveness. (A) Immunoblots representing DPYSL2-KO in MDA-MB-231. DPYSL2 KO was generated using the CRISPR-Cas9 system, followed by separating the cells into single clones. FLAG-tagged DPYSL2 (DPYSL2-FLAG) was reintroduced into DPYSL2-KO cells. Cells were lysed and subjected to immunoblotting using the indicated antibodies. (B) DPYSL2 loss affects the expression of actin organization and cellular signaling genes. Both WT and DPYSL2-KO cells were subjected to a comparative CEL-seq analysis, and the expression level of each gene was analyzed in the two samples. The set of genes that demonstrated a significant reduction upon DPYSL2 loss was further subjected to Metascape analysis. Topic-related pathways and their P values are presented. The P values were computed by the website. (C) DPYSL2 loss inhibits the migration of breast cancer cells. The migratory capability of the different samples was determined in a Transwell assay. Left: Representative images of each sample. Scale bar, 100 µm. Right: Quantification of data is reported as the number of migrating cells per 20,000 seeded cells; each bar represents the mean ± SD for n = 3. The P value was determined by Student’s t test. (D) DPYSL2 overexpression rescues the DPYSL2-KO effect on cell invasiveness. MDA-MB-231 cells were infected and treated as in C, and the number of the Matrigel-invading cells was measured. Left: Representative images of each sample. Scale bar, 100 µm. Right: Quantification of data is reported as the number of invading cells per 20,000 seeded cells; each bar represents the mean ± SD for n = 3. The P value was determined by Student’s t test. (E) Real-time quantification of relative wound density for the indicated WT, DPYSL2-KO, and DPYSL2-KO + DPYSL2-FLAG cells. The cells were monitored for the indicated time. Each bar represents the mean ± SD for n = 8. The P value was determined by Student’s t test. (F) Loss of DPYSL2 reduces CD44 extracellular expression. The different indicated samples were subjected to FACS analysis to measure the expression level of the cell-surface marker, CD44. The plot represents CD44 median fluorescence intensity values. Each bar represents the mean ± SD for n = 6. The P value was determined by Student’s t test. (G) DPYSL2 overexpression rescues mammosphere-forming ability in DPYSL2-KO cells. A quantification of in vitro mammosphere formation by cells from the different samples was performed. The data were reported as the number of mammospheres formed per 800 seeded cells; each bar represents the mean ± SD for n = 4. The P value was determined by Student’s t test. (H) DPYSL2 overexpression promotes cell migration in the epithelial cell lines, EVSA-T and MCF-7. The migratory capability of the corresponding samples was determined in a Transwell assay. The cells were seeded (50,000 for EVSA-T and 30,000 for MCF-7), then fixed and stained after 24 h of incubation. VC, vector control. Scale bar, 100 µm. (I) Quantification of the images reported in H; each bar represents the mean ± SD for n = 3. The P value was determined by Student’s t test. Right: Representative images of each sample. VC, vector control. Source data are available for this figure: SourceData F2.
DPYSL2 is a potent regulator of breast cancer aggressiveness. (A) Immunoblots representing DPYSL2-KO in MDA-MB-231. DPYSL2 KO was generated using the CRISPR-Cas9 system, followed by separating the cells into single clones. FLAG-tagged DPYSL2 (DPYSL2-FLAG) was reintroduced into DPYSL2-KO cells. Cells were lysed and subjected to immunoblotting using the indicated antibodies. (B) DPYSL2 loss affects the expression of actin organization and cellular signaling genes. Both WT and DPYSL2-KO cells were subjected to a comparative CEL-seq analysis, and the expression level of each gene was analyzed in the two samples. The set of genes that demonstrated a significant reduction upon DPYSL2 loss was further subjected to Metascape analysis. Topic-related pathways and their P values are presented. The P values were computed by the website. (C) DPYSL2 loss inhibits the migration of breast cancer cells. The migratory capability of the different samples was determined in a Transwell assay. Left: Representative images of each sample. Scale bar, 100 µm. Right: Quantification of data is reported as the number of migrating cells per 20,000 seeded cells; each bar represents the mean ± SD for n = 3. The P value was determined by Student’s t test. (D) DPYSL2 overexpression rescues the DPYSL2-KO effect on cell invasiveness. MDA-MB-231 cells were infected and treated as in C, and the number of the Matrigel-invading cells was measured. Left: Representative images of each sample. Scale bar, 100 µm. Right: Quantification of data is reported as the number of invading cells per 20,000 seeded cells; each bar represents the mean ± SD for n = 3. The P value was determined by Student’s t test. (E) Real-time quantification of relative wound density for the indicated WT, DPYSL2-KO, and DPYSL2-KO + DPYSL2-FLAG cells. The cells were monitored for the indicated time. Each bar represents the mean ± SD for n = 8. The P value was determined by Student’s t test. (F) Loss of DPYSL2 reduces CD44 extracellular expression. The different indicated samples were subjected to FACS analysis to measure the expression level of the cell-surface marker, CD44. The plot represents CD44 median fluorescence intensity values. Each bar represents the mean ± SD for n = 6. The P value was determined by Student’s t test. (G) DPYSL2 overexpression rescues mammosphere-forming ability in DPYSL2-KO cells. A quantification of in vitro mammosphere formation by cells from the different samples was performed. The data were reported as the number of mammospheres formed per 800 seeded cells; each bar represents the mean ± SD for n = 4. The P value was determined by Student’s t test. (H) DPYSL2 overexpression promotes cell migration in the epithelial cell lines, EVSA-T and MCF-7. The migratory capability of the corresponding samples was determined in a Transwell assay. The cells were seeded (50,000 for EVSA-T and 30,000 for MCF-7), then fixed and stained after 24 h of incubation. VC, vector control. Scale bar, 100 µm. (I) Quantification of the images reported in H; each bar represents the mean ± SD for n = 3. The P value was determined by Student’s t test. Right: Representative images of each sample. VC, vector control. Source data are available for this figure: SourceData F2.
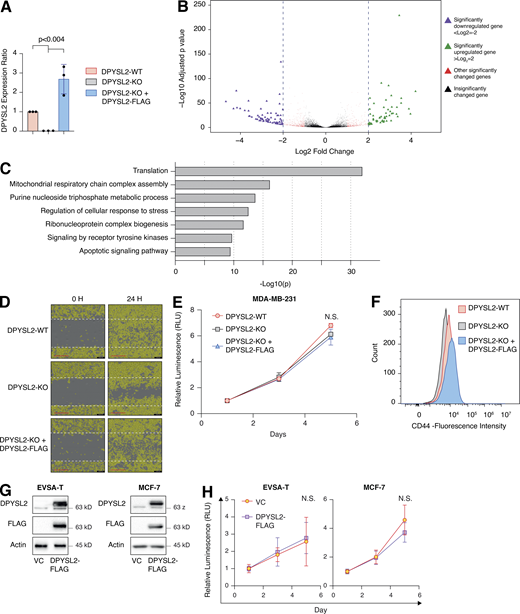
DPYSL2 loss inhibits cell migration in breast cancer cell lines. (A) Quantification of DPYSL2 expression levels from the immunoblots shown in Fig. 2 A. DPYSL2 levels in each sample were quantified relative to the DPYSL2-WT samples. Each bar represents the value ± SD for n = 3. The P value was determined by Student’s t test. (B) The transcriptomic effect of DPYSL2-loss on MDA-MB-231 is segregated into four different groups. WT and DPYSL2-KO cells were subjected to CEL-seq analysis. The expression ratio and the corresponding P value for each gene are presented as triangles in a volcano plot. Different colors represent the different groups. Purple, a gene exhibiting log2 ≤ −2; green, a gene exhibiting log2 ≥ 2; red, other significantly changed genes; black, insignificantly changed genes. (C) DPYSL2 loss affects the expression of translation-related genes and other metabolic genes. Both WT and DPYSL2-KO cells were subjected to a comparative CEL-seq analysis, and the expression level of each gene was analyzed in the two samples. The set of genes that demonstrated a significant elevation upon DPYSL2 loss was further subjected to Metascape analysis. Selected pathways and their P values are presented. The P values were computed by the website. (D) Representive pictures of the scratch assay. Images representing scratch confluencey during 0 and 24 h for WT, DPYSL2-KO, and DPYSL2-KO + DPYSL2-FLAG cells. Scale bar, 400 µm. (E) DPYSL2 KO does not affect proliferation. The proliferation rates of MDA-MB-231 WT, DPYSL2-KO, and DPYSL2-KO + DPYSL2-FLAG cells were measured using CellTiter Glo. Each value represents the mean ± SD for n = 6. N.S., no statistically significant differences between the samples. The P value was determined by Student’s t test. (F) Loss of DPYSL2 results in CD44 cell surface expression reduction. The different indicated samples were subjected to FACS analysis of the cell-surface markers CD44. The histogram represents CD44 fluorescence intensity values. n = 6. (G) Immunoblots representing DPYSL2 overexpression (DPYSL2-FLAG) in EVSA-T cells (left) and MCF-7 (right). Cells were lysed and subjected to immunoblotting using the indicated antibodies. VC, vector control. (H) DPYSL2 overexpression does not alter the proliferation rates of the epithelial cell lines (EVSA-T and MCF-7). The proliferation rates of VC and DPYSL2-FLAG cells were measured using CellTiter Glo. N.S., no statistically significant differences between the samples. The P value was determined by Student’s t test. Each value represents the mean ± SD for n = 6. Source data are available for this figure: SourceData FS2.
DPYSL2 loss inhibits cell migration in breast cancer cell lines. (A) Quantification of DPYSL2 expression levels from the immunoblots shown in Fig. 2 A. DPYSL2 levels in each sample were quantified relative to the DPYSL2-WT samples. Each bar represents the value ± SD for n = 3. The P value was determined by Student’s t test. (B) The transcriptomic effect of DPYSL2-loss on MDA-MB-231 is segregated into four different groups. WT and DPYSL2-KO cells were subjected to CEL-seq analysis. The expression ratio and the corresponding P value for each gene are presented as triangles in a volcano plot. Different colors represent the different groups. Purple, a gene exhibiting log2 ≤ −2; green, a gene exhibiting log2 ≥ 2; red, other significantly changed genes; black, insignificantly changed genes. (C) DPYSL2 loss affects the expression of translation-related genes and other metabolic genes. Both WT and DPYSL2-KO cells were subjected to a comparative CEL-seq analysis, and the expression level of each gene was analyzed in the two samples. The set of genes that demonstrated a significant elevation upon DPYSL2 loss was further subjected to Metascape analysis. Selected pathways and their P values are presented. The P values were computed by the website. (D) Representive pictures of the scratch assay. Images representing scratch confluencey during 0 and 24 h for WT, DPYSL2-KO, and DPYSL2-KO + DPYSL2-FLAG cells. Scale bar, 400 µm. (E) DPYSL2 KO does not affect proliferation. The proliferation rates of MDA-MB-231 WT, DPYSL2-KO, and DPYSL2-KO + DPYSL2-FLAG cells were measured using CellTiter Glo. Each value represents the mean ± SD for n = 6. N.S., no statistically significant differences between the samples. The P value was determined by Student’s t test. (F) Loss of DPYSL2 results in CD44 cell surface expression reduction. The different indicated samples were subjected to FACS analysis of the cell-surface markers CD44. The histogram represents CD44 fluorescence intensity values. n = 6. (G) Immunoblots representing DPYSL2 overexpression (DPYSL2-FLAG) in EVSA-T cells (left) and MCF-7 (right). Cells were lysed and subjected to immunoblotting using the indicated antibodies. VC, vector control. (H) DPYSL2 overexpression does not alter the proliferation rates of the epithelial cell lines (EVSA-T and MCF-7). The proliferation rates of VC and DPYSL2-FLAG cells were measured using CellTiter Glo. N.S., no statistically significant differences between the samples. The P value was determined by Student’s t test. Each value represents the mean ± SD for n = 6. Source data are available for this figure: SourceData FS2.
Next, we applied in vitro functional readouts to assess the involvement of DPYSL2 in cancer cell migration. Using the Boyden chamber–based Transwell migration assay (Fig. 2 C), the invasion assay (Fig. 2 D), and the Incucyte Live-Cell analysis system (Figs. 2 E and S2 D), we found that DPYSL2 loss significantly inhibited the migratory and invasive abilities of these cells without affecting their proliferation rate (Fig. S2 E). Additionally, we investigated whether DPYSL2 contributes to other phenotypes associated with aggressive cancer, such as stemness. We found that DPYSL2-KO cells, relative to WT, showed a significant reduction in the extracellular CD44 level (Figs. 2 F and S2 F) and mammosphere formation ability (Fig. 2 G), which are well-established stemness indicators (Yousefnia et al., 2019). Furthermore, restoring DPYSL2 expression to these KO cells (DPYSL2-KO + DPYSL2-FLAG; Fig. 2 A) improved their migration, invasion, and stemness to levels comparable to those of WT (DPYSL2-WT; Fig. 2, C–G). Finally, overexpressing DPYSL2 in the epithelial cell lines EVSA-T and MCF-7 (Fig. S2 G) improved their migratory behavior (Fig. 2, H and I) without any significant impact on their proliferation rate (Fig. S2 H). Together these in vitro assays indicated the crucial role of DPYSL2 in regulating migration and other aggressive characteristics in breast cancer.
DPYSL2 expression promotes tumor formation and metastasis
We then determined the role of DPYSL2 in tumor formation and metastasis in vivo. We injected GFP-labeled MDA-MB-231 cells (WT or DPYSL2-KO) into the mammary fat pads of female NOD-SCID mice and monitored the tumor growth for 6 wk. We found that in these mice, the growth rate (Fig. 3 A) and the average weights (Figs. 3 B and S3 A) of tumors generated from DPYSL2-KO cells were significantly lower than those from WT cells. Furthermore, in comparison to WT, DPYSL2-KO–injected mice had a significant reduction in the number of lung metastases as indicated by fluorescence microscopy detecting the GFP positive colonies (Fig. 3, C and D; and Fig. S3 B), and hematoxylin and eosin (H&E) staining (Figs. 3 E and S3 C). Altogether, these findings highlight the role of DPYSL2 in cell migration, tumor growth, and metastasis, yet its mechanism of action needs to be further revealed.

DPYSL2 loss affects tumor formation and metastasis in mice. (A) DPYSL2 expression affects tumor formation and growth rate in mice. MDA-MB-231 cells (WT or DPYSL2-KO) were injected into the fat pads of female NOD-SCID mice. During the course of time, tumor volumes were measured for both groups and presented as a graph. Each value represents the mean ± SD. The P value was determined by Student’s t test. The initial number of each group was 11. However, in the DPYSL2-KO, one mouse died, and another did not develop a tumor. (B) The tumors from A were weighed and results presented as a graph. The P value was determined by Student’s t test. Each bar represents the mean ± SD. (C) DPYSL2 loss reduces the number of lung metastases. Representative lungs were obtained from WT- and DPYSL2-KO–injected mice as described in A. Left: Bright-field images of the lung. Right: Fluorescence images of GFP-labeled colonies. Arrows indicate the detected GFP-expressing metastases. Scale bar, 5 mm. (D) The GFP-labeled colonies in the lung as described in C were quantified. The P value was determined by Student’s t test. Each bar represents the mean ± SD. (E) DPYSL2-KO inhibits lung metastasis. Representative images (left) and quantification (right) of lung tissues stained with H&E from the same lungs as in C. The P value was determined by Student’s t test. Each bar represents the mean ± SD for n = 6. Scale bar, 100 µm.
DPYSL2 loss affects tumor formation and metastasis in mice. (A) DPYSL2 expression affects tumor formation and growth rate in mice. MDA-MB-231 cells (WT or DPYSL2-KO) were injected into the fat pads of female NOD-SCID mice. During the course of time, tumor volumes were measured for both groups and presented as a graph. Each value represents the mean ± SD. The P value was determined by Student’s t test. The initial number of each group was 11. However, in the DPYSL2-KO, one mouse died, and another did not develop a tumor. (B) The tumors from A were weighed and results presented as a graph. The P value was determined by Student’s t test. Each bar represents the mean ± SD. (C) DPYSL2 loss reduces the number of lung metastases. Representative lungs were obtained from WT- and DPYSL2-KO–injected mice as described in A. Left: Bright-field images of the lung. Right: Fluorescence images of GFP-labeled colonies. Arrows indicate the detected GFP-expressing metastases. Scale bar, 5 mm. (D) The GFP-labeled colonies in the lung as described in C were quantified. The P value was determined by Student’s t test. Each bar represents the mean ± SD. (E) DPYSL2-KO inhibits lung metastasis. Representative images (left) and quantification (right) of lung tissues stained with H&E from the same lungs as in C. The P value was determined by Student’s t test. Each bar represents the mean ± SD for n = 6. Scale bar, 100 µm.

DPYSL2 loss affects tumor formation and metastasis in mice. (A) Tumors generated from DPYSL2-KO cells are smaller than those from WT cells. Images of tumors harvested from mice injected with DPYSL2-WT cells (top) and DPYSL2-KO cells (bottom). (B) DPYSL2 loss reduces the number of lung metastases. Representative lungs were obtained from WT- and DPYSL2-KO–injected mice. Left: Bright-field images of the lung. Right: Fluorescence images of GFP-labeled colonies. Arrows indicate the detected GFP-expressing metastases. Scale bar, 5 mm. (C) DPYSL2 KO inhibits lung metastasis. Representative images of lung tissues stained with H&E from the same lungs in B. Scale bar, 200 µm.
DPYSL2 loss affects tumor formation and metastasis in mice. (A) Tumors generated from DPYSL2-KO cells are smaller than those from WT cells. Images of tumors harvested from mice injected with DPYSL2-WT cells (top) and DPYSL2-KO cells (bottom). (B) DPYSL2 loss reduces the number of lung metastases. Representative lungs were obtained from WT- and DPYSL2-KO–injected mice. Left: Bright-field images of the lung. Right: Fluorescence images of GFP-labeled colonies. Arrows indicate the detected GFP-expressing metastases. Scale bar, 5 mm. (C) DPYSL2 KO inhibits lung metastasis. Representative images of lung tissues stained with H&E from the same lungs in B. Scale bar, 200 µm.
JAK1 interacts with the C-terminal domain of DPYSL2
As an adaptor protein, DPYSL2 mediates the axon guidance process via interacting with numerous partners (Yoshimura et al., 2005). Therefore, we hypothesized that it exploits the same mechanism of action to govern breast cancer cell migration. Structural analysis of DPYSL2 identified its C-terminal domain (residues 491–572) to be intrinsically disordered (Myllykoski et al., 2017), suggesting a function in protein–protein interaction. Thus, we overexpressed DPYSL2-FLAG or its truncated form (DPYSL2-∆Cter-FLAG; Fig. 4 A) in MDA-MB-231 cells. Next, we immunoprecipitated these FLAG-tagged proteins and subjected them to liquid chromatography-mass spectrometry (LC-MS) analysis, which identified a list of proteins interacting with DPYSL2. Then, we submitted this list to Metascape analysis (Table S2), which assigned them to known DPYSL2-associated pathways, such as folding of actin, axon guidance, and semaphorin interaction (Fig. 4 B), thus validating the capability of our assay. Interestingly, among this list, we identified JAK1, a crucial signaling molecule that mediates cancer cell aggressiveness (Wehde et al., 2018). We validated the specificity of DPYSL2-JAK1 binding, as it fails to interact with the control protein RAP2A (RAP2A-FLAG) in two different basal B cell lines, MDA-MB-231 and Hs-578-T (Fig. 4, C and D). Furthermore, this interaction is C-terminal dependent, as JAK1 binds only the full-length protein and not the truncated variant, emphasizing the importance of this domain in DPYSL2 interaction. To support these findings, we analyzed JAK1 expression in breast cancer patients and demonstrated a significant correlation with DPYSL2 (Fig. 4 E) and with EMT markers (Fig. S4 A). In parallel, DPYSL2 levels significantly correlated with the expression of cytokines and their receptors (Fig. S4 B), which are established JAK1 targets (Hammarén et al., 2019). Together, we identified a novel DPYSL2-JAK1 interaction, suggesting that DPYSL2 facilitates JAK1 role in breast cancer cell migration by modulating its downstream intracellular cascades.
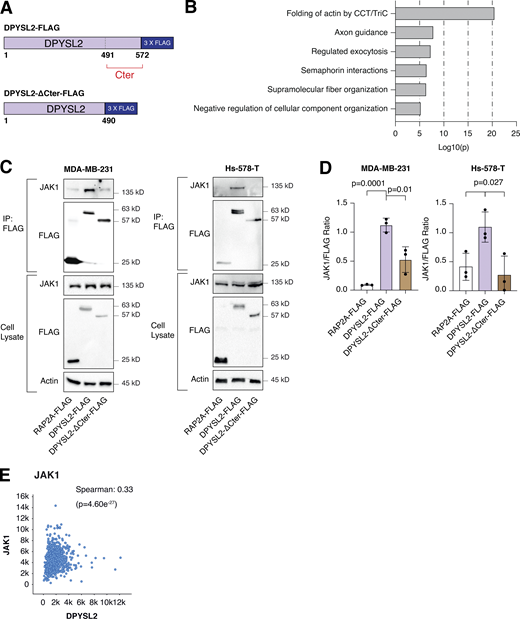
DPYSL2 interacts with JAK1. (A) A schematic diagram of the amino acid alignment of full-length DPYSL2 and ΔC-terminal isoform. Numbers indicate the amino acid residues. (B) DPYSL2-FLAG interacts with proteins involved in axon guidance and cytoskeleton organization. The list of proteins that interacts with DPYSL2 was subjected to Metascape analysis. Selected pathways and their P values are presented. The P values were computed by the website. (C) JAK1 interacts with the regulatory C-terminal domain of DPYSL2 in both MDA-MB-231 and Hs-578-T. Cells expressing RAP2A-FLAG, DPYSL2-FLAG, and DPYSL2-ΔCter-FLAG were lysed and subjected to immunoprecipitation using anti-FLAG antibodies. Cell lysates and immunoprecipitates were analyzed by immunoblotting for the levels of indicated proteins. (D) Quantification represents the ratio between JAK1 and FLAG immunoblots as indicated in C; each bar represents the mean ± SD for n = 3. The P values were determined by Student’s t test. (E) DPYSL2 expression correlates with JAK1 in breast cancer patients. Patients’ gene expression data were generated by the TCGA project (study name: Breast Invasive Carcinoma [TCGA, PanCancer Atlas]) and analyzed using the cBioportal webtool (https://www.cbioportal.org). DPYSL2 expression positively and significantly correlated with JAK1. The Spearman’s correlation coefficient and the P value were calculated by the analysis tool. Source data are available for this figure: SourceData F4.
DPYSL2 interacts with JAK1. (A) A schematic diagram of the amino acid alignment of full-length DPYSL2 and ΔC-terminal isoform. Numbers indicate the amino acid residues. (B) DPYSL2-FLAG interacts with proteins involved in axon guidance and cytoskeleton organization. The list of proteins that interacts with DPYSL2 was subjected to Metascape analysis. Selected pathways and their P values are presented. The P values were computed by the website. (C) JAK1 interacts with the regulatory C-terminal domain of DPYSL2 in both MDA-MB-231 and Hs-578-T. Cells expressing RAP2A-FLAG, DPYSL2-FLAG, and DPYSL2-ΔCter-FLAG were lysed and subjected to immunoprecipitation using anti-FLAG antibodies. Cell lysates and immunoprecipitates were analyzed by immunoblotting for the levels of indicated proteins. (D) Quantification represents the ratio between JAK1 and FLAG immunoblots as indicated in C; each bar represents the mean ± SD for n = 3. The P values were determined by Student’s t test. (E) DPYSL2 expression correlates with JAK1 in breast cancer patients. Patients’ gene expression data were generated by the TCGA project (study name: Breast Invasive Carcinoma [TCGA, PanCancer Atlas]) and analyzed using the cBioportal webtool (https://www.cbioportal.org). DPYSL2 expression positively and significantly correlated with JAK1. The Spearman’s correlation coefficient and the P value were calculated by the analysis tool. Source data are available for this figure: SourceData F4.
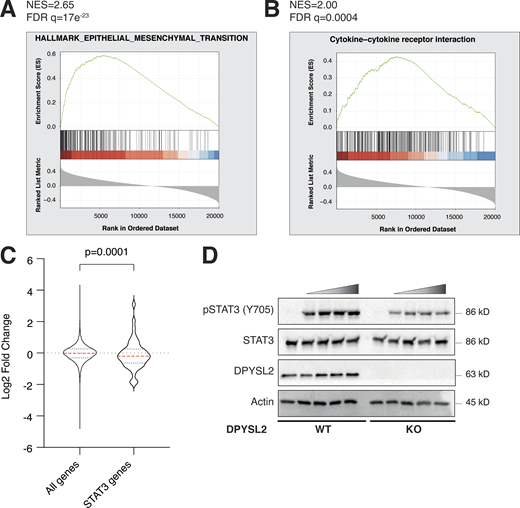
DPYSL2 interacts with JAK1 and regulates STAT3 signaling. (A) JAK1 expression in breast cancer patients correlates with the hallmark of epithelial–mesenchymal transition. Breast cancer patients’ gene expression data were generated by the TCGA (PanCancer Atlas project) and analyzed using the cBioportal webtool (https://www.cbioportal.org). In these samples, the expression of DPYSL2 was compared to the whole transcriptome (∼20,000 genes). The genes were then ranked based on the obtained Spearman’s correlation coefficient and subjected to GSEA. GSEA computed the normalized enrichment score (NES) and FDR values. (B) DPYSL2 expression in breast cancer patients correlates with the KEGG cytokine and cytokine receptor interactions set. The analysis was conducted as described in A. (C) The distribution of STAT3 target genes is downregulated relative to all genes. The expression profile of all genes, log2 fold change (all genes), was compared to STAT3 target genes (STAT3 genes) and results presented as a violin plot. The red dashed line in the violin plot demonstrates the mean value. The P value was determined by Student’s t test using Prism. (D) Loss of DPYSL2 expression results in STAT3 signaling inhibition. DPYSL2-WT and DPYSL2 -KO cells were starved with 0% FBS medium for 24 h and treated for 1 h with 0, 15, 25, 50, and 75 µl of medium taken from HEK-293 cells generating Hyper IL-6. Cells were subjected to immunoblotting using the indicated antibodies. Source data are available for this figure: SourceData FS4.
DPYSL2 interacts with JAK1 and regulates STAT3 signaling. (A) JAK1 expression in breast cancer patients correlates with the hallmark of epithelial–mesenchymal transition. Breast cancer patients’ gene expression data were generated by the TCGA (PanCancer Atlas project) and analyzed using the cBioportal webtool (https://www.cbioportal.org). In these samples, the expression of DPYSL2 was compared to the whole transcriptome (∼20,000 genes). The genes were then ranked based on the obtained Spearman’s correlation coefficient and subjected to GSEA. GSEA computed the normalized enrichment score (NES) and FDR values. (B) DPYSL2 expression in breast cancer patients correlates with the KEGG cytokine and cytokine receptor interactions set. The analysis was conducted as described in A. (C) The distribution of STAT3 target genes is downregulated relative to all genes. The expression profile of all genes, log2 fold change (all genes), was compared to STAT3 target genes (STAT3 genes) and results presented as a violin plot. The red dashed line in the violin plot demonstrates the mean value. The P value was determined by Student’s t test using Prism. (D) Loss of DPYSL2 expression results in STAT3 signaling inhibition. DPYSL2-WT and DPYSL2 -KO cells were starved with 0% FBS medium for 24 h and treated for 1 h with 0, 15, 25, 50, and 75 µl of medium taken from HEK-293 cells generating Hyper IL-6. Cells were subjected to immunoblotting using the indicated antibodies. Source data are available for this figure: SourceData FS4.
DPYSL2 as a regulator of STAT3 signaling
Upon its activation, JAK1 phosphorylates STAT3 at tyrosine 705 (Siersbæk et al., 2020), which in turn dimerizes and translocates into the nucleus to regulate the expression of selected metastatic and migratory factors, such as vimentin (Wang et al., 2018). Because we identified that DPYSL2 interacts with JAK1, we inspected whether this complex regulates STAT3 activation. Thus, we aimed to systematically analyze our comparative CEL-Seq data (Table S1) and determine whether DPYSL2 loss affects the expression of STAT3 gene targets (64 genes; Carpenter and Lo, 2014). From this list, only 48 genes were present in our CEL-Seq data (Table S3) whose log2 fold-change expression profile was significantly downregulated in DPYSL2-KO cells (STAT3 genes) relative to all genes (Fig. S4 C). In addition, compared with WT MDA-MB-231 cells, the basal level of STAT3 phosphorylation was significantly decreased in KO cells (DPYSL2-KO) and restored only when we ectopically reintroduced to them the expression of the full-length form (DPYSL2-KO + DPYSL2-FLAG; Fig. 5 A). Moreover, ectopically expressing DPYSL2 in the low-expressing epithelial cell line, EVSA-T, promoted STAT3 phosphorylation (Fig. 5 B). However, as opposed to the full-length DPYSL2, overexpressing the truncated form in MDA-MB-231 KO cells (DPYSL2-KO + DPYSL2-∆Cter-FLAG; Fig. 5 A) or EVSA-T (Fig. 5 B) failed to induce STAT3 phosphorylation, thus indicating the importance of the C-terminal domain in regulating this signaling cascade. To further establish DPYSL2’s role in STAT3 signaling, we treated both WT and DPYSL2-KO cells with the potent inducer, Hyper-IL6 (Khatib et al., 2020), a fusion protein of IL-6 and its soluble receptor (Fischer et al., 1997). We found that Hyper-IL6 substantially induced STAT3 phosphorylation in DPYSL2-WT cells, while this activation was significantly lower in KO cells (Figs. 5 C and S4 D). Moreover, we verified the JAKs involvement in this pathway by treating the cells with Hyper-IL6 and ruxolitinib, a selective inhibitor of JAK1 and JAK2 (Mesa, 2010), which abolished STAT3 phosphorylation. Similarly, xenograft tumors generated from DPYSL2-WT cells exhibited higher STAT3 phosphorylation than those from DPYSL2-KO cells (Fig. 5 D). Finally, in breast cancer patients, DPYSL2 expression significantly correlated with IL-6/JAK/STAT3 signaling (Fig. 5 E). Together, these findings indicate that DPYSL2 is a critical factor in activating the JAK1-STAT3 signaling cascade.
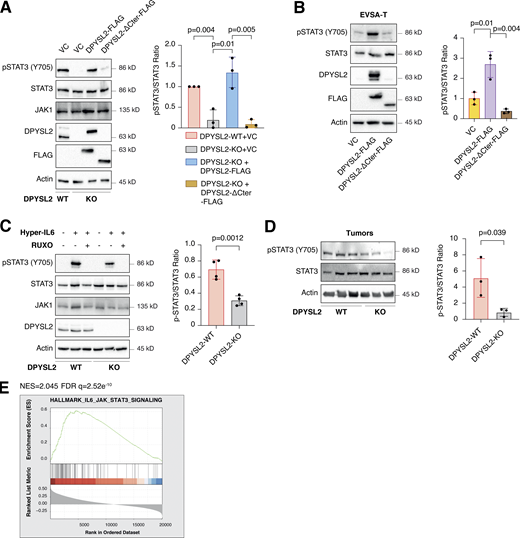
DPYSL2 regulates STAT3 signaling. (A) STAT3 phosphorylation correlates with DPYSL2 expression. Immunoblots representing WT MDA-MB-231 expressing VC, DPYSL2-KO, and overexpression of the full-length variant (DPYSL2-FLAG) or the C-terminal truncated (DPYSL2-ΔCter-FLAG) in the KO background. Left: Cells were lysed and subjected to immunoblotting using the indicated antibodies. Right: Quantification of phospho-STAT3 immunoblots normalized to total STAT3 levels; each bar represents the mean ± SD for n = 3. The P value was determined by Student’s t test. VC, vector control. (B) Overexpressing the full-length DPYSL2 (DPYSL2-FLAG), and not the C-terminal truncated variant (DPYSL2-ΔCter-FLAG), in EVSA-T cells induces the activation of STAT3. Left: Cells were lysed and subjected to immunoblotting using the indicated antibodies. Right: Quantification of phospho-STAT3 immunoblots normalized to total STAT3 levels; each bar represents the mean ± SD for n = 3. The P value was determined by Student’s t test. (C) Loss of DPYSL2 expression results in STAT3 signaling inhibition. DPYSL2-WT and DPYSL2-KO cells were starved with 0% FBS medium for 16 h and treated with 15 µl of vehicle control or medium from HEK-293 cells generating Hyper IL-6 for 1 h. For the inhibitor samples, 30 min before Hyper IL-6 treatment, cells were incubated with 30 µM ruxolitinib (JAK1/2 inhibitor). Left: Cells were subjected to immunoblot using the indicated antibodies. Right: Quantification of phospho-STAT3 immunoblots normalized to total STAT3 levels; each bar represents the mean ± SD for n = 4. The P value was determined by Student’s t test. (D) Tumors generated from DPYSL2-KO cells demonstrated a reduction in STAT3 phosphorylation. Left: Three representative tumors originating from WT or DPYSL2-KO cells were lysed and subjected to immunoblotting using the indicated antibodies. Right: Quantification of phospho-STAT3 immunoblots normalized to total STAT3 levels; each bar represents the mean ± SD for n = 3. The P value was determined by Student’s t test. (E) DPYSL2 expression in breast cancer patients correlates with the hallmark of IL6/JAK/STAT3 signaling. Breast cancer patients’ gene expression data were generated by the TCGA (PanCancer Atlas project) and analyzed using the cBioportal webtool (https://www.cbioportal.org). In these samples, the expression of DPYSL2 was compared to the whole transcriptome (∼20,000 genes). The genes were then ranked based on the obtained Spearman’s correlation coefficient and subjected to GSEA analysis. GSEA computed the normalized enrichment score (NES) and FDR values. Source data are available for this figure: SourceData F5.
DPYSL2 regulates STAT3 signaling. (A) STAT3 phosphorylation correlates with DPYSL2 expression. Immunoblots representing WT MDA-MB-231 expressing VC, DPYSL2-KO, and overexpression of the full-length variant (DPYSL2-FLAG) or the C-terminal truncated (DPYSL2-ΔCter-FLAG) in the KO background. Left: Cells were lysed and subjected to immunoblotting using the indicated antibodies. Right: Quantification of phospho-STAT3 immunoblots normalized to total STAT3 levels; each bar represents the mean ± SD for n = 3. The P value was determined by Student’s t test. VC, vector control. (B) Overexpressing the full-length DPYSL2 (DPYSL2-FLAG), and not the C-terminal truncated variant (DPYSL2-ΔCter-FLAG), in EVSA-T cells induces the activation of STAT3. Left: Cells were lysed and subjected to immunoblotting using the indicated antibodies. Right: Quantification of phospho-STAT3 immunoblots normalized to total STAT3 levels; each bar represents the mean ± SD for n = 3. The P value was determined by Student’s t test. (C) Loss of DPYSL2 expression results in STAT3 signaling inhibition. DPYSL2-WT and DPYSL2-KO cells were starved with 0% FBS medium for 16 h and treated with 15 µl of vehicle control or medium from HEK-293 cells generating Hyper IL-6 for 1 h. For the inhibitor samples, 30 min before Hyper IL-6 treatment, cells were incubated with 30 µM ruxolitinib (JAK1/2 inhibitor). Left: Cells were subjected to immunoblot using the indicated antibodies. Right: Quantification of phospho-STAT3 immunoblots normalized to total STAT3 levels; each bar represents the mean ± SD for n = 4. The P value was determined by Student’s t test. (D) Tumors generated from DPYSL2-KO cells demonstrated a reduction in STAT3 phosphorylation. Left: Three representative tumors originating from WT or DPYSL2-KO cells were lysed and subjected to immunoblotting using the indicated antibodies. Right: Quantification of phospho-STAT3 immunoblots normalized to total STAT3 levels; each bar represents the mean ± SD for n = 3. The P value was determined by Student’s t test. (E) DPYSL2 expression in breast cancer patients correlates with the hallmark of IL6/JAK/STAT3 signaling. Breast cancer patients’ gene expression data were generated by the TCGA (PanCancer Atlas project) and analyzed using the cBioportal webtool (https://www.cbioportal.org). In these samples, the expression of DPYSL2 was compared to the whole transcriptome (∼20,000 genes). The genes were then ranked based on the obtained Spearman’s correlation coefficient and subjected to GSEA analysis. GSEA computed the normalized enrichment score (NES) and FDR values. Source data are available for this figure: SourceData F5.
DPYSL2 mediates STAT3-induced vimentin expression
One of the STAT3 gene targets that were significantly downregulated upon DPYSL2 loss (Table S3) was vimentin, a central promigratory intermediate filament (Seetharaman and Etienne-Manneville, 2020). Thus, we sought to determine whether DPYSL2 regulates migration via the JAK1/STAT3/vimentin axis. Indeed, by immunoblot and immunofluorescence, we observed that vimentin protein level was significantly lower in DPYSL2-KO cells relative to WT (Figs. 6 A and S5 A). Indeed, similar to the pattern observed in STAT3 phosphorylation (Fig. 5 A), vimentin repression upon DPYSL2 loss was rescued by the overexpression of full-length DPYSL2 (DPYSL2-FLAG) but not the C-terminal truncated form (DPYSL2-∆Cter-FLAG; Fig. 6 A). Additionally, to further indicate that DPYSL2 mediates the STAT3/vimentin cascade, we ectopically expressed the constitutively activated STAT3 (A662C, N664C, V667L, [CA-STAT3]) (Martz et al., 2014) in KO cells, which induced vimentin expression significantly (Fig. 6 B), along with its canonical target, IL-6 (Siersbæk et al., 2020; Fig. S5 B). Furthermore, overexpressing DPYSL2 in the epithelial cell lines EVSA-T and HMLE induces STAT3 phosphorylation and its downstream target, vimentin (Fig. 6, C and D). Finally, in breast cancer patients, DPYSL2 expression strongly and significantly correlates with vimentin (Fig. S1 C). Collectively, these results demonstrate that the DPYSL2/JAK1/STAT3 axis is a regulator of vimentin expression, suggesting an underlying mechanism to govern cell migration.
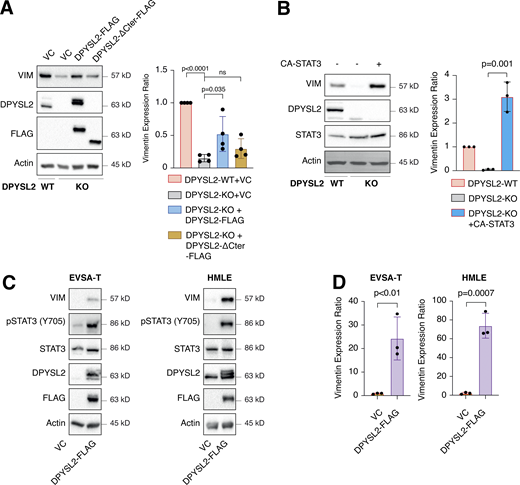
DPYSL2 regulates vimentin expression. (A) Vimentin expression correlates with DPYSL2. Immunoblots representing WT MDA-MB-231 expressing VC, DPYSL2-KO, and overexpression of the full-length variant (DPYSL2-FLAG) or the C-terminal truncated (DPYSL2-ΔCter-FLAG) in the KO background. Left: Cells were lysed and subjected to immunoblotting using the indicated antibodies. Right: Quantification of vimentin immunoblots relative to WT cells; each bar represents the mean ± SD for n = 4. The P value was determined by Mann–Whitney U test. VC, vector control. (B) Constitutively activated STAT3 induces vimentin expression. Immunoblots representing DPYSL2-KO in MDA-MB-231 and overexpression of the constitutive activates STAT3 (CA-STAT3) in the KO background. Left: Cells were lysed and subjected to immunoblotting using the indicated antibodies. Right: Quantification of vimentin immunoblots relative to WT cells; each bar represents the mean ± SD for n = 3. The P value was determined by Student’s t test. (C) DPYSL2 overexpression in epithelial cell lines induces vimentin expression. Cells expressing vector control (VC) and DPYSL2-FLAG were lysed and subjected to immunoblotting using the indicated antibodies. (D) Quantification of vimentin immunoblots relative to VC cells; each bar represents the mean ± SD for n = 3. The P value was determined by Student’s t test. Source data are available for this figure: SourceData F6.
DPYSL2 regulates vimentin expression. (A) Vimentin expression correlates with DPYSL2. Immunoblots representing WT MDA-MB-231 expressing VC, DPYSL2-KO, and overexpression of the full-length variant (DPYSL2-FLAG) or the C-terminal truncated (DPYSL2-ΔCter-FLAG) in the KO background. Left: Cells were lysed and subjected to immunoblotting using the indicated antibodies. Right: Quantification of vimentin immunoblots relative to WT cells; each bar represents the mean ± SD for n = 4. The P value was determined by Mann–Whitney U test. VC, vector control. (B) Constitutively activated STAT3 induces vimentin expression. Immunoblots representing DPYSL2-KO in MDA-MB-231 and overexpression of the constitutive activates STAT3 (CA-STAT3) in the KO background. Left: Cells were lysed and subjected to immunoblotting using the indicated antibodies. Right: Quantification of vimentin immunoblots relative to WT cells; each bar represents the mean ± SD for n = 3. The P value was determined by Student’s t test. (C) DPYSL2 overexpression in epithelial cell lines induces vimentin expression. Cells expressing vector control (VC) and DPYSL2-FLAG were lysed and subjected to immunoblotting using the indicated antibodies. (D) Quantification of vimentin immunoblots relative to VC cells; each bar represents the mean ± SD for n = 3. The P value was determined by Student’s t test. Source data are available for this figure: SourceData F6.
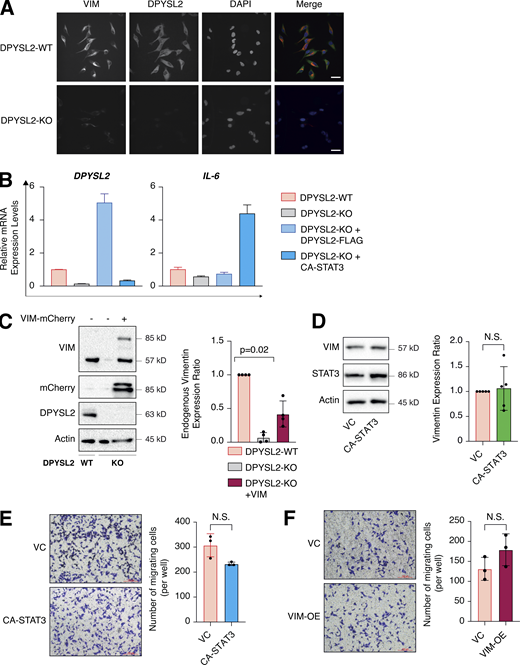
Overexpression of CA-STA3 and vimentin in WT cells does not affect migration. (A) DPYSL2 loss affects vimentin expression. WT and DPYSL2 cells were subjected to immunofluorescence assay and imaging using the indicated antibodies. Scale bar, 10 µm. (B) CA-STAT3 induces IL-6 expression in MDA-MB-231 cells. The RNA was isolated from WT, DPYSL2-KO, and DPYSL2-KO + CA-STAT3 cells, and the expression of the indicated genes was determined by qPCR. Each value represents the mean ± SD for n = 3. (C) Left: Immunoblots representing ectopic vimentin-mCherry expression in DPYSL2-KO cells. Immunoblots representing DPYSL2-KO in MDA-MB-231 and overexpression of vimentin-mCherry in the KO background. Cells were lysed and subjected to immunoblotting using the indicated antibodies. Right: Quantification of endogenous vimentin immunoblots relative to WT cells; each bar represents the mean ± SD for n = 4. The P value was determined by Mann–Whitney U test. (D) CA-STAT3 overexpression in WT MDA-MB-231 did not influence vimentin expression. Left: Immunoblots representing WT MDA-MB-231 expressing VC and CA-STAT3. Cells were lysed and subjected to immunoblotting using the indicated antibodies. Right: Quantification of vimentin immunoblots relative to WT cells; each bar represents the mean ± SD for n = 5. The P value was determined by Student’s t test. VC, vector control; N.S., no statistically significant differences between the samples. (E) Overexpression of CA-STAT3 insignificantly altered MDA-MB-231 cell migration. The migratory capability of the different samples was determined in a Transwell assay. Left: Representative images of each sample. Scale bar, 100 µm. Right: Quantification of data is reported as the number of migrated cells per 20,000 seeded cells; each value represents the mean ± SD for n = 3. The P value was determined by Student’s t test. VC, vector control; N.S., no statistically significant differences between the samples. (F) Overexpressing vimentin insignificantly altered MDA-MB-231 cell migration. The migratory capability of the different samples was determined in a Transwell assay. Left: Representative images of each sample. Scale bar, 100 µm. Right: Quantification of data is reported as the number of migrated cells per 20,000 seeded cells; each value represents the mean ± SD for n = 3. The P value was determined by Student’s t test. VC, vector control; N.S., no statistically significant differences between the samples. Source data are available for this figure: SourceData FS5.
Overexpression of CA-STA3 and vimentin in WT cells does not affect migration. (A) DPYSL2 loss affects vimentin expression. WT and DPYSL2 cells were subjected to immunofluorescence assay and imaging using the indicated antibodies. Scale bar, 10 µm. (B) CA-STAT3 induces IL-6 expression in MDA-MB-231 cells. The RNA was isolated from WT, DPYSL2-KO, and DPYSL2-KO + CA-STAT3 cells, and the expression of the indicated genes was determined by qPCR. Each value represents the mean ± SD for n = 3. (C) Left: Immunoblots representing ectopic vimentin-mCherry expression in DPYSL2-KO cells. Immunoblots representing DPYSL2-KO in MDA-MB-231 and overexpression of vimentin-mCherry in the KO background. Cells were lysed and subjected to immunoblotting using the indicated antibodies. Right: Quantification of endogenous vimentin immunoblots relative to WT cells; each bar represents the mean ± SD for n = 4. The P value was determined by Mann–Whitney U test. (D) CA-STAT3 overexpression in WT MDA-MB-231 did not influence vimentin expression. Left: Immunoblots representing WT MDA-MB-231 expressing VC and CA-STAT3. Cells were lysed and subjected to immunoblotting using the indicated antibodies. Right: Quantification of vimentin immunoblots relative to WT cells; each bar represents the mean ± SD for n = 5. The P value was determined by Student’s t test. VC, vector control; N.S., no statistically significant differences between the samples. (E) Overexpression of CA-STAT3 insignificantly altered MDA-MB-231 cell migration. The migratory capability of the different samples was determined in a Transwell assay. Left: Representative images of each sample. Scale bar, 100 µm. Right: Quantification of data is reported as the number of migrated cells per 20,000 seeded cells; each value represents the mean ± SD for n = 3. The P value was determined by Student’s t test. VC, vector control; N.S., no statistically significant differences between the samples. (F) Overexpressing vimentin insignificantly altered MDA-MB-231 cell migration. The migratory capability of the different samples was determined in a Transwell assay. Left: Representative images of each sample. Scale bar, 100 µm. Right: Quantification of data is reported as the number of migrated cells per 20,000 seeded cells; each value represents the mean ± SD for n = 3. The P value was determined by Student’s t test. VC, vector control; N.S., no statistically significant differences between the samples. Source data are available for this figure: SourceData FS5.
The DPYSL2/STAT3/vimentin axis is a key regulator of cell migration
In our model, we propose that DPYSL2, through its C-terminal domain, interacts with JAK1, and this binding is essential for the proper activation of STAT3 signaling. We then validated whether STAT3 activation, followed by vimentin induction, is the mechanism by which DPYSL2 regulates cell migration. Indeed, we found that the truncated form of DPYSL2 (DPYSL2-∆Cter-FLAG) was insufficient to rescue the reduction in cell migration and invasion caused by DPYSL2 loss (DPYSL2-KO; Fig. 7, A and B), emphasizing the importance of DPYSL2-JAK1 interaction in this process. However, introducing CA-STAT3 or overexpressing vimentin (Fig. S5 C) to the same DPYSL2 KO cells restored their migratory capabilities (Fig. 7, C and D). Interestingly, although introducing ectopic vimentin to DPYSL2 KO cells elevated its endogenous expression, it was still significantly less than that of WT cells (Fig. S5 C). Nevertheless, this elevation in endogenous vimentin expression indicates a DPYSL2-independent positive feedback loop mediated by other EMT regulatory factors (Strouhalova et al., 2020). Moreover, since WT MDA-MB-231 have a relatively high expression level of DPYSL2 (Fig. 1 E), overexpressing CA-STAT3 (Fig. S5 D) or vimentin constructs did not affect cell migration (Fig. S5, E and F), supporting the role of adaptor protein in the migratory machinery. Overall, these functional in vitro migration assays demonstrate the importance of the DPYSL2 binding to JAK1 in regulating the STAT3/vimentin axis to support cell migration.

DPYSL2 regulates cell migration via the STAT3/vimentin axis. (A) The C-terminal truncated variant (DPYSL2-ΔCter-FLAG) fails to rescue the migration of MDA-MB-231 DPYSL2-KO cells. The migratory capability of the different samples was determined in a Transwell assay. Left: Representative images of each sample. Scale bar, 100 µm. Right: Quantification of data is reported as the number of migrating cells per 20,000 seeded cells; each bar represents the mean ± SD for n = 3. The P value was determined by Student’s t test. (B) Overexpressing DPYSL2-ΔCter-FLAG in DPYSL2-KO is insufficient to improve the invasiveness of MDA-MB-231 cells. The cells were infected and treated as in A, and the number of the Matrigel-invading cells was measured. Left: Representative images of each sample. Right: Quantification of data is reported as the number of invading cells per 20,000 seeded cells; each bar represents the mean ± SD for n = 3. The P value was determined by Student’s t test. Scale bar, 100 µm. (C) Constitutively activated STAT3 (CA-STAT3) improves the migration of DPYSL2-KO cells. The migratory capability of the different samples was determined in a Transwell assay. Top: Representative images of each sample. Scale bar, 100 µm. Bottom: Quantification of data is reported as the number of migrated cells per 20,000 seeded cells. Each bar represents the mean ± SD for n = 3. The P value was determined by Student’s t test. (D) Introducing vimentin to MDA-MB-231 with DPYSL2-KO restores their migration abilities. The migratory capability of the different samples was determined in a Transwell assay. Top: Representative images of each sample. Scale bar, 100 µm. Bottom: Quantification of data is reported as the number of migrated cells per 20,000 seeded cells. Each bar represents the mean ± SD for n = 3. The P value was determined by Student’s t test.
DPYSL2 regulates cell migration via the STAT3/vimentin axis. (A) The C-terminal truncated variant (DPYSL2-ΔCter-FLAG) fails to rescue the migration of MDA-MB-231 DPYSL2-KO cells. The migratory capability of the different samples was determined in a Transwell assay. Left: Representative images of each sample. Scale bar, 100 µm. Right: Quantification of data is reported as the number of migrating cells per 20,000 seeded cells; each bar represents the mean ± SD for n = 3. The P value was determined by Student’s t test. (B) Overexpressing DPYSL2-ΔCter-FLAG in DPYSL2-KO is insufficient to improve the invasiveness of MDA-MB-231 cells. The cells were infected and treated as in A, and the number of the Matrigel-invading cells was measured. Left: Representative images of each sample. Right: Quantification of data is reported as the number of invading cells per 20,000 seeded cells; each bar represents the mean ± SD for n = 3. The P value was determined by Student’s t test. Scale bar, 100 µm. (C) Constitutively activated STAT3 (CA-STAT3) improves the migration of DPYSL2-KO cells. The migratory capability of the different samples was determined in a Transwell assay. Top: Representative images of each sample. Scale bar, 100 µm. Bottom: Quantification of data is reported as the number of migrated cells per 20,000 seeded cells. Each bar represents the mean ± SD for n = 3. The P value was determined by Student’s t test. (D) Introducing vimentin to MDA-MB-231 with DPYSL2-KO restores their migration abilities. The migratory capability of the different samples was determined in a Transwell assay. Top: Representative images of each sample. Scale bar, 100 µm. Bottom: Quantification of data is reported as the number of migrated cells per 20,000 seeded cells. Each bar represents the mean ± SD for n = 3. The P value was determined by Student’s t test.
DPYSL2 regulates vimentin-dependent lamellipodia formation
Vimentin is a central intermediate filament (Strouhalova et al., 2020), which governs the formation of lamellipodia (Yang et al., 2019), an actin-rich structure found at the leading edge of the migratory cell (Seetharaman and Etienne-Manneville, 2020). Since we demonstrated that DPYSL2, via STAT3 activation, regulates vimentin expression and cell migration, we determined whether this axis also governs the migratory structures in the cells’ leading edge. We found that DPYSL2 KO leads to a profound cytoskeletal reorganization, including vimentin loss and major changes in stress fiber structures (Fig. 8 A; and Fig. S6, A and B). Specifically, we visualized that DPYSL2 KO significantly impaired the lamellipodia structures (Ridley, 2011; Fig. 8 B), which in aggressive breast carcinoma are enriched with Ezrin expression (Sarrió et al., 2006; Yin and Schnoor, 2021). We confirmed the DPYSL2/STAT3/vimentin axis as a regulator of lamellipodia formation by reintroducing the full-length DPYSL2 (DPYSL2-KO + DPYSL2-FLAG), CA-STAT3 (DPYSL2-KO + CA-STAT3), or vimentin (DPYSL2-KO + VIM) into DPYSL2-KO cells, which significantly restored Ezrin’s localization to the cells’ front (Fig. 8, C and D), without affecting its protein level (Fig. S6 C). In contrast, overexpressing the truncated DPYSL2 (DPYSL2-ΔCter-FLAG) in the KO cells had no apparent impact on Ezrin’s localization (Fig. 8, C and D). In addition, Ezrin’s presence was hardly detected in WT MDA-MB-231 cells treated with the JAK1/2 inhibitor (ruxolitinib; Fig. S6, D and E) or in those devoid of vimentin expression (VIM-KO; Fig. S6, F and G), indicating the essential role of this axis in lamellipodia formation. Together these results demonstrate that DPYSL2, through its interaction with JAK1, followed by the activation of STAT3, governs the cytoskeleton reorganization required for the cancer cell’s migratory machinery.

DPYSL2-loss affects lamellipodia formation. (A) DPYSL2 loss affects the cellular distribution of actin filaments. WT and DPYSL2-KO cells were subjected to immunofluorescence imaging using the indicated antibodies. Phalloidin was used to probe actin. Arrows indicate lamellipodia structures. Scale bar, 10 µm. (B) MDA-MB-231 cells devoid of DPYSL2 expression demonstrate a reduction in cells with intact lamellipodia. Quantification of WT MDA-MB 231 (DPYSL2-WT) and DPYSL-KO cells with intact leading edges after subjecting the cells to immunofluorescence imaging and probing actin with phalloidin. (C) Full-length DPYSL2, constitutively activated STAT3 (CA-STAT3), and vimentin (VIM) were able to rescue the lamellipodia structure in DPYSL2-KO cells. Cells were subjected to immunofluorescence imaging using the indicated antibodies. Scale bar, 10 µm. (D) Quantification of Ezrin foci represented in C. Quantification of data is reported as the average number of Ezrin foci per cell. Each bar represents the mean ± SD for n = 5. The P value was determined by Student’s t test. N.S., no statistically significant differences between the samples. (E) A schematic representation of DPYSL2’s role in JAK/STAT3-mediated cell migration.
DPYSL2-loss affects lamellipodia formation. (A) DPYSL2 loss affects the cellular distribution of actin filaments. WT and DPYSL2-KO cells were subjected to immunofluorescence imaging using the indicated antibodies. Phalloidin was used to probe actin. Arrows indicate lamellipodia structures. Scale bar, 10 µm. (B) MDA-MB-231 cells devoid of DPYSL2 expression demonstrate a reduction in cells with intact lamellipodia. Quantification of WT MDA-MB 231 (DPYSL2-WT) and DPYSL-KO cells with intact leading edges after subjecting the cells to immunofluorescence imaging and probing actin with phalloidin. (C) Full-length DPYSL2, constitutively activated STAT3 (CA-STAT3), and vimentin (VIM) were able to rescue the lamellipodia structure in DPYSL2-KO cells. Cells were subjected to immunofluorescence imaging using the indicated antibodies. Scale bar, 10 µm. (D) Quantification of Ezrin foci represented in C. Quantification of data is reported as the average number of Ezrin foci per cell. Each bar represents the mean ± SD for n = 5. The P value was determined by Student’s t test. N.S., no statistically significant differences between the samples. (E) A schematic representation of DPYSL2’s role in JAK/STAT3-mediated cell migration.
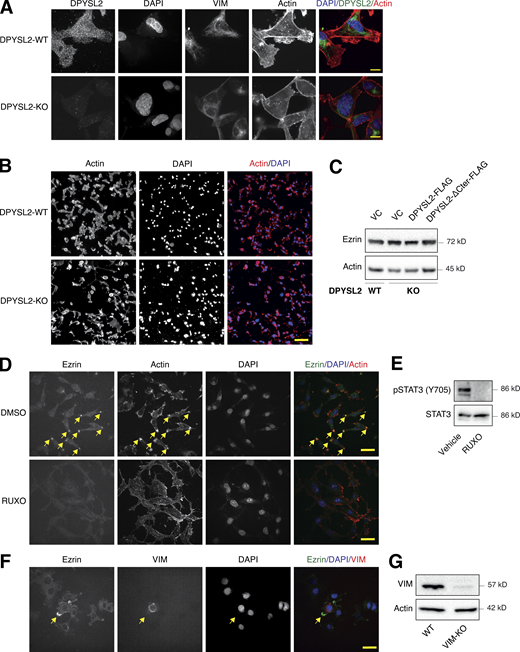
DPYSL2 is involved in arranging the lamellipodia structure. (A) DPYSL2 loss affects the cellular distribution of actin filaments. WT and DPYSL2-KO cells were subjected to immunofluorescence imaging using the indicated antibodies. Phalloidin was used to probe actin. Scale bar, 5 µm. (B) DPYSL2 loss affects the cellular distribution of actin filaments. WT and DPYSL2-KO cells were subjected to immunofluorescence imaging using phalloidin to probe actin. Scale bar, 50 µm. (C) DPYSL2 does not affect Ezrin’s expression level. Immunoblots representing WT MDA-MB-231 expressing VC, DPYSL2-KO, and overexpression of the full-length variant (DPYSL2-FLAG) or the C-terminal truncated (DPYSL2-ΔCter-FLAG) in the KO background. Cells were lysed and subjected to immunoblotting using the indicated antibodies. (D) The lamellipodia structure is disrupted upon inhibiting the JAK-STAT3 axis. MDA-MB-231 WT cells were starved with 0% FBS medium for 16 h and treated with 20 µM ruxolitinib (JAK1/2 inhibitor) for 12 h. The cells were subjected to immunofluorescence imaging using the indicated antibodies. Arrows indicate lamellipodia. Scale bar, 10 µm. (E) Immunoblots representing MDA-MB-231 cells treated with vehicle control or 20 µM ruxolitinib for 12 h. Cells were lysed and subjected to immunoblotting using the indicated antibodies. (F) Lamellipodia intactness is vimentin dependent. MDA-MB-231 cells, WT, and vimentin KO (VIM-KO). The VIM-KO cells are a polyclonal population in which cells expressing vimentin were not selected. These cells were subjected to immunofluorescence imaging using the indicated antibodies. Arrows indicate a cell expressing vimentin. Scale bar, 20 µm. (G) Immunoblots representing VIM-KO in MDA-MB-231 cells. Cells were lysed and subjected to immunoblotting using the indicated antibodies. Source data are available for this figure: SourceData FS6.
DPYSL2 is involved in arranging the lamellipodia structure. (A) DPYSL2 loss affects the cellular distribution of actin filaments. WT and DPYSL2-KO cells were subjected to immunofluorescence imaging using the indicated antibodies. Phalloidin was used to probe actin. Scale bar, 5 µm. (B) DPYSL2 loss affects the cellular distribution of actin filaments. WT and DPYSL2-KO cells were subjected to immunofluorescence imaging using phalloidin to probe actin. Scale bar, 50 µm. (C) DPYSL2 does not affect Ezrin’s expression level. Immunoblots representing WT MDA-MB-231 expressing VC, DPYSL2-KO, and overexpression of the full-length variant (DPYSL2-FLAG) or the C-terminal truncated (DPYSL2-ΔCter-FLAG) in the KO background. Cells were lysed and subjected to immunoblotting using the indicated antibodies. (D) The lamellipodia structure is disrupted upon inhibiting the JAK-STAT3 axis. MDA-MB-231 WT cells were starved with 0% FBS medium for 16 h and treated with 20 µM ruxolitinib (JAK1/2 inhibitor) for 12 h. The cells were subjected to immunofluorescence imaging using the indicated antibodies. Arrows indicate lamellipodia. Scale bar, 10 µm. (E) Immunoblots representing MDA-MB-231 cells treated with vehicle control or 20 µM ruxolitinib for 12 h. Cells were lysed and subjected to immunoblotting using the indicated antibodies. (F) Lamellipodia intactness is vimentin dependent. MDA-MB-231 cells, WT, and vimentin KO (VIM-KO). The VIM-KO cells are a polyclonal population in which cells expressing vimentin were not selected. These cells were subjected to immunofluorescence imaging using the indicated antibodies. Arrows indicate a cell expressing vimentin. Scale bar, 20 µm. (G) Immunoblots representing VIM-KO in MDA-MB-231 cells. Cells were lysed and subjected to immunoblotting using the indicated antibodies. Source data are available for this figure: SourceData FS6.
Discussion
We established the axon guidance adaptor protein DPYSL2 as a key factor in breast cancer cell aggressiveness. We found a significant correlation between DPYSL2 and mesenchymal markers’ expression in breast cancer patients and cell lines. Moreover, DPYSL2 loss substantially impacted cell motility, tumorigenesis, and metastasis. We demonstrated that DPYSL2, through its C-terminal domain, binds JAK1 to regulate STAT3 signaling, which upregulates the expression of migratory factors such as vimentin (Fig. 8 E). These findings indicate a novel cellular regulatory mechanism, where adaptor proteins serve as a direct link between cytoskeletal molecules and oncogenic signaling kinases to promote cell migration.
In this study, we demonstrated that cancer cells use components from the neuronal axon guidance machinery, including DPYSL2, to efficiently increase migration. However, despite the similarities between cancer cell migration and axon guidance, these cellular systems regulate DPYSL2 expression differently. For instance, during axon growth, DPYSL2 is expressed at a relatively constant level and is mainly regulated by a diverse set of posttranslational modifications, such as phosphorylation, glycosylation, and SUMOylation (Moutal et al., 2019). Nevertheless, DPYSL2 demonstrates a differential gene expression pattern in various tumor types. For example, in colorectal carcinoma and non–small-cell lung cancer, DPYSL2 expression is upregulated in tumors relative to surrounding normal tissues (Wu et al., 2008; Oliemuller et al., 2013; Tan et al., 2014), whereas epithelial breast cancer samples exhibited the opposite expression pattern (Shimada et al., 2013). These cancer types also differ in their DPYSL2 expression pattern throughout tumor progression. In colorectal carcinoma and non–small-cell lung cancer, DPYSL2 expression does not vary between low- and high-grade samples, whereas in lung cancer it demonstrates a progression-dependent phosphorylation pattern (Oliemuller et al., 2013). However, the DPYSL2 level in breast cancer is upregulated in highly aggressive subtypes, including basal and mesenchymal-like (Lin et al., 2020). This reported pattern correlates with METABRIC and TCGA datasets, as our analysis shows that high DPYSL2 is enriched in normal, basal, and claudin-low samples (Fig. 1 D). Hence, these expression variations among diverse tumors suggest that DPYSL2 serves a cancer type-dependent function yet to be resolved.
In our in vivo study, we orthotopically injected breast cancer cells into the mice mammary fat pads, where DPYSL2 loss led to smaller tumors and fewer lung metastases relative to WT cells (Fig. 3). Nevertheless, we could not eliminate the possibility that the reduction in metastases formation is solely attributed to the impairment in the metastatic cascade rather than the lower tumor growth rate. However, the strong effect of DPYSL2-loss on cell migration and intracellular signaling strongly indicates that DPYSL2 is a central regulator of cancer aggressiveness. Thus, further studies using additional and more advanced breast cancer animal models will improve our understanding of DPYSL2 role in metastasis.
We show that DPYSL2 KO inhibits cancer cell migration. However, a recent study concluded that DPYSL2 suppresses breast cancer aggressiveness (Lin et al., 2020). Although both studies used MDA-MB-231 cells as an aggressive model of breast cancer, there were drastic variations in the experimental settings that could lead to such discrepancies. Particularly, Lin et al. (2020), conclusions were determined by DPYSL2 overexpression and gene knockdown, while we abolished DPYSL2 expression using the CRISPR-based KO system. Here, we suggest that maintaining a defined DPYSL2 expression level is crucial for its function, where any manipulation in the expression level may interfere with its stoichiometric interaction as an adaptor protein and consequently affect cell migration. Furthermore, both studies significantly differ in their suggested mechanisms, as our study demonstrates the novel role of DPYSL2 as a direct regulator of JAK1/STAT3. We believe that this controversy highlights the complexity and the vital role of this adaptor protein in breast cancer aggressiveness and will pave the way to new discoveries.
Many of the established axon guidance factors are reported to function in the neuronal injury response machinery (Giger et al., 2010; Niisato et al., 2012). Upon neuronal damage, a set of pro-regenerative factors are released, including the cytokine IL-6 (Leibinger et al., 2021), which activates the JAK/STAT3 signaling cascade (Liu et al., 2015). Since we determined that DPYSL2-JAK1 interaction is a regulator of STAT3 signaling in cancer cells, we suggest that the same mechanism applies to neuronal injury response. Thus, identifying factors that enhance DPYSL2-JAK1 interaction can be potentially used as drug targets to improve neuronal repair processes.
Materials and methods
Cell lines and cell culture
The cell lines ZR-75-1, MCF-7, MDA-MB-231, Hs-578-T, and MDA-MB-436 were obtained from ATCC and EVSA-T (DSMZ) and cultured in DMEM supplemented with 10% FBS (Biological Industries). The immortalized human mammary epithelial cells expressing OHT-inducible Twist (HMLE-Twist-ER) and NAMECs were maintained in MEGM (Lonza) growth medium. All cells were cultured at 37°C with 5% CO2. For EMT induction, HMLE-Twist-ER cells were treated with OHT (H7904; Sigma-Aldrich) at a final concentration of 10 nM for the indicated number of days.
Antibodies
Antibodies were obtained from the following sources: rabbit-mAb JAK1 (ab133666), mouse-mAb vimentin (ab8069), rabbit-pAb mCherry (ab183628), and rabbit-mAb Ezrin (ab270442) were all purchased from Abcam; rabbit-mAb DPYSL2 (35672), rabbit-mAb CDH1 (3195), rabbit-mAb β-actin (4970), mouse-mAb β-actin (3700), rabbit-mAb vimentin (5741), mouse-mAb FLAG (8146), rabbit-mAb p-STAT3-Tyr705 (9145), and mouse-mAb STAT3 (9139) from Cell Signaling Technology; APC-labeled anti-CD44 mouse-mAb (559942) from BD Bioscience; HRP-labeled goat anti-mouse (115-035-003) and HRP-labeled goat anti-rabbit (111-035-144) secondary antibodies were obtained from Jackson ImmunoResearch. Secondary antibodies for immunofluorescence assays: goat anti-mouse–Alexa Fluor 647 (ab150119; Abcam), donkey anti-rabbit–Rhodamine red X (711-295-152; Jackson ImmunoResearch Laboratories) and donkey anti-rabbit–Alexa Fluor 488 (711-545-152; Jackson ImmunoResearch Laboratories).
Cell lysis and immunoblotting
Cells were rinsed twice with ice-cold PBS and lysed with radioimmunoprecipitation assay (RIPA) lysis buffer (20 mM Tris, pH 7.4, 137 mM NaCl, 10% glycerol, 1% Triton X-100, 0.5% deoxycholate, 0.1% SDS, 2.0 mM EDTA, pH 8.0, EDTA-free protease inhibitor [1 tablet per 50 ml RIPA; Roche], and phosphatase inhibitor cocktail [100×; Bimake]). The lysates were cleared by centrifugation at 13,000 rpm at 4°C in a microcentrifuge for 10 min. The protein concentration was determined by Bradford assay (Bio-Rad). Proteins were denatured by adding SDS sample buffer (5×) and boiling for 5 min, resolved by 10% SDS-PAGE, transferred onto a 0.45-µm polyvinylidene difluoride membrane (Merck), and probed with the appropriate antibodies. The images were quantified using Image Lab v6.1.0 (Bio-Rad).
Analysis of breast cancer data in cBioportal
The cBioPortal for Cancer Genomics is an open-access database, providing visualization and analysis tools for large-scale cancer genomics data sets (http://cbioportal.org). For gene correlation analysis, we queried DPYSL2 or JAK1 in breast invasive carcinoma (TCGA; PanCancer Atlas project) or the METABRIC (containing 1,084 and 2,509 samples, respectively). Then we subjected the genes to coexpression analysis and downloaded the correlation plots. For GSEA, Spearman’s correlation coefficient between the gene of interest and the whole genome was computed, downloaded, and subjected to GSEA analysis and visualization of the result, using the R package clusterProfiler (Wu et al., 2021) and enrichplot. For the different analyses, we selected the h.all.v7.2.symbole.gmt (Hallmarks) or C2.cp.kegg.v7.2.symbols.gmt (Curated) gene set databases.
Cancer sample analysis
KM analyses of the breast cancer samples were analyzed and generated by the KM Plotter website (http://kmplot.com/analysis/; Wang et al., 2010). Search entries: DPYSL2 as the gene symbol (ID: 200762_at; Affymetrix), autoselect best cutoff for “split patients by.” The obtained KM plots and the statistics were generated by the website.
Virus production
HEK-293T cells were cotransfected with the pLentiCRISPR sgRNA, VSV-G envelope plasmid, and Δvpr lentiviral plasmid using X-TremeGene 9 Transfection Reagent. The supernatant containing the virus was collected 48 h after transfection and spun for 5 min at 400 g to eliminate cells.
CRISPR-Cas9–mediated KO cell lines
We used CRISPR-Cas9–mediated genome editing to achieve gene KO, using pLentiCRISPR v1 (#70662; Addgene Plasmid) in which the sgRNA and Cas9 are delivered on a single plasmid. We also generated KO cells using pSpCas9(BB)-2A-Puro (PX459) V2.0 (#62988; Addgene Plasmid). Editing the DPYSL2 locus in MDA-MB-231 cells was accomplished by either infecting cells with the “pLentiCRISPR” plasmid or transfection with the PX459 plasmid into which an sgRNA targeting the DPYSL2 locus had been cloned. Cells were then subjected to single-cell cloning by limiting dilution in 96-well plates. Editing of the DPYSL2 locus was confirmed by assessing protein level by Western blot. Vimentin KO cells were generated by transfecting with PX459 plasmid harboring sgRNA against vimentin. The cells were then subjected to Western blot and immunofluorescence to verify the protein expression. Primers used for cloning non-targeting control (NTC) are NTC-sgRNA, 5′-CACCGGCGCTTCCGCGGCCCGTTCAA-3′ and 5′-AAACTTGAACGGGCCGCGGAAGCGG-3′; DPYSL2-gRNA1, 5′-CACCGGTGGCATAAGGGCATCCAGG-3′ and 5′-AAACCCTGGATGCCCTTATGCCACG-3′; DPYSL2 sgRNA2, 5′-CACCGACTGCCAGCTTGGGAACGGA-3′ and 5′-AAACTCCGTTCCCAAGCTGGCAGTG-3′; and Vimentin sgRNA, 5′-CACCGCGTCACGCAGGGCAGCCGTG-3′ and 5′-AAACCACGGCTGCCCTGCGTGACGG-3′.
RNA preparation, RT-PCR, and quantitative PCR (qPCR) analysis
Total RNA was isolated from cells using the NucleoSpin RNA Kit (Macherey-Nagel), and reverse transcription was performed using qScript cDNA Synthesis Kit (Quantbio). The resulting cDNA was diluted in DNase-free water (1:10) before quantification by real-time qPCR. The mRNA transcription levels were measured using 2× qPCRBIO SyGreen, Blue Mix Hi-ROX (PCR Biosystems), and StepOnePlus (Applied Biosystems). All data were expressed as the ratio between the expression level of the target gene mRNA and GAPDH. The primers used for the RNA-sequencing analysis were obtained from Integrated DNA Technology with the following sequences: IL-6, 5′-ACTCACCTCTTCAGAACGAATTG-3′ and 5′-CCATCTTTGGAAGGTTCAGGTTG-3′; DPYSL2, 5′-GATCCCCGGAGGAATTGACG-3′ and 5′-GGCTCAGGAACAACGTGGTC-3′; Vimentin, 5′-ACCCGCACAACGAGAAGGT-3′ and 5′-ATTCTGCTGCTCCAGGAAGCG-3′; and GAPDH, 5′-AGCCACATCGCTCAGACAC-3′ and 5′-GCCCAATACGACCAAATCC-3′.
Transwell migration and invasion assays
Migration assay was performed using the Costar Transwell Invasion chamber. Transwell inserts were hydrated with serum-free DMEM for 30 min. MDA-MB-231 (2 × 10⁴), EVSAT (0.5 × 10⁵), or MCF-7 (3 × 10⁴) cells were added to the upper chamber in a volume of serum-free DMEM, and the invasion assay was performed using Millicell cell culture inserts (Millipore) coated with extracellular matrix (1 µg/ml) with serum-free DMEM for 1 h, and 2 × 10⁴ of MDA-MB-231 cells (500 µl) were added to the upper chamber. For both assays, DMEM (700 μl) with 10% FBS (as chemoattractant) was added to the lower wells of the 24-well plate. The medium was discarded after 24 h. Nonmigratory cells were removed with cotton-tipped swabs, and the lower surface of the insert was stained with 0.5% crystal fast violet. The cells were counted and captured under a Nikon Eclipse 80i microscope at 10× magnification.
Wound healing assay
MDA-MB-231 cells (4 × 10⁴) were plated onto IncuCyte ImageLock 96-well cell culture microplates. After 18 h, the cell monolayer was scraped using a wound-maker mechanical device (Essen BioScience), washed with PBS, and examined under an inverted microscope. The wound area was monitored using the IncuCyte live-cell imaging system. Wound healing assay results were compiled from eight wells with one scratch in each well. At the 24-h time point, closure of the control scratch was observed.
FACS analysis
MDA-MB-231 (2 × 10⁵) cells were seeded in a 6-well tissue culture plate. After 16 h, cells were washed three times with PBS and detached for further processing using 200 µl of 0.05% EDTA solution. Cells were quenched using 10% FBS DMEM (Biological industries), collected in Eppendorf tubes, centrifuged (2,500 rpm for 5 min) at 4°C, and washed with PBS twice. Next, cells were incubated with CD44 APC-conjugated antibody for 30 min. The cells were then washed with PBS twice, passed through filter mesh, and collected in FACS tubes. Samples were sorted on a flow cytometer (BD Accuri C6) and analyzed by FlowJo software (TreeStar).
Mammosphere formation assay
800 cells/well were seeded in 96-well plates after coating with growth factor–reduced Matrigel (Corning). Plates were incubated for 5–8 d under observation, and every 2 d, 2% of new growth factor–reduced Matrigel was added. Mammospheres were counted manually under the microscope and results are plotted as a graph.
Cell proliferation assay
Cells were seeded in white 96-well plates (Greiner) at a density of 500 cells/well. Cell viability was assessed with Cell Titer-Glo (Promega) 1, 3, and 5 d after seeding, and luminescence was measured with Cytation 3 Multi-Mode Reader (BioTek).
Animal studies
MDA-MB-231 WT and DPYSL2-KO cells were injected into the mammary fat pads of female NOD-SCID mice (1 × 10⁶ cells per mouse). The tumors were monitored and measured weekly. After 6 wk, the tumors were harvested and weighed. The obtained lungs were observed under a SMZ18 Nikon Stereomicroscope. The pictures were slightly adjusted (brightness) with Adobe Photoshop. All mouse experiments were carried out under the Hebrew University Institutional Animal Care and Use Committee–approved protocol (MD-16-14939-5). The Hebrew University is certified by the Association for Assessment and Accreditation of Laboratory Animal Care.
H&E staining
Lung tissue sections were stained with H&E using Sakura Tissue-Tek Prisma (Department of Pathology, Hadassah Hebrew University Medical Center). Lung metastasis incidence was analyzed by a pathologist (N. Pillar). Quantification of lung metastatic load was performed by analyzing the number and volume of metastatic lesions per section.
Immunoprecipitation
Cells were rinsed twice with ice-cold PBS and lysed in ice-cold lysis buffer (50 mM Hepes-KOH, pH 7.4, 2 mM EDTA, 10 mM pyrophosphate, and 1% NP40 alternative, in addition to 0.5 mM sodium orthovanadate, 16 mM sodium fluoride, and 1 tablet of EDTA-free protease inhibitors [Roche] per 50 ml). The soluble fractions of cell lysates were isolated by centrifugation (13,000 rpm for 10 min) in a microfuge. Flag M2 affinity resins (Sigma-Aldrich) were washed with lysis buffer three times, and then 30 µl of a 50% slurry of the resins was added to the cleared cell lysates and incubated with rotation for 3 h at 4°C. For MS analysis, the beads were washed three times with (50 mM Hepes-KOH, pH 7.4, 2 mM EDTA, 10 mM pyrophosphate, and 150 mM NaCl) and kept as dry beads (−80°C). For Western blot, the beads were washed with lysis buffer containing 150 mM NaCl, and the FLAG-tagged proteins were eluted from the beads by incubation in elution buffer (50 mM Hepes-KOH, pH 7.4, 2 mM EDTA, 10 mM pyrophosphate, 150 mM NaCl, 1% NP40 alternative, and 100 µg/ml FLAG peptide [Sigma-Aldrich]) for 1 h at 30°C with shaking. Immunoprecipitated proteins were denatured by the addition of 150 µl of SDS sample buffer (5×) and boiling for 5 min, resolved by 10% SDS-PAGE, and analyzed by immunoblotting as described.
Sample preparation for MS analysis
After washing, the packed beads were resuspended in 100 μl of 8 M urea, 10 mM DTT, and 25 mM Tris-HCl, pH 8.0, and incubated for 30 min at 22°C. Next, iodoacetamide (55 mM) was added, and beads were incubated for 30 min (22°C, in the dark), followed by addition of DTT (20 mM). The urea was diluted by the addition of seven volumes of 25 mM Tris-HCl, pH 8.0. Trypsin was added (0.3 μg/sample), and the beads were incubated overnight at 37°C with gentle agitation. The beads were spun down, and the peptides in the supernatants were desalted on C18 homemade Stage tips.
Nano-LC-MS/MS analysis
MS analysis was performed using a Q Exactive Plus mass spectrometer (Thermo Fisher Scientific) coupled online to a nanoflow UHPLC instrument, Ultimate 3000 Dionex (Thermo Fisher Scientific). Peptides (1.0 μg, as estimated by OD at 280 nm) were separated over a nonlinear 90-min gradient (0–80% acetonitrile) run at a flow rate of 0.3 μl/min on a reverse-phase 25-cm-long C18 column (75 μm internal diameter, 2 μm, 100 Å; Thermo PepMapRSLC). The survey scans (380–2,000 m/z, target value 3E6 charges, maximum ion injection times 50 ms) were acquired and followed by higher-energy collisional dissociation–based fragmentation (normalized collision energy 20, 25, and 30). A resolution of 70,000 was used for survey scans, and ≤15 dynamically chosen most abundant precursor ions with “peptide preferable” profile were fragmented (isolation window 1.8 m/z). The MS/MS scans were acquired at a resolution of 17,500 (target value 1E5 charges, maximum ion injection times 120 ms). Dynamic exclusion was 60 s. Data were acquired using Xcalibur software (Thermo Fisher Scientific). The column was washed with 80% acetonitrile and 0.1% formic acid for 25 min between samples to avoid a carryover.
MS data analysis
MS data were processed using the MaxQuant computational platform, v1.5.3.12. Peak lists were searched against translated coding sequences of the human proteome obtained from Uniprot. The search included cysteine carbamidomethylation as a fixed modification, and phosphorylation (S, T, Y) and oxidation of methionine as variable modifications, allowing up to two miscleavages. The match-between-runs option was used. Peptides with a length of at least seven amino acids were considered, and the required false discovery rate (FDR) was set to 1% at the peptide and protein level. Protein identification requires at least two unique or razor peptides per protein. Relative protein quantification in MaxQuant was performed using the label-free quantification algorithm. Protein contaminants and proteins identified by fewer than two peptides were excluded from the analysis.
Fluorescence microscopy
MDA-MB-231 cells (1.5 × 10⁵) were seeded on polylysine-coated glass coverslips in 12-well tissue culture plates. After 24 h, the slides were gently rinsed twice with PBS (with calcium and magnesium salts) and fixed. Cells stained with Ezrin antibody were fixed with ice-cold absolute methanol for 5 min, while cells stained with Phalloidin-iFluor 555 Reagent (ab176756; Abcam) were fixed with 4% PFA in PBS for 10–15 min at room temperature, followed by quenching with ammonium chloride (1% in PBS) or 0.3 M glycine. The slides were then rinsed three times with PBS, and cells were permeabilized with 0.1% Triton X-100 in PBS for 10 min. Next, the cells were gently rinsed three times with PBS and subsequently incubated for 30 min in the blocking buffer (1% BSA in PBST), followed by primary antibodies for 1 h (DPYSL2 and vimentin 1:200 each in 1% BSA in TBST) at room temperature, except for Ezrin antibody (1:50) which was incubated overnight at in 4°C. Next, the cells were rinsed three times with PBS, incubated with secondary antibodies (diluted 1:200 in 1% BSA in TBST) and Phalloidin-iFluor 555 Reagent (diluted 1:5,000) for 1 h at room temperature in the dark and washed three times with PBS. Slides were mounted on glass coverslips using Vectashield (Vector Laboratories). The cells were imaged on Nikon Spinning Disk/high content screening system using the 60× (NA 0.95, dry, CFI Plan-Apochromat Lambda) and 100× (NA 1.4, oil, Plan-Apochromat) lenses. This microscope is equipped with a Yokogawa W1 Spinning Disk, two SCMOS ZYLA cameras, and 405-, 488-, 561-, and 638-nm lasers. The 20× (NA 0.5, dry, WD 2.1 mm, pH 1) images were acquired using the Eclipse NI-U upright microscope (Nikon), equipped with DS-QI2 MONO cooled digital microscope camera 16 MP. The image analyses were done using NIS Elements software package for multidimensional experiments and exported as 16 bit. The pictures were slightly adjusted (levels) using Adobe Photoshop.
Statistical analysis
Data are shown as mean ± SD from at least three independent biological experiments. All statistical analyses were performed using R (v4.0) or GraphPad Prism (v8.0) statistical analysis programs. If not indicated otherwise, all the P values in the figures measured between the indicated samples were quantified using the unpaired two-tailed Student’s t test. Data distribution was assumed to be normal but was not formally tested. The significance of the mean comparison is present in each figure.
Online supplemental material
Fig. S1 shows that DPYSL2 expression is elevated in mesenchymal-like cells. Fig. S2 shows that DPYSL2 loss inhibits cell migration in breast cancer cell lines. Fig. S3 shows that DPYSL2 loss affects tumor formation and metastasis in mice. Fig. S4 shows that DPYSL2 interacts with JAK1 and regulates STAT3 signaling. Fig. S5 shows that overexpressing CA-STA3 and vimentin in WT cells does not affect migration. Fig. S6 shows that DPYSL2 is involved in arranging the lamellipodia structure. Table S1 shows the CEL-Seq results of WT and DPYSL2-KO cells. Table S2 shows a Metascape analysis of proteins binding to DPYSL2. Table S3 shows a list of STAT3 target genes and their expression in WT and DPYSL2-KO cells obtained from the CEL-Seq analysis.
Data availability
Protein MS analysis and CEL-Seq have been deposited in OSF under DOI 10.17605/OSF.IO/HRNUQ.
Acknowledgments
We thank the members of the Shaul laboratory. We thank Dr. William Breuer, Proteomics/Mass Spectrometry Unit, Institute of Life Sciences, Hebrew University of Jerusalem, for his help in the LC-MS experiments and analysis; Amina Jbara, Hebrew University, for assisting us with the animal experiments; Dr. Alexander Rouvinski, Hebrew University, for his help with fluorescence microscopy and for providing several reagents; Dr. Reuven Weiner for helpful discussions on DPYSL2 structure; and Dr. Jason Cantor, Morgridge Institute for Research, University of Wisconsin-Madison, for cloning DPYSL2.
This work was supported by the Israel Science Foundation (grants 1816/16 and 299/21), the Israel Cancer Research Fund RCDA fellowship, and the Hebrew University start-up funds. A. Abu Rmaileh is supported by the Brodie Fellowship for Breast Cancer Research. B. Solaimuthu is supported by the Lady Davis Fellowship for postdoctoral researchers at the Hebrew University of Jerusalem.
The authors declare no competing financial interests.
Author contributions: Conceptualization and methodology: A. Abu Rmaileh and Y.D. Shaul. Investigation: A. Abu Rmaileh, B. Solaimuthu, A. Khatib, M. Tanna, M. Ben Yosef, and M. Lichtenstein. Formal analysis: A. Hayashi and N. Pillar. Visualization: A. Abu Rmaileh and S. Lavi. Writing—original draft: A. Abu Rmaileh and Y.D. Shaul. Writing—review & editing: A. Abu Rmaileh and Y.D. Shaul. Funding acquisition: Y.D. Shaul.

