


Phosphatidylinositol 3,5-bisphosphate (PI(3,5)P2) is a low-abundance signaling lipid that plays crucial roles in various cellular processes, including endolysosomal system structure/function, stress response, and cell cycle regulation. PI(3,5)P2 synthesis increases in response to environmental stimuli, yet its behavior in cycling cells under basal conditions remains elusive. Here, we analyzed spatiotemporal changes in PI(3,5)P2 levels during the cell cycle of S. cerevisiae. We found that PI(3,5)P2 accumulates on the vacuole in the daughter cell while it disappears from the vacuole in the mother cell during mitosis. Concomitant with the changes in PI(3,5)P2 distribution, the daughter vacuole became more acidic, whereas the acidity of the mother vacuole decreased during mitosis. Our data further showed that both PI(3,5)P2 and the PI(3,5)P2 effector protein Atg18 are determinants of vacuolar-pH asymmetry and acidity. Our work, thus, identifies PI(3,5)P2 as a key factor for the establishment of vacuolar-pH asymmetry, providing insights into how the mother cell ages while the daughter cell is rejuvenated.

Introduction
Phosphorylated phosphatidylinositol lipids (PIPs) are signaling lipids that serve as master regulators of multiple cellular processes. Phosphatidylinositol-3,5-bisphosphate (PI(3,5)P2) constitutes one of the least abundant and least understood PIPs. Being a PIP of the endolysosomal system, PI(3,5)P2 plays critical roles in diverse aspects of cell biology such as membrane trafficking, stress response, vacuole/lysosome structure/function, and cell cycle regulation (Han and Emr, 2011; Huda et al., 2023; Jin et al., 2014; Jin and Weisman, 2015; McCartney et al., 2014a, 2014b; Rutherford et al., 2006).
PI(3,5)P2 is synthesized through phosphorylation of the phosphatidylinositol 3-phosphate (PI3P) by the PI3P-5 kinase, PIKfyve in humans and Fab1 in yeast (Gary et al., 1998; Sbrissa et al., 1999). In human cells, PIKfyve localizes at endolysosomal membranes (early, late, and recycling endosomes, and lysosomes), predominantly on recycling endosomes (Giridharan et al., 2022). In yeast, Fab1 predominantly decorates the membrane of the vacuole (yeast lysosomes) and localizes to some extent on signaling endosomes (Chen et al., 2021). On these membranes, PIKfyve/Fab1 resides within a protein complex composed of conserved proteins namely Vac14 (ArPIKfyve in humans) and Fig4 (Sac3 in humans) required for PIKfyve/Fab1 function (Barlow-Busch et al., 2023; Dove et al., 2002; Duex et al., 2006a; Lees et al., 2020). In yeast, additionally, a vacuolar membrane protein named Vac7 is part of the Fab1 complex and has an essential role in PI(3,5)P2 synthesis (Duex et al., 2006a, 2006b).
Under basal conditions, PI(3,5)P2 levels are scarce; however, PI(3,5)P2 abundance increases suddenly in response to environmental stimuli such as insulin treatment in mammalian cells and hyperosmotic shock in budding yeast (Bridges et al., 2012; Duex et al., 2006a; Jones et al., 1999; McCartney et al., 2014b; Sbrissa et al., 1999; Sbrissa and Shisheva, 2005; Tsujita et al., 2004). This is best observed in budding yeast, in which PI(3,5)P2 levels rise rapidly and transiently up to 20-fold upon hyperosmotic shock (Dove et al., 1997; Duex et al., 2006a). The abrupt response of PI(3,5)P2 synthesis to hyperosmotic shock made the budding yeast a great model for understanding PI(3,5)P2 regulation and function under hypertonic conditions. A growing body of evidence, however, suggests that PI(3,5)P2 also functions in cycling cells under basal conditions (Huda et al., 2023; Jin et al., 2014, 2022; Jin and Weisman, 2015). Nevertheless, low levels of PI(3,5)P2 and the lack of a well-established biosensor for in vivo detection of PI(3,5)P2 have been obstacles to the study of PI(3,5)P2 under isotonic conditions. In yeast, vacuolar localization of the PI(3,5)P2 binding protein Atg18, which is similar to WD-repeat protein interacting phosphoinositides (WIPI) proteins in mammals, was shown to correlate well with Fab1 activity (Dove et al., 2004; Efe et al., 2007; Gopaldass et al., 2017). Yet, Atg18 also binds to PI3P (Busse et al., 2015), and the Atg18 mutant that only binds PI(3,5)P2 but not to PI3P (Atg18-Sloop) has also reduced binding to PI(3,5)P2 (Gopaldass et al., 2017), challenging its use as an in vivo sensor. Recently, a new probe, SnxA from Dictyostelium discoideum was identified as an extremely selective PI(3,5)P2-binding protein (Vines et al., 2023). Its use as a PI(3,5)P2 reporter was characterized in mammalian cells and in D. discoideum (Vines et al., 2023), which now provides the means to study PI(3,5)P2 under basal conditions.
In this study, using SnxA and Atg18 as in vivo probes for PI(3,5)P2, we found that PI(3,5)P2 is asymmetrically present on yeast vacuoles during mitosis. PI(3,5)P2 accumulated on the membrane of the vacuole that resided in the daughter cell, while it disappeared from the vacuole that stayed in the mother cell. Asymmetry of PI(3,5)P2 was established shortly before anaphase onset, maintained during anaphase, and diminished with mitotic exit. PI(3,5)P2 precursor PI3P and Fab1-complex components were symmetrically present on the mother and daughter vacuoles, whereas expression of a hyperactive FAB1 allele caused symmetric distribution of PI(3,5)P2, suggesting that asymmetric PI(3,5)P2 production is controlled at the level of Fab1 activity rather than the levels of the precursor or Fab1-complex proteins. Employing a ratiometric in vivo vacuolar-pH sensor, we observed that the pH dropped in the daughter vacuole, while increased in the mother vacuole, concomitant with changes in PI(3,5)P2 distribution during mitosis. We further showed that the asymmetry of PI(3,5)P2 and the PI(3,5)P2 effector Atg18 determine the asymmetry of vacuolar pH.
Results and discussion
Yeast codon–optimized SnxA can be used as an in vivo sensor for PI(3,5)P2 in budding yeast
To monitor PI(3,5)P2 in budding yeast, we made use of the recently identified genetically coded PI(3,5)P2 sensor SnxA, which was tested in mammalian cells and amoebae (Vines et al., 2023). To address whether SnxA would work as an in vivo PI(3,5)P2 sensor in budding yeast, first, we constructed yeast codon–optimized SnxA C terminally fused with GFP and expressed under TEF1 promoter. Expression of SnxA-GFP integrated into the yeast genome did not alter the vacuole size or cell growth, indicating that SnxA expression does not interfere with PI(3,5)P2 function (Fig. S1, A–C). SnxA-GFP colocalized with the vacuolar membrane marker Vph1-3xmCherry in wildtype yeast cells, assessed by Pearson correlation coefficient (PCC) (Fig. 1 A) (Stauffer et al., 2018). Colocalization was lost in the absence of the PI 5-kinase FAB1, VAC7, or VAC14, which are essential for PI(3,5)P2 synthesis (Fig. 1 A). Thus, we conclude that SnxA vacuole membrane localization is PI(3,5)P2 dependent in budding yeast. In line with this notion, SnxA colocalization with Vph1 increased in cells expressing a hyperactive Fab1 allele (fab1-ha, fab1-14) (Duex et al., 2006b), which leads to the overproduction of PI(3,5)P2 (Fig. 1 B). Likewise, fab-ha expression fully rescued the loss of SnxA vacuole localization in vac14∆ cells and markedly increased SnxA colocalization with Vph1 in vac7∆ cells (Fig. 1 B), which is consistent with fab-ha rescue of PI(3,5)P2 levels in these cells (Duex et al., 2006b; Gary et al., 2002).
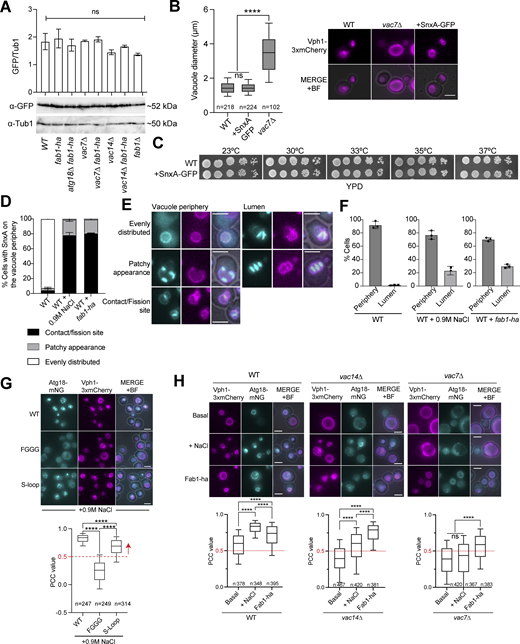
Properties of SnxA-GFP and Atg18-mNG as in vivo PI(3,5)P2sensors. (A) SnxA-GFP expression levels in different strains. A representative immunoblot is shown in the bottom. Tub1 was used as a loading control. The graph on the top of each band shows the average of anti-GFP to anti-Tub1 band intensity ratios from four experiments. Error bars: standard error of the mean. Strains used: MHY286, MHY288, MHY293, MHY304, MHY305, MHY303, MHY302, and AAY007. (B) Box-and-whisker graph and representative images of vacuole diameters in wildtype (WT), vac7∆, and SnxA-GFP containing yeast cells (BBY070, MHY286, and SEY256). Data shown come from three independent experiments. Boxes show 25th and 75th percentiles, whiskers indicate 10th and 90th percentiles, and the line in the boxes represents the median. Ordinary one-way ANOVA was performed with Fisher’s least significant difference (LSD) test. ****P < 0.0001, ns: non-significant with P = 0.7079. Scale bars: 3 μm. BF: bright field. (C) Spot assays that show growth of cells with (+SnxA-GFP) or without SnxA-GFP. Serial dilutions of indicated strains (ESM356-1 and MHY286) were spotted on YPD plates and incubated at indicated temperatures. (D–F) Vacuolar localization patterns of SnxA. SnxA-GFP is shown in cyan, Vph1-3xmCherry is shown in magenta. (G) Analysis Atg18-mNG colocalization with Vph1-3xmCherry upon hyperosmotic shock. Atg18, Atg8-Sloop mutant, and Atg18-FGGG mutant C-terminally fused with mNG were analyzed (MUK089, MUK090, and MUK091). Atg18-FGGG mutant served as a negative control for vacuole periphery localization. The PCC value of 0.5, indicated with a red dashed line, was selected as a threshold for vacuole membrane localization based on the PCC data of Atg18-FGGG. Data come from two independent experiments. (H) Atg18-mNG vacuole localization reflects PI(3,5)P2 levels. PI(3,5)P2 levels were manipulated through the use of mutants that are deficient in PI(3,5)P2 (vac7∆ and vac14∆), as well as through the use of fab1-ha and 0.9 M NaCl treatment in combination with wildtype and vac7∆ and vac14∆ mutants. PCC values of mNG and Vph1-3xmCherry colocalization were plotted, and representative images were also shown. Analyzed strains: MUK089, MUK098, MUK081, MUK113, MUK080, and MUK110. Data come from three independent experiments. In box-and-whiskers graphs, boxes show the 25th and 75th percentiles, whiskers point to the 10th and 90th percentile, and the line in the boxes represents the median. In G and H, ordinary one-way ANOVA was performed with Fisher’s LSD test. ****P < 0.0001, and ns: non-significant with P = 0.9908. Scale bars are 3 μm. Source data are available for this figure: SourceData FS1.
Properties of SnxA-GFP and Atg18-mNG as in vivo PI(3,5)P2sensors. (A) SnxA-GFP expression levels in different strains. A representative immunoblot is shown in the bottom. Tub1 was used as a loading control. The graph on the top of each band shows the average of anti-GFP to anti-Tub1 band intensity ratios from four experiments. Error bars: standard error of the mean. Strains used: MHY286, MHY288, MHY293, MHY304, MHY305, MHY303, MHY302, and AAY007. (B) Box-and-whisker graph and representative images of vacuole diameters in wildtype (WT), vac7∆, and SnxA-GFP containing yeast cells (BBY070, MHY286, and SEY256). Data shown come from three independent experiments. Boxes show 25th and 75th percentiles, whiskers indicate 10th and 90th percentiles, and the line in the boxes represents the median. Ordinary one-way ANOVA was performed with Fisher’s least significant difference (LSD) test. ****P < 0.0001, ns: non-significant with P = 0.7079. Scale bars: 3 μm. BF: bright field. (C) Spot assays that show growth of cells with (+SnxA-GFP) or without SnxA-GFP. Serial dilutions of indicated strains (ESM356-1 and MHY286) were spotted on YPD plates and incubated at indicated temperatures. (D–F) Vacuolar localization patterns of SnxA. SnxA-GFP is shown in cyan, Vph1-3xmCherry is shown in magenta. (G) Analysis Atg18-mNG colocalization with Vph1-3xmCherry upon hyperosmotic shock. Atg18, Atg8-Sloop mutant, and Atg18-FGGG mutant C-terminally fused with mNG were analyzed (MUK089, MUK090, and MUK091). Atg18-FGGG mutant served as a negative control for vacuole periphery localization. The PCC value of 0.5, indicated with a red dashed line, was selected as a threshold for vacuole membrane localization based on the PCC data of Atg18-FGGG. Data come from two independent experiments. (H) Atg18-mNG vacuole localization reflects PI(3,5)P2 levels. PI(3,5)P2 levels were manipulated through the use of mutants that are deficient in PI(3,5)P2 (vac7∆ and vac14∆), as well as through the use of fab1-ha and 0.9 M NaCl treatment in combination with wildtype and vac7∆ and vac14∆ mutants. PCC values of mNG and Vph1-3xmCherry colocalization were plotted, and representative images were also shown. Analyzed strains: MUK089, MUK098, MUK081, MUK113, MUK080, and MUK110. Data come from three independent experiments. In box-and-whiskers graphs, boxes show the 25th and 75th percentiles, whiskers point to the 10th and 90th percentile, and the line in the boxes represents the median. In G and H, ordinary one-way ANOVA was performed with Fisher’s LSD test. ****P < 0.0001, and ns: non-significant with P = 0.9908. Scale bars are 3 μm. Source data are available for this figure: SourceData FS1.

PI(3,5)P 2 sensor SnxA indicates daughter vacuole-specific PI(3,5)P 2 synthesis during late mitosis. (A–C) Analysis of SnxA-GFP colocalization with the vacuolar marker Vph1-3xmCherry using still images of log-phase cell populations. Box-and-whisker plots of PCC and representative still images are presented. PCC values were obtained using the EzColocalization plugin in ImageJ by selecting the vacuoles based on Vph1-3xmCherry as a vacuole marker (see Materials and methods for details). PCC provides a metric for the likelihood of co-existence of SnxA-GFP and Vph1-3xmCherry signals in the given area, thus objectively assessing colocalization. Data shown are a comparison of wildtype cells (WT) and PI(3,5)P2-deficient mutants (MHY286, MHY304, MHY302, and AAY007) in A, comparison of these cells (−) with cells expressing fab1-ha (MHY286, MHY288, MHY304, MHY305, MHY302, and MHY303) in B, and comparison of basal conditions (−) with hyperosmotic shock conditions (+) in C. Experiments shown in A–C were performed together, thus the controls (WT, vac7∆, vac14∆, and fab1∆) are identical in all graphs. In box-and-whisker plots, boxes extend from the 25th to 75th percentiles. Lines inside the boxes are the median. Whiskers point to the 10th and 90th percentiles. Ordinary one-way ANOVA was performed with Fisher’s LSD test. ****P < 0.0001, ns: non-significant with P ≥ 0.1. n: sample size. Data shown come from four independent experiments. (D and E) Analysis of the effect of hyperosmotic shock on SnxA-GFP vacuole periphery localization through time-lapse microscopy. Mean PCC values of SnxA-GFP and Vph1-3xmCherry during the time-lapse series are plotted (E) along with images from selected time points of representative cells (D). The graph represents the mean of PCC values obtained from 20 cells (MHY286) subjected to 0.9 M NaCl treatment. Error bars show the standard error of the mean. Red arrows indicate the time point of NaCl addition to the culture dish. Scale bars: 3 μm, BF: bright field. (F) Box-and-whisker plots showing PCC values of SnxA-GFP colocalization with the vacuolar marker Vph1-3xmCherry on the mother vacuole (MV) and daughter vacuole (DV) in log-phase WT cells (MHY286) with segregated vacuoles. Boxes show the 25th to 75th percentiles, whiskers point to the 10th and 90th percentiles, and lines inside the boxes are the median. See Fig. 1 A for representative images. An unpaired two-tailed t test was performed. ****P < 0.0001. Data shown come from three independent experiments. (G and H) Time-lapse microscopy analysis of the SnxA-GFP localization at the vacuole periphery during the cell cycle of WT cells (MHY286). Image series of selected time points from a representative cell is shown in B. Time-dependent changes in PCC values of SnxA-GFP colocalization with the vacuolar marker Vph1-3xmCherry on the mother and daughter vacuoles are shown in the graph (H). The graph represents the mean of individual cells aligned with respect to the end of vacuole segregation (t = 0). Error bars are the standard error of the mean. The white arrow in G indicates the completion of vacuole segregation (t = 0). The periods in which PI(3,5)P2 asymmetry increases (increases), reduces (red.), and disappears are indicated on the graph. Data come from two independent experiments. (I and J) Analysis of SnxA-GFP localization on the mother and daughter vacuole periphery with respect to the timing of SnxA-GFP signal appearance on the daughter vacuole (DV) relative to the end of vacuole segregation (t = 0) (I), and the duration of SnxA-GFP localization on the mother vacuole (MV) and daughter vacuole (DV) periphery (J). Circles on scatter plots indicate measurements of individual cells. Black lines in scatter blots are mean and standard deviation. Data come from two independent experiments. (K) Time-lapse microscopy-based analysis of SnxA-mCherry localization with respect to spindle elongation in WT cells containing GFP-Tub1 (MHY295). Selected time points from a representative cell are shown. White arrow marks the time point of anaphase onset (t = 0) designated by the start of fast spindle elongation. Yellow arrow marks the timing of spindle breakdown as an indicative of mitotic exit. The graph shows the timing of SnxA-mCherry accumulation on the daughter vacuole (arrival at DV) with respect to the anaphase onset (t = 0), and SnxA-mCherry disappearance from the daughter vacuole (departure from DV) with respect to the spindle breakdown (t = 20). Scale bars: 3 μm. n: sample size. m: mother, d: daughter.
PI(3,5)P 2 sensor SnxA indicates daughter vacuole-specific PI(3,5)P 2 synthesis during late mitosis. (A–C) Analysis of SnxA-GFP colocalization with the vacuolar marker Vph1-3xmCherry using still images of log-phase cell populations. Box-and-whisker plots of PCC and representative still images are presented. PCC values were obtained using the EzColocalization plugin in ImageJ by selecting the vacuoles based on Vph1-3xmCherry as a vacuole marker (see Materials and methods for details). PCC provides a metric for the likelihood of co-existence of SnxA-GFP and Vph1-3xmCherry signals in the given area, thus objectively assessing colocalization. Data shown are a comparison of wildtype cells (WT) and PI(3,5)P2-deficient mutants (MHY286, MHY304, MHY302, and AAY007) in A, comparison of these cells (−) with cells expressing fab1-ha (MHY286, MHY288, MHY304, MHY305, MHY302, and MHY303) in B, and comparison of basal conditions (−) with hyperosmotic shock conditions (+) in C. Experiments shown in A–C were performed together, thus the controls (WT, vac7∆, vac14∆, and fab1∆) are identical in all graphs. In box-and-whisker plots, boxes extend from the 25th to 75th percentiles. Lines inside the boxes are the median. Whiskers point to the 10th and 90th percentiles. Ordinary one-way ANOVA was performed with Fisher’s LSD test. ****P < 0.0001, ns: non-significant with P ≥ 0.1. n: sample size. Data shown come from four independent experiments. (D and E) Analysis of the effect of hyperosmotic shock on SnxA-GFP vacuole periphery localization through time-lapse microscopy. Mean PCC values of SnxA-GFP and Vph1-3xmCherry during the time-lapse series are plotted (E) along with images from selected time points of representative cells (D). The graph represents the mean of PCC values obtained from 20 cells (MHY286) subjected to 0.9 M NaCl treatment. Error bars show the standard error of the mean. Red arrows indicate the time point of NaCl addition to the culture dish. Scale bars: 3 μm, BF: bright field. (F) Box-and-whisker plots showing PCC values of SnxA-GFP colocalization with the vacuolar marker Vph1-3xmCherry on the mother vacuole (MV) and daughter vacuole (DV) in log-phase WT cells (MHY286) with segregated vacuoles. Boxes show the 25th to 75th percentiles, whiskers point to the 10th and 90th percentiles, and lines inside the boxes are the median. See Fig. 1 A for representative images. An unpaired two-tailed t test was performed. ****P < 0.0001. Data shown come from three independent experiments. (G and H) Time-lapse microscopy analysis of the SnxA-GFP localization at the vacuole periphery during the cell cycle of WT cells (MHY286). Image series of selected time points from a representative cell is shown in B. Time-dependent changes in PCC values of SnxA-GFP colocalization with the vacuolar marker Vph1-3xmCherry on the mother and daughter vacuoles are shown in the graph (H). The graph represents the mean of individual cells aligned with respect to the end of vacuole segregation (t = 0). Error bars are the standard error of the mean. The white arrow in G indicates the completion of vacuole segregation (t = 0). The periods in which PI(3,5)P2 asymmetry increases (increases), reduces (red.), and disappears are indicated on the graph. Data come from two independent experiments. (I and J) Analysis of SnxA-GFP localization on the mother and daughter vacuole periphery with respect to the timing of SnxA-GFP signal appearance on the daughter vacuole (DV) relative to the end of vacuole segregation (t = 0) (I), and the duration of SnxA-GFP localization on the mother vacuole (MV) and daughter vacuole (DV) periphery (J). Circles on scatter plots indicate measurements of individual cells. Black lines in scatter blots are mean and standard deviation. Data come from two independent experiments. (K) Time-lapse microscopy-based analysis of SnxA-mCherry localization with respect to spindle elongation in WT cells containing GFP-Tub1 (MHY295). Selected time points from a representative cell are shown. White arrow marks the time point of anaphase onset (t = 0) designated by the start of fast spindle elongation. Yellow arrow marks the timing of spindle breakdown as an indicative of mitotic exit. The graph shows the timing of SnxA-mCherry accumulation on the daughter vacuole (arrival at DV) with respect to the anaphase onset (t = 0), and SnxA-mCherry disappearance from the daughter vacuole (departure from DV) with respect to the spindle breakdown (t = 20). Scale bars: 3 μm. n: sample size. m: mother, d: daughter.
It is well established by biochemical methods that the amount of PI(3,5)P2 increased drastically but transiently in response to hyperosmotic shock in budding yeast (Dove et al., 1997; Duex et al., 2006a) such that within 5 min after hyperosmotic shock (0.9 M NaCl treatment) PI(3,5)P2 levels increase ∼20 fold, elevated PI(3,5)P2 persists for ∼10 min, after which it starts decreasing, and restores near basal levels ∼30 min after initial exposure to hyperosmotic shock (Duex et al., 2006a). Hence, to capture the condition with high PI(3,5)P2 levels, we measured SnxA-GFP vacuole periphery localization ∼10 min after 0.9 M NaCl treatment. SnxA colocalization with Vph1 increased dramatically upon hyperosmotic shock of logarithmically growing wildtype cells (Fig. 1 C). Salt treatment also caused an increase in SnxA-GFP vacuole periphery localization in vac14∆ cells but not in vac7∆ and fab1∆ (Fig. 1 C), which aligns with previous data that hyperosmotic shock triggers PI(3,5)P2 production in vac14∆ cells, albeit at a low level, but not in vac7∆ and fab1∆ cells (Duex et al., 2006a). We further quantified SnxA vacuole localization upon hyperosmotic shock through time-lapse microscopy. Colocalization of SnxA-GFP with Vph1-3xmCherry prominently increased within the first 2 min following hyperosmotic shock (Fig. 1, D and E; and Video 1). High levels of SnxA colocalization with Vph1 were maintained for ∼7 min, after which it started decreasing (Fig. 1, D and E). Colocalization was diminished ∼30 min after the hyperosmotic shock (Fig. 1, D and E) in a similar manner measured by biochemical methods (Duex et al., 2006a).
Time-lapse movie of SnxA-GFP Vph1-3xmCherry–containing yeast strain (MHY286) upon 0.9 M NaCl treatment between the first and second timepoints. The channels from left to right are GFP, mCherry, and merge. Frame rate is seven frames per second.
Time-lapse movie of SnxA-GFP Vph1-3xmCherry–containing yeast strain (MHY286) upon 0.9 M NaCl treatment between the first and second timepoints. The channels from left to right are GFP, mCherry, and merge. Frame rate is seven frames per second.
We further observed that SnxA vacuole localization slightly differed in cells under basal conditions and under hyperosmotic shock as well as in cells expressing fab1-ha. While the wildtype cells under basal conditions had SnxA mostly homogenously decorating the vacuole periphery, upon hyperosmotic shock or fab1-ha expression, SnxA-GFP became concentrated on vacuole–vacuole contact sites and/or fission sites (contact/fission, Fig. S1, D and E) or appeared more concentrated on some parts of the vacuole (patchy appearance, Fig. S1, D and E), supporting the role of PI(3,5)P2 in vacuole fission. Notably, under hyperosmotic shock conditions and in cells expressing fab1-ha, we also noticed that ∼20% of the cells had strong SnxA-GFP signal in the vacuolar lumen in addition to the SnxA signal at the vacuole periphery (Fig. S1, E and F), which may indicate additional presence of PI(3,5)P2 on vacuolar membranes that lacked the Vph1 signal or on other membranes (i.e., autophagic vesicles).
Taken together, these data establish that SnxA can be used as an in vivo sensor for PI(3,5)P2 in budding yeast, similar to its usage in amoeba and mammalian cells (Vines et al., 2023).
More PI(3,5)P2 is present on the daughter vacuole during yeast mitosis
While assessing SnxA-GFP colocalization with Vph1-3xmCherry, we noticed that in cells with segregated vacuoles, SnxA-GFP localization on the vacuole periphery was asymmetric, with a strong preference to localize on the vacuole that resides in the daughter cell compartment (daughter vacuole) (Fig. 1, A and F). On the vacuole of the mother cells (mother vacuole), however, SnxA-GFP was barely detectable (Fig. 1, A and F).
Next, we asked when SnxA asymmetry was established. To this end, we performed time-lapse microscopy of Vph1-3xmCherry SnxA-GFP–containing cells. SnxA-GFP signal was low or undetectable on the vacuole during vacuole segregation to the daughter cell (Fig. 1, G and H). Within 3 min after completion of vacuole segregation (t = 0), SnxA-GFP accumulated on the daughter vacuole (Fig. 1 I and Video 2). SnxA-GFP signal persisted for ∼21 min at the daughter vacuole, after which the signal was greatly reduced (Fig. 1 J). Quantification of SnxA vacuole periphery localization dynamics revealed that SnxA asymmetry increased for ∼15–18 min after vacuole segregation (Fig. 1, G and H). During this time, SnxA localization on the daughter vacuole increased, whereas it was completely diminished from the mother vacuole (Fig. 1, G and H). After this period, SnxA localization to the daughter vacuole started to decrease, concomitant with a slight increase of SnxA localization on the mother vacuole, causing a decrease in the SnxA asymmetry (Fig. 1, G and H; and Video 2). Finally, SnxA localized weakly but equally on both vacuoles, reaching a nearly symmetric state (Fig. 1, G and H). Using GFP-Tub1 as a mitotic marker, we next addressed the timing of SnxA accumulation on the daughter vacuole with respect to the anaphase onset and mitotic exit. SnxA-mCherry appeared on the daughter vacuole 3 ± 2 min (mean ± SD) before anaphase onset and disappeared near mitotic exit (± 5 min) (Fig. 1 K and Video 3).
Time-lapse movie of SnxA-GFP Vph1-3xmCherry–containing yeast strain (MHY286). The channels from left to right are GFP, mCherry, and merge. Frame rate is seven frames per second.
Time-lapse movie of SnxA-GFP Vph1-3xmCherry–containing yeast strain (MHY286). The channels from left to right are GFP, mCherry, and merge. Frame rate is seven frames per second.
Time-lapse movie of SnxA-mCherry GFP-Tub1–containing yeast strain (MHY295). The channels from left to right are mCherry, GFP, and merge. Frame rate is seven frames per second.
Time-lapse movie of SnxA-mCherry GFP-Tub1–containing yeast strain (MHY295). The channels from left to right are mCherry, GFP, and merge. Frame rate is seven frames per second.
We thus conclude that PI(3,5)P2 is indeed synthesized in cycling cells under basal conditions. It peaks on the daughter vacuole during mitosis, whereas it disappears from the mother vacuole, creating an asymmetry. PI(3,5)P2 asymmetry is interrupted with mitotic exit.
Atg18 localization at the vacuole periphery correlates with PI(3,5)P2 levels and mimics SnxA localization
As an alternative way to measure PI(3,5)P2 levels on vacuolar membranes in living cells, we next analyzed the localization of Atg18, a known protein that binds PI(3,5)P2 with higher affinity, and PI3P with a lower affinity (Dove et al., 2004; Efe et al., 2007; Gopaldass et al., 2017; Takatori et al., 2016). PI(3,5)P2 binding pool of Atg18 associates with the vacuolar membrane (Gopaldass et al., 2017). In concordance with this, wildtype Atg18-mNeongreen (Atg18-mNG) colocalized with Vph1-3xmCherry in logarithmically growing cells upon hyperosmotic shock (Fig. S1 G). Atg18-SlooP mutant, which binds PI(3,5)P2 but not PI3P (Gopaldass et al., 2017), also colocalized with Vph1, whereas the Atg18-FGGG mutant that does not bind PI(3,5)P2 and PI3P (Gopaldass et al., 2017) failed to localize on the vacuolar membrane (Fig. S1 G). Atg18-mNG also colocalized with Vph1 under basal conditions (Fig. S1 H). Hyperosmotic shock or expression of fab1-ha increased colocalization of Atg18-mNG with Vph1 (Fig. S1 H), whereas, deletion of VAC7 or VAC14 diminished Atg18 vacuole periphery localization (Fig. S1 H). Similar to the results obtained using SnxA, fab1-ha rescued vacuole localization of Atg18 in both vac7∆ and vac14∆ cells, whereas salt treatment only rescued vacuole localization in vac14∆ (Fig. S1 H). Accordingly, we conclude that Atg18 localization at the vacuole periphery is indicative of PI(3,5)P2 levels. Furthermore, time-lapse analysis of Atg18-mNG colocalization with Vph1-3xmCherry yielded similar results to that of SnxA (Fig. 2). Atg18 explicitly localized to the vacuole that migrated to the daughter cell, but not to the vacuole that stayed in the mother cell in mitosis (Fig. 2, A and B; and Video 4) with similar timing as SnxA (Fig. 2, C–E). Thus, using two independent PI(3,5)P2 in vivo markers, Atg18 and SnxA, these results establish that PI(3,5)P2 is specifically present on the daughter vacuole of the yeast during mitosis, whereas it diminishes from the mother vacuole.

Atg18-mN G localizes predominantly to the daughter vacuole periphery. (A–D) Time-lapse microscopy–based analysis of Atg18-mNG vacuole periphery localization during the cell cycle in cells containing Vph1-3xmCherry (MUK089). Selected time points from a representative time-lapse series are shown (A) and mean PCC values of Atg18-mNG colocalization with Vph1-3xmCherry are plotted (B). Data are aligned with respect to the timing of vacuole segregation (t = 0) in B and the error bars show the standard deviation. White arrowhead in A indicates the end of vacuole segregation (t = 0). Timing of Atg18-mNG appearance on the daughter vacuole with respect to completion of vacuole segregation (C) and persistence of Atg18-mNG signal on both vacuoles (D) are plotted. Ordinary one-way ANOVA was performed with Fisher’s LSD test. ****P < 0.0001. Data come from three independent time-lapse experiments. (E) Atg18-mNG daughter vacuole localization with respect to the timing of anaphase onset and spindle breakdown in mCherry-Tub1–containing cells (MUK116). Time-lapse series of a representative cell are shown. Yellow arrowheads mark the start of anaphase onset and spindle breakdown, respectively. The graph shows Atg18-mNG signal appearance (arrival) and disappearance from the daughter vacuole (departure) relative to the timing of anaphase onset and spindle breakdown, respectively. Data come from two independent time-lapse experiments. Scale bars are 3 μm, n: sample size. DV: daughter vacuole, MV: mother vacuole. Circles in scatter plots are values of individual cells. Black lines in scatter plots represent the mean and standard deviation. m: mother, d: daughter.
Atg18-mN G localizes predominantly to the daughter vacuole periphery. (A–D) Time-lapse microscopy–based analysis of Atg18-mNG vacuole periphery localization during the cell cycle in cells containing Vph1-3xmCherry (MUK089). Selected time points from a representative time-lapse series are shown (A) and mean PCC values of Atg18-mNG colocalization with Vph1-3xmCherry are plotted (B). Data are aligned with respect to the timing of vacuole segregation (t = 0) in B and the error bars show the standard deviation. White arrowhead in A indicates the end of vacuole segregation (t = 0). Timing of Atg18-mNG appearance on the daughter vacuole with respect to completion of vacuole segregation (C) and persistence of Atg18-mNG signal on both vacuoles (D) are plotted. Ordinary one-way ANOVA was performed with Fisher’s LSD test. ****P < 0.0001. Data come from three independent time-lapse experiments. (E) Atg18-mNG daughter vacuole localization with respect to the timing of anaphase onset and spindle breakdown in mCherry-Tub1–containing cells (MUK116). Time-lapse series of a representative cell are shown. Yellow arrowheads mark the start of anaphase onset and spindle breakdown, respectively. The graph shows Atg18-mNG signal appearance (arrival) and disappearance from the daughter vacuole (departure) relative to the timing of anaphase onset and spindle breakdown, respectively. Data come from two independent time-lapse experiments. Scale bars are 3 μm, n: sample size. DV: daughter vacuole, MV: mother vacuole. Circles in scatter plots are values of individual cells. Black lines in scatter plots represent the mean and standard deviation. m: mother, d: daughter.
Time-lapse movie of Atg18-mNG–containing yeast strain (MUK089). The channels from left to right are mNG, mCherry, and merge. Frame rate is seven frames per second.
Time-lapse movie of Atg18-mNG–containing yeast strain (MUK089). The channels from left to right are mNG, mCherry, and merge. Frame rate is seven frames per second.
Levels of PI3P and Fab1-complex components are symmetrically distributed on the mother and daughter vacuole
We reasoned that the asymmetry of PI(3,5)P2 may stem from differential levels of its precursor, PI3P, on mother and daughter vacuoles. To understand whether this is the case, we monitored PI3P in living cells using the FYVE domain of mammalian Hrs (Gillooly et al., 2000; Obara et al., 2008). Unlike PI(3,5)P2, GFP-2xFYVE localized equally on mother and daughter vacuoles (Fig. 3 A). Thus, PI(3,5)P2 asymmetry is unlikely to be due to PI3P levels. Alternatively, PI(3,5)P2 asymmetry may stem from the asymmetric distribution of Fab1, Vac7, and Vac14 proteins, which altogether constitute the Fab1 complex. Nevertheless, unlike Atg18, neither of these proteins was asymmetrically distributed on mother and daughter vacuoles (Fig. 3 B), suggesting that it is the activity of the Fab1 rather than the levels of Fab1-complex proteins on vacuoles that determine the asymmetry of PI(3,5)P2. Supporting this hypothesis, expression of the hyperactive form of Fab1 (fab1-ha) resulted in not only an increment of PI(3,5)P2 levels but also promoted equal levels of PI(3,5)P2 on both vacuoles, breaking the PI(3,5)P2 asymmetry (Fig. 3 C). Similarly, the elevation of Fab1 activity by deletion of ATG18 (Efe et al., 2007) also disrupted PI(3,5)P2 asymmetry (Fig. 3 C). These results altogether support that mechanisms establishing PI(3,5)P2 asymmetry are likely to regulate Fab1-complex activity, but not the abundance of Fab1-complex proteins on the vacuole periphery or the precursor PI3P.

PI3P and Fab1-complex components localize symmetrically on the vacuole periphery. (A) Representative still images and PCC values showing EGFP-2xFYVE colocalization with the vacuolar marker Vph1-3xmCherry in WT cells (MHY252). Unpaired two-tailed t test was performed. n.s: non-significant with P = 0.9036. Data shown are from two independent experiments. (B) Representative still images and daughter vacuole to mother vacuole (DV/MV) ratio of Atg18, Atg18-Sloop, Fab1, Vac14, and Vac7 (MUK089, MUK091, SGY008, SGY009, and MUK117) are shown. The red dashed line marks the DV/MV value of 1, which indicates symmetric distribution on both vacuoles without a preference for a specific vacuole. See Materials and methods for details. (C) Representative still images and PCC values showing SnxA-GFP colocalization with Vph1-3xmCherry on the mother and daughter vacuoles of wildtype (WT) cells and fab1-ha or atg18∆ mutants (MHY286, MHY288, and MHY289). Data shown are from two independent experiments. In the box-and-whisker graphs, boxes show the 25th to 75th percentiles, whiskers show the 10th and 90th percentiles, and lines inside the boxes are the mean. In B and C, ordinary one-way ANOVA was performed with Fisher’s LSD test. ***P = 0.0002, ****P < 0.0001, ns: non-significant with P ≥ 0.7441. Scale bars are 3 μm. BF: bright field.
PI3P and Fab1-complex components localize symmetrically on the vacuole periphery. (A) Representative still images and PCC values showing EGFP-2xFYVE colocalization with the vacuolar marker Vph1-3xmCherry in WT cells (MHY252). Unpaired two-tailed t test was performed. n.s: non-significant with P = 0.9036. Data shown are from two independent experiments. (B) Representative still images and daughter vacuole to mother vacuole (DV/MV) ratio of Atg18, Atg18-Sloop, Fab1, Vac14, and Vac7 (MUK089, MUK091, SGY008, SGY009, and MUK117) are shown. The red dashed line marks the DV/MV value of 1, which indicates symmetric distribution on both vacuoles without a preference for a specific vacuole. See Materials and methods for details. (C) Representative still images and PCC values showing SnxA-GFP colocalization with Vph1-3xmCherry on the mother and daughter vacuoles of wildtype (WT) cells and fab1-ha or atg18∆ mutants (MHY286, MHY288, and MHY289). Data shown are from two independent experiments. In the box-and-whisker graphs, boxes show the 25th to 75th percentiles, whiskers show the 10th and 90th percentiles, and lines inside the boxes are the mean. In B and C, ordinary one-way ANOVA was performed with Fisher’s LSD test. ***P = 0.0002, ****P < 0.0001, ns: non-significant with P ≥ 0.7441. Scale bars are 3 μm. BF: bright field.
Asymmetry of vacuolar pH is established concomitant with PI(3,5)P2 asymmetry
Facilitating the assembly and activity of Vph1 containing vacuolar H+-ATPase (V-ATPase), PI(3,5)P2 functions in vacuole acidification (Banerjee et al., 2019; Li et al., 2014). Of importance, vacuolar pH also exhibits an asymmetric behavior between mother and daughter cells such that the daughter vacuole is more acidic than the mother vacuole already before cytokinesis (Henderson et al., 2014; Hughes and Gottschling, 2012). We thus asked whether daughter vacuole acidification coincides with PI(3,5)P2 accumulation on the daughter vacuole.
To assess vacuolar pH, we employed the v-SEP-mCherry ratiometric pH sensor in which the vacuole-targeted acid-sensitive fluorophore v-SEP is fused with pH-insensitive fluorophore mCherry (Okreglak et al., 2023). Consistent with the previous studies, vacuolar fluorescence intensity of v-SEP increased linearly from pH 5 to 8 (Okreglak et al., 2023) (Fig. S2 A), whereas the mean fluorescence intensity of mCherry remained nearly constant within this pH range (Fig. S2 B) (Botman et al., 2019). Accordingly, v-SEP/mCherry ratios exhibited a linear correlation in the 5–8 pH interval (Fig. S2 C), allowing usage of the v-SEP/mCherry ratios in our experiments to evaluate vacuolar pH in this range.

pH calibration curves and the effect of carbon source, amino acids, and Pho85 on SnxA localization. (A–C) pH sensitivity of v-SEP (A), mCherry (B), and pH calibration curve for v-SEP/mCherry (C). Pink shaded areas are where v-SEP intensity and v-SEP/mCherry ratios linearly correlate with pH. Green shaded area in C marks the v-SEP/mCherry ratios within the linear range. Data come from two independent experiments. In each experiment, at least 100 vacuoles were quantified per different pH. Error bars are standard deviation. Fitted lines were obtained with a simple linear regression model in prism. (D–F) Analysis of SnxA-GFP localization at the vacuole periphery with respect to the carbon source (D), amino acid supplementation (E), and the presence of Pho85 (F). Representative still images were shown and PCC values were plotted. Data come from three independent experiments. In box-and-whiskers graphs boxes show the 25th and 75th percentiles, whiskers point to the 10th and 90th percentile, and the line in the boxes represents the median. Ordinary one-way ANOVA was performed with Fisher’s LSD test. ****P < 0.0001. Scale bars are 3 μm. DV: daughter vacuole, MV: mother vacuole.
pH calibration curves and the effect of carbon source, amino acids, and Pho85 on SnxA localization. (A–C) pH sensitivity of v-SEP (A), mCherry (B), and pH calibration curve for v-SEP/mCherry (C). Pink shaded areas are where v-SEP intensity and v-SEP/mCherry ratios linearly correlate with pH. Green shaded area in C marks the v-SEP/mCherry ratios within the linear range. Data come from two independent experiments. In each experiment, at least 100 vacuoles were quantified per different pH. Error bars are standard deviation. Fitted lines were obtained with a simple linear regression model in prism. (D–F) Analysis of SnxA-GFP localization at the vacuole periphery with respect to the carbon source (D), amino acid supplementation (E), and the presence of Pho85 (F). Representative still images were shown and PCC values were plotted. Data come from three independent experiments. In box-and-whiskers graphs boxes show the 25th and 75th percentiles, whiskers point to the 10th and 90th percentile, and the line in the boxes represents the median. Ordinary one-way ANOVA was performed with Fisher’s LSD test. ****P < 0.0001. Scale bars are 3 μm. DV: daughter vacuole, MV: mother vacuole.
To address the timing of daughter vacuole acidification, we performed time-lapse microscopy of cells carrying v-SEP/mCherry. We quantified v-SEP/mCherry ratios in daughter and mother vacuoles separately, and with respect to the timing of vacuole segregation (Fig. 4 A and Video 5). Using our previous data that established dynamic changes of PI(3,5)P2 as a reference (Fig. 1 H), we compared the changes in v-SEP/mCherry ratio with the changes in PI(3,5)P2 asymmetry. Our results showed that shortly after the establishment of PI(3,5)P2 asymmetry, the pH of the daughter vacuole started to decrease rapidly, while the pH of the mother vacuole started to increase (Fig. 4 A). This suggests that acidification of the daughter vacuole follows elevation of PI(3,5)P2 levels on the daughter vacuole, whereas reduction of acidity of the mother vacuole follows the diminishment of PI(3,5)P2 on the mother vacuole. Supporting this view, concomitant with the reappearance of PI(3,5)P2 on the mother vacuole (Fig. 1 H, 18–24 min), the mother vacuole started to regain its acidity (Fig. 4 A, 18–24 min). Upon establishment of symmetric PI(3,5)P2, both mother and daughter vacuole pH exhibited similar behavior over time. However, the daughter vacuole remained more acidic than the mother vacuole. Our data thus show that the vacuolar pH is established soon after vacuole segregation and further indicates that changes in PI(3,5)P2 asymmetry correlate with changes in the vacuolar pH.

Asymmetry of PI(3,5)P 2 is critical for asymmetry of vacuolar pH. (A) Assessing relative acidity of mother and daughter vacuoles during the cell cycle of wildtype cells (MHY283). v-SEP-to-mCherry ratios (v-SEP/mCherry) of daughter and mother vacuoles serve as an in vivo pH sensor. The graph shows the mean v-SEP/mCherry ratios of five cells. Error bars are standard errors of the mean. Cells are aligned with respect to the end of vacuole segregation (t = 0). Selected time points from the time series of a representative cell are shown. White arrow marks the time of vacuole segregation (t = 0). The periods in which PI(3,5)P2 asymmetry increases (increases), reduces (red.), and disappears are indicated on the graph based on Fig. 1. Data come from two independent experiments. Scale bars: 3 μm. (B) Representative still images and box-and-whisker plots of v-SEP/mCherry ratios between mother and daughter vacuole in WT (MHY283), vac7∆ (MHY291), fab1-ha (MHY257), and vac7∆ fab1-ha (MHY296). Data shown are from two independent experiments. Boxes show 25th and 75th percentiles, whiskers indicate 10th and 90th percentiles, and the line in the boxes represents the median. Ordinary one-way ANOVA was performed with Fisher’s LSD test. ****P < 0.0001, **P = 0.0087, ns: non-significant with P ≥ 0.6617. Scale bar: 3 μm. BF: bright field, m: mother, d: daughter.
Asymmetry of PI(3,5)P 2 is critical for asymmetry of vacuolar pH. (A) Assessing relative acidity of mother and daughter vacuoles during the cell cycle of wildtype cells (MHY283). v-SEP-to-mCherry ratios (v-SEP/mCherry) of daughter and mother vacuoles serve as an in vivo pH sensor. The graph shows the mean v-SEP/mCherry ratios of five cells. Error bars are standard errors of the mean. Cells are aligned with respect to the end of vacuole segregation (t = 0). Selected time points from the time series of a representative cell are shown. White arrow marks the time of vacuole segregation (t = 0). The periods in which PI(3,5)P2 asymmetry increases (increases), reduces (red.), and disappears are indicated on the graph based on Fig. 1. Data come from two independent experiments. Scale bars: 3 μm. (B) Representative still images and box-and-whisker plots of v-SEP/mCherry ratios between mother and daughter vacuole in WT (MHY283), vac7∆ (MHY291), fab1-ha (MHY257), and vac7∆ fab1-ha (MHY296). Data shown are from two independent experiments. Boxes show 25th and 75th percentiles, whiskers indicate 10th and 90th percentiles, and the line in the boxes represents the median. Ordinary one-way ANOVA was performed with Fisher’s LSD test. ****P < 0.0001, **P = 0.0087, ns: non-significant with P ≥ 0.6617. Scale bar: 3 μm. BF: bright field, m: mother, d: daughter.
Time-lapse movie of v-SEP-mCherry–containing yeast strain (MHY283). The channels from left to right are v-SEP, mCherry, and merge. Frame rate is seven frames per second.
Time-lapse movie of v-SEP-mCherry–containing yeast strain (MHY283). The channels from left to right are v-SEP, mCherry, and merge. Frame rate is seven frames per second.
PI(3,5)P2 and its asymmetry are crucial for the asymmetry of vacuolar pH
To understand whether PI(3,5)P2 and its asymmetry are required for vacuole acidity and asymmetry of the vacuolar pH, we quantified v-SEP/mCherry ratios of daughter and mother vacuoles in the absence of PI(3,5)P2 (using vac7∆ cells) and under conditions that yield symmetric PI(3,5)P2 distribution (using fab1-ha expressing cells). Mother vacuole of wildtype cells had higher v-SEP/mCherry ratios than the daughter vacuoles (Fig. 4 B), consistent with previous reports (Henderson et al., 2014; Hughes and Gottschling, 2012) and our time-lapse data (Fig. 4 A). Deletion of VAC7 caused a remarkable increase in the pH of both vacuoles supporting the function of PI(3,5)P2 in vacuole acidity (Fig. 4 B). Intriguingly, VAC7 deletion also resulted in relatively less acidic daughter vacuoles than the mother vacuoles, a situation opposing wildtype cells. fab1-ha expression, however, caused more acidic vacuoles and symmetric distribution of pH among the daughter and mother vacuoles in wildtype cells (Fig. 4 B). Furthermore, vac7∆ cells expressing fab1-ha had symmetric vacuolar pH, while the overall vacuolar acidity resembled that of the daughter vacuole of the wildtype cells (Fig. 4 B). These data altogether support that PI(3,5)P2 is required for vacuole acidification and further suggest that asymmetry of PI(3,5)P2 is crucial for asymmetry of vacuolar pH.
PI(3,5)P2-mediated vacuole acidification largely depends on Atg18
Next, we analyzed the vacuolar pH in atg18∆ cells in which PI(3,5)P2 appears symmetric on the daughter and mother vacuoles (Fig. 3 C). However, unexpectedly, we observed that atg18∆ cells had overall more alkalinized vacuoles, and similar to vac7∆ cells, the asymmetry of vacuolar pH was reversed such that the mother vacuoles were more acidic than the daughter vacuoles (Fig. 5 A). Analysis of vacuolar pH in atg18∆ cells through time-lapse microscopy confirmed the reversed asymmetry of the vacuolar pH (Fig. 5 B and Video 6). Furthermore, vacuolar pH dynamics in the mother appeared more stable during mitosis in atg18∆ cells compared with the wildtype cells (Fig. 5 B), which is in support of a previous report (Okreglak et al., 2023). Thus, Atg18 is critical for vacuole acidity as well as asymmetry and dynamic aspects of vacuolar pH.

Vacuole acidity depends on Atg18 and its binding to PI3,5P2. (A) Representative still images and v-SEP/mCherry ratios of mother (MV) and daughter vacuoles (DV) in WT (MHY283) and atg18∆ (MHY277) cells. Data shown are from two independent experiments. (B) Analysis of vacuolar pH via time-lapse microscopy in atg18∆ cells (MHY277). Selected time points from the time series are shown. The graph represents the mean of v-SEP/mCherry ratios of mother and daughter vacuoles as a function of time. Data from individual cells are aligned with respect to the vacuole segregation. Error bars show the standard error of the mean. (C) Analysis of vacuolar pH in log-phase culture of WT (MHY283), atg18∆ (MHY277), Atg18-Sloop (MHY315), and Atg18-FGGG (MHY317) cells. Data come from two independent experiments. (D) Atg18-GFP vacuolar localization in cells with and without Vph1-GBP. Representative still images and the percentage of cells in which Atg18-GFP localizes on both vacuoles are shown (MHY223 and SEY082). Graph shows the mean of three independent experiments. Approximately 100 cells were counted per strain per experiment. Error bars: standard deviation. ****P < 0.0001 according to unpaired two-tailed t test. (E) Analysis of SnxA-mCherry vacuole periphery localization in cells carrying Vph1-GFP and Atg18-GFP Vph1-GBP (MHY285 and MHY297). (F) Effect of constitutive Atg18 targeting to both vacuoles (Atg18-GFP/GBP) on vacuolar pH (MHY283, MHY297, MHY291, and MHY312). Data shown come from two independent experiments. In box-and-whisker graphs, boxes show the 25th and 75th percentiles, whiskers indicate the 10th and 90th percentiles, and the line in the boxes represents the median. In A, C, E, and F, ordinary one-way ANOVA was performed with Fisher’s LSD test. ****P < 0.0001, **P ≤ 0.0093, ***P = 0.0004, and ns: non-significant with P ≥ 0.6580. Scale bars: 3 μm. BF: bright field. (G) Working model. PI(3,5)P2 accumulates on the vacuoles of the daughter cell while it is depleted from the vacuoles of the mother cell during mid-to-late mitosis. Concomitantly, the daughter cell’s vacuole becomes acidified and the acidity of the mother cell’s vacuole declines. Thus, the presence of PI(3,5)P2 in the daughter vacuole plays a role in the daughter cell’s rejuvenation, and the absence of PI(3,5)P2 from the mother vacuole leads to the mother cell’s aging.
Vacuole acidity depends on Atg18 and its binding to PI3,5P2. (A) Representative still images and v-SEP/mCherry ratios of mother (MV) and daughter vacuoles (DV) in WT (MHY283) and atg18∆ (MHY277) cells. Data shown are from two independent experiments. (B) Analysis of vacuolar pH via time-lapse microscopy in atg18∆ cells (MHY277). Selected time points from the time series are shown. The graph represents the mean of v-SEP/mCherry ratios of mother and daughter vacuoles as a function of time. Data from individual cells are aligned with respect to the vacuole segregation. Error bars show the standard error of the mean. (C) Analysis of vacuolar pH in log-phase culture of WT (MHY283), atg18∆ (MHY277), Atg18-Sloop (MHY315), and Atg18-FGGG (MHY317) cells. Data come from two independent experiments. (D) Atg18-GFP vacuolar localization in cells with and without Vph1-GBP. Representative still images and the percentage of cells in which Atg18-GFP localizes on both vacuoles are shown (MHY223 and SEY082). Graph shows the mean of three independent experiments. Approximately 100 cells were counted per strain per experiment. Error bars: standard deviation. ****P < 0.0001 according to unpaired two-tailed t test. (E) Analysis of SnxA-mCherry vacuole periphery localization in cells carrying Vph1-GFP and Atg18-GFP Vph1-GBP (MHY285 and MHY297). (F) Effect of constitutive Atg18 targeting to both vacuoles (Atg18-GFP/GBP) on vacuolar pH (MHY283, MHY297, MHY291, and MHY312). Data shown come from two independent experiments. In box-and-whisker graphs, boxes show the 25th and 75th percentiles, whiskers indicate the 10th and 90th percentiles, and the line in the boxes represents the median. In A, C, E, and F, ordinary one-way ANOVA was performed with Fisher’s LSD test. ****P < 0.0001, **P ≤ 0.0093, ***P = 0.0004, and ns: non-significant with P ≥ 0.6580. Scale bars: 3 μm. BF: bright field. (G) Working model. PI(3,5)P2 accumulates on the vacuoles of the daughter cell while it is depleted from the vacuoles of the mother cell during mid-to-late mitosis. Concomitantly, the daughter cell’s vacuole becomes acidified and the acidity of the mother cell’s vacuole declines. Thus, the presence of PI(3,5)P2 in the daughter vacuole plays a role in the daughter cell’s rejuvenation, and the absence of PI(3,5)P2 from the mother vacuole leads to the mother cell’s aging.
Time-lapse movie of v-SEP-mCherry–containing atg18∆ yeast strain (MHY277). The channels from left to right are v-SEP, mCherry, and merge. Frame rate is seven frames per second.
Time-lapse movie of v-SEP-mCherry–containing atg18∆ yeast strain (MHY277). The channels from left to right are v-SEP, mCherry, and merge. Frame rate is seven frames per second.
The vacuole acidity of atg18∆ cells was fully rescued by the Atg18-Sloop mutant that localizes to the vacuole membrane through binding to PI(3,5)P2 (Fig. 5 C). Introduction of the Atg18-FGGG mutant that cannot bind membranes, however, only partially rescued vacuolar pH (Fig. 5 C), suggesting that Atg18 vacuole periphery localization is necessary for vacuole acidity. Considering that Atg18 vacuole periphery localization requires its binding to PI(3,5)P2, we proposed that Atg18 may have a role downstream of PI(3,5)P2 in vacuole acidification. We reasoned that if this was the case, artificial recruitment of Atg18 on the membrane of both vacuoles would lead to mother vacuole acidification and symmetric pH. To target Atg18 on both mother and daughter vacuoles, we tagged endogenous Vph1 and Atg18 at their C-terminus with GFP-binding protein (GBP) and GFP, respectively (Caydasi et al., 2017). This strategy successfully provided symmetric localization of Atg18 on the periphery of both vacuoles (Fig. 5 D). Constitutive presence of Atg18 on both vacuoles did not alter PI(3,5)P2 asymmetry (Fig. 5 E), yet caused more acidic and symmetric vacuolar pH (Fig. 5 F, WT versus Atg18-GFP/GBP). This data supports the role of vacuole membrane–localized Atg18 in vacuole acidification. However, PI(3,5)P2 presence was essential for this role, as constitutive targeting of Atg18 to the vacuolar membranes in vac7∆ cells had only a minor effect on vacuole acidity (Fig. 5 F, vac7∆ versus vac7∆ Atg18-GFP/GBP). We do not yet know how Atg18 promotes vacuolar acidity. While it may interact with PI(3,5)P2 to support V-ATPase activity, Atg18 has not been shown to bind V-ATPase subunits. Given its role in transporting vacuolar enzymes (Harding et al., 1996; Yorimitsu and Klionsky, 2005), Atg18’s involvement in vacuole acidification may be also related to vacuole biosynthesis and maturation. If this is the case, it likely does not involve Vph1 sorting (Finnigan et al., 2012) as Vph1 localization isn’t affected by ATG18 deletion (Fig. 3 C). Atg18’s role in vacuole acidification may also be linked to autophagy, which is required for vacuole acidification (Ruckenstuhl et al., 2014). Further research is needed to clarify this connection.
PI(3,5)P2 production on the daughter vacuole is dependent on carbon sources but not on Pho85 and amino acid availability
Carbon sources are established regulators of vacuolar pH (Kane, 2016). To address whether they also regulate PI(3,5)P2 levels, we analyzed SnxA signal upon carbon source withdrawal and in media containing respiratory carbon sources (ethanol/glycerol medium). In these media, strikingly, the SnxA signal disappeared from both the mother and daughter vacuole peripheries (Fig. S2 D). This data is in line with the role of PI(3,5)P2 upstream of V-ATPase assembly (Banerjee et al., 2019; Li et al., 2014) and the disassembly of V-ATPase observed in these media (Kane, 1995; Parra and Kane, 1998). It further suggests that the availability of carbon sources and the respiration/fermentation state of the cell is critical for PI(3,5)P2 synthesis.
Next, we tested the contribution of amino acid availability to PI(3,5)P2 asymmetry in mitotic cells as the availability of some amino acids, such as tyrosine and phenylalanine but not histidine, was shown to influence pH oscillations of the mother vacuole (Okreglak et al., 2023). PI(3,5)P2 asymmetry was maintained independently of amino acid supplementation (Fig. S2 E). However, in comparison to the media supplemented with all amino acids, colocalization on the mother vacuole was slightly increased in minimal media supplemented with only histidine, and this phenotype was rescued by the addition of tyrosine or phenylalanine to the media (Fig. S2 E). This suggests that amino acid availability does not contribute to the increased PI(3,5)P2 levels on the daughter vacuole during mitosis but may have a minor impact on the mother vacuole–associated PI(3,5)P2 during mitosis. Analysis of the effect of Pho85 on SnxA asymmetry led to a similar conclusion (Fig. S2 F). The nutrient-responsive cyclin-dependent kinase Pho85 phosphorylates Fab1 and is essential for PI(3,5)P2 production upon hyperosmotic shock (Jin et al., 2014). Pho85 also greatly influences the cell cycle–linked pH oscillations of the mother vacuole (Okreglak et al., 2023). When we analyzed SnxA-GFP localization in mitotic cells, we observed that SnxA localization on the mother vacuole was impaired in cells with segregated vacuoles (Fig. S2 F). This is in line with previous conclusions that the cell cycle–dependent oscillation of the mother vacuole is dependent on Pho85 (Okreglak et al., 2023). SnxA daughter vacuole localization, however, did not depend on Pho85 (Fig. S2 F). Thus, our data suggest the presence of a mechanism different than Pho85-dependent phosphorylation of Fab1 to activate the Fab1-complex on the daughter vacuole during mitosis.
Altogether, our work revealed that the vacuolar signaling lipid PI(3,5)P2 and its effector protein Atg18 are primarily present on the daughter vacuole during mid-to-late mitosis. Our data further showed that the asymmetry of PI(3,5)P2 and Atg18 is critical for the asymmetry of vacuolar pH, which is established in mitosis. Notably, a previous study that focused on the pH of mother vacuoles showed that the vacuole alkalinizes before cell division and re-acidifies as cells divide. This oscillation of vacuolar pH was also found to be dependent on PI(3,5)P2 and Atg18 among other proteins (Okreglak et al., 2023). Our results align with these findings and further describe how the pH of the daughter vacuole changes during mitosis, as well as how the pH of both vacuoles behaves in relation to the levels of PI(3,5)P2-Atg18 on the vacuole. Thus, our work establishes a link between PI(3,5)P2-Atg18 asymmetry and vacuolar pH asymmetry. Given that the decline of vacuolar acidity is a key factor contributing to yeast aging (Henderson et al., 2014; Hughes and Gottschling, 2012), we propose that PI(3,5)P2 asymmetry, by ensuring that daughter cells have more acidic vacuoles while mother cells have less acidic vacuoles, is one of the mechanisms leading to the aging of the mother cell and the rejuvenation of the daughter cell through asymmetric regulation of vacuolar pH (Fig. 5 G).
Materials and methods
Yeast methods, strains, and plasmids
All yeast strains used in this study are isogenic with S288C and are listed in Table S1. Basic yeast methods and growth media were as described previously (Sherman, 1991). All yeast strains were grown at 30°C and in synthetic complete media that contained all amino acids and glucose (2%) (SC media) (Caydasi and Pereira, 2017) unless otherwise stated. For carbon source withdrawal experiments, cells were brought to log-phase in SC media and shifted to synthetic media without glucose and with all amino acids for 2.5 h before imaging.
For experiments that analyzed cells in ethanol- and glycerol-containing media, synthetic media that contained all amino acids but lacked glucose was supplemented with 2% glycerol and 3% ethanol, and cells were brought to log-phase in this media. For amino acid depletion or supplementation experiments, MHY333 was brought to log-phase in SC media that lacked all amino acids but histidine (85 mg/L), or in an amino acid add-back media in which the SC media that lacked all amino acids was supplemented with 85 mg/L of tyrosine or phenylalanine in addition to histidine.
The cassette PCR-based gene editing method was used for gene deletion and C-terminal tagging of endogenous proteins (Janke et al., 2004; Knop et al., 1999). v-SEP-mCherry–containing strains were obtained as described by Okreglak et al. (2023). GFP-Tubulin, mCherry-Tubulin, SnxA-GFP, SnxA-mCherry, and fab1-ha containing yeast were obtained by genome integration of corresponding plasmids. Plasmids used in this study are listed in Table S1.
SnxA-containing plasmids were generated as follows: The SnxA-GFP sequence (Vines et al., 2023) was codon optimized for yeast and synthesized in the pUC18 plasmid under XbaI and SalI restriction sites (pHM001). SnxA-GFP fragment excised by XbaI and SalI was subsequently ligated under TEF1 promoter and CYC1 terminator sequences on p415TEF. The TEF1-SnxA-GFP-CYC fragment was then excised using KpnI and SacI and subcloned into pRS306 to yield pHM007. pHM007 was linearized by ApaI digestion for integration into the URA3 locus. To construct the SnxA-mCherry containing plasmid, mCherry excised from pAK011 using XhoI and BamHI was used to replace GFP in pHM001. SnxA-mCherry fragment was subcloned under TEF1 promoter and CYC1 terminator sequences on p415TEF using XbaI and SalI. Finally, the TEF1-SnxA-mCherry-CYC fragment was excised using KpnI and SacI and ligated into pRS306 and pRS304 to yield pHM009 and pHM011, respectively. pHM009 was digested with ApaI to integrate into URA3 locus, whereas pHM011 was digested with Kpn2I for integration into TRP1 locus.
For the integration of Atg18 mutants into the endogenous locus, ∼4.3 kb Atg18-eGFP-klTRP1 fragment amplified from the chromosomal DNA of Atg18-eGFP-klTRP1–containing yeast strain was cloned into pRS315/XmaI&SacII to obtain pCD001. FGGG and Sloop variant–containing plasmids (pCD002, pCD003) were obtained through site-directed mutagenesis of pCD001. Atg18-eGFP-klTRP1 fragments of these plasmids were amplified and used as cassettes to replace atg18∆::hphNT1 in CDY53.
Fluorescence imaging
All microscopy experiments were conducted using a Carl Zeiss Axio Observer 7 motorized inverted epifluorescence microscope equipped with a Colibri 7 LED light source, Axiocam 702 Monochrome camera, 63× Plan Apochromat immersion oil objective lens, Zeiss filter sets 95 (GFP/Cherry) and 44 (FITC), and an XL incubation and climate chamber.
For time-lapse experiments, cells were grown in filter-sterilized SC media to the log phase and attached to glass-bottom Petri dishes (10810-054 Matsunami; WVR), as previously described (Caydasi and Pereira, 2017). Briefly, the center of the glass dish was coated with 6% Concanavalin A (Canavalia ensiformis Jack Bean, type IV C2010-G; Sigma-Aldrich) for 10 min and then rinsed with sterile water. Next, 200 μl of a logarithmic phase culture was added to the center of the dish and incubated at 30°C for 30 min. Non-attached cells were removed by washing with prewarmed media. The dish was filled with prewarmed media, placed on the microscope stage, and allowed to sit for 1 h before starting the experiment. The microscope chamber was preheated to 30°C, 2–3 h before the experiment. For time-lapse experiments that monitored response to the hyperosmotic shock, the glass-bottom petri dish was initially filled halfway with prewarmed media. Once the experiment commenced, 1.8 M NaCl dissolved in filter-sterilized SC media was carefully added at 1:1 ratio (vol:vol) into the dish on the microscope.
Time-lapse experiments involving SnxA-GFP without hyperosmotic shock, 3xmCherry-Tubulin, and v-SEP-mCherry atg18∆ were conducted with images taken at 3-min intervals. For Atg18-mNG Vph1-3xmCherry, images were captured at 5-min intervals. For GFP-Tubulin, SnxA-GFP with hyperosmotic shock, and v-SEP-mCherry WT, the interval was set at 1 min.
Still images of cells were captured without cell fixation. Briefly, 1 ml of log-phase culture grown in filter-sterilized SC medium was centrifuged at 3,200 rpm for 2 min, and the cells were resuspended in an appropriate volume of SC medium before wet mount preparation. A maximum of three images were acquired immediately from each slide to prevent stressing of the cells and photobleaching of the signals. For the still images involving hyperosmotic shock, cell suspensions were mixed with 1.8 M NaCl containing filter sterilized SC media at a ratio of 1:1 (vol:vol) and imaged between 5 and 10 min after salt addition.
Imaging conditions were as follows: v-SEP-mCherry was imaged using the FITC channel at 5% intensity for 5 ms and the mCherry channel at 10% intensity for 20 ms. SnxA-GFP was captured using the FITC channel at 10% intensity for 5 ms. Vph1-3xmCherry and 3xmCherry-Tubulin were imaged using the mCherry channel at 10% intensity for 100 ms and 50% for 50 ms respectively. SnxA-mCherry utilized the mCherry channel at 20% for 15 ms, GFP-Tubulin was imaged using the FITC channel at 5% intensity for 40 ms, and Atg18-mNG was imaged using FITC at 15% intensity for 200 ms. 2 × 2 binning was applied during acquisition. For still images, 13 z-stacks of 0.3-µm thickness were acquired per image. For time-lapse experiments, nine z-stacks of 0.4-µm thickness were acquired per image.
Assessing the timing of SnxA and Atg18 vacuole localization
The temporal localization of SnxA and Atg18 on vacuole membranes with respect to vacuole segregation and spindle elongation was judged by eye through monitoring of individual cells from the time-lapse series using Image J (National Institutes of Health [NIH]) software.
For the timing, with respect to vacuole segregation, all cells in which segregation of the vacuole can be observed were inspected. The vacuole segregation process usually involves vesicle movement from the mother to the daughter in several steps. The end of vacuole segregation was marked as the point after which vesicle movement was not observed. Time points at which a clear SnxA or Atg18 fluorescent signal was detected at the mother or daughter vacuole peripheries were noted. The time points of signal appearance and/or disappearance were recorded. Signal persistence was calculated as the duration between signal appearance and disappearance. The timing of signal appearance was calculated as the time between the end of vacuole segregation and signal appearance.
For the timing with respect to spindle elongation, all cells that underwent both the metaphase-to-anaphase transition and the spindle breakdown during the time-lapse duration were analyzed. The time points for anaphase onset and spindle breakdown were determined by observing when rapid spindle elongation and spindle breakdown first occurred. The timing of SnxA-GFP and Atg18-mNG signal appearance on the daughter vacuole was calculated with respect to the timing of anaphase onset (t = 0). The timing of SnxA-GFP and Atg18-mNG signal disappearance from the daughter vacuole was calculated with respect to the timing of spindle breakdown. To be able to show both timings on the same graph, spindle breakdown timing was normalized to 20 min for each cell.
Assessing vacuole periphery localization via EzColocalization
To calculate PCC values of Atg18/SnxA/FYVE and Vph1 signals, z-projection was performed by summing four z-stacks in which the vacuole was in focus based on the Vph1 reference. Using two reporter inputs and the region of interest (ROI) manager for cell identification, the EzColocalization plugin ImageJ (NIH) was used to determine the PCC between Atg18/SnxA/FYVE and Vph1. First, the vacuoles were manually selected from the Vph1 channel using the oval selection tool and added to the ROI manager. In the EzColocalization window, PCC was selected, with the ROI set for cell identification.
PCC values from time-lapse experiments were obtained in the same way, and this time the process was repeated per cell for multiple consequent time points. The time point of the end of vacuole segregation (see the section above) was also noted based on Vph1 signal. The PCC values were then aligned according to this timing and mean PCC per time point was plotted.
Measurement of vacuole diameter
Vacuole diameters were measured in ImageJ by drawing a line across the vacuole based on the vacuole marker Vph1 on maximum projected images and then using the measure tool.
Assessing protein asymmetry on mother and daughter vacuoles
Analysis of vacuolar pH
For analysis of vacuolar pH, z-stacks were sum-projected using ImageJ. Using the oval selection tool, the central region of the vacuole was selected based on mCherry signal. The mean fluorescence intensity of this area was measured in both the v-SEP and mCherry channels. The mean fluorescence intensity of an area free from cells was also measured as the background. Mean fluorescence intensities of v-SEP and mCherry were corrected for the background signal by subtracting the background signal from the vacuolar signal. v-SEP/mCherry was calculated by dividing the corrected v-SEP signal by the corrected mCherry signal. v-SEP/mCherry ratios from time-lapse experiments were obtained in the same way. The time point of the end of vacuole segregation was also noted based on the mCherry signal. v-SEP/mCherry ratios were then aligned according to this time point, and v-SEP/mCherry ratios per time point were plotted.
pH sensitivity and calibration curves for v-SEP, mCherry, and v-SEP/mCherry
Cells for pH sensitivity and calibration experiments were prepared as previously described with minor modifications (Okreglak et al., 2023). Briefly, the MHY283 strain that has TEFprom-v-SEP-mCherry-Cyc1term integrated into its HO-locus was grown in 10 ml SC medium to log phase. Cells were pelleted at 3,200 rpm for 2 min and resuspended in 500 μl dH2O. 10 μl of cell suspension was pipetted in 90 μl Carmody buffers (Carmody, 1961) at different pHs (3–10). To this mixture, 1 μl of 10% digitonin (in DMSO) was added, mixed, and incubated for 20 min at room temperature. Using the cell suspensions, wet mounts were prepared for microscopy. Images were acquired at the brightfield, v-SEP, and mCherry channels. Signals in the vacuole lumen were quantified as described above (see analysis of vacuolar pH). Corrected v-SEP and mCherry mean signal intensities of the vacuole lumen were either plotted individually, or v-SEP/mCherry ratios were graphed. Lines (pH 5–8 range) were fitted with a simple linear regression model in Prism.
Protein methods
The total yeast cell protein precipitation, sample preparation, and western blotting were performed as previously described (Meitinger et al., 2016). Primary antibodies used were rabbit anti-GFP (ab290; Abcam) and rabbit anti-Tubulin (EPR13799; Abcam). The secondary antibody was goat anti-rabbit HRP-conjugated (#R-05072-500; Advansta). Chemiluminescence signals were detected using the Bio-Rad Chemidoc MP system. GFP and tubulin band intensities were measured using ImageJ and corrected for membrane background signal. The area sizes measured were kept constant across all time points. Relative GFP levels were calculated by dividing the background-corrected GFP band intensities with the corresponding background-corrected tubulin band intensities.
Spot assay for cell growth comparison on agar plates
Yeast cultures were grown in rich media at 30°C until reaching the stationary phase. The cultures were then adjusted to an OD600 of 1, and 10-fold serial dilutions were prepared using sterile 1xPBS. 10 μl of each serial dilution were spotted onto yeast peptone dextrose (YPD) agar plates and incubated at appropriate temperatures for 1–3 days.
Data presentation and statistical analysis
Images were visualized and analyzed using ImageJ, and figures were assembled in Photoshop and labeled in Illustrator (Adobe). Graphs were plotted using Prism 10.2.3 (GraphPad), and statistical significance was determined using one-way ANOVA or unpaired two-tailed t tests as indicated in the figure legends. In Box-and-whisker plots, boxes extend from the 25th to 75th percentiles, whiskers point to the 10th and 90th percentiles, and lines inside the boxes are the median.
Online supplemental material
Fig. S1 shows the properties of SnxA-GFP and Atg18-mNG as in vivo PI(3,5)P2 sensors. Fig. S2 shows pH calibration curves and the effect of carbon source, amino acids, and Pho85 on SnxA localization. Video 1 shows SnxA-GFP and Vph1-3xmCherry upon hyperosmotic shock. Video 2 shows SnxA-GFP and Vph1-3xmCherry during the cell cycle. Video 3 shows SnxA-mCherry and GFP-Tub1 during the cell cycle. Video 4 shows Atg18-mNG and Vph1-3xmCherry during the cell cycle. Video 5 shows v-SEP-mCherry in wildtype cells. Video 6 shows v-SEP-mCherry in atg18∆ cells. Table S1 provides the list of strains and plasmids used in the study. Data S1 shows numerical data represented in the graphs for Fig. 1. Data S2 shows numerical data represented in the graphs for Fig. 2. Data S3 shows numerical data represented in the graphs for Fig. 3. Data S4 shows numerical data represented in the graphs for Fig. 4. Data S5 shows numerical data represented in the graphs for Fig. 5. Data S6 shows numerical data represented in the graphs for supplemental figures.
Data availability
All data are available in the published article and its online supplemental material.
Acknowledgments
We would like to thank Gislene Pereira (University of Heidelberg, Heidelberg, Germany), Elmar Schiebel (University of Heidelberg, Heidelberg, Germany), Andreas Mayer (University of Lausanne, Lausanne, Switzerland), Keisuke Obara (Nagoya University, Nagoya, Japan), Yoshinori Ohsumi (Tokyo Institute of Technology, Tokyo, Japan), Daniel Gottschling (Calico Life Sciences, San Francisco, CA, USA), and Voytek Okreglak (Altos Labs, Redwood City, CA, USA) for sharing yeast strains and plasmids. We are grateful to Jason King (University of Sheffield, Sheffield, UK) for sharing the sequence of the SnxA reporter prior to its release.
This study was supported by European Molecular Biology Organization installation Grant No. 3918, and Türkiye Bilimsel ve Teknolojik Araştırma Kurumu (TÜBITAK) Grant No. 219Z100. M. Huda and M. Koyuncu were funded by TÜBITAK Grant No. 122Z887, 219Z100, and 118Z979.
Author contributions: M. Huda: Conceptualization, Data curation, Formal analysis, Investigation, Methodology, Validation, Visualization, Writing - original draft, Writing - review & editing, M. Koyuncu: Conceptualization, Data curation, Formal analysis, Investigation, Methodology, Validation, Visualization, Writing - review & editing, C. Dilege: Conceptualization, Data curation, Formal analysis, Investigation, Methodology, Validation, Visualization, Writing - review & editing, A.K. Caydasi: Conceptualization, Funding acquisition, Methodology, Project administration, Supervision, Visualization, Writing - original draft, Writing - review & editing.
