The transition from meiotic divisions in the oocyte to embryonic mitoses is a critical step in animal development. Despite negligible changes to cell size and shape, following fertilization the small, barrel-shaped meiotic spindle is replaced by a large zygotic spindle that nucleates abundant astral microtubules at spindle poles. To probe underlying mechanisms, we applied a drug treatment approach using Ciona eggs and found that inhibition of casein kinase 2 (CK2) caused a shift from meiotic to mitotic-like spindle morphology with nucleation of robust astral microtubules, an effect reproduced in Xenopus egg cytoplasmic extracts. In both species, CK2 activity decreased at fertilization. Phosphoproteomic differences between Xenopus meiotic and mitotic extracts that also accompanied CK2 inhibition pointed to RanGTP-regulated factors as potential targets. Interfering with RanGTP-driven microtubule formation suppressed astral microtubule growth caused by CK2 inhibition. These data support a model in which CK2 activity attenuation at fertilization leads to activation of RanGTP-regulated microtubule effectors, inducing mitotic spindle morphology.
Introduction
At the meiosis-to-mitosis transition following fertilization, a rapid shift from reductional meiotic divisions of the oocyte to the first equational mitotic division of the zygote is essential for embryonic development. Though cell size and shape remain similar, the cell division machinery is dramatically reconfigured to facilitate this shift in cell division program (Fig. 1 A). What drives this abrupt change in spindle morphology is an interesting open question.
The spindle is a dynamic, bipolar, microtubule-based structure that in meiosis facilitates the reductional segregation of chromosomes between the oocyte and the much smaller, extruded polar bodies to generate a haploid egg. In mitosis, the spindle faithfully segregates a copy of each chromosome to two daughter cells. Morphometric differences between meiotic and mitotic spindles of early development are well conserved across metazoan species (Crowder et al., 2015). Meiotic spindles are small, barrel-shaped, and anastral across chordates, nematodes, cnidaria, and arthropods and localized close to the cell periphery. In contrast, mitotic spindles are more centrally positioned in the cell and larger, scaling with cell size and displaying arrays of astral microtubules emanating from the spindle poles (Crowder et al., 2015).
Although a gradual change in spindle architecture from meiotic to mitotic divisions was reported in mice (Courtois et al., 2012), a more rapid shift in spindle morphology was observed in other metazoan species, which, unlike rodents but like humans, inherit a centriole from the sperm upon fertilization (Cavazza et al., 2016; Crowder et al., 2015; Schneider et al., 2021). The centriole then recruits cytoplasmic proteins and duplicates to form two centrosomes, which constitute the major microtubule-organizing centers (MTOCs) in mitotic cells. However, the presence of centrioles alone is not sufficient to drive centrosome-mediated astral microtubule nucleation and mitotic spindle morphology. In Xenopus egg extracts, spindles formed around sperm chromosomes (with centrosomes) or DNA-coated beads (without centrosomes) both display meiotic anastral morphology, appearing very similar to the meiosis II spindle in unfertilized eggs (Heald et al., 1996). Therefore, cytoplasmic activation of microtubule polymerization pathways likely drives the change in spindle morphology observed at the meiosis-to-mitosis transition.
The main pathways responsible for microtubule growth that contribute to spindle assembly include microtubule nucleation and stabilization around chromatin, nucleation from centrosomes, and branching nucleation from preexisting microtubules. One mechanism stimulating microtubule formation around chromosomes is mediated by the chromosome passenger complex (Maresca et al., 2009), which consists of INCENP, Borealin, Survivin, and Aurora B kinase (Ruchaud et al., 2007; Tseng et al., 2010) and inhibits microtubule depolymerization by MCAK (Sampath et al., 2004) and stathmin (Gadea and Ruderman, 2006; Kelly et al., 2007), contributing to spindle microtubule stability. A second major pathway of microtubule nucleation and organization around chromosomes is driven by RanGTP, which is generated by its chromatin-bound guanine nucleotide exchange factor RCC1 (Kalab et al., 2002; Oh et al., 2016). A RanGTP gradient leads to localized release of spindle assembly factors (SAFs) from the transport receptors importin α and importin β that sequester them in the cytoplasm by binding to their nuclear localization signal (NLS) sequences (Carazo-Salas et al., 1999; Kalab et al., 1999; Kalab et al., 2002; Nachury et al., 2001; Ohba et al., 1999; Wiese et al., 2001; Wilde and Zheng, 1999). A number of importin-regulated SAFs with roles in spindle microtubule nucleation and organization have been identified (Cavazza and Vernos, 2016), including TPX2 (Gruss et al., 2001; Scrofani et al., 2015), XCTK2 (Ems-McClung et al., 2020, 2004), NuMA (Nachury et al., 2001), and augmin (Ustinova et al., 2023). Partitioning of importin α between the plasma membrane and cytoplasm is a mechanism by which NLS-containing cargoes are regulated to promote scaling of spindle size with decreasing cell size during development (Brownlee and Heald, 2019; Rieckhoff et al., 2020).
Another major spindle assembly pathway, active in mitotic cells, is mediated by microtubule nucleation at centrosomes. The centrosome, a pair of centrioles surrounded by pericentriolar material, concentrates gamma-tubulin ring complexes (γ-TURCs), leading to microtubule nucleation and stabilization (Helmke et al., 2013; Wu and Akhmanova, 2017). Meiotic oocytes lack functional centrosomes but retain centrosomal proteins (Peshkin et al., 2019; Wang et al., 2016), some of which have been shown to function with pericentriolar material components and γ-TURC to nucleate microtubules at acentriolar MTOCs (So et al., 2019). In mouse oocytes, a liquid-like domain at spindle poles concentrates regulatory factors promoting spindle assembly (So et al., 2019). Microtubules can also be nucleated on preexisting microtubules; branching microtubule nucleation mediated by the RanGTP-regulated SAFs augmin and TPX2 contributes to spindle assembly (Petry et al., 2013; Ustinova et al., 2023; Wu and Akhmanova, 2017). Microtubule plus end–binding proteins such as EB3/CLIP-170 and XMAP215/TOG concentrate tubulin and stimulate microtubule polymerization, contributing to this and other nucleation pathways (Kraus et al., 2023; Miesch et al., 2023; Thawani et al., 2018).
How these microtubule nucleation and stabilization pathways are integrated to facilitate formation of the specialized meiotic spindle and, just one cell cycle later, the mitotic spindle of the zygote remains mysterious. In a study of spindle morphology across a wide range of species, the most dramatic shift in morphology observed at the meiosis-to-mitosis transition was in the sea squirt Ciona robusta (Crowder et al., 2015), a simple chordate species that is the closest living relative of vertebrates (Christiaen et al., 2009a). We exploit this robust change in spindle morphology to screen for small molecule inhibitors that perturb it. We then take advantage of the biochemical tractability of Xenopus laevis egg and embryo extracts capable of recapitulating meiotic and mitotic spindle assembly (Maresca and Heald, 2006; Wilbur and Heald, 2013) to probe candidate pathways and mechanisms. We propose that a decrease in casein kinase 2 (CK2) activity following fertilization leads to activation of the RanGTP pathway of microtubule polymerization at spindle poles, thereby contributing to astral microtubule growth and mitotic spindle morphology.
Results and discussion
Spindle morphology changes dramatically between meiosis and mitosis in both C. robusta and X. laevis
To characterize the spindle morphology changes that accompany the meiosis-to-mitosis transition in chordates (Fig. 1 A), we visualized microtubules and DNA by immunofluorescence in fixed eggs and zygotes of C. robusta and X. laevis. C. robusta eggs and sperm were isolated from hermaphrodite adults, and in vitro fertilization was carried out to generate populations of synchronously dividing embryos. C. robusta eggs are arrested in metaphase of meiosis I and display a small, barrel-shaped anastral spindle, ∼10.5 µm in length, close to the cell periphery (Fig. 1 B and Fig. S1 A). Though the overall cell size and shape of the zygote are similar to that of the egg (Fig. 1, B and C; and Fig. S1 A), the first mitotic spindle in metaphase is ∼11-fold longer than its meiotic counterpart, more centrally positioned in the cell, and displays large arrays of astral microtubules emanating from the spindle poles (Fig. 1, B and C; and Fig. S1 A); these microtubule arrays extend toward the cell cortex in anaphase (Fig. S1 B). X. laevis in vitro fertilization was carried out to generate synchronously dividing populations of zygotes. X. laevis eggs are much larger (∼1.4-mm diameter) than C. robusta eggs (∼150-µm diameter) (Fig. S1, A and C) and arrested in metaphase of meiosis II. Like those of C. robusta, X. laevis egg meiotic spindles are small (∼26 µm in length), barrel-shaped, anastral, and localized in close proximity to the egg periphery, whereas zygotic mitotic spindles are ∼6.9-fold longer, have astral microtubules arrays at the poles, and are more centrally positioned in the cell (Fig. 1, D and E; and Fig. S1, C and D).
CK2 inhibition stimulates astral microtubule assembly, and CK2 activity decreases at fertilization in both Ciona and Xenopus
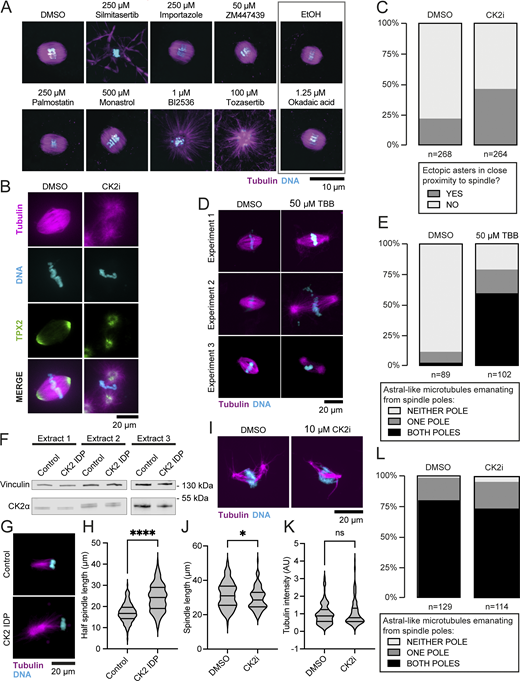
To identify upstream pathways underlying the conserved, abrupt change in spindle morphology that occurs following fertilization, we carried out a small set of drug treatments to identify inhibitors that perturb meiotic spindle morphology in C. robusta. We focused on targets previously reported or hypothesized to modulate known spindle assembly pathways, then examined spindle morphology by immunofluorescence. In contrast to treatment with the other drugs (Fig. S2 A), treatment with silmitasertib (CK2i), a CK2 inhibitor, led to a dramatic change in meiotic spindle morphology, pushing it toward a more mitotic-like architecture (Fig. 2 A). A 1-h treatment with CK2i caused the majority of oocytes (78%) to form spindles with dramatic arrays of astral-like microtubules emanating from the poles and ectopic sites of microtubule nucleation in close proximity to the spindle, with a further 20% displaying a similar but milder phenotype (Fig. 2 B). The number of foci of microtubule nucleation in a network around the spindle increased upon CK2i treatment (Fig. 2 C).
We next assessed the effects of CK2 inhibition on meiotic spindle morphology in Xenopus egg extracts (Maresca and Heald, 2006) (Fig. 2 D). In contrast to the anastral, barrel-shaped spindles formed around Xenopus sperm chromosomes in control reactions, CK2i treatment shifted spindle architecture toward a more mitotic-like morphology, with astral-like microtubules emanating from the poles (Fig. 2, D and E), increased spindle length (Fig. 2 F), increased tubulin intensity at spindle poles (Fig. 2 G and Fig. S2 B), and an increased frequency of ectopic microtubule asters in close proximity to the spindle (Fig. S2 C). Inhibition of CK2 with a second inhibitor, 4,5,6,7-tetrabromobenzotriazole (TBB), had a similar effect on meiotic spindle morphology in extracts, increasing the frequency of spindles with astral-like microtubules emanating from the poles (Fig. S2, D and E), and partial immunodepletion of CK2α from egg extracts led to increased half spindle length with astral-like microtubules at the poles (Fig. S2, F–H). Therefore, multiple methods of inhibiting CK2 in meiotic Xenopus cytoplasmic extracts recapitulate the effects of CK2 inhibition observed in C. robusta oocytes, indicating that CK2 regulation of spindle microtubule organization is conserved across chordates.
If attenuation of CK2 activity plays a physiological role in the alteration of spindle morphology observed following fertilization, then its kinase activity is predicted to decrease between metaphase of meiosis II and metaphase of the first mitosis. Utilizing a commercial CK2 activity assay with a model substrate, we measured CK2 activity in cell lysates of eggs in metaphase of meiosis II and zygotes in metaphase of the first mitosis of both C. robusta and X. laevis. In both species, CK2 activity decreased between metaphase of the final meiotic and first mitotic division (Fig. 2, H and I). In Ciona, this drop in activity is likely caused by degradation of regulatory subunit CK2β (Russo et al., 2004), while mechanisms regulating CK2 activity in Xenopus remain unclear. To assess the effects of CK2 inhibition on mitotic spindles, we inhibited CK2 in metaphase-arrested mitotic embryo extracts prepared from stage 8 embryos (Wilbur and Heald, 2013) and observed few changes to spindle morphology with a very modest decrease in spindle length, no significant change in tubulin intensity at spindle poles, and a similar distribution of spindle morphologies to that of the untreated control (Fig. S2, I–L). The observations that CK2 activity decreases at fertilization and that its inhibition in meiosis leads to mitotic-like spindle morphology made CK2 a strong candidate to be an upstream regulator of spindle architecture during development.
Minor CK2-regulated changes to the metaphase proteome accompany the meiosis-to-mitosis transition
CK2 phosphorylates hundreds of different substrates implicated in many signaling pathways and biological processes (Borgo et al., 2021; Meggio and Pinna, 2003). We reasoned that either direct substrates of CK2 or proteins in downstream pathways could regulate spindle morphology. To identify potential candidates at the level of the proteome, we first cataloged changes in protein abundance between meiosis and mitosis then compared them to those observed upon CK2 inhibition.
To assess overall changes in protein composition between meiosis and mitosis, we carried out spindle assembly reactions in metaphase-arrested meiotic egg or metaphase-arrested mitotic stage 8 embryo extracts and compared their proteomes by tandem mass tag (TMT) analysis (Fig. 3 A). To increase coverage, we carried out this analysis twice, resulting in two datasets (dataset 1 and dataset 2), each containing three biological replicates.
At the proteome level (Table S1), 13,448 proteins were detected (11,686 in dataset 1 and 10,874 in dataset 2, with 9,112 (68%) overlapping). Of these, 238 were enriched in meiosis compared to mitosis (Fig. 3 B and Fig. S4), including Mos, which is degraded upon fertilization (Nishizawa et al., 1993), and ovochymase, which is secreted upon egg activation (Lindsay et al., 1999). 662 proteins were enriched in mitosis compared to meiosis (Fig. 3 B and Fig. S4). Interestingly, gene ontology (GO) analysis of proteins overrepresented in meiosis relative to mitosis (Table S3) revealed 6 microtubule-binding proteins (Table S4), including gamma-tubulin complex component 4, a component of the γ-TURC (Oakley et al., 2015). GO categories overrepresented in mitosis relative to meiosis were mostly terms related to cellular membranes and membrane-bound organelles, including the endoplasmic reticulum and Golgi apparatus (Table S5).
To determine whether any proteins changing level between meiosis and mitosis were regulated by CK2, we compared the proteome of meiotic and mitotic cytoplasmic extracts upon addition of DMSO control or CK2i at a concentration confirmed by kinase assay to reduce CK2 activity (Fig. S3, A–C) but that did not perturb the metaphase arrest of the extract as determined by fluorescence microscopy (Table S1, Fig. S2 I, and Fig. S3 D). Relatively minor changes were seen in the total proteome upon drug treatment (Fig. 4, A and B; and Fig. S4), with 59 candidate proteins changing level significantly between meiosis and mitosis and in the same direction upon CK2 inhibition (Fig. 4, C and D). However, none of these proteins have known roles in microtubule binding or cell division, and the only statistically enriched GO category was T cell receptor signaling.
Altogether, this analysis reveals some interesting differences between meiotic and mitotic proteomes that may contribute to the change in cell division program. However, since changes in protein levels upon CK2 inhibition were minor, such protein abundance regulation is unlikely to directly underlie CK2 activity–mediated differences between meiotic and mitotic spindle morphology.
Phosphoproteomics in CK2-inhibited Xenopus cytoplasmic extracts identifies candidate phosphoregulated proteins and downstream pathways
Given the rapid shift in spindle microtubule organization at the meiosis-to-mitosis transition, we reasoned that changes in posttranslational modifications, particularly phosphorylation, were likely to drive the transition (Peuchen et al., 2017). We assessed the global phosphoproteome and detected 37,339 phosphopeptides (Table S2). 2,298 of these were enriched in meiotic and 5,673 in mitotic extracts, corresponding to a total of 1,478 and 1,584 proteins, respectively (Fig. 3 C and Fig. S5). Whereas GO analysis did not reveal specific categories of proteins with meiosis-enriched phosphosites, 89 spindle-localized proteins were identified with phosphosites enriched in mitosis (Tables S6 and S7), including TPX2, HAUS augmin-like complex components HAUS5, HAUS6, and HAUS8, TACC3, and kinases Polo 1 kinase and cyclin-dependent kinase 1. We next assessed the effect of CK2 inhibition on the phosphoproteome (Fig. 4, E and F; and Fig. S5). 53 phosphopeptides from 43 proteins changed in level in the same direction both between meiotic and mitotic extracts and upon CK2i addition to meiotic extract (Fig. 4, G and H). Phase normalization (see Materials and methods) to account for higher total phosphorylation levels in mitotic extract identified a further 35 candidate proteins that change at the phosphopeptide but not the protein level, making them candidates for phosphoregulated proteins that drive the change in spindle morphology.
Of the 78 candidate proteins identified by this approach, 38 were previously reported to be associated with the vertebrate spindle or RanGTP-stabilized microtubules by proteomic analyses (Rao et al., 2016; Rosas-Salvans et al., 2018) or by localization to spindles, centrosomes, or kinetochores (Huang et al., 2015) (Table S8). Network analysis using the STRING database (Szklarczyk et al., 2019) revealed functional clusters of these phosphoregulated proteins with reported roles in DNA replication, nucleocytoplasmic transport, splicing, translation, microtubule binding, chromatin modification, transcription regulation, chromosome condensation, DNA repair, and tight junction assembly (Fig. 4 I). Recent work has demonstrated noncanonical roles in cell cycle control for many proteins, notably nucleocytoplasmic transport proteins in spindle assembly (Yang et al., 2023), and our candidates included two proteins reported to be Ran-regulated: nucleoporin NUP214 (Askjaer et al., 1999; Hutten and Kehlenbach, 2006) and cell cycle regulator geminin (Blow, 2003; Hodgson et al., 2002). Based on literature searches, we hypothesize that a further five candidates are likely also Ran-regulated: nucleocytoplasmic transport proteins NUP35 and AKIRIN2 (De Almeida et al., 2021), transcription regulator CTR9 homolog (Kimura et al., 2017; Taltynov et al., 2013), DNA helicase MCM4 (Yamaguchi and Newport, 2003), and telomere-associated protein RIF1 (Sukackaite et al., 2017). Thus, a subset of candidate proteins downstream of CK2 are regulated by RanGTP.
Overall, our phosphoproteomic analysis reveals numerous interesting differences between phosphorylation patterns in meiosis and mitosis and points to Ran-regulated proteins as potential targets of CK2 regulation that differ between these two distinct cell division programs. This intrigued us, as inhibition of CK2 resulted in the formation of astral microtubule networks that mimic previously reported effects of adding constitutively active RanGTP to meiotic Xenopus egg extract. Addition of RanG19V to spindle assembly reactions led to the formation of abundant MTOCs, mostly not directly associated with chromatin, and when no chromatin source was added microtubule networks, similar to those we observe around the spindles in Ciona oocytes following CK2 inhibition, formed (Kalab et al., 1999).
Inhibition of the RanGTP spindle assembly pathway suppresses effects of CK2 inhibition
To test whether the effect of CK2 inhibition on spindle morphology was mediated by the RanGTP pathway, we used the drug importazole, which inhibits the interaction between RanGTP and importin-β (Soderholm et al., 2011). Strikingly, treatment of C. robusta oocytes with importazole suppressed the effects of CK2 inhibition on spindle morphology (Fig. 5 A), reducing the frequency of oocytes with spindles showing extreme defects with dramatic arrays of astral-like microtubules emanating from the poles upon CK2i treatment from 70% to 3%; when treated with both drugs, 51% of spindles displayed no astral-like microtubules emanating from the poles or ectopic sites of microtubule nucleation in close proximity to the spindle, and 46% displayed mild defects, with a small number of microtubule bundles emanating from the poles (Fig. 5 B).
Consistent with a role for RanGTP in mediating the effects of CK2 inhibition, importazole treatment also suppressed the effects of CK2 inhibition on spindle formation when added to Xenopus egg extracts. To minimize the effects of redundant mechanisms that drive spindle assembly, we examined microtubule arrays 30 min after initiating spindle assembly reactions, when half spindles with a single pole had formed. Half spindles formed in the presence of CK2i displayed increased length with large asters at the half spindle poles; importazole treatment suppressed this length increase, reducing the size of the aster at the pole (Fig. 5, C and E). The increased β-tubulin intensity at the spindle pole observed upon CK2 inhibition was also suppressed by importazole treatment (Fig. 5 F). Addition of importin-β(71–876) protein, a truncated mutant unable to bind to RanGTP that sequesters cargoes (Nachury et al., 2001), also suppressed the effects of CK2 inhibition on half spindle length and tubulin intensity at the poles (Fig. 5, D, H, and I).
We hypothesized that the effects of CK2 inhibition on spindle assembly are likely mediated by increased recruitment of importin-β SAF cargoes to spindle poles. To assess this, we monitored the localization of the SAF TPX2, an importin-β cargo implicated in microtubule nucleation that localizes strongly to spindle poles in control reactions (Fig. S6 A). Intensity of both TPX2 and tubulin at the poles was reduced upon addition of importazole or importin-β(71–876) (Fig. S6). Both treatments suppressed the increase in TPX2 intensity at the poles observed upon CK2 inhibition (Fig. 5, C, D, G, and J). These results support a model in which a decrease in CK2 kinase activity following fertilization modulates activity of a number of RanGTP-regulated importin cargoes, including TPX2, increasing microtubule nucleation and polymerization at spindle poles (Fig. 5 K) and contributing to the difference between meiotic and mitotic spindle morphology.
Our results suggest a global effect on the RanGTP pathway at the meiosis-to-mitosis transition that stimulates localization of SAFs at spindle poles and astral microtubule formation. One possible explanation is that CK2-mediated phosphorylation inhibits RanGAP, its GTPase-activating protein that forms a complex with Ran and RanBP1 and promotes the hydrolysis of RanGTP to RanGDP. CK2 phosphorylation of RanGAP1 on serine 358, a site conserved in Xenopus, increases the efficiency of RanGAP1–Ran–RanBP1 complex formation in humans, which could affect RanGTP hydrolysis rate and the spatial activation of SAFs (Caudron et al., 2005; Gruss and Vernos, 2004; Kalab and Heald, 2008; Takeda et al., 2005). Partitioning of importin α between cellular membranes and the cytoplasm, where it binds and inhibits SAFs, is also regulated by CK2-mediated phosphorylation (Brownlee and Heald, 2019; Hachet et al., 2004). Unfortunately, these phosphosites on RanGAP and importin α were not present in our phosphoproteomic dataset, and further work will be needed to investigate their regulation by CK2 at the meiosis-to-mitosis transition.
The RanGTP pathway has previously been implicated in meiotic spindle assembly in multiple systems (Cavazza and Vernos, 2016; Cesario and McKim, 2011; Drutovic et al., 2020; Dumont et al., 2007; Gruss et al., 2001). Our data indicate that this pathway, differentially regulated, is also important for determining mitotic spindle morphology in early embryos. This supports the conclusions of recent work that demonstrated that the RanGTP pathway is essential for mitotic spindle assembly during very early embryonic divisions of medaka fish embryos (Kiyomitsu et al., 2024) and work showing that spindle assembly in X. laevis early embryo cytoplasmic extracts (stage 3) was dependent on the RanGTP pathway (Wilbur and Heald, 2013).
The meiosis-to-mitosis transition and embryonic viability
The first mitotic division of human embryos is frequently error prone (Cavazza et al., 2021; Currie et al., 2022), contributing to the high rates of aneuploidy in early embryos (Coticchio et al., 2023; Lee and Kiessling, 2017). Very little is known about what regulates the spindle morphology change at the shift from egg to zygote, a process critical for accurate chromosome segregation in the first mitosis. Our study implicates CK2 and the RanGTP pathway in the regulation of this spindle morphology transition in both frogs and sea squirts, suggesting likely conservation of regulatory mechanisms across species. Overexpression of HSET (kinesin-14) in mouse oocytes elongated spindles, making them more mitotic-like (Bennabi et al., 2018), and expression of mutant INCENP in Drosophila oocytes led to ectopic aster formation in proximity to the spindle (Colombié et al., 2008), suggesting these factors may also contribute to the spindle morphology change. A recent preprint demonstrated that inhibition of the Mos–MAPK pathway led to a shift in spindle morphology to mitotic-like in starfish oocytes (Avilov et al., 2023, Preprint), suggesting this signaling pathway, which is active in meiosis but inactivated at fertilization (Dupré et al., 2011), may be part of the upstream control.
Here we have focused on spindle morphology but our global phosphoproteomic approach also provides a dataset in which we can probe changes in the regulation of other cellular processes that accompany the meiosis-to-mitosis transition. Changes to chromosome condensation (Bomar et al., 2002) and cohesion (Tachibana-Konwalski et al., 2010), cell cycle regulation (Kubiak et al., 2008), and centrosome regulation (Manandhar et al., 2005) accompany the transition from egg to zygote. Interestingly, proteins with phosphosites enriched in mitosis compared to meiosis in our dataset included condensins, NUSAP1, histones H1.3 and H1.8, and 74 centrosomal proteins, suggesting phosphoregulation of chromosome condensation and centrosome regulation between meiosis and mitosis. Future work will explore the molecular basis of these changes and the contribution of phosphoregulation to ensuring they are brought about accurately at the appropriate time in development to ensure embryonic viability.
Materials and methods
Ciona husbandry, gamete collection, and in vitro fertilization
C. robusta adult animals were obtained from M-Rep and maintained at 16°C in artificial seawater (Instant Ocean). Gametes were obtained by dissection of egg ducts and sperm ducts from gravid animals (Christiaen et al., 2009b). Eggs and sperm from 6 to 12 animals were mixed for each experiment. For in vitro fertilizations, sperm was activated by mixing with basic artificial seawater (10 μl 1 M Tris [pH 9/10], in 6 ml seawater) in a gelatin-coated petri dish. Eggs were mixed with sperm for 3 min and then dechorionated by mixing with dechorionation solution (0.1 g/ml sodium thioglycolate, 0.01 g/ml protease [Streptomyces griseus] [Cat# PP8811; Sigma-Aldrich], and 0.06 M NaOH) and then washed three times with artificial seawater, and embryos maintained at 16°C.
Xenopus husbandry, gamete collection, and in vitro fertilization
Mature X. laevis were obtained from Xenopus1 or the National Xenopus Resource (Woods Hole) and maintained and used following standard protocols in the Animal Use Protocol approved by the UC Berkeley Animal Care and Use Committee. J-strain (backcrossed) X. laevis (National Xenopus Resource) were used to prepare samples for all proteomic and phosphoproteomic experiments. Testes were dissected from adult males and stored at 4°C in MR (100 mM NaCl, 1.8 mM KCl, 1 mM MgCl2, 2 mM CaCl2, and 5 mM HEPES [pH 7.6]) for <1 wk. Females were primed by injection with 100 U of pregnant mare serum gonadotropin (National Hormone and Peptide Program) at least 48 h before use and boosted by injection with 500 U of human chorionic gonadotropin 16 h before use. Females were gently squeezed to deposit eggs into petri dishes. 1/3 of a testis was homogenized using scissors and a plastic pestle in 1.1 ml ddH2O in a 1.5-ml tube, then added to the petri dish of eggs and swirled to mix and incubated for 5–10 min. Dishes were flooded with 0.1X MMR (100 mM NaCl, 2 mM KCl, 1 mM MgCl2, 2 mM CaCl2, 5 mM HEPES [pH 7.6], and 0.1 mM EDTA) and incubated for 10 min. Jelly coats were removed by incubation in 2% cysteine solution (in ddH2O-NaOH [pH 7.8]), then embryos were washed at least four times in 0.1X MMR and incubated at 23°C. Xenopus illustrations were obtained from Xenbase (https://www.xenbase.org, RRID:SCR_003280).
Xenopus egg and embryo extract preparation and spindle assembly reactions
X. laevis crude CSF egg extracts were prepared as described previously (Maresca and Heald, 2006). Briefly, eggs were packed using a clinical tabletop centrifuge and then crushed by centrifugation for 16 min at 10,200 rpm (max 17,048 rcf) (16°C) in an HB-6 rotor (Sorvall). Cytoplasm was removed and supplemented with 20 µg/ml cytochalasin B (Cyto B); 10 µg/ml leupeptin, pepstatin, and chymostatin; and 1X energy mix (3.75 mM creatine phosphate, 0.5 mM ATP, 0.05 mM EGTA, and 0.5 mM MgCl2). Stage 8 embryo extracts were prepared as described previously (Wilbur and Heald, 2013). Briefly, embryos maintained for 5.5 h after fertilization at 23°C were washed extensively in CSF-XB (5 mM EGTA, 100 mM KCl, 2 mM MgCl2, 0.1 mM CaCl2, 50 mM sucrose, and 10 mM HEPES [pH 7.8]) supplemented with 20 µg/ml Cyto B and packed by centrifugation at 215 rcf for 1 min and then 860 rcf for 30 s in a microcentrifuge at 16°C and then crushed by centrifugation for 12 min at 10,200 rpm (max 17,048 rcf) (16°C) in an HB-6 rotor (Sorvall). Cytoplasm was removed and supplemented with 20 µg/ml Cyto B; 10 µg/ml leupeptin, pepstatin, and chymostatin; 1X energy mix; 0.2 mg/ml UbcH10 C114S; and 0.05 mg/ml cyclin B delta 90.
For spindle assembly reactions, purified X. laevis sperm nuclei were added to egg and embryo extracts at a concentration of 1,000 nuclei/μl. To visualize microtubules, extracts were supplemented with 0.3 µM rhodamine-labeled tubulin. Tubulin was prepared from porcine brains by two cycles of polymerization then labeled with rhodamine (Cat# 90005; Biotium) (Hyman et al., 1991). For sample preparation for proteomic and phosphoproteomic analysis, rhodamine-labeled tubulin was not added, but spindle assembly was monitored by microscopy in a parallel test reaction, using the same extract and conditions, labeled with rhodamine-tubulin.
Fixation, immunofluorescence, and imaging
C. robusta eggs and embryos were fixed overnight at 4°C in “von Dassow fixative” (100 mM HEPES [pH 7], 50 mM EGTA [pH 7], 10 mM MgSO4, 500 mM dextrose, 2% formaldehyde, 0.2% glutaraldehyde, and 0.2% Triton X-100) (Crowder et al., 2015) in 5% BSA-coated tubes, washed three times in PBS, 0.1% Triton X-100 (PBT), once in PBS, and incubated in 0.1% NaBH4 in PBS. For immunofluorescence, Ciona samples were blocked (5% normal goat serum, 0.2% BSA in PBT) overnight at 4°C, incubated in primary antibody (1.25 µg/ml E7 anti–β-tubulin [Cat# E7; DSHB, RRID:AB_528499] in PBT + 0.2% BSA) for 72 h at RT, washed for 24 h in PBT + 0.2% BSA, incubated in secondary antibody (2 µg/ml goat anti-mouse Alexa Fluor 568 [Cat# A-11004; Molecular Probes, RRID:AB_2534072]) for 72 h at RT, washed for 24 h in PBT + 0.2% BSA, incubated in 1 µg/ml Hoechst 33342 (Cat# H3570; Thermo Fisher Scientific) in PBT + 0.2% BSA for 30 min at RT, washed three times in PBT, and then mounted in Vectashield (Vector Labs) between tape spacers on a glass slide. Samples were imaged using a Zeiss PlanApo 63x (NA 1.4) oil or Zeiss PlanApo 20x (NA 0.8) air objective at RT on a Zeiss LSM 800 confocal microscope (ZEN 2.3 software) with 488 and 568 laser lines. Egg and zygote cell diameter and spindle length (outer edge of aster to outer edge of aster) measurements were made using Imaris 9.5.1 (RRID:SCR_007370).
X. laevis eggs and embryos were fixed for 1–3 h at RT in MAD fixative (40% MeOH, 40% acetone, and 20% DMSO) and then stored at −20°C. Samples were gradually rehydrated into 0.5X SSC (75 mM NaCl and 15 mM sodium citrate, pH 7), then bleached under direct light in bleaching solution (2% H2O2 and 5% formamide in 0.5X SSC) for 2–3 h and washed twice in PBT. Samples were blocked in 10% normal goat serum + 5% DMSO in PBT overnight at 4°C, then incubated at 4°C for 24 h in primary antibodies (1.25 µg/ml E7 anti–β-tubulin [Cat# E7; DSHB, RRID:AB_528499] and 2 µg/ml ab1791 anti-H3 [Cat# ab1791; Abcam, RRID:AB_302613] in PBT + 10% normal goat serum), washed for 24 h in PBT, incubated for 24 h at 4°C in secondary antibodies (4 µg/ml goat anti-mouse Alexa Fluor 568 [Cat# A-11004; Molecular Probes, RRID:AB_2534072] and 4 µg/ml goat anti-rabbit Alexa Fluor 488 [Cat# A-11008; Thermo Fisher Scientific, RRID:AB_143165] in PBT), and then washed for 24 h in PBT. Samples were then gradually dehydrated into 100% MeOH, stored overnight at −20°C, then cleared by incubation in Murray’s clear (two parts benzyl benzoate and one part benzyl alcohol), and then mounted on a glass coverslip. Samples were imaged using a Zeiss PlanApo 20x (NA 0.8) air objective on a Zeiss LSM 800 confocal microscope (ZEN 2.3 software) with 488 and 568 laser lines at RT. Egg and zygote cell diameter and spindle length measurements were made using Imaris 9.5.1. Cell diameter was measured across the widest part of cell. Spindle length was measured from outer edge of aster to outer edge of aster, or pole to pole for meiotic spindles with no asters present, along the long axis of the spindle.
Spindles and half spindles from X. laevis spindle assembly reactions were spun down onto coverslips and fixed as described previously (Hannak and Heald, 2006). Briefly, spindles or half spindles were fixed in spindle dilution buffer (30% glycerol, 1 X BRB80 [80 mM PIPES [pH 6.8], 1 mM MgCl2, and 1 mM EGTA], 0.5% Triton X-100, and 3.7% formaldehyde) and then spun down onto glass coverslips through a cushion (40% glycerol and 1X BRB80) by centrifugation for 20 min at 5,500 rpm (max 5,838 rcf) (16°C) in an HS-4 rotor (Sorvall). Coverslips were postfixed for 5 min in cold 100% methanol and then washed in PBS NP40 (1X PBS and 0.1% NP40). For immunofluorescence, coverslips were blocked with PBS-BSA (1X PBS and 3% BSA) for 45 min at RT, incubated at 4°C overnight with primary antibody (1:4,000 rabbit–anti-TPX2 [Miller et al., 2019]) in PBS-BSA, washed with PBS-NP40, incubated for 1 h at RT with secondary antibody (4 µg/ml goat anti-rabbit Alexa Fluor 488 [Cat# A-11008; Thermo Fisher Scientific, RRID:AB_143165] in PBS-BSA), and then washed with PBS-NP40. To visualize DNA, coverslips were incubated for 1 min in 1 µg/ml Hoechst 33342 (Cat# H3570; Thermo Fisher Scientific) in PBS-NP40 and then washed with PBS-NP40. Coverslips were mounted in Vectashield (Vector Labs) on a glass slide and sealed with clear nail polish. Samples were imaged using an Olympus UPlan Fl 40X (NA 0.75) or Olympus UPlan Fl 20X (NA 0.5) air objective and Hamamatsu ORCA-ER camera or Hamamatsu ORCA-II camera on an Olympus BX51 widefield microscope (cellSens software) or a Zeiss Plan-Apochromat 40X (NA 0.95) air objective and Axiocam 712 camera on a Zeiss Axio Observer 7 widefield microscope (ZEN 3.6 software) (using Apotome 3 for representative images). Spindle and half spindle length measurements were made using Fiji (ImageJ) (RRID:SCR_003070). Spindle length was measured from outer edge of aster to outer edge of aster, or pole to pole for meiotic spindles with no asters present, along the long axis of the spindle. Half spindle length was measured as the distance from outer edge of the aster (or pole if no aster was present) to DNA. To quantify fluorescence intensity at spindle and half spindle poles, total fluorescence intensity in each channel was measured in a square (200 × 200 pixels) centered on each spindle pole, and total fluorescence intensity of a background square (200 × 200 pixels) was subtracted from it.
Drug treatments, protein additions, and immunodepletion
Ciona oocytes were bathed in artificial seawater containing the indicated concentration of silmitasertib (MedChem Express), importazole (Sigma-Aldrich), palmostatin (Millipore-Sigma), monastrol (Abcam), BI2536 (Selleck Chemicals), okadaic acid (Cayman Chemical Company), ZM447439 (Selleck Chemicals), or tozasertib (MedChem Express). For drug treatments of extracts, drug stocks were diluted 1:5 in XB (1 mM MgCl2, 0.1 mM CaCl2, 100 mM KCl, 50 mM sucrose, and 10 mM HEPES [pH 7.7]) and added at the beginning of the spindle assembly reaction. 4,5,6,7-tetrabromobenzotriazole was purchased from Selleck Chemicals. For protein addition to extracts, proteins were in XB, and an equal volume of XB was added to the control reaction.
Immunodepletion of CK2 from X. laevis egg extracts was carried out as described previously (Hannak and Heald, 2006). Briefly, 50 μl Protein A Dynabeads (Thermo Fisher Scientific) were co-conjugated to 20 µg anti-CK2α antibody (Cat# sc-373894; Santa Cruz Biotechnology, RRID:AB_10947405) and 10 µg anti-CK2β antibody (Cat# sc-12739; Santa Cruz Biotechnology, RRID:AB_626792) or 30 µg mouse IgG isotype control (Cat# 10400C; Thermo Fisher Scientific, RRID:AB_2532980). 75 μl of extract was incubated with 25 μl of beads for 45 min on ice with intermittent agitation twice before spindle assembly reactions. Protein concentration of CK2α following immunodepletion was assessed by western blot. Total protein concentration of the extract samples was determined by Pierce BCA assay (Thermo Fisher Scientific), and then 10 µg protein in Laemmli sample buffer was run on 4–20% Mini-PROTEAN polyacrylamide gels (Bio-Rad). Proteins were transferred onto nitrocellulose membranes at 60 V at 4°C, blocked at RT with 4% milk in PBS, 0.1% Tween 20 (PBST), and incubated overnight at 4°C with primary antibodies (1:200 anti-CK2α antibody [Cat# sc-373894; Santa Cruz Biotechnology, RRID:AB_10947405] or 1:500 anti-Vinculin antibody Cat# MA1–90508; Thermo Fisher Scientific, RRID:AB_2214494). Following washes in PBST, blots were incubated with secondary antibody (1:10,000 IRDye 680RD goat anti-mouse IgG [Cat# 926–68180; LI-COR Biosciences, RRID:AB_281492]) for 1.5 h at RT, washed again with PBST, and then imaged on an Odyssey CLx imager (LI-COR) (700 channel). Band intensities were measured using Fiji (ImageJ).
CK2 activity assay
For X. laevis lysates, 10 dejellied eggs or zygotes of the appropriate stage (confirmed by immunofluorescence of parallel samples taken at the same time point after fertilization) were snap frozen. Samples were resuspended in 50 μl of Xenopus lysis buffer (25 mM HEPES [pH 7.2], 10 mM EDTA, 250 mM sucrose, 1% NP40, 1 tablet/10 ml PhosSTOP [EDTA-free] [Roche], 1 tablet/10 ml cOmplete mini protease inhibitor [EDTA-free] [Roche], 0.2 mM PMSF, and 10 µM Cyto B) on ice and lysed by pipetting and then thorough vortexing. Yolk removal was carried out as previously described (Van Itallie et al., 2021, Preprint); samples were centrifuged at 4,000 g for 4 min (4°C) in a microcentrifuge, then lipids were resuspended by gentle flicking, and the supernatant was retained. Total protein concentration of samples was determined by Bradford assay (Bio-Rad), and samples were diluted to a concentration of 500 µg/ml. To determine CK2 activity, a CycLex CK2 Kinase Assay Kit (MBL Life Science) was used according to the manufacturer’s recommended protocol.
For C. robusta lysates, dechorionated eggs or zygotes of the appropriate stage and from a fertilization with a fertilization efficiency of >79% (confirmed by immunofluorescence of parallel samples taken at the same time point after fertilization) were washed in PBS, pelleted by centrifugation at 845 rcf for 1 min (16°C) in a microcentrifuge, and snap frozen. Pellets were resuspended in 100 μl Ciona lysis buffer (20 mM Tris-HCl [pH 7.4], 1 mM EDTA [pH 8.0], 150 mM NaCl, 0.5% NP40, 1 tablet/10 ml PhosSTOP [EDTA-free] [Roche], 1 tablet/10 ml cOmplete mini protease inhibitor [EDTA-free] [Roche], and 0.2 mM PMSF) on ice, incubated for 5 min on ice, and then lysed with a plastic pestle for 1 min. Following centrifugation at 15,871 rcf for 5 min (4°C), the supernatant was retained. Total protein concentration of samples was determined by Bradford assay (Bio-Rad), and samples were diluted to a concentration of 500 µg/ml. To determine CK2 activity, a CycLex CK2 Kinase Assay Kit (MBL Life Science) was used according to the manufacturer’s recommended protocol.
To assess CK2 activity following drug treatment of X. laevis extracts, the total protein concentration of the extract samples was determined by Pierce BCA assay (Thermo Fisher Scientific), and then samples were diluted to a concentration of 500 µg/ml before a CycLex CK2 Kinase Assay Kit (MBL Life Science) was used according to the manufacturer’s recommended protocol. CK2 (alpha/beta)-positive control (MBL) was used for control assays.
Sample preparation for proteomics
For each of two experimental repeats, spindle assembly reactions were carried out in three independent meiotic egg extracts and three independent mitotic embryo extracts in the presence of 25 µM silmitasertib or DMSO (meiotic) or 10 µM silmitasertib or DMSO (mitotic). After 1-h incubation at 18°C, once spindles had formed, samples were snap frozen in liquid nitrogen and stored at −80°C. Total protein concentration of the sample was determined by Bradford assay (Bio-Rad). Reduction in kinase activity upon drug treatment of each sample was confirmed by a CK2 activity assay (CycLex CK2 Kinase Assay Kit [MBL Life Science]) on samples diluted 1:10 in XB. Metaphase arrest of each extract sample after 1-h spindle assembly reaction was confirmed by spindle spin down, fixation, and imaging as described above.
Proteins from egg and embryo extracts were precipitated with ice-cold acetone and resuspended in ice-cold lysis buffer (8 M urea, 25 mM Tris-HCl [pH 8.5], 150 mM NaCl, phosphatase inhibitors [2.5 mM β-glycerophosphate, 1 mM sodium fluoride, 1 mM sodium orthovanadate, and 1 mM sodium molybdate], and protease inhibitors 1 tablet/10 ml cOmplete mini protease inhibitor [EDTA-free] [Roche]) and sonicated three times for 15 s each with intermittent cooling on ice. Lysates were centrifuged at 15,000 rcf for 30 min at 4°C. A portion was removed to determine protein concentration by BCA assay (Pierce/Thermo Fisher Scientific). The remaining supernatants were reduced with 5 mM DTT at 55°C for 30 min, cooled to RT, and alkylated with 15 mM iodoacetamide at RT, in the dark, for 45 min. Alkylation reactions were quenched with an additional 5 mM of DTT for 10 min at RT and then diluted sixfold with 25 mM Tris (pH 8.1) before digestion with trypsin at a concentration of 1:100 (wt/wt) (Sigma-Aldrich) overnight at 37°C. The next day, digests were quenched by acidification with 0.25% TFA (vol/vol), centrifuged to remove precipitation, and desalted with an Oasis HLB 60 mg plate (Waters). For proteomics analysis, 40 µg of peptide digests from each sample were removed. The remaining peptides were lyophilized and stored at −80°C before further analysis.
Proteomics, phosphoproteomics, and data normalization
For proteomics analysis, peptides were labeled with TMTpro reagents (Thermo Fisher Scientific) in 100 mM EPPS (pH 8.5)/20% ACN at RT for 1 h before a small portion was removed from each sample to determine labeling efficiency. Labeling was confirmed to be at least 95% efficient before quenching with the addition of hydroxylamine to a final concentration of 0.25% for 10 min, mixed, acidified with TFA to a pH of about 2, and desalted over an Oasis HLB 10 mg plate (Waters). The desalted multiplex was dried by vacuum centrifugation and separated by offline pentafluorophenyl-based reversed-phase HPLC fractionation as previously described (Grassetti et al., 2017).
For phosphoproteomics analysis, lyophilized digested peptides were subjected to phosphopeptide enrichment with the High Select Fe-NTA Phosphopeptide Enrichment Kit (Thermo Fisher Scientific) following the manufacturer’s instructions and desalted over an Oasis HLB 10 mg plate (Waters). Phosphopeptides were then labeled with TMTpro reagents and offline separated as described above.
TMT-labeled peptides were analyzed on an Orbitrap Lumos mass spectrometer (Thermo Fisher Scientific) equipped with an Easy-nLC 1,200 (Thermo Fisher Scientific). The raw data files were searched using COMET (Eng et al., 2013) with a static mass of 304.2071 Da on peptide N-termini and lysines, 57.02146 Da on cysteines, and a variable mass of 15.99491 Da on methionines and for phosphorylation 79.96633 Da on serines, threonines, and tyrosines against the target-decoy version (Elias and Gygi, 2007) of the annotated X. laevis proteome database (Xenbase, v9.2) (Fisher et al., 2023) and filtered to a <1% FDR at the peptide level. Quantification of LC-MS/MS spectra was performed using in-house developed software. The probability of phosphorylation site localization was determined by PhosphoRS (Taus et al., 2011). For proteomics analysis, peptide intensities were adjusted based on total TMT reporter ion intensity in each channel across all samples and log2 transformed. For phosphoproteomics analysis, peptide intensities were adjusted based on total TMT reporter ion intensity in each channel across all samples (or for phase-normalized data across meiotic samples or mitotic samples, respectively) and log2 transformed. P values were calculated using a two-tailed Student’s t test in Perseus (Tyanova et al., 2016).
GO enrichment and network analysis
For analysis, proteomic and phosphoproteomic data from the two experimental repeats (total peptide count >1 filtered) were pooled. Data were annotated with human orthologs using the mapping to the X. laevis v9.2 genome in the files available at https://wuehr.scholar.princeton.edu/protein-concentrations-xenopus-egg (Wühr et al., 2014). GO enrichment analysis was carried out on human orthologs using PANTHER version 19.0 (Thomas et al., 2022) with default parameters. Network analysis was carried out on human orthologs using STRING version 12.0 (Szklarczyk et al., 2019) (RRID:SCR_005223) using full STRING network annotations with high confidence (interaction score ≥0.7). Edge color indicates data source, with known interactions shown in cyan (from curated databases) and magenta (experimentally determined), predicted interactions shown in emerald green (gene neighborhood), red (gene fusions), royal blue (gene co-occurrence), lime green (text mining), black (co-expression), and lilac (protein homology). K-means clustering with default parameters was used to define functional clusters.
Statistical tests
Mann–Whitney and t tests (as indicated in figure legends) were carried out using Prism 9.0 (RRID:SCR_002798). Linear regression analysis was carried out using Prism 10.0.
Online supplemental material
Fig. S1 shows that spindle length changes dramatically at the meiosis-to-mitosis transition in Ciona and Xenopus, though cell size does not. Fig. S2 shows the effects of small molecules on meiotic spindle morphology in Ciona oocytes and effects of CK2 inhibition on meiotic and mitotic X. laevis extracts. Fig. S3 shows that CK2 activity is reduced by CK2 inhibition in X. laevis extract. Fig. S4 shows the proteomic changes between meiosis and mitosis and upon CK2 inhibition. Fig. S5 shows the phosphoproteomic changes between meiosis and mitosis and upon CK2 inhibition. Fig. S6 shows that inhibition of the RanGTP-mediated spindle assembly pathway reduces TPX2 and tubulin intensity at spindle poles in X. laevis egg extracts. Table S1 shows the summary of the proteomic data. Table S2 shows the summary of the phosphoproteomic data. Table S3 shows the GO enrichment analysis results—proteins enriched in meiosis relative to mitosis. Table S4 shows the microtubule-binding proteins enriched in meiosis relative to mitosis. Table S5 shows the GO enrichment analysis results—proteins enriched in mitosis relative to meiosis. Table S6 shows the GO enrichment analysis results—proteins with phosphosites enriched in mitosis. Table S7 shows the proteins in spindle GO category (GO:0005819) with phosphosites enriched in mitosis relative to meiosis. Table S8 shows the candidate proteins annotated with localization data.
Data availability
Mass spectrometry data are available at ProteomeXchange: PXD053646 and MassIVE: MSV000095250. All other data are available from the corresponding authors upon request.
Acknowledgments
We thank Matthew Swaffer, Coral Zhou, Xiao Liu, Gabriel Cavin-Meza, Cordell Clark and Alex Lessenger for feedback on the manuscript; Yasaswini Sampathkumar for importin-β(71–876) protein; Michael Levine and Laurence Lemaire for training and advice on Ciona experiments; and Marina Crowder for advice.
This work was supported by the National Institutes of Health MIRA grant R35GM118183 and the Flora Lamson Hewlett Chair in Biochemistry to R. Heald, an EMBO long-term postdoctoral fellowship to H. Cantwell, and National Institute of General Medical Sciences grant R35GM119455 to A.N. Kettenbach.
Author contributions: H. Cantwell: conceptualization, formal analysis, funding acquisition, investigation, methodology, visualization, and writing—original draft, review, and editing. H. Nguyen: formal analysis and investigation. A.N. Kettenbach: data curation, formal analysis, funding acquisition, investigation, project administration, resources, software, supervision, and writing—review and editing. R. Heald: conceptualization, funding acquisition, project administration, resources, supervision, validation, and writing—review and editing.
References
Author notes
Disclosures: The authors declare no competing interests exist.
Supplementary data
shows the summary of proteomic data.
shows the GO enrichment analysis results—proteins enriched in meiosis relative to mitosis.
shows the GO enrichment analysis results—proteins enriched in mitosis relative to meiosis.