Skip to article sections

The Fanconi anemia (FA) DNA repair pathway is required for the repair of DNA interstrand cross-links (ICLs). ICLs are caused by genotoxins, such as chemotherapeutic agents or reactive aldehydes. Inappropriately repaired ICLs contribute to hematopoietic stem cell (HSC) failure and tumorigenesis. While endogenous acetaldehyde and formaldehyde are known to induce HSC failure and leukemia in FA patients, the effects of other toxic metabolites on FA pathogenesis have not been systematically investigated. Using a metabolism-focused CRISPR screen, we found a synthetically lethal interaction between ALDH9A1 and the deficiency of the FA pathway. Combined deficiency of ALDH9A1 and FANCD2 causes genomic instability, apoptosis, and decreased hematopoietic colony formation. Fanca−/−Aldh9a1−/− mice exhibited an increased incidence of ovarian tumors. A suppressor CRISPR screen revealed that the loss of ATP13A3, a polyamine transporter, resulted in improved survival of FANCD2−/−ALDH9A1−/− cells. These findings nominate high intracellular polyamines and the resulting 3-aminopropanal and acrolein as sources of endogenous DNA damage in patients with FA.

Fanconi anemia (FA) is the most common inherited bone marrow failure (BMF) syndrome (Kutler et al., 2003; Shimamura and Alter, 2010). Up to 90% of patients develop BMF by the age of 40, with a high frequency of disease progression to myelodysplastic syndromes and acute myeloid leukemia (Alter, 2014; Kutler et al., 2003). Currently, allogeneic hematopoietic stem cell (HSC) transplantation is the only curative treatment for HSC failure in FA. However, it still poses significant risks of early mortality, and it increases the already high risk of solid tumors, including squamous cell carcinomas of the aerodigestive tract (Bierings et al., 2018; Dufour, 2017). FA is caused by mutations in one of the 23 known FANC genes (FANCA–FANCX) (Wang and Smogorzewska, 2015; Knies et al., 2017; Nalepa and Clapp, 2018; Harrison et al., 2025). Cells from patients with FA exhibit increased chromosomal breakage when exposed to cross-linking agents, such as mitomycin C (MMC) or diepoxybutane, which create DNA interstrand cross-links (ICLs) (Kottemann and Smogorzewska, 2013). When ICLs are not properly repaired due to the deficiency of the FA pathway, HSCs activate the p21–p53 pathway and undergo cell cycle arrest and apoptosis (Ceccaldi et al., 2012).

While the cellular defect in FA is impaired DNA ICL repair, the source of the DNA damage itself is not completely understood. Recent studies in genetically modified mouse models, which combined deficiency of the aldehyde detoxification system and the FA pathway deficiency, point to acetaldehyde and formaldehyde as important endogenous aldehydes that create ICLs (Garaycoechea et al., 2012; Langevin et al., 2011; Pontel et al., 2015). Detoxifying enzymes—acetaldehyde dehydrogenase 2 (ALDH2) and alcohol dehydrogenase 5 (ADH5)—are required to metabolize these reactive aldehydes and prevent stem cell failure and leukemia in FA (Wang et al., 2022). These findings are corroborated by human studies showing that dominant-negative ALDH2*2 variants in FA patients (Hira et al., 2013) and combined ADH5/ALDH2 deficiency both result in accelerated BMF and leukemia (Dingler et al., 2020; Jung and Smogorzewska, 2021; Oka et al., 2020).

Humans are exposed to more than 300 aldehyde compounds produced endogenously or found in the environment, including food (Feron et al., 1991). There are 19 ALDH and 8 ADH superfamily genes in humans, working often redundantly to metabolize these aldehyde species (Jackson et al., 2011). Despite extensive research, the complex defense network of aldehyde detoxification is yet to be understood.

To discover previously unknown endogenous sources of ICLs, we performed a CRISPR knockout (KO) screen comparing the survival of the WT and FANCD2−/− Jurkat cells. We found that the loss of ALDH9A1, which is known to metabolize aminoaldehydes in vitro (Končitíková et al., 2019), results in synthetic lethality in FANCD2−/− cells, due to DNA damage–induced apoptosis. Combined deficiency of FANCD2 and ALDH9A1 in human HSCs resulted in growth defects, and the Fanca−/−Aldh9a1−/− mice had an increased incidence of solid tumors with aging. By performing a suppressor screen, we also found that the loss of ATP13A3 rescued the synthetic lethality of FANCD2−/−ALDH9A1−/− cells. ATP13A3 is part of the polyamine transport system and is known to transport polyamines from endosomes to the cytosol (Hamouda et al., 2021; Sekhar et al., 2022). Importantly, polyamines are metabolized into aminoaldehydes, such as 3-aminopropanal (Seiler, 2004). Therefore, our data suggest that the loss of ATP13A3 reduces intracellular polyamines and, subsequently, their metabolite aminoaldehydes, which are deleterious to cells lacking the FA repair pathway.

Identification of ALDH9A1 as a protein necessary for the survival of FANCD2-deficient cells

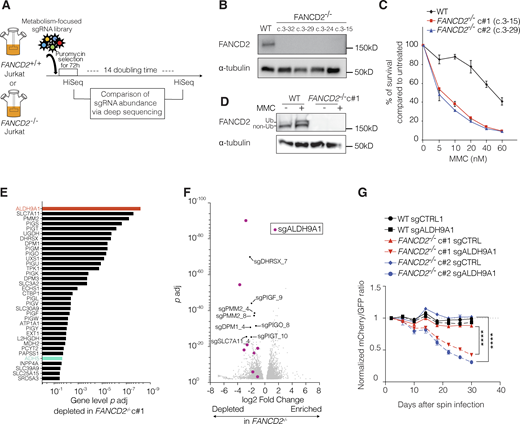
We hypothesized that eliminating a pathway that normally detoxifies a metabolite capable of creating ICLs would result in death or slow growth of FANCD2−/− cells. To identify novel endogenous sources of DNA damage, we performed a CRISPR KO screen using a metabolism-focused sgRNA library (3,000 genes, 10 sgRNA per gene, total 30,000 sgRNA) in a Cas9-expressing lentiviral vector (Birsoy et al., 2015) in both WT and FANCD2−/− Jurkat cells (Fig. 1, A and B). Jurkat cells have an active FA pathway (Fig. 1, C and D), and unlike some other leukemia cell lines (Yang et al., 2021), they can survive without the FA pathway, enabling us to model FA in these cells. FANCD2−/− Jurkat clones used in our experiments were created by transient expression of Cas9-sgRNA lentiviral vector followed by single-cell cloning. FANCD2 protein expression was confirmed to be absent in four KO clones with biallelic FANCD2 mutations, and two selected clones were used for experiments (Fig. 1, B–D and Fig. S1, A–D). They were sensitive to MMC, the hallmark of FA (Fig. 1 C). For the screen, WT and FANCD2−/− Jurkat cells were infected at a MOI of 0.3 in biological triplicate. 1000x representation per sgRNA was maintained throughout the experiment. sgRNA representation was assessed immediately after puromycin selection and after 14 population doublings.

The results of the screen are shown in Table S1 and Table S2. ALDH9A1 was the top synthetically lethal gene with FANCD2 deficiency (Fig. 1 E and Table S1). Eight out of ten sgALDH9A1s were significantly depleted in FANCD2−/− Jurkat cells (Fig. 1 F and Table S2). ALDH9A1 is a cytosolic tetrameric enzyme and is known to metabolize aminoaldehydes (Končitíková et al., 2019). ADH5, but not ALDH2, was also significantly depleted in FANCD2−/− Jurkat cells, indicating that the sensitivity to different aldehydes may depend on the cell type.

To validate ALDH9A1 as having a synthetic lethal interaction with FA deficiency, we performed an in vitro fluorescence-based competition assay. We found a preferential loss of cells expressing mCherry-sgALDH9A1 in two independent FANCD2−/− Jurkat clones, but not in WT cells (Fig. 1 G). FANCD2−/− cells targeted by sgALDH9A1 also showed slower growth compared with FANCD2−/− cells targeted by the control guide (sgCTRL) (Fig. S1 E). Targeting of FANCD2−/− cells by sgADH5, but not by sgALDH2 or sgCTRL, showed similar results. Differences were not observed in WT cells (Fig. S1, F and G). We note that levels of ALDH2 were low in Jurkat cells, with ALDH2 being only the 10th most abundant transcript out of the 19 ALDHs. ALDH9A1 was the third most abundant after ALDH1A2 and ALDH18A1 in Jurkat cells (Fig. S2, A and B).

SLC7A11 and SLC3A2, the cystine/glutamate antiporters that form system Xc- (also known as xCT), were the second and 16th hits in our screen (Fig. 1 E). They provide reduced glutathione for redox balance and formaldehyde metabolism (Burgos-Barragan et al., 2017; Liu et al., 2020a; Liu et al., 2020b; Umansky et al., 2022). While there was an increased depletion of sgSLC7A11s in FANCD2−/− cells in the pooled screen, the loss of SLC7A11 was also detrimental to the growth of WT cells (Fig. S1 H), indicating the essential nature of their function in Jurkat cells, independent of FA pathway status.

Multiple sgRNA targeting the genes in the glycosylpho‐sphatidylinositol-anchored protein biosynthesis pathway (Paulick and Bertozzi, 2008) were also found to be significantly underrepresented in FANCD2−/− compared with WT Jurkat cells (Fig. 1 E). Gene Ontology (GO) enrichment analysis confirmed this finding (Fig. S1 I). As the proper transfer of glycosylphosphatidylinositol anchor to nascent protein serves as an ER exit signal (Paulick and Bertozzi, 2008), it is possible that increased ER stress causes preferential cell death in FANCD2−/− cells, but these genetic interactions will have to be explored further.

Combined deficiency of ALDH9A1 and FANCD2 results in increased DNA damage and apoptosis

To investigate the cause of synthetic lethality observed in ALDH9A1 and FANCD2 deficiency, WT and FANCD2−/− Jurkat cells were edited by RNP delivery of Cas9 protein and sgALDH9A1 or sgCTRL by nucleofection (Fig. 2 A). With this approach, we achieved consistently high editing efficiency in both WT and the two independent FANCD2−/− clones at early time points. Sequencing on days 24 and 35 revealed a selective decrease in insertions/deletions (indel) levels only in the two FANCD2−/− clones, confirming a preferential loss of cells with combined FANCD2 and ALDH9A1 deficiency, but not with ALDH9A1 deficiency alone (Fig. 2 B). Increased DNA damage was evident by the presence of increased chromosome breakage and increased numbers of 53BP1 and γ-H2AX foci in FANCD2−/−, but not in WT cells targeted by sgALDH9A1 (Fig. 2, C–F and Fig. S1 J). Cells with combined FANCD2 and ALDH9A1 deficiency also displayed increased annexin-V+ propidium iodide- (early apoptotic) cells and sub-G0 fraction in cell cycle analysis, consistent with DNA damage–induced apoptosis and cell death (Fig. 2, G and H).

Combined ALDH9A1 and the FA pathway deficiency decrease the survival of HSCs

To examine the effect of the combined deficiency of ALDH9A1 and the FA pathway on HSCs, we edited FANCD2 and/or ALDH9A1 in human umbilical cord blood CD34+ cells and examined their cutting efficiency from a bulk sample at baseline and from individual colonies after 14 days (Fig. 3 A). While we achieved lower cutting efficiency for each gene at baseline when attempting a double KO (Fig. 3 B), the double KO cells produced the fewest hematopoietic colonies and the lowest frequency of GEMM colonies (Fig. 3, C and D). To examine the editing efficiency and zygosity of individual HSCs, each colony was harvested and sequenced. Of 85 examined colonies that were transfected with both sgFANCD2 and sgALDH9A1, 14.7% (12–13 colonies out of 85) would be expected to have biallelic mutations in both genes. However, we only observed 4.7% (4 colonies out of 85) to have the double KO genotype, resulting in the observed-to-expected ratio of 0.32 (Fig. 3 E). We calculated the expected ratio based on the baseline editing efficiency for each gene and their resultant frequency of colonies with biallelic indels after 2-wk methylcellulose culture, with an assumption that FANCD2 and ALDH9A1 editing occurs independently of each other. Our data suggest that a combined deficiency of FANCD2 and ALDH9A1 decreases the survival of HSCs.

To achieve a more uniformly FANCD2-deficient human HSC model, we used lentiviral shRNA knockdown followed by CRISPR Cas9-mediated editing of the ALDH9A1 gene (Fig. 3 F). At baseline, we achieved 73–77.4% ALDH9A1 frameshift indels as assessed by amplicon NGS (Fig. 3 G). Human CD34+ cells with a combined FANCD2 and ALDH9A1 deficiency (shFANCD2/sgALDH9A1) produced significantly lower numbers of hematopoietic colonies compared with WT (shLuc/sgCTRL) or ALDH9A1-KO (shLuc/sgALDH9A1), and a trend toward the lower numbers of colonies was observed compared with FANCD2-KD (shFANCD2/sgCTRL) (Fig. 3 H).

Fanca−/−Aldh9a1−/− mice develop mild hematopoietic phenotypes but show an increased incidence of ovarian tumors with aging

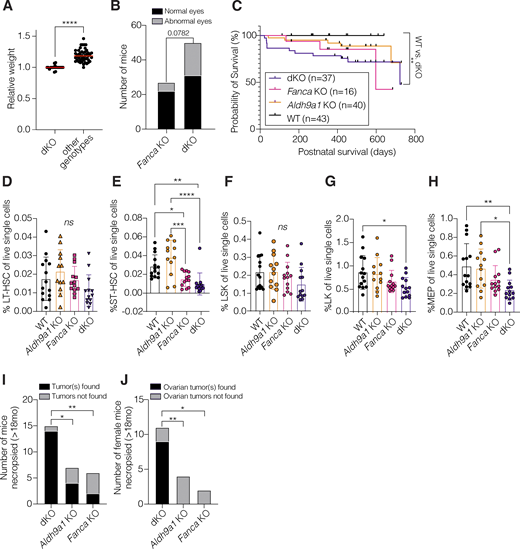
To examine the in vivo hematopoietic phenotypes due to increased endogenous aldehydes that we expect to form in the absence of ALDH9A1, we generated Fanca−/−Aldh9a1−/− (dKO) mice. These mice were born at the Mendelian ratio, were small in size compared with their littermates, and had more frequent eye abnormalities, which have been previously occasionally observed in FA mouse models (Crossan et al., 2011; Langevin et al., 2011) (Fig. 4, A and B). The male-to-female ratio among live-born was 1–1.17. Overall survival of the dKO mice was significantly shorter than the WT mice, but significant survival differences were not observed when compared with Fanca−/− or Aldha9a1−/− mice (Fig. 4 C).

dKO mice had the lowest platelet counts compared with WT, Fanca−/−, or Aldh9a1−/− control mice, but a statistically significant difference was observed only between Aldh9a1−/− and dKO mice (Fig. S3 C). Total white blood counts and hemoglobin levels were similar between groups (data not shown). Evaluation of bone marrow aspirates revealed that long-term HSC, short-term HSC, lineage-negative, Sca1-positive, cKit-high, lineage-negative, cKit-high, and megakaryocyte-erythroid population were the lowest in dKO mice, although the decreases observed in dKO mice were only trending when compared with Fanca−/− mice (Fig. 4, D–H; and Fig. S3, A and B).

The effects of ALDH9A1 deficiency in Fanca−/− mice became more evident with aging. Of the 15 complete necropsies of aged Fanca−/−Aldh9a1−/− mice (11 females and 4 males; age range: 18–24 mo), we observed an increased solid tumor incidence, particularly ovarian tumor incidence, compared with other control groups: 14 of the 15 mice were found to have solid tumors, nine out of 11 aged female mice had ovarian tumors, and an additional mouse had bilateral ovarian sex cord stromal hyperplasia, which was considered most likely a preneoplastic state. Fig. 4, I and J; Fig. S4 A; and Table S3). Ovarian tumors were not observed in any other genotypes (Fig. 4 J). Lymphomas were also frequently observed in Fanca−/−Aldh9a1−/− mice (eight out of 15), most commonly involving mesenteric lymph nodes, followed by mediastinal lymph nodes and thymus. Of note, we performed complete necropsies on only two out of 43 WT mice, and both of them showed solid tumors common in the Sv129 × C57BL/6 background (Table S3) (Haines et al., 2001). The only female WT mouse necropsied did not have ovarian tumors.

The loss of ATP13A3 rescues growth defect of FANCD2−/−ALDH9A1−/− cells

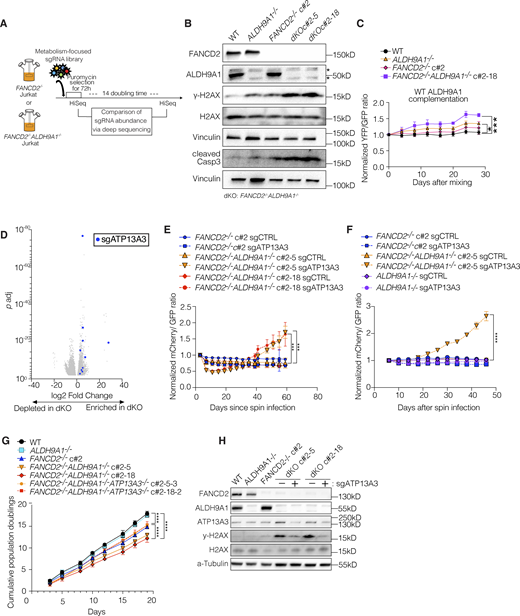
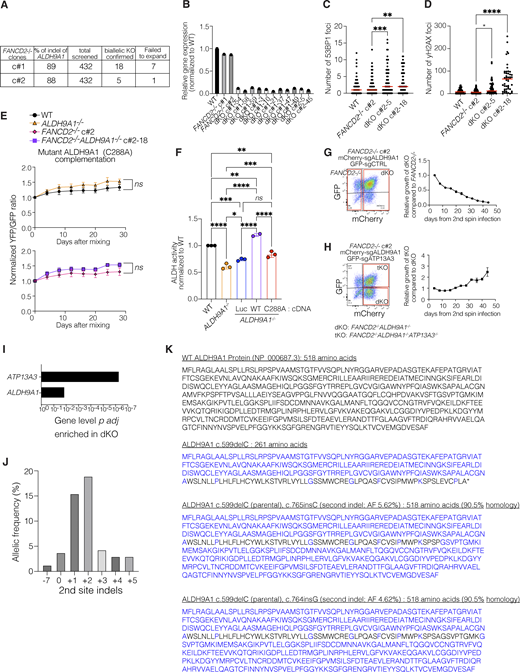
Previous work has implicated ALDH9A1 in the detoxification of aminoaldehydes in vitro (Končitíková et al., 2019). However, the in vivo substrates of the enzyme have not been identified. To experimentally determine the pathways that created metabolites detoxified by the ALDH9A1, we performed a suppressor screen using the FANCD2−/−ALDH9A1−/− cells (Fig. 5 A). To derive FANCD2−/−ALDH9A1−/− clones, we performed nucleofection of Cas9-sgALDH9A1-RNP, and 432 clones were screened from each of FANCD2−/− c#1 and c#2. Most of the clones did not survive. Biallelic ALDH9A1 KO was confirmed only in 18 and 5 clones from FANCD2−/− clone #1 (c#1) and clone 2 (c#2), respectively (Fig. S5, A and B). A third of those biallelic KO clones failed to expand. Compared with 88–89% indels of ALDH9A1 after nucleofection, the frequency of surviving biallelic dKO clones was extremely low (2.5% and 0.9% for FANCD2−/− c#1 and c#2, respectively), confirming that ALDH9A1 KO is deleterious when combined with FANCD2 deficiency. We also confirmed that these biallelic dKO clones contained higher levels of γ-H2AX and cleaved caspase 3 by western blot (Fig. 5 B) and had increased numbers of 53BP1 foci and γH2AX foci as assessed by immunofluorescence staining (Fig. S5, C and D). Complementation of FANCD2−/−ALDH9A1−/− cells with WT ALDH9A1 cDNA led to a significant growth advantage compared with FANCD2−/−ALDH9A1−/− cells overexpressing luciferase. This growth benefit was significantly different from that observed in WT cells (Fig. 5 C). In contrast, when complemented with ALDH9A1 C288A (a catalytic-dead mutant) cDNA, no significant differences were noted between the groups, although some residual activity of ALDH9A1 C288A was apparent compared with the parental cells (Fig. S5, E and F). Once validated, the dKO clones were used to perform a CRISPR screen with the metabolism library, this time looking for guides that would lead to better growth of FANCD2−/−ALDH9A1−/− cells (Fig. 5, A and B; and Fig. S5, C and D).

The results of the suppressor screen are shown in Tables S4 and S5; and Fig. 5 D. Loss of only one gene, ATP13A3, improved the growth of FANCD2−/−ALDH9A1−/− cells when perturbed with multiple guide RNAs (Fig. 5 D and Fig. S5 I). To validate the rescue of FANCD2−/−ALDH9A1−/− cells by ATP13A3 KO, we performed an in vitro fluorescence-based competition assay, as described earlier, using FANCD2−/−, ALDH9A1−/−, and two independent FANCD2−/−ALDH9A1−/− clones. As expected, we observed expansion of cells with mCherry-sgATP13A3 compared with GFP-sgCTRL in the two FANCD2−/−ALDH9A1−/− clones, but not in the FANCD2−/− or ALDH9A1−/− clones or cells with mCherry-sgCTRL (Fig. 5, E and F).

To ensure that the growth rescue observed from the loss of ATP13A3 in FANCD2−/−ALDH9A1−/− clones was not an artifact related to rare surviving cells, we examined this interaction further in the FANCD2−/− clone using sequential transduction. Initially, we transduced with mCherry-sgALDH9A1, followed by a second transduction with either GFP-sgCTRL or GFP-sgATP13A3. Our serial transduction experiments reinforced that the loss of ALDH9A1 induces synthetic lethality in FANCD2−/− cells and confirmed that the loss of ATP13A3 leads to growth rescue in FANCD2−/−ALDH9A1−/− cells (Fig. S5, G and H). Consistent with other results, the growth rate of FANCD2−/−ALDH9A1−/− cells recovered to the level of FANCD2−/− when ATP13A3 was targeted in two independent FANCD2−/−ALDH9A1−/− clones (Fig. 5 G). The degree of DNA damage assessed by γ-H2AX band intensity on a western blot was also reduced by ATP13A3 loss in FANCD2−/−ALDH9A1−/− clones (Fig. 5 H).

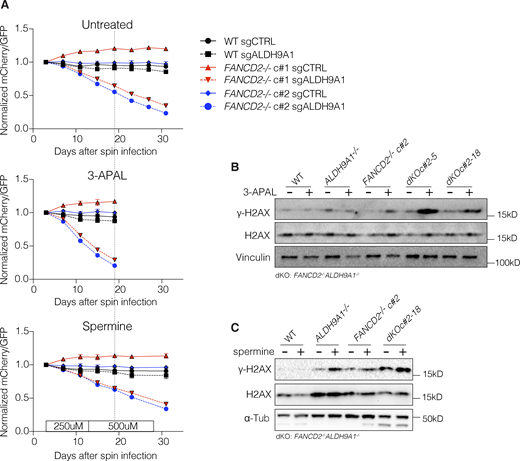
To assess the response of FANCD2−/−ALDH9A1−/− cells to candidate endogenous aldehyde, 3-aminopropanal, we performed a competition assay in its presence. GFP-sgCTRL–expressing cells were mixed with either mCherry-sgALDH9A1 or mCherry-sgCTRL–expressing cells at a 1:1 ratio. We treated cells every 4 days to mimic low-level endogenous DNA damage. Our results show that FANCD2−/− clones targeted by sgALDH9A1 (i.e., dKO condition) dropped out from culture more rapidly in the presence of 3-aminopropanal, which also caused DNA damage as assessed by γ-H2AX levels (Fig. 6, A and B). However, we did not observe a faster rate of drop out of dKO cells after treatment with spermine when compared with untreated control (compare top and bottom graphs in Fig. 6 A), despite the presence of increased levels of γ-H2AX (Fig. 6 C). Spermine should be oxidized to generate 3-aminopropanal, but it is unclear if the 3-aminopropanol was produced under the conditions tested. It is possible that the human serum used to grow the cells in this experiment did not support its formation or that spermine had other cellular growth–promoting effects.

Unexpectedly, the sgRNAs targeting ALDH9A1 represented the next top hits enriched in FANCD2−/−ALDH9A1−/− cells in the suppressor screen (Fig. S5 I). We hypothesized that targeting ALDH9A1 mutant cells for the second time might have restored the reading frame and generated partially functional proteins that promoted the survival of FANCD2−/−ALDH9A1−/− cells. This was indeed the case, as sequencing the ALDH9A1 locus confirmed that a second-site indel resulted in the restoration of the ALDH9A1 reading frame, which would be predicted to partially restore the activity of ALDH9A1 (Fig. S5, J and K). These data further confirm that the ALDH9A1 status is important for the normal function of the FA pathway–deficient cells.

Endogenous metabolic byproducts, such as reactive aldehydes, are significant sources of DNA damage (Garaycoechea et al., 2018; Shen et al., 2020). Inherited deficiency of aldehyde detoxification significantly worsens the outcome of FA in both humans and mice (Garaycoechea et al., 2012; Hira et al., 2013; Langevin et al., 2011; Pontel et al., 2015). The ALDH2*2 variant (SNP rs671) is widely prevalent among the East Asian population, which led to the discovery that the ALDH2*2 variant accelerates disease progression in Japanese FA patients. Whether ALDH isoenzymes other than ALDH2 and ADH isoenzymes other than ADH5 provide defense against aldehyde-induced DNA damage in FA had not been investigated. Our study tested 3,000 genes in the metabolic pathway in Jurkat cells that were deficient in FANCD2 to identify those that would lead to ICLs when deleted. ALDH9A1 was the most significantly depleted gene in FANCD2−/− compared with WT cells. The loss of ADH5 also caused synthetic lethality in FANCD2−/− as expected, but to a much lesser degree than the loss of ALDH9A1. Surprisingly, the loss of ALDH2 did not cause synthetic lethality in FANCD2−/− Jurkat cells in pooled screen or single gene KO experiments. This could be due to several factors. ALDH2 was expressed with relatively low abundance compared with ALDH9A1 or other ALDH isoenzymes in Jurkat cells (Fig. S2, A and B), which raises the possibility that these cells are less dependent on ALDH2 for the detoxification of their endogenously produced aldehydes. They might be producing low levels of the metabolites detoxified by ALDH2 or other enzymes expressed in the cells might act redundantly to remove them. Our findings in Jurkat cells contrast with recent observations in which multiple acute myelogenous leukemia cell lines were dependent on the FA pathway due to epigenetic silencing of ALDH2 (Yang et al., 2021). This suggests that cell line–specific and potentially tissue-specific dependencies exist in the aldehyde detoxification system, and we believe that understanding these dependencies across tissues may explain the presence of tissue-dependent phenotypes in FA. We also posit that the individual differences in the expression of these detoxifying enzymes or in the levels of toxic endogenous metabolites caused by genetic or epigenetic variations may be responsible for different susceptibility to DNA damage and the risk of cancer development in different individuals.

The mouse model of Fanca−/−Aldh9a1−/− (dKO) showed milder hematopoietic phenotypes compared with previously reported Fancd2−/−Aldh2−/− or Fancd2−/−Adh5−/− mouse models (Garaycoechea et al., 2012; Pontel et al., 2015). However, our dKO mouse model showed frequent eye abnormalities and ovarian tumors, which was significantly higher than previously reported in Fanca−/− mouse models, again pointing out that different tissues may depend on different alcohol and aldehyde detoxifying enzymes. It is also possible that the different mouse backgrounds may alter the severity of the phenotype.

Species-specific differences could explain the observations that the phenotypes in human Jurkat and hematopoietic cells have not fully translated to phenotypes in the mouse model. Analysis of the publicly available RNA-seq dataset confirmed that ALDH2 is the major aldehyde-detoxifying enzyme expressed in mouse HSPCs, while human HSPCs express a variety of aldehyde-detoxifying enzymes, including ALDH9A1, at higher levels than ALDH2, raising the possibility that ALDH9A1 may play more important roles in human hematopoiesis than in the mouse hematopoiesis (Fig. S3 D).

Future studies will have to address different metabolite concentrations and the activity of the detoxification enzymes present at different stages of hematopoiesis to fully understand the contribution of different detoxification pathways to the health of hematopoietic stem and progenitor cells. Due to technical difficulties, we were not able to quantify 3-aminopropanal or other reactive aldehydes in our cell lines and mouse models. Specific experiments will have to be performed to directly compare the contribution of ALDH2 and ALDH9A1 in human and mouse hematopoietic stem or progenitor cells.

The role of ALDH9A1 in human hematopoiesis would be strengthened if variants of ALDH9A1 were to be found to modify the presentation of patients with FA. Our studies (Jung et al., 2022, Preprint) have not had adequate phenotypic information to appropriately assess the influence of identified variants in modifying the onset of disease. Future studies should take a comprehensive view of the full complement of detoxification enzymes in FA patients and correlate the presence of any variants with granular phenotypic patient data. This will be difficult as FA, which is already a rare disease, has high genetic and phenotypic heterogeneity.

Increased solid tumor incidence in aged dKO mice compared with control genotypes suggests that the increased basal levels of endogenous DNA damage due to metabolites cleared by ALDH9A1 enzyme over their lifetime can contribute to tumorigenesis. This is akin to what is observed in FA patients with hypomorphic FANC mutations, who often present with solid tumors later in life with apparently normal bone marrow function until being challenged by chemotherapy (Castells-Roca et al., 2021; Lach et al., 2020). These findings suggest that the level and duration of DNA damage, determined by an individual’s DNA repair efficiency as well as aldehyde detoxification capacity, contribute to FA patient’s clinical course—early onset BMF versus solid cancer later in life. A remaining question is whether variants of ALDH9A1 could be associated with ovarian or other cancers, even if the FA pathway is intact.

The power of genetics brought by pooled CRISPR screens also identified the presumed culprit aldehyde in the ALDH9A1 deficiency. Search for genes promoting survival of FANCD2−/−ALDH9A1−/− cells identified ATP13A3. ATP13A3 transports endocytosed polyamines into the cytosol (Hamouda et al., 2021), where they can be metabolized into 3-aminopropanal, which can spontaneously convert to acrolein (Pegg, 2013). Therefore, the loss of ATP13A3 is predicted to decrease the generation of 3-aminopropanal and acrolein, leading to decreased DNA damage and enhanced growth of FANCD2−/−ALDH9A1−/− cells. The presence of these aldehydes in different tissues needs to be investigated in future studies.

In summary, we identified ALDH9A1 deficiency as a previously unrecognized source of endogenous DNA damage. Combined deficiency of ALDH9A1 and FANCD2 caused synthetic lethality due to increased DNA damage and apoptosis. Despite the limitations of our study, such as the mild hematopoietic phenotypes in the mouse model and the lack of direct aldehyde quantification, we identified that the loss of ATP13A3 rescued FANCD2−/−ALDH9A1−/− cells, presumably by decreasing substrates for 3-aminopropanal, which requires ALDH9A1 for its metabolism. Future studies are needed to determine whether enhancement of ALDH9A1 activity or inhibition of ATP13A3 activity could be used to decrease DNA damage load in cells from FA patients and in the general population.

Cell culture

Jurkat clone E6-1 was purchased from ATCC. Jurkat cells were cultured in Roswell Park Memorial Institute 1640 medium (RPMI 1640; Gibco) supplemented with 10% FBS (Atlanta Biologicals), 1% Pen Strep (Gibco), and 1% GlutaMAX-I 100X (Gibco). For spermine treatment, cells were cultured in complete media containing 10% human serum (Sigma-Aldrich) instead of FBS. The polyamine oxidase in FBS metabolizes polyamine to 3-aminopropanal and acrolein rapidly, resulting in cell death within 1 day in all cells tested.

Derivation of FANCD2−/− Jurkat clones

sgFANCD2 was cloned into pLentiCRISPRv2 (#52961; Addgene) as previously described (Sanjana et al., 2014). In brief, pLentiCRISPRv2 was linearized by BsmBI (NEB) and dephosphorylated by calf intestinal alkaline phosphatase (NEB). Gel electrophoresis was performed to separate fragments according to their sizes. About 2-kb filler was confirmed, and ∼13-kb band was excised, and gel extraction was performed using QIAquick Gel Extraction Kit (Qiagen). Top (5′-CAC​CGA​GTT​GAC​TGA​CAA​TGA​GTC​G-3′) and bottom (5′-AAA​CCG​ACT​CAT​TGT​CAG​TCA​ACT​C-3′) oligos were annealed using T4 polynucleotide kinase (NEB). Ligation of BsmBI-digested plasmid and 1:200 diluted oligo duplex was performed using Quick Ligation Kit (NEB). Bacterial transformation was performed using Stbl3, and plasmid DNA was isolated using HP Plasmid Maxiprep Kit (Sigma-Aldrich). pLentiCRISPR v2-sgFANCD2 was transiently expressed in Jurkat by 4D Nucleofector (Lonza) according to the manufacturer’s protocol. 1 day after nucleofection, puromycin was started at 2 µg/ml and continued for 2 days, after which surviving cells were single-cell cloned. Biallelic targeting of the FANCD2 sequence was confirmed by Sanger sequencing, and the FANCD2 protein expression was confirmed to be absent by western blot.

CRISPR KO screening

A metabolism-focused CRISPR screening was performed as previously described (Birsoy et al., 2015). In short, a pooled sgRNA library with LentiCRISPR v1 vector was used to produce lentivirus by transfection of HEK293T (ATCC) using Trans-IT (Mirus Bio) according to the manufacturer’s protocol. MOI was estimated using Jurkat cells by CellTiter-Glo assay (Promega). To ensure the integration of only one virus into one cell, lentivirus-containing sgRNA library was used at MOI of <0.3. The volume of virus-containing supernatant to achieve 30% survival after puromycin selection was determined in the virus titration experiments as described above. Jurkat cells were infected by spin infection at 2,200 RPM at room temperature for 1 h in 6-well plates containing 2 million cells with polybrene 8 µg/ml and lentivirus in a total volume of 2 ml per well.

For the dropout screen, to maintain 1000x representation for each sgRNA in the library throughout the experiment, 100 million cells were infected with the virus per replicate, and at minimum 40 million cells were passaged each time and harvested for gDNA isolation. For the enrichment screen, a representation of 500x was maintained; therefore, 50 million cells were infected with the virus, and at minimum 20 million cells were passaged each time and harvested for genomic DNA. The experiments were performed in three independent replicates per genotype; however, one of three FANCD2−/− replicates was stopped early due to contamination in the dropout screen, which was excluded from data analysis. For the enrichment screen, three independent replicates were used for each FANCD2−/− and FANCD2−/−ALDH9A1−/− clones. One of three FANCD2−/−ALDH9A1−/− replicates was an outlier based on the growth curve and data analysis; therefore, it was removed from the final data analysis. However, sgATP13A3 was still the most enriched sgRNA in the excluded sample, albeit to a lesser degree.

Genomic DNA was isolated using the Blood and Cell Culture DNA Maxi Kit (Qiagen) for the dropout screen and the Zymo QuickDNA Plus Midiprep Kit (Zymo Research) for the enrichment screen. sgRNA inserts were amplified with NEBNext High-Fidelity 2X PCR Master Mix for 21 cycles. PCR purification was performed using AMPure XP (Beckman Coulter). Purified PCR products were pooled in equimolar concentration and sequenced on a NEXTseq 500 (Illumina) with high-output 75-bp single-read setting.

Sequencing data quality was checked using the ShortRead package in R. Sequencing reads were uniquely aligned to the sgRNA library using the Rsubread Bioconductor package’s align function (non-default parameters are unique = TRUE, nBestLocations = 1, type = “DNA”, and TH1 = 1), and reads per sgRNA were counted using the Rsubread’s featureCounts function. Normalized sgRNA abundance and differential sgRNA enrichment between conditions were calculated using the DESeq2 Bioconductor package. Gene-level depletion or enrichment was summarized as both the number of sgRNAs per gene showing enrichment or depletion between conditions with a Benjamini–Hochberg adjusted P value <0.05 and gene-level scores were quantified using the mean-rank gene-set enrichment test implemented in the limma Bioconductor package’s genesettest function. GO enrichment was performed using the TopGO Bioconductor package.

In vitro competition assay

For the first competition assay described in Fig. 1 G, sgALDH9A1 was inserted into pLentiCRISPRv2-mCherry (# 99154; Addgene), and sgCTRL was inserted into pLentiCRISPRv2-GFP (# 82416; Addgene) and pLentiCRISPRv2-mCherry. These plasmids were used to generate lentivirus by transfection of HEK293T using Trans-IT. WT, FANCD2−/− c#1, and c#2 were infected with these viruses independently by spin infection as described above. 2 days after spin infection, cells infected with lentivirus containing pLentiCRISPR-GFP-sgCTRL were mixed with cells infected with lentivirus containing either pLentiCRISPRv2-mCherry-sgALDH9A1 or pLentiCRISPRv2-mCherry-sgCTRL. The ratio of mCherry/GFP was obtained for baseline on the day of mixing and then every 4 days by LSRII. The ratio of mCherry/GFP on subsequent days was normalized to that of the baseline. The same competition assays were performed in the presence of 12.5 µM 3-aminopropanl or spermine (250 µM until day 15, and then the dose was increased to 500 µM), which was retreated every 4 days (Fig. 6 A).

For the second competition assay described in Fig. 5, D and E, sgATP13A3 was inserted into pLentiCRISPRv2-mCherry (# 99154; Addgene). Lentiviruses were produced with one of pLentiCRISPRv2-mCherry-sgATP13A3, pLentiCRISPRv2-mCherry-sgCTRL, or pLentiCRISPRv2-GFP-sgCTRL. FANCD2−/− c#2, ALDH9A1−/−, FANCD2−/−ALDH9A1−/− c#1, and c#2 were infected with these viruses independently by spin infection as described above. 3 days after spin infection, cells infected with lentivirus containing pLentiCRISPR-GFP-sgCTRL were mixed with cells infected with lentivirus containing either pLentiCRISPRv2-mCherry-sgATP13A3 or pLentiCRISPRv2-mCherry-sgCTRL. The ratio of mCherry/GFP was obtained for baseline on the day of mixing and then every 4 days by Aurora cytometer (Cytek Biosciences). The ratio of mCherry/GFP on subsequent days was normalized to that of the baseline.

ALDH9A1 complementation assay

WT ALDH9A1 cDNA plasmid was purchased from OriGene (cat# 216921). To generate catalytic-dead ALDH9A1, the ALDH9A1 C288A missense variant was generated by QuickChange II Site-Directed Mutagenesis Kit (Agilent). WT and missense variant cDNAs were moved from pDONR223 to pLKO.DEST.YFP (plasmid# 32683; Addgene; a gift from Ming-Sound Tsao, University of Toronto, Toronto, Canada) using Gateway cloning kits (Thermo Fisher Scientific). Luciferase cDNA was also transferred from pDONR223_Luciferase (plasmid# 25894; Addgene; a gift from David Root, Broad Institute, Cambridge, MA, USA) to pLKO.DEST.EGFP (plasmid# 32684; Addgene; a gift from Ming-Sound Tsao, University of Toronto, Toronto, Canada) and used as a control vector. These vectors were used to produce lentivirus by transfection of HEK293T (ATCC) using polyethyleneimine (Polysciences). WT, ALDH9A1−/−, FANCD2−/−, and FANCD2−/−ALDH9A1−/− cells were transduced by lentivirus carrying luciferase-GFP or ALDH9A1-WT-YFP or ALDH9A1-C288A-YFP. GFP and YFP cells were mixed at a 1:1 ratio. The ratio of YFP/GFP was measured at baseline on the day of mixing and then every 4 days by Aurora cytometer (Cytek Biosciences). The ratio of YFP/GFP on subsequent days was normalized to that of the baseline.

Derivation of bulk KO cells

WT and FANCD2−/− Jurkat cells were nucleofected with Cas9–sgRNA–RNP complex containing either sgCTRL or sgALDH9A1 by 4D Nucelofector (Lonza) using SE Cell Line 4D-Nucleofector X Kit S (Lonza). Bulk KO efficiency was assessed by Sanger sequencing.

Immunofluorescence

At designated time points, cells were harvested and spun on a microscopic slide using a Shandon Cytospin 2 centrifuge. After washing with PBS once, cells were fixed with 3.7% formaldehyde (Sigma-Aldrich) in PBS for 10 min at room temperature. After washing with PBS twice, cells were permeabilized with 0.5% Triton X-100 (Sigma-Aldrich) in PBS for 10 min at room temperature. After washing with PBS twice, cells were incubated in 5% FBS in PBS for 1 h at room temperature for blocking, followed by incubation with primary antibody at 4°C overnight. After washing cells three times with 5% FBS in PBS, the secondary antibody was incubated for 1 h at room temperature. Then, cells were washed three times with 5% FBS in PBS, once with PBS, and mounted with DAPI Fluoromount-G (SouthernBiotech) and coverslips. Images were obtained using a Zeiss Axio Observer A1 microscope with Axiocam 503 mono camera and 63× objective at room temperature, and AxioVision 4.9.1. software was used for image acquisition. Image data were analyzed by CellProfiler 3.1.8.

Chromosome breakage analysis

Cells were arrested with colcemid (0.1 µg per ml of media) for 10 min, harvested, incubated at 37°C for 10 min in 0.075 M KCl, and fixed in freshly prepared methanol:glacial acetic acid (3:1 vol/vol). The fixed suspensions were dropped onto wet slides and dried at 40°C for 60 min before staining with KaryoMAX Giemsa (Invitrogen) in Gurr buffer for 3 min. After rinsing with fresh Gurr buffer followed by distilled water, the slides were air-dried and scanned without mounting for mitotic figures on a Carl Zeiss Axio Imager Z2 microscope equipped with a Metasystems Cool Cube CCD and motorized stage driven by the Metasystems Metafer application using the Zeiss FLUAR 10×/0.50 objective and green light. The metaphases were subsequently recaptured using the Zeiss Plan-APOCHROMAT 63×/1.40 objective through Zeiss Immersol 518 F immersion oil with Metasystems Metafer at room temperature. Captures were exported from Metafer and processed in Adobe Photoshop, with adjustments made to brightness and contrast. The metaphases were scored in a blinded manner for chromatid breaks and radial figures, with total number of breaks plotted for comparison (radial figures are scored as two chromatid breaks).

MMC sensitivity assay

WT and FANCD2−/− Jurkat cells were treated with increasing doses of MMC (Sigma-Aldrich), after which cells were counted using a Z2 Coulter Particle and Size Analyzer (Beckman Coulter). The number of surviving cells was normalized to that of untreated.

Western blotting

Cell lysates were obtained by sonication of cells in 2X Laemmli buffer (Bio-Rad) supplemented with 5% 2-mercaptoethanol (Sigma-Aldrich), boiled at 100°C for 10 min, and then used for western blot. Cell lysates were separated using either a NuPAGE 3–8% Tris-Acetate gel or a 4–12% Bis-Tris gel. After protein gel electrophoresis, proteins were transferred to a methanol-activated Immobilon-P PVDF Membrane (EMD Millipore). After transfer, the membrane was blocked with 5% skim milk in TBS with 0.05% Tween 20 (TBST) for 1 h, followed by incubation with primary antibody either overnight at 4°C or 2 h at room temperature. After washing the membrane with TBST three times, it was incubated with a secondary antibody for 1 h at room temperature. After washing with TBST three times, the membrane was developed using Western Lightening Plus-ECL (Perkin Elmer), and images were obtained by Azure c300 Imaging System (Azure Biosystems). For the protein ladder, Precision Plus Protein Dual Color Standards (Bio-Rad) were used for all western blots, except for Fig. 5 H, in which PageRuler Plus Prestained Protein Ladder (Thermo Fisher Scientific) was used. See Table S7 for the list of antibodies used in the experiments.

Sanger sequencing

DNA sequence flanking an expected cut site was amplified using Phusion High-Fidelity PCR Master Mix with GC Buffer (NEB). PCR purification was performed with EXOSAP-IT (Applied Biosystems). Sanger sequencing of purified PCR product was performed by GENEWIZ or Poochon Scientific. Data were analyzed using the ICE analysis tool by SYNTHEGO (https://ice.editco.bio/#/). See Table S6 for the list of primers and oligos used in the experiments.

Flow cytometry

Mouse HSC flow cytometry was performed on freshly isolated bone marrow. After incubating with ACK lysing buffer (Thermo Fisher Scientific) for 10 min at room temperature for RBC lysis, cells were washed with PBS and incubated with LIVE/DEAD Fixable Near-IR Dead Cell Stain Kit (Invitrogen) for 15 min at room temperature. Cells were then washed with FACS buffer (2% FBS/2 mM EDTA in PBS) and incubated with mouse HSC antibody cocktail (see the list below) for 30 min on ice. After washing with FACS buffer, cells were resuspended in 300 µl FACS buffer for acquisition. Flow cytometry was performed using BD LSR-Fortessa (BD Biosciences) or Cytek Aurora (Cytek Biosciences). Data were analyzed by using FlowJo v.10 (FlowJo LLC). Annexin V staining was performed using PE Annexin V Apoptosis Detection Kit I (BD Biosciences) according to the manufacturer’s instruction, and events were acquired by BD LSR-Fortessa. See Table S7 for the list of antibodies used in the experiments.

ALDH activity

ALDH activity was measured by the ALDH Activity Assay Kit (#ab155894; Abcam) according to the manufacturer’s protocol. Fluorescent signals were acquired at Ex/Em 535/587 nm at room temperature using BMG ClarioStar (BMG Labtech).

Mice

The Fanca mouse strain was a gift from Dr. Markus Grompe at Oregon Health Sciences University, Portland, OR, USA. The Aldh9a1 mouse strain was a gift from Dr. Arthur L. Beaudet at Baylor College of Medicine, Houston, TX, USA. Fanca−/−Aldh9a1−/− mice were generated by crossing Fanca± and Aldh9a1± or Fanca± and Aldh9a1−/− mice. These mice were maintained on a mixed background for the project (Sv129 × C57BL/6). Pups were tailed and genotyped by postnatal day 21.

For retro-orbital bleeding, mice were put under anesthesia by isoflurane inhalation. Once mice were anesthetized, a drop of 0.5% proparacaine HCL ophthalmic solution (Henry Schein, Inc.) was administered to both eyes to maximize the local anesthetic effect. The blunt end of a capillary tube was inserted into the retro-orbital vein. A maximum of 15% of the circulating blood volume was collected into an EDTA tube. Once the bleeding stopped, antibiotics ointment was applied to the wounded area to prevent infection. The mice received 300 μl of normal saline support via subcutaneous injection before resting. A complete blood count with differential was performed at the Laboratory of Comparative Pathology at the Memorial Sloan Kettering Cancer Center.

For bone marrow aspiration procedures, we followed a previously published protocol (Chung et al., 2014). Briefly, mice received 0.5 ml sterile saline subcutaneously to compensate for loss of body fluid during the procedure. Then the mice were put under isoflurane inhalation (3–5%) anesthesia. Mice were given ophthalmic lubricating ointment to the eyes to prevent drying during the procedure. A preemptive dose of buprenorphine was given for pain. After shaving, hind legs were cleaned by a betadine solution swab stick followed by 70% ethanol swab scrubbing. A sterile 27-g needle was inserted between the two condyles of the femur and into the shaft. The syringe plunger was gently pulled back, creating negative pressure, while moving the needle back and forth within the bone marrow cavity. Successful aspiration was confirmed visually by the appearance of blood in the top of the needle in the base of the syringe. Once bone marrow was successfully aspirated from the femur, we removed the needle and syringe from the femur. A dose of meloxicam was given for pain.

Mice were submitted for complete necropsy if they became sick (e.g., had significant weight loss, hunched-back appearance, or visible tumor >1.5 cm) or at 2 years of age. Three mice submitted for a complete necropsy at 5 wk of age were excluded from Table S3, and their main findings were hydrocephalus or malocclusion, which are common spontaneous lesions in the C57BL/6 strain and therefore not attributed to genotype effect (Aldh9a1 KO n = 1, dKO n = 2).

Human HSC experiment

Human umbilical cord blood units were obtained from the New York Blood Center. Cells were incubated with HetaSep (Stem Cell Technologies) at a 5:1 ratio (cells 5 parts and HetaSep 1 part) for 1 h at 37°C to enhance RBC aggregation. WBCs in the top layer were collected and spun down for 5 min at 2,000 RPM. Cells were resuspended in wash buffer (2%FBS/IMDM) followed by Ficoll density gradient separation to isolate mononuclear cells. Isolated mononuclear cells were incubated with ammonium chloride solution (Stem Cell Technologies) for RBC lysis, followed by washing with wash buffer twice. Then cells were incubated with human CD34 MicroBeads (Miltenyi Biotec) and Fc receptor blocker in MACS buffer (1% BSA/2 mM EDTA/PBS) for 30 min on ice. Cells were washed and resuspended in MACS buffer, filtered through a 40-μm cell strainer, and then CD34+ cells were selected by LS column. After washing, cells were placed in HSC base medium (IMDM containing 20% BIT [Stem Cell Technologies], 100 ng/ml recombinant human (rh) SCF, 100 ng/ml rhTPO, 10 ng/ml rhFLT3-L, and 20 ng/ml rhIL-6; cytokines were purchased from PeproTech) in a hypoxic incubator. Next day, HSCs were counted, and 50,000–100,000 cells were used per nucleofection reaction. RNP complex was made by mixing 1.2 µl RNA duplex (annealed crRNA and ATTO550-tracrRNA; purchased from IDT), 1.7 µl Alt-R S.p. Cas9 Nuclease V3, and 2.1 µl PBS per reaction. Cells were washed with PBS and resuspended in P3 4D nucleofector solution (Lonza) including RNP complex and electroporation enhancer (IDT) and transferred to nucleocuvette. After nucleofection using 4D Nucleofector (Lonza), cells were incubated in the hypoxic incubator for 24 h. After 24 h, single-cell sorting was performed using BD ARIA with single cells sorted into a well of 96-well plate containing Methocult H4034 Optimum. 10–14 days later, colony subtype was scored and cells were harvested for gDNA extraction and Sanger sequencing. For shRNA experiments, frozen healthy volunteer bone marrow CD34+ cells were thawed and pre-stimulated in StemSpan SFEMII media (StemCell Technologies) supplemented with 100 ng/ml shSCF, 100 ng/ml rhTPO, and 100 ng/ml rhFLT3-L (hereafter, HSC media) in a hypoxic incubator (O2 < 5%) for 24 h. Cells were transduced with shLuciferase- or shFANCD2- lentivirus at MOI of 25 in the presence of 10 µM prostaglandin E2 (Sigma-Aldrich) and 1 mg/ml Kolliphor P407 (Sigma-Aldrich). 24 h later, virus-containing media was replaced with the fresh HSC media. In another 24 h, GFP+ cells were flow sorted and rested in the HSC media for 24 h. Subsequently, cells were edited again using nucleofection of Cas9-RNP, which has either sgCTRL or sgALDH9A1. 24 h later, cells were harvested for baseline sequencing and CFU assay. shLuciferase- and shFANCD2- lentiviral constructs were gifts of Dr. Jean Soulier at St. Louis Hospital, University of Paris, Paris, France.

Statistics

When comparing the means of the two groups, a two-sided Student t test was used. When comparing the means of three or more groups, one-way ANOVA followed by multiple comparison tests was used. Data distribution was assumed to be normal, but this was not formally tested. For mouse tumor incidence comparison, the number of mice with or without tumor(s) (Fig. 4 I) or the number of female mice with or without ovarian tumor(s) (Fig. 4 J) were compared by Chi-squared test between genotypes.

Study approval

The Rockefeller University IACUC and the Johns Hopkins University ACUC approved animal studies.

Online supplemental material

Fig. S1 shows the characteristics of the FANCD2−/− clones with or without additional loss of ALDH2, ADH5, or ALDH9A1. Fig. S2 shows the ALDH and ADH gene expression levels in the Jurkat leukemia cell line. Fig. S3 shows the hematopoietic stem progenitor frequencies and platelet counts in our mouse models and gene expression profiles of ALDH and ADH genes in humans and mice. Fig. S4 shows the histology of mouse ovaries. Fig. S5 shows the characteristics of FANCD2−/−ALDH9A1−/− Jurkat clones, including mutant ALDH9A1 C288A complementation experiments. Table S1 shows the gene-level results of the CRISPR screen in WT and FANCD2−/− cells. Table S2 shows the sgRNA level results of the CRISPR screen in WT and FANCD2−/− cells. Table S3 shows the results of mouse necropsies and histologic examination. Table S4 shows the gene-level results of the suppressor CRISPR screen in FANCD2−/− and FANCD2−/−ALDH9A1−/− cells. Table S5 shows the sgRNA level results of the suppressor CRISPR screen in FANCD2−/− and FANCD2−/−ALDH9A1−/− cells. Table S6 shows the list of primers and oligos used in the experiments. Table S7 shows the list of antibodies used in the experiments.

Further information and requests for resources and reagents should be directed to the lead contacts, Agata Smogorzewska ([email protected]) and Moonjung Jung ([email protected]).

We thank Dr. Markus Grompe at Oregon Health Sciences University, Portland, OR, USA and Dr. Arthur L. Beaudet at Baylor College of Medicine, Huston, TX, USA for sharing the Fanca and Aldh9a1 mouse strains, respectively. We thank Dr. Jean Soulier at St. Louis Hospital, University of Paris, Paris, France for sharing shLuc and shFANCD2 plasmids. We thank Drs. Cindy Dunbar, Andre LaRochelle, and John Tisdale at NIH for sharing lentiviral transduction protocols for HSCs. We also thank Dr. Svetlana Mazel and other staff at the Flow Cytometry Resource Center at the Rockefeller University, staff at the Laboratory of Comparative Pathology at Memorial Sloan Kettering Cancer Center, and Dr. Xiaoling Zhang at the Ross Flow Cytometry Core at Johns Hopkins University for their assistance.

This work was supported by grants from the National Heart, Lung, and Blood Institute (R01 HL120922—A. Smogorzewska; K99 HL150628—M. Jung), the National Cancer Institute (R01 CA204127—A. Smogorzewska; P30 CA008748—I.C. Miranda; R00 CA226357—S. Jeong; P30 CA006973—S. Jeong), the National Center for Advancing Translational Sciences (UL1 TR001866—M. Jung, A. Smogorzewska), and the National Institute on Alcohol Abuse and Alcoholism (R21 AA030864-01A1—M. Jung). A. Smogorzewska was an HHMI Faculty Scholar. M. Jung was also supported by the American Society of Hematology Fellow Scholar Award, Maryland Stem Cell Research Fund (MSCRF) Launch Award (2023-MSCRFL-5999), and Cigarette Restitution Fund Recruitment Award (PHPA-2288/M00B4600138). S. Jeong was also supported by the MSCRF Launch Award (2023-MSCRFL-6109). R.R. White was supported by an NRSA F32 from the NIDDK DK115144. This work is partially supported by NIH S10OD026859 (Ross Flow Cytometry Core). J. Kim was supported by a grant of the Korea Health Technology R&D Project through the Korea Health Industry Development Institute, funded by the Ministry of Health & Welfare, Republic of Korea (Grant number: HI21C0946).

Author contributions: M. Jung: conceptualization, data curation, formal analysis, funding acquisition, investigation, methodology, project administration, resources, supervision, validation, visualization, and writing—original draft, review, and editing. J. Kim: funding acquisition, investigation, resources, and writing—review and editing. Y. Park: resources, validation, and visualization. I. Ilyashov: investigation and validation. F. Yang: formal analysis, investigation, and validation. H.B. Choijilsuren: formal analysis and investigation. D. Keahi: investigation. J.A. Durmaz: formal analysis and investigation. H. Bea: formal analysis, investigation, methodology, visualization, and writing—review and editing. A.M. Goldfarb: formal analysis, investigation, and validation. M.D. Stein: conceptualization, formal analysis, and investigation. C. Wong: investigation. R.R. White: investigation and resources. S. Sridhar: methodology. R. Noonan: investigation and writing—review and editing. T.F. Wiley: investigation. T.S. Carroll: formal analysis. F.P. Lach: investigation. S. Jeong: formal analysis, investigation, methodology, and resources. I.C. Miranda: investigation, methodology, resources, and writing—review and editing. A. Smogorzewska: conceptualization, formal analysis, funding acquisition, methodology, project administration, resources, supervision, visualization, and writing—original draft, review, and editing.
Alter
,
B.P.
2014
.
Fanconi anemia and the development of leukemia
.
Best Pract. Res. Clin. Haematol.
27
:
214
221
.
Bierings
,
M.
,
C.
Bonfim
,
R.
Peffault De Latour
,
M.
Aljurf
,
P.A.
Mehta
,
C.
Knol
,
F.
Boulad
,
A.
Tbakhi
,
A.
Esquirol
,
G.
McQuaker
, et al
.
2018
.
Transplant results in adults with Fanconi anaemia
.
Br. J. Haematol.
180
:
100
109
.
Birsoy
,
K.
,
T.
Wang
,
W.W.
Chen
,
E.
Freinkman
,
M.
Abu-Remaileh
, and
D.M.
Sabatini
.
2015
.
An essential role of the mitochondrial electron transport chain in cell proliferation is to enable aspartate synthesis
.
Cell
.
162
:
540
551
.
Burgos-Barragan
,
G.
,
N.
Wit
,
J.
Meiser
,
F.A.
Dingler
,
M.
Pietzke
,
L.
Mulderrig
,
L.B.
Pontel
,
I.V.
Rosado
,
T.F.
Brewer
,
R.L.
Cordell
, et al
.
2017
.
Mammals divert endogenous genotoxic formaldehyde into one-carbon metabolism
.
Nature
.
548
:
549
554
.
Castells-Roca
,
L.
,
S.
Gutiérrez-Enríquez
,
S.
Bonache
,
M.
Bogliolo
,
E.
Carrasco
,
M.
Aza-Carmona
,
G.
Montalban
,
N.
Muñoz-Subirana
,
R.
Pujol
,
C.
Cruz
, et al
.
2021
.
Clinical consequences of BRCA2 hypomorphism
.
NPJ Breast Cancer
.
7
:
117
.
Ceccaldi
,
R.
,
K.
Parmar
,
E.
Mouly
,
M.
Delord
,
J.M.
Kim
,
M.
Regairaz
,
M.
Pla
,
N.
Vasquez
,
Q.S.
Zhang
,
C.
Pondarre
, et al
.
2012
.
Bone marrow failure in Fanconi anemia is triggered by an exacerbated p53/p21 DNA damage response that impairs hematopoietic stem and progenitor cells
.
Cell Stem Cell
.
11
:
36
49
.
Chung
,
Y.R.
,
E.
Kim
, and
O.
Abdel-Wahab
.
2014
.
Femoral bone marrow aspiration in live mice
.
J. Vis. Exp.
51660
.
Crossan
,
G.P.
,
L.
van der Weyden
,
I.V.
Rosado
,
F.
Langevin
,
P.H.L.
Gaillard
,
R.E.
McIntyre
,
F.
Gallagher
,
M.I.
Kettunen
,
D.Y.
Lewis
,
K.
Brindle
, et al
.
2011
.
Disruption of mouse Slx4, a regulator of structure-specific nucleases, phenocopies Fanconi anemia
.
Nat. Genet.
43
:
147
152
.
Dingler
,
F.A.
,
M.
Wang
,
A.
Mu
,
C.L.
Millington
,
N.
Oberbeck
,
S.
Watcham
,
L.B.
Pontel
,
A.N.
Kamimae-Lanning
,
F.
Langevin
,
C.
Nadler
, et al
.
2020
.
Two aldehyde clearance systems are essential to prevent lethal formaldehyde accumulation in mice and humans
.
Mol. Cell
.
80
:
996
1012.e9
.
Dufour
,
C.
2017
.
How I manage patients with Fanconi anaemia
.
Br. J. Haematol.
178
:
32
47
.
Feron
,
V.J.
,
H.P.
Til
,
F.
de Vrijer
,
R.A.
Woutersen
,
F.R.
Cassee
, and
P.J.
van Bladeren
.
1991
.
Aldehydes: Occurrence, carcinogenic potential, mechanism of action and risk assessment
.
Mutat. Res.
259
:
363
385
.
Garaycoechea
,
J.I.
,
G.P.
Crossan
,
F.
Langevin
,
M.
Daly
,
M.J.
Arends
, and
K.J.
Patel
.
2012
.
Genotoxic consequences of endogenous aldehydes on mouse haematopoietic stem cell function
.
Nature
.
489
:
571
575
.
Garaycoechea
,
J.I.
,
G.P.
Crossan
,
F.
Langevin
,
L.
Mulderrig
,
S.
Louzada
,
F.
Yang
,
G.
Guilbaud
,
N.
Park
,
S.
Roerink
,
S.
Nik-Zainal
, et al
.
2018
.
Alcohol and endogenous aldehydes damage chromosomes and mutate stem cells
.
Nature
.
553
:
171
177
.
Haines
,
D.C.
,
S.
Chattopadhyay
, and
J.M.
Ward
.
2001
.
Pathology of aging B6;129 mice
.
Toxicol. Pathol.
29
:
653
661
.
Hamouda
,
N.N.
,
C.
Van den Haute
,
R.
Vanhoutte
,
R.
Sannerud
,
M.
Azfar
,
R.
Mayer
,
Á.
Cortés Calabuig
,
J.V.
Swinnen
,
P.
Agostinis
,
V.
Baekelandt
, et al
.
2021
.
ATP13A3 is a major component of the enigmatic mammalian polyamine transport system
.
J. Biol. Chem.
296
:
100182
.
Harrison
,
B.A.
,
E.
Mizrahi-Powell
,
J.
Pappas
,
K.
Thomas
,
S.
Vasishta
,
S.
Hebbar
,
A.
Shukla
,
S.S.
Nayak
,
T.K.
Truong
,
A.
Woroch
, et al
.
2025
.
Deficiency of the Fanconi anemia core complex protein FAAP100 results in severe Fanconi anemia.
J. Clin. Invest.
135
:
e185126
.
Hira
,
A.
,
H.
Yabe
,
K.
Yoshida
,
Y.
Okuno
,
Y.
Shiraishi
,
K.
Chiba
,
H.
Tanaka
,
S.
Miyano
,
J.
Nakamura
,
S.
Kojima
, et al
.
2013
.
Variant ALDH2 is associated with accelerated progression of bone marrow failure in Japanese Fanconi anemia patients
.
Blood
.
122
:
3206
3209
.
Jackson
,
B.
,
C.
Brocker
,
D.C.
Thompson
,
W.
Black
,
K.
Vasiliou
,
D.W.
Nebert
, and
V.
Vasiliou
.
2011
.
Update on the aldehyde dehydrogenase gene (ALDH) superfamily
.
Hum. Genomics
.
5
:
283
303
.
Jung
,
M.
,
I.
Ilyashov
,
Y.
Park
,
F.X.
Donovan
,
R.
Ramanagoudr-Bhojappa
,
D.
Keahi
,
J.A.
Durmaz
,
H.B.
Choijilsuren
,
A.
Goldfarb
,
M.
Stein
, et al
.
2022
.
ALDH9A1 deficiency as a source of endogenous DNA damage that requires repair by the Fanconi anemia pathway
.
bioRxiv
.
(Preprint posted May 27, 2022)
.
Jung
,
M.
, and
A.
Smogorzewska
.
2021
.
Endogenous formaldehyde destroys blood stem cells
.
Blood
.
137
:
1988
1990
.
Knies
,
K.
,
S.
Inano
,
M.J.
Ramírez
,
M.
Ishiai
,
J.
Surrallés
,
M.
Takata
, and
D.
Schindler
.
2017
.
Biallelic mutations in the ubiquitin ligase RFWD3 cause Fanconi anemia
.
J. Clin. Invest.
127
:
3013
3027
.
Končitíková
,
R.
,
A.
Vigouroux
,
M.
Kopečná
,
M.
Šebela
,
S.
Moréra
, and
D.
Kopečný
.
2019
.
Kinetic and structural analysis of human ALDH9A1
.
Biosci. Rep.
39
:
BSR20190558
.
Kottemann
,
M.C.
, and
A.
Smogorzewska
.
2013
.
Fanconi anaemia and the repair of Watson and Crick DNA crosslinks
.
Nature
.
493
:
356
363
.
Kutler
,
D.I.
,
B.
Singh
,
J.
Satagopan
,
S.D.
Batish
,
M.
Berwick
,
P.F.
Giampietro
,
H.
Hanenberg
, and
A.D.
Auerbach
.
2003
.
A 20-year perspective on the international Fanconi anemia registry (IFAR)
.
Blood
.
101
:
1249
1256
.
Lach
,
F.P.
,
S.
Singh
,
K.A.
Rickman
,
P.D.
Ruiz
,
R.J.
Noonan
,
K.B.
Hymes
,
M.D.
DeLacure
,
J.A.
Kennedy
,
S.C.
Chandrasekharappa
, and
A.
Smogorzewska
.
2020
.
Esophageal cancer as initial presentation of Fanconi anemia in patients with a hypomorphic FANCA variant
.
Cold Spring Harb. Mol. Case Stud.
6
:
a005595
.
Langevin
,
F.
,
G.P.
Crossan
,
I.V.
Rosado
,
M.J.
Arends
, and
K.J.
Patel
.
2011
.
Fancd2 counteracts the toxic effects of naturally produced aldehydes in mice
.
Nature
.
475
:
53
58
.
Liu
,
J.
,
X.
Xia
, and
P.
Huang
.
2020
a.
xCT: A critical molecule that links cancer metabolism to redox signaling
.
Mol. Ther.
28
:
2358
2366
.
Liu
,
X.
,
Y.
Zhang
,
L.
Zhuang
,
K.
Olszewski
, and
B.
Gan
.
2020
b.
NADPH debt drives redox bankruptcy: SLC7A11/xCT-mediated cystine uptake as a double-edged sword in cellular redox regulation
.
Genes Dis.
8
:
731
745
.
Nalepa
,
G.
, and
D.W.
Clapp
.
2018
.
Fanconi anaemia and cancer: An intricate relationship
.
Nat. Rev. Cancer
.
18
:
168
185
.
Oka
,
Y.
,
M.
Hamada
,
Y.
Nakazawa
,
H.
Muramatsu
,
Y.
Okuno
,
K.
Higasa
,
M.
Shimada
,
H.
Takeshima
,
K.
Hanada
,
T.
Hirano
, et al
.
2020
.
Digenic mutations in ALDH2 and ADH5 impair formaldehyde clearance and cause a multisystem disorder, AMeD syndrome
.
Sci. Adv.
6
:eabd7197.
Paulick
,
M.G.
, and
C.R.
Bertozzi
.
2008
.
The glycosylphosphatidylinositol anchor: A complex membrane-anchoring structure for proteins
.
Biochemistry
.
47
:
6991
7000
.
Pegg
,
A.E.
2013
.
Toxicity of polyamines and their metabolic products
.
Chem. Res. Toxicol.
26
:
1782
1800
.
Pontel
,
L.B.
,
I.V.
Rosado
,
G.
Burgos-Barragan
,
J.I.
Garaycoechea
,
R.
Yu
,
M.J.
Arends
,
G.
Chandrasekaran
,
V.
Broecker
,
W.
Wei
,
L.
Liu
, et al
.
2015
.
Endogenous formaldehyde is a hematopoietic stem cell genotoxin and metabolic carcinogen
.
Mol. Cell
.
60
:
177
188
.
Sanjana
,
N.E.
,
O.
Shalem
, and
F.
Zhang
.
2014
.
Improved vectors and genome-wide libraries for CRISPR screening
.
Nat. Methods
.
11
:
783
784
.
Seiler
,
N.
2004
.
Catabolism of polyamines
.
Amino Acids
.
26
:
217
233
.
Sekhar
,
V.
,
T.
Andl
, and
O.
Phanstiel
IV
.
2022
.
ATP13A3 facilitates polyamine transport in human pancreatic cancer cells
.
Sci. Rep.
12
:
4045
.
Shen
,
X.
,
R.
Wang
,
M.J.
Kim
,
Q.
Hu
,
C.C.
Hsu
,
J.
Yao
,
N.
Klages-Mundt
,
Y.
Tian
,
E.
Lynn
,
T.F.
Brewer
, et al
.
2020
.
A surge of DNA damage links transcriptional reprogramming and hematopoietic deficit in Fanconi anemia
.
Mol. Cell
.
80
:
1013
1024.e6
.
Shimamura
,
A.
, and
B.P.
Alter
.
2010
.
Pathophysiology and management of inherited bone marrow failure syndromes
.
Blood Rev.
24
:
101
122
.
Umansky
,
C.
,
A.E.
Morellato
,
M.
Rieckher
,
M.A.
Scheidegger
,
M.R.
Martinefski
,
G.A.
Fernández
,
O.
Pak
,
K.
Kolesnikova
,
H.
Reingruber
,
M.
Bollini
, et al
.
2022
.
Endogenous formaldehyde scavenges cellular glutathione resulting in redox disruption and cytotoxicity
.
Nat. Commun.
13
:
745
.
Wang
,
A.T.
, and
A.
Smogorzewska
.
2015
.
SnapShot: Fanconi anemia and associated proteins
.
Cell
.
160
:
354
354.e1
.
Wang
,
M.
,
F.A.
Dingler
, and
K.J.
Patel
.
2022
.
Genotoxic aldehydes in the hematopoietic system
.
Blood
.
139
:
2119
2129
.
Yang
,
Z.
,
X.S.
Wu
,
Y.
Wei
,
S.A.
Polyanskaya
,
S.V.
Iyer
,
M.
Jung
,
F.P.
Lach
,
E.R.
Adelman
,
O.
Klingbeil
,
J.P.
Milazzo
, et al
.
2021
.
Transcriptional silencing of ALDH2 confers a dependency on Fanconi anemia proteins in acute myeloid leukemia
.
Cancer Discov.
11
:
2300
2315
.

Author notes

*

M. Jung and J. Kim contributed equally to this paper.

Disclosures: All authors have completed and submitted the ICMJE Form for Disclosure of Potential Conflicts of Interest. M. Jung reported “Honoraria from the American Society of Hematology, and the Korean Society of Laboratory Medicine.” R.R. White reported “being currently employed by Regeneron Pharmaceuticals Inc. R.R. White contributed to this article as an employee of The Rockefeller University and the views expressed do not necessarily represent the views of Regeneron Pharmaceuticals Inc.” A. Smogorzewska reported grants from Rocket Pharmaceuticals outside the submitted work. No other disclosures were reported.

This article is distributed under the terms as described at https://rupress.org/pages/terms102024/.

Data & Figures

Figure 1.

Metabolism-focused CRISPR screen reveals novel endogenous sources of DNA damage. (A) Schematic of the metabolism-focused CRISPR KO screen. WT and FANCD2−/− Jurkat cells were infected with lentivirus-containing metabolism-focused sgRNA library in biological triplicate at MOI of 0.3. After 72 h of puromycin selection, 40 million cells were harvested for baseline sequencing to achieve 1000x representation per sgRNA. At least 40 million cells were passaged every 4 days for 14 population doublings, after which at least 40 million cells were harvested for final time point sequencing. (B) FANCD2 western blot of Jurkat clones used in the experiments. “c” stands for clone.(C) MMC sensitivity assay of Jurkat clones. The experiment was performed in triplicate. Three independent experiments were performed using WT and FANCD2−/− clone #1 (c#1). The third experiment included FANCD2−/− clone #2 (c#2), which is shown in this figure. Error bars, SD. N = 3. (D) FANCD2 western blot of Jurkat clones treated with 1 µM MMC 24 h before harvest. (E) Adjusted P (P adj) values for the top 35 genes that were differentially depleted in the FANCD2−/− setting were calculated by the DESeq2 package. Values for all data points in this graph are in Table S1. (F) A volcano plot showing log2 fold change (log2FC) value and P adj between FANCD2−/− and WT at the sgRNA level. Only sgRNAs with P adj < 0.01 were used. Eight significantly depleted sgALDH9A1s are indicated. Values for all data points in this graph are in Table S2. (G) A competition assay using WT and FANCD2−/− clones. The ratio of mCherry to GFP-expressing cells normalized to the starting ratio was decreased in two FANCD2−/− clones with mCherry-sgALDH9A1 compared with FANCD2−/− clones with mCherry-sgCTRL (nontargeting). There were no differences between mCherry-sgALDH9A1 and mCherry-sgCTRL in WT cells. One-way ANOVA followed by Tukey’s multiple comparison test was performed for the last time point between FANCD2−/− c#1 sgCTRL and sgALDH9A1, and between FANCD2−/−c#2 sgCTRL and sgALDH9A1. (****, P < 0.0001). Two independent experiments were performed. A representative figure is shown. Error bar, SEM. N = 3. Source data are available for this figure: SourceData F1.

Figure 1.

Metabolism-focused CRISPR screen reveals novel endogenous sources of DNA damage. (A) Schematic of the metabolism-focused CRISPR KO screen. WT and FANCD2−/− Jurkat cells were infected with lentivirus-containing metabolism-focused sgRNA library in biological triplicate at MOI of 0.3. After 72 h of puromycin selection, 40 million cells were harvested for baseline sequencing to achieve 1000x representation per sgRNA. At least 40 million cells were passaged every 4 days for 14 population doublings, after which at least 40 million cells were harvested for final time point sequencing. (B) FANCD2 western blot of Jurkat clones used in the experiments. “c” stands for clone.(C) MMC sensitivity assay of Jurkat clones. The experiment was performed in triplicate. Three independent experiments were performed using WT and FANCD2−/− clone #1 (c#1). The third experiment included FANCD2−/− clone #2 (c#2), which is shown in this figure. Error bars, SD. N = 3. (D) FANCD2 western blot of Jurkat clones treated with 1 µM MMC 24 h before harvest. (E) Adjusted P (P adj) values for the top 35 genes that were differentially depleted in the FANCD2−/− setting were calculated by the DESeq2 package. Values for all data points in this graph are in Table S1. (F) A volcano plot showing log2 fold change (log2FC) value and P adj between FANCD2−/− and WT at the sgRNA level. Only sgRNAs with P adj < 0.01 were used. Eight significantly depleted sgALDH9A1s are indicated. Values for all data points in this graph are in Table S2. (G) A competition assay using WT and FANCD2−/− clones. The ratio of mCherry to GFP-expressing cells normalized to the starting ratio was decreased in two FANCD2−/− clones with mCherry-sgALDH9A1 compared with FANCD2−/− clones with mCherry-sgCTRL (nontargeting). There were no differences between mCherry-sgALDH9A1 and mCherry-sgCTRL in WT cells. One-way ANOVA followed by Tukey’s multiple comparison test was performed for the last time point between FANCD2−/− c#1 sgCTRL and sgALDH9A1, and between FANCD2−/−c#2 sgCTRL and sgALDH9A1. (****, P < 0.0001). Two independent experiments were performed. A representative figure is shown. Error bar, SEM. N = 3. Source data are available for this figure: SourceData F1.

Close modal
+ Expand view − Collapse view
Figure S1
Figure S1. Refer to the image caption for details.

Excessive reactive aldehydes caused by ADH5 or ALDH9A1 deficiency cause synthetic lethality in FANCD2-deficient cells by increased DNA damage. (A) Comparison of genomic sequences in FANCD2−/− clones and the WT FANCD2. (B) Breakdown of indels in FANCD2 gene as inferred by Tracking of Indels by DEcomposition (TIDE) analysis (http://shinyapps.datacurators.nl/tide/). (C) A summary of indels in the FANCD2−/− clones. (D) A growth curve of WT and four FANCD2−/− clones. Error bars, SEM. N = 3. (E–G) Population doublings over time in WT and FANCD2−/− Jurkat cells expressing indicated sgRNAs. Cells were infected by lentivirus containing Cas9 and sgRNA. After puromycin selection, cumulative population doublings were calculated. WT cells showed no differences in population doubling time regardless of sgRNA used. FANCD2−/− cells showed lower population doubling time when sgADH5 or sgALDH9A1 were used, but not when sgALDH2 or nontargeting control (sgCTRL) were used. One-way ANOVA followed by Tukey’s multiple comparison test was performed for the last time point. (ns, not significant; *, P < 0.05; ****, P < 0.0001). Error bars, SEM. N = 3. (H) A competition assay as introduced in Fig. 1 G using mCherry-sgSLC7A11. Cells infected with mCherry-sgSLC7A11 were significantly outcompeted by cells infected with GFP-sgCTRL in all cell lines tested. Such differences were not observed when mCherry-sgCTRL was used instead. One-way ANOVA test was performed for the last time point for WT-sgSCL7A11, FANCD2−/− c#1-sgSLC7A11, and FANCD2−/− c#2-sgSLC7A11 (ns, not significant). Error bars, SEM. N = 3. (I) GO term analysis of genes depleted in FANCD2−/− cells. Multiple genes in the GPI anchor biosynthetic process were depleted in FANCD2−/− cells, suggesting disruption of this pathway is detrimental to the survival of FANCD2−/− cells. (J) Examples of 53BP1 and γ-H2AX immunofluorescence staining in the indicated cells Quantification of these experiments is shown in Fig. 2, E and F. Scale bar = 10 µm. 630× magnification.

Figure S1.

Excessive reactive aldehydes caused by ADH5 or ALDH9A1 deficiency cause synthetic lethality in FANCD2-deficient cells by increased DNA damage. (A) Comparison of genomic sequences in FANCD2−/− clones and the WT FANCD2. (B) Breakdown of indels in FANCD2 gene as inferred by Tracking of Indels by DEcomposition (TIDE) analysis (http://shinyapps.datacurators.nl/tide/). (C) A summary of indels in the FANCD2−/− clones. (D) A growth curve of WT and four FANCD2−/− clones. Error bars, SEM. N = 3. (E–G) Population doublings over time in WT and FANCD2−/− Jurkat cells expressing indicated sgRNAs. Cells were infected by lentivirus containing Cas9 and sgRNA. After puromycin selection, cumulative population doublings were calculated. WT cells showed no differences in population doubling time regardless of sgRNA used. FANCD2−/− cells showed lower population doubling time when sgADH5 or sgALDH9A1 were used, but not when sgALDH2 or nontargeting control (sgCTRL) were used. One-way ANOVA followed by Tukey’s multiple comparison test was performed for the last time point. (ns, not significant; *, P < 0.05; ****, P < 0.0001). Error bars, SEM. N = 3. (H) A competition assay as introduced in Fig. 1 G using mCherry-sgSLC7A11. Cells infected with mCherry-sgSLC7A11 were significantly outcompeted by cells infected with GFP-sgCTRL in all cell lines tested. Such differences were not observed when mCherry-sgCTRL was used instead. One-way ANOVA test was performed for the last time point for WT-sgSCL7A11, FANCD2−/− c#1-sgSLC7A11, and FANCD2−/− c#2-sgSLC7A11 (ns, not significant). Error bars, SEM. N = 3. (I) GO term analysis of genes depleted in FANCD2−/− cells. Multiple genes in the GPI anchor biosynthetic process were depleted in FANCD2−/− cells, suggesting disruption of this pathway is detrimental to the survival of FANCD2−/− cells. (J) Examples of 53BP1 and γ-H2AX immunofluorescence staining in the indicated cells Quantification of these experiments is shown in Fig. 2, E and F. Scale bar = 10 µm. 630× magnification.

Close modal
+ Expand view − Collapse view
Figure S2
Figure S2. Refer to the image caption for details.

ALDH and ADH gene expression levels in Jurkat leukemia cell line. (A) Gene expression of ALDH/ADH genes in Jurkat cell line. Cancer Cell Line Encyclopedia (CCLE) RNA-seq data were downloaded from the DepMap Portal. Gene expression is shown as log2 (TPM+1). TPM, transcript per million. (B) Gene expression of ALDH/ADH genes in Jurkat WT and FANCD2−/− c#1 clones by RNA-seq. Gene expression is shown as fragments per kilobase of transcript per million mapped reads (FPKM). The experiment was performed once with biological triplicates. Error bars, SD. N = 3.

Figure S2.

ALDH and ADH gene expression levels in Jurkat leukemia cell line. (A) Gene expression of ALDH/ADH genes in Jurkat cell line. Cancer Cell Line Encyclopedia (CCLE) RNA-seq data were downloaded from the DepMap Portal. Gene expression is shown as log2 (TPM+1). TPM, transcript per million. (B) Gene expression of ALDH/ADH genes in Jurkat WT and FANCD2−/− c#1 clones by RNA-seq. Gene expression is shown as fragments per kilobase of transcript per million mapped reads (FPKM). The experiment was performed once with biological triplicates. Error bars, SD. N = 3.

Close modal
Figure 2.

Loss of both ALDH9A1 and FANCD2 causes increased DNA damage and apoptosis. (A) Schematic of the experimental setup. WT and two independent FANCD2−/− clones were targeted by sgALDH9A1 or nontargeting control guide (sgCTRL) by electroporation of Cas9–sgRNA–RNP complex. “c” stands for clone. (B) Percentage (%) of ALDH9A1 indel was assessed by Sanger sequencing followed by Synthego ICE analysis. ALDH9A1 indel (%) was decreased over time in the two independent FANCD2−/− clones, but not in WT cells. At least four independent experiments were performed. One-way ANOVA followed by Dunnett’s multiple comparison test (**, P = 0.0055; ****, P < 0.0001). Error bar, SD. N = 4–6. (C) Numbers of chromosome breakage per cell were significantly elevated in two FANCD2−/− clones targeted by sgALDH9A1 compared with clones targeted by sgCTRL. There were no differences in WT clones targeted by either sgCTRL or sgALDH9A1. A two-sided Student’s t test was performed between sgCTRL and sgALDH9A1 in each clone (*, P < 0.05; **, P < 0.005). One independent experiment was performed. The red line denotes a mean value for each condition. Number of cells analyzed: WT-sgCTRL n = 37, WT-sgALDH9A1 n = 42, FANCD2−/−c#1-sgCTRL n = 39, FANCD2−/−c#1-sgALDH9A1 n = 35, FANCD2−/−c#2-sgCTRL n = 34, and FANCD2−/−c#2-sgALDH9A1 n = 31). (D) Representative figure of chromosome breakage analysis. Arrows indicate chromosomal breaks. Scale bar = 10 µm. (E) Numbers of 53BP1 foci per cell as assessed by immunofluorescence staining were elevated in two FANCD2−/− clones targeted by sgALDH9A1 compared with clones targeted by sgCTRL. Two independent experiments were performed. Statistics were performed on pooled replicates. The red line denotes a mean value for each condition. Number of cells analyzed: WT-sgCTRL n = 638, WT-sgALDH9A1 n = 902, FANCD2−/−c#1-sgCTRL n = 817, FANCD2−/−c#1-sgALDH9A1 n = 817, FANCD2−/−c#2-sgCTRL n = 630, and FANCD2−/−c#2-sgALDH9A1 n = 735). (F) Numbers of γ-H2AX foci per cell as assessed by immunofluorescence staining were elevated in two FANCD2−/− clones targeted by sgALDH9A1 compared with clones targeted by sgCTRL. Two independent experiments were performed. Statistics were performed on pooled replicates. The red line denotes a mean value for each condition. Number of cells analyzed: WT-sgCTRL n = 866, WT-sgALDH9A1 n = 990, FANCD2−/−c#1-sgCTRL n = 738, FANCD2−/−c#1-sgALDH9A1 n = 736, FANCD2−/−c#2-sgCTRL n = 506, and FANCD2−/−c#2-sgALDH9A1 n = 547). (G and H) Percentage of annexin V–positive and propidium iodide–negative (early apoptotic) cells (G) and sub-G0 fraction on cell cycle analysis (H) by flow cytometry were elevated in two FANCD2−/− clones targeted by sgALDH9A1 compared with clones edited with sgCTRL (non-targeting). Two independent experiments were performed. Statistics were performed on pooled replicates. Error bars, SD. N = 6. (E–H) One-way ANOVA followed by Tukey’s multiple comparison test was performed (ns, not significant; *, P < 0.05; **, P < 0.005; ***, P < 0.0005; ****, P < 0.0001).

Figure 2.

Loss of both ALDH9A1 and FANCD2 causes increased DNA damage and apoptosis. (A) Schematic of the experimental setup. WT and two independent FANCD2−/− clones were targeted by sgALDH9A1 or nontargeting control guide (sgCTRL) by electroporation of Cas9–sgRNA–RNP complex. “c” stands for clone. (B) Percentage (%) of ALDH9A1 indel was assessed by Sanger sequencing followed by Synthego ICE analysis. ALDH9A1 indel (%) was decreased over time in the two independent FANCD2−/− clones, but not in WT cells. At least four independent experiments were performed. One-way ANOVA followed by Dunnett’s multiple comparison test (**, P = 0.0055; ****, P < 0.0001). Error bar, SD. N = 4–6. (C) Numbers of chromosome breakage per cell were significantly elevated in two FANCD2−/− clones targeted by sgALDH9A1 compared with clones targeted by sgCTRL. There were no differences in WT clones targeted by either sgCTRL or sgALDH9A1. A two-sided Student’s t test was performed between sgCTRL and sgALDH9A1 in each clone (*, P < 0.05; **, P < 0.005). One independent experiment was performed. The red line denotes a mean value for each condition. Number of cells analyzed: WT-sgCTRL n = 37, WT-sgALDH9A1 n = 42, FANCD2−/−c#1-sgCTRL n = 39, FANCD2−/−c#1-sgALDH9A1 n = 35, FANCD2−/−c#2-sgCTRL n = 34, and FANCD2−/−c#2-sgALDH9A1 n = 31). (D) Representative figure of chromosome breakage analysis. Arrows indicate chromosomal breaks. Scale bar = 10 µm. (E) Numbers of 53BP1 foci per cell as assessed by immunofluorescence staining were elevated in two FANCD2−/− clones targeted by sgALDH9A1 compared with clones targeted by sgCTRL. Two independent experiments were performed. Statistics were performed on pooled replicates. The red line denotes a mean value for each condition. Number of cells analyzed: WT-sgCTRL n = 638, WT-sgALDH9A1 n = 902, FANCD2−/−c#1-sgCTRL n = 817, FANCD2−/−c#1-sgALDH9A1 n = 817, FANCD2−/−c#2-sgCTRL n = 630, and FANCD2−/−c#2-sgALDH9A1 n = 735). (F) Numbers of γ-H2AX foci per cell as assessed by immunofluorescence staining were elevated in two FANCD2−/− clones targeted by sgALDH9A1 compared with clones targeted by sgCTRL. Two independent experiments were performed. Statistics were performed on pooled replicates. The red line denotes a mean value for each condition. Number of cells analyzed: WT-sgCTRL n = 866, WT-sgALDH9A1 n = 990, FANCD2−/−c#1-sgCTRL n = 738, FANCD2−/−c#1-sgALDH9A1 n = 736, FANCD2−/−c#2-sgCTRL n = 506, and FANCD2−/−c#2-sgALDH9A1 n = 547). (G and H) Percentage of annexin V–positive and propidium iodide–negative (early apoptotic) cells (G) and sub-G0 fraction on cell cycle analysis (H) by flow cytometry were elevated in two FANCD2−/− clones targeted by sgALDH9A1 compared with clones edited with sgCTRL (non-targeting). Two independent experiments were performed. Statistics were performed on pooled replicates. Error bars, SD. N = 6. (E–H) One-way ANOVA followed by Tukey’s multiple comparison test was performed (ns, not significant; *, P < 0.05; **, P < 0.005; ***, P < 0.0005; ****, P < 0.0001).

Close modal
Figure 3.

Deficiency of both ALDH9A1 and the FA pathway causes loss of HSPC. (A) Schematic of human CD34+ cell editing experiments. Human umbilical cord blood CD34+ cells were edited by electroporation of Cas9–sgRNA–ATTO550 RNP complex. 24 h later, ATTO550+ cells were single-cell sorted onto methylcellulose. 14 days later, colonies were scored and harvested for sequencing. (B) Baseline editing efficiency at the time of sorting was obtained by Sanger sequencing followed by TIDE analysis. (C) Percentage of hematopoietic colonies observed per editing condition. (D) Proportion of CFU colony subtypes per editing condition. M, CFU (colony-forming unit)-monocyte/macrophage; G, CFU-granulocyte; GM, CFU-granulocytes/macrophage; BFU-E, burst-forming unit-erythroid; CFU-E, CFU-erythroid; GEMM, CFU-granulocyte, erythrocyte, monocyte, megakaryocyte. (E) Sanger sequencing of each colony per editing condition. The top row shows FANCD2 sequences of colonies targeted by sgFANCD2 alone. The middle row shows ALDH9A1 sequences of colonies targeted by sgALDH9A1 alone. The bottom row shows FANCD2 (upper) and ALDH9A1 (lower) sequences of colonies targeted by both sgFANCD2 and sgALDH9A1. The frequency of biallelic double KO colonies was lower than expected based on baseline editing efficiency, assuming FANCD2 and ALDH9A1 editing events are independent from each other (observed-to-expected ratio 0.33). Loss-of-function (LOF) indel was defined as frameshift indels of any size or in-frame indels ≥18 bp. WT sequence is shown in blue, monoallelic LOF indels in yellow, and biallelic LOF indels in green. This experiment was performed once. (F) Schematic of experiments using human CD34+ cells. (G) Baseline editing efficiency of the ALDH9A1 gene shown as %frameshift mutation assessed using amplicon next-generation sequencing (NGS). Error bars, SD. N = 2. (H) Number of total colonies from the first and second CFU plating, which was normalized to that of shLUC/sgCTRL condition. The first plating was done after in vitro genetic manipulation as summarized in Fig. 1 F. The second CFU plating was done by harvesting cells from the first plating, and seeding the same number of cells on new CFU plates. One-way ANOVA followed by Tukey’s multiple comparison test was performed (*, P < 0.05; **, P < 0.01). Two independent experiments were performed and combined for the analysis. Error bars, SD. N = 4. dKO, double KO (i.e., targeted by both sgFANCD2 and sgALDH9A1). TIDE, Tracking of Indels by DEcomposition.

Figure 3.

Deficiency of both ALDH9A1 and the FA pathway causes loss of HSPC. (A) Schematic of human CD34+ cell editing experiments. Human umbilical cord blood CD34+ cells were edited by electroporation of Cas9–sgRNA–ATTO550 RNP complex. 24 h later, ATTO550+ cells were single-cell sorted onto methylcellulose. 14 days later, colonies were scored and harvested for sequencing. (B) Baseline editing efficiency at the time of sorting was obtained by Sanger sequencing followed by TIDE analysis. (C) Percentage of hematopoietic colonies observed per editing condition. (D) Proportion of CFU colony subtypes per editing condition. M, CFU (colony-forming unit)-monocyte/macrophage; G, CFU-granulocyte; GM, CFU-granulocytes/macrophage; BFU-E, burst-forming unit-erythroid; CFU-E, CFU-erythroid; GEMM, CFU-granulocyte, erythrocyte, monocyte, megakaryocyte. (E) Sanger sequencing of each colony per editing condition. The top row shows FANCD2 sequences of colonies targeted by sgFANCD2 alone. The middle row shows ALDH9A1 sequences of colonies targeted by sgALDH9A1 alone. The bottom row shows FANCD2 (upper) and ALDH9A1 (lower) sequences of colonies targeted by both sgFANCD2 and sgALDH9A1. The frequency of biallelic double KO colonies was lower than expected based on baseline editing efficiency, assuming FANCD2 and ALDH9A1 editing events are independent from each other (observed-to-expected ratio 0.33). Loss-of-function (LOF) indel was defined as frameshift indels of any size or in-frame indels ≥18 bp. WT sequence is shown in blue, monoallelic LOF indels in yellow, and biallelic LOF indels in green. This experiment was performed once. (F) Schematic of experiments using human CD34+ cells. (G) Baseline editing efficiency of the ALDH9A1 gene shown as %frameshift mutation assessed using amplicon next-generation sequencing (NGS). Error bars, SD. N = 2. (H) Number of total colonies from the first and second CFU plating, which was normalized to that of shLUC/sgCTRL condition. The first plating was done after in vitro genetic manipulation as summarized in Fig. 1 F. The second CFU plating was done by harvesting cells from the first plating, and seeding the same number of cells on new CFU plates. One-way ANOVA followed by Tukey’s multiple comparison test was performed (*, P < 0.05; **, P < 0.01). Two independent experiments were performed and combined for the analysis. Error bars, SD. N = 4. dKO, double KO (i.e., targeted by both sgFANCD2 and sgALDH9A1). TIDE, Tracking of Indels by DEcomposition.

Close modal
Figure 4.

Fanca−/−Aldh9a1−/−mouse model shows mild hematopoietic phenotypes and increased solid tumor incidence with aging. (A) Relative weight among same-sex littermates. Earliest available weight record was used once in lifetime per mouse between 6 and 10 wk of age and normalized to that of same-sex dKO littermates (dKO n = 19; other genotypes n = 46). An unpaired two-sided t test was performed (****, P < 0.0001). The red line denotes a mean value for each condition. (B) Number of mice with and without eye abnormalities (corneal opacity, microphthalmia, and anophthalmia). Data from Fanca KO and dKO mice are shown (two-sided Chi-square test; P = 0.0782). None of the WT and Aldh9a1 KO mice had eye abnormalities. (Number of mice examined: WT n = 53, Aldh9a1 KO n = 87, Fanca KO n = 27, and dKO n = 50). (C) Kaplan–Meier survival curve of four genotype groups. Log-rank test was performed comparing genotypes (**, P = 0.0073). (D–I) Bone marrow aspiration was performed in mice of 8 to 12 wk of age. Frequency of LT-HSC (E), ST-HSC (F), LSK (G), LK (H), and MEP (I) of live single cells from fresh bone marrow aspirate samples (WT n = 14, Aldh9a1 KO n = 12, Fanca KO n = 13, and dKO n = 13). One-way ANOVA followed by Tukey’s multiple comparison test was performed (ns, not significant; *, P < 0.05; **, P < 0.005; ***, P < 0.0005;****, P < 0.0001). Error bars, SD. LT-HSC, long-term HSC; ST-HSC, short-term HSC; LSK, linage-negative/Sca-1–positive/cKit-high population; LK, lineage-negative/cKit-high population; MEP, megakaryocyte-erythroid progenitor. (I) Quantification of mice with and without all types of tumors on complete necropsies at 18–24 mo of age. Both sexes were included in this analysis. Chi-squared test was performed between groups (*, P < 0.05; **, P < 0.005). All tumor data are included in Table S3. (J) Quantification of female mice with and without ovarian tumors identified during complete necropsy at 18–24 mo of age. Chi-squared test was performed between groups (*, P < 0.05; **, P < 0.005). dKO, double KO (Fanca−/−Aldh9a1−/−).

Figure 4.

Fanca−/−Aldh9a1−/−mouse model shows mild hematopoietic phenotypes and increased solid tumor incidence with aging. (A) Relative weight among same-sex littermates. Earliest available weight record was used once in lifetime per mouse between 6 and 10 wk of age and normalized to that of same-sex dKO littermates (dKO n = 19; other genotypes n = 46). An unpaired two-sided t test was performed (****, P < 0.0001). The red line denotes a mean value for each condition. (B) Number of mice with and without eye abnormalities (corneal opacity, microphthalmia, and anophthalmia). Data from Fanca KO and dKO mice are shown (two-sided Chi-square test; P = 0.0782). None of the WT and Aldh9a1 KO mice had eye abnormalities. (Number of mice examined: WT n = 53, Aldh9a1 KO n = 87, Fanca KO n = 27, and dKO n = 50). (C) Kaplan–Meier survival curve of four genotype groups. Log-rank test was performed comparing genotypes (**, P = 0.0073). (D–I) Bone marrow aspiration was performed in mice of 8 to 12 wk of age. Frequency of LT-HSC (E), ST-HSC (F), LSK (G), LK (H), and MEP (I) of live single cells from fresh bone marrow aspirate samples (WT n = 14, Aldh9a1 KO n = 12, Fanca KO n = 13, and dKO n = 13). One-way ANOVA followed by Tukey’s multiple comparison test was performed (ns, not significant; *, P < 0.05; **, P < 0.005; ***, P < 0.0005;****, P < 0.0001). Error bars, SD. LT-HSC, long-term HSC; ST-HSC, short-term HSC; LSK, linage-negative/Sca-1–positive/cKit-high population; LK, lineage-negative/cKit-high population; MEP, megakaryocyte-erythroid progenitor. (I) Quantification of mice with and without all types of tumors on complete necropsies at 18–24 mo of age. Both sexes were included in this analysis. Chi-squared test was performed between groups (*, P < 0.05; **, P < 0.005). All tumor data are included in Table S3. (J) Quantification of female mice with and without ovarian tumors identified during complete necropsy at 18–24 mo of age. Chi-squared test was performed between groups (*, P < 0.05; **, P < 0.005). dKO, double KO (Fanca−/−Aldh9a1−/−).

Close modal
+ Expand view − Collapse view
Figure S3
Figure S3. Refer to the image caption for details.

Blood indices in Fanca −/− , Aldh9a1 −/− , and dKO mice and gene expression of ALDH and ADH genes in humans and mice. (A) Mouse HSC flow gating scheme used for Fig. 4, D–H and Fig. S2 B. (B) Frequency of lineage-negative/cKit-high population, MPP, CMP, and GMP of live single cells from fresh bone marrow aspirate samples. Number of mice analyzed: WT n = 14, Aldh9a1 KO n = 12, Fanca KO n = 13, and dKO n = 13; 8–12 wk old. One-way ANOVA followed by Tukey’s multiple comparison test was performed (ns, not significant; *, P < 0.05). Error bars, SD. MPP, multipotent progenitor; CMP, common myeloid progenitor; GMP, granulocyte-macrophage progenitor. (C) Peripheral blood platelet counts of 9- to 12-mo-old mice (WT n = 9, Aldh9a1 KO n = 44, Fanca KO n = 9, and dKO n = 45). One-way ANOVA followed by Tukey’s multiple comparison test (**, P = 0.0012). Error bars, SD. (D) Gene expression data for human and mouse ALDH and ADH isoenzymes in hematopoietic cells. Publicly available single-cell RNA-seq data were downloaded from BloodSpot.eu and a heatmap was generated using log2 fold change values on GraphPad Prism v10. Mouse hematopoietic cells show a predominant ALDH2 expression, while human hematopoietic cells show higher expression of other ALDH enzymes. dKO, double KO.

Figure S3.

Blood indices in Fanca −/− , Aldh9a1 −/− , and dKO mice and gene expression of ALDH and ADH genes in humans and mice. (A) Mouse HSC flow gating scheme used for Fig. 4, D–H and Fig. S2 B. (B) Frequency of lineage-negative/cKit-high population, MPP, CMP, and GMP of live single cells from fresh bone marrow aspirate samples. Number of mice analyzed: WT n = 14, Aldh9a1 KO n = 12, Fanca KO n = 13, and dKO n = 13; 8–12 wk old. One-way ANOVA followed by Tukey’s multiple comparison test was performed (ns, not significant; *, P < 0.05). Error bars, SD. MPP, multipotent progenitor; CMP, common myeloid progenitor; GMP, granulocyte-macrophage progenitor. (C) Peripheral blood platelet counts of 9- to 12-mo-old mice (WT n = 9, Aldh9a1 KO n = 44, Fanca KO n = 9, and dKO n = 45). One-way ANOVA followed by Tukey’s multiple comparison test (**, P = 0.0012). Error bars, SD. (D) Gene expression data for human and mouse ALDH and ADH isoenzymes in hematopoietic cells. Publicly available single-cell RNA-seq data were downloaded from BloodSpot.eu and a heatmap was generated using log2 fold change values on GraphPad Prism v10. Mouse hematopoietic cells show a predominant ALDH2 expression, while human hematopoietic cells show higher expression of other ALDH enzymes. dKO, double KO.

Close modal
+ Expand view − Collapse view
Figure S4
Figure S4. Refer to the image caption for details.

Hematoxylin and eosin stain of mouse ovaries in Fanca −/− , Aldh9a1 −/− , and dKO mice. (A) (1–3) Age-related atrophy of the ovary: (1) WT-1, (2) Fanca KO-2, (3) Aldh9a1 KO-2, 20× magnification. (4) Ovarian sex cord stromal tumor, mixed subtype (dKO-2, plan type, 20× magnification, 2x/0.06 numerical aperture), a well-demarcated, solid, multilobular, and moderately heterogeneous nodule diffusely replaces the ovarian parenchyma. (5) Ovarian sex cord stromal tumor, luteoma subtype (dKO-6, plan type, 20× magnification, 2x/0.06 numerical aperture), a well-demarcated, solid, and predominantly homogeneous nodule diffusely replaces the ovarian parenchyma. (6) Ovarian tubulostromal adenoma (dKO-8, plan type, 20× magnification, 2x/0.06 numerical aperture), a well-demarcated heterogeneous nodule contiguous with the surface epithelium diffusely replaces the ovarian parenchyma and slightly extends into the hilus. Variably cystic tubular structures are interspersed with solid areas of sex cord stromal cells. 7–8) higher magnification of ovarian sex cord stromal tumor, mixed subtype (dKO-2, plan type, 200× and 400× magnification respectively, 20×/0.50 and 40×/0.75 numerical aperture, respectively), composed of a mixture of sex cord stromal cells at various degrees of differentiation. 9–10) tubulostromal adenoma (dKO-14, plan type, 200× and 400× magnification respectively, 20×/0.50 and 40×/0.75 numerical aperture respectively), composed of variably dilated tubules lined by cuboidal epithelium intermixed with small packets of sex cord stromal cells at various degrees of differentiation. 11–12) Ovarian sex cord stromal tumor, luteoma subtype (dKO-11, plan type, 200× and 400×magnification, respectively, 20×/0.50 and 40×/0.75 numerical aperture, respectively), composed of packets of highly luteinized polygonal cells supported by a mild fibrovascular stroma. dKO, double KO (Fanca−/−Aldh9a1−/−). Images were obtained using an Olympus BX45 microscope equipped with an Olympus DP26 camera. Olympus cellSens Entry v1.18 imaging software was used for image acquisition.

Figure S4.

Hematoxylin and eosin stain of mouse ovaries in Fanca −/− , Aldh9a1 −/− , and dKO mice. (A) (1–3) Age-related atrophy of the ovary: (1) WT-1, (2) Fanca KO-2, (3) Aldh9a1 KO-2, 20× magnification. (4) Ovarian sex cord stromal tumor, mixed subtype (dKO-2, plan type, 20× magnification, 2x/0.06 numerical aperture), a well-demarcated, solid, multilobular, and moderately heterogeneous nodule diffusely replaces the ovarian parenchyma. (5) Ovarian sex cord stromal tumor, luteoma subtype (dKO-6, plan type, 20× magnification, 2x/0.06 numerical aperture), a well-demarcated, solid, and predominantly homogeneous nodule diffusely replaces the ovarian parenchyma. (6) Ovarian tubulostromal adenoma (dKO-8, plan type, 20× magnification, 2x/0.06 numerical aperture), a well-demarcated heterogeneous nodule contiguous with the surface epithelium diffusely replaces the ovarian parenchyma and slightly extends into the hilus. Variably cystic tubular structures are interspersed with solid areas of sex cord stromal cells. 7–8) higher magnification of ovarian sex cord stromal tumor, mixed subtype (dKO-2, plan type, 200× and 400× magnification respectively, 20×/0.50 and 40×/0.75 numerical aperture, respectively), composed of a mixture of sex cord stromal cells at various degrees of differentiation. 9–10) tubulostromal adenoma (dKO-14, plan type, 200× and 400× magnification respectively, 20×/0.50 and 40×/0.75 numerical aperture respectively), composed of variably dilated tubules lined by cuboidal epithelium intermixed with small packets of sex cord stromal cells at various degrees of differentiation. 11–12) Ovarian sex cord stromal tumor, luteoma subtype (dKO-11, plan type, 200× and 400×magnification, respectively, 20×/0.50 and 40×/0.75 numerical aperture, respectively), composed of packets of highly luteinized polygonal cells supported by a mild fibrovascular stroma. dKO, double KO (Fanca−/−Aldh9a1−/−). Images were obtained using an Olympus BX45 microscope equipped with an Olympus DP26 camera. Olympus cellSens Entry v1.18 imaging software was used for image acquisition.

Close modal
Figure 5.

Deficiency of ATP13A3, a polyamine transporter, rescues synthetic lethality of FANCD2−/−ALDH9A1−/−cells. (A) Schematic summary of the metabolism-focused CRISPR KO suppressor screen. FANCD2−/− and FANCD2−/−ALDH9A1−/− Jurkat cells were infected with lentivirus-containing metabolism-focused sgRNA library in biological triplicate at MOI of 0.3. sgRNA representation of 500x was maintained throughout the experiment. sgRNAs after 14 population doublings were assessed to determine genetic perturbations that rescue synthetic lethality of FANCD2−/−ALDH9A1−/− Jurkat cells. (B) FANCD2, ALDH9A1, γ-H2AX, H2AX, and cleaved caspase 3 western blot of Jurkat clones used in the experiments. Vinculin was used as a loading control for each membrane. (C) cDNA-expressing WT ALDH9A1 and YFP was overexpressed in WT, ALDH9A1−/−, FANCD2−/−, and FANCD2−/−ALDH9A1−/− cells, and their relative growth was compared with luciferase-GFP–overexpressed counterparts by monitoring YFP/GFP ratio using flow cytometry. One experiment in biological triplicate was performed. One-way ANOVA followed by Dunnett’s multiple comparison test was performed (ns, not significant; *, P < 0.05; ***, P < 0.0005). Error bars, SD. N = 3. (D) A volcano plot showing log2 fold change (log2FC) value and P adj value between FANCD2−/− and FANCD2−/−ALDH9A1−/− at the sgRNA level. Only sgRNAs with P < 0.01 were used. Ten out of ten sgATP13A3s were significantly enriched in FANCD2−/−ALDH9A1−/− condition and marked as indicated. Values for all data points in this graph are in Table S5. (E) A competition assay using FANCD2−/− and two independent FANCD2−/−ALDH9A1−/− clones. The ratio of mCherry/GFP normalized to baseline was progressively increasing in FANCD2−/−ALDH9A1−/− clones with mCherry-sgATP13A3 compared with FANCD2−/−ALDH9A1−/− clones with mCherry-sgCTRL. There were no differences between mCherry-sgsgATP13A3 and mCherry-sgCTRL in FANCD2−/− cells. Two independent experiments were performed. A representative figure is shown. Error bars, SD. N = 3. (F) A competition assay, as shown in Fig. 5 E, with ALDH9A1−/− cells included. Growth advantage was not observed in ALDH9A1−/− cells targeted by sgATP13A3. One experiment in biological triplicate was performed. Error bars, SD. N = 3. (G) Cumulative population doublings of FANCD2−/−ALDH9A1−/− clones (dKO) as well as FANCD2−/−ALDH9A1−/−ATP13A3−/− clones (tKO), and their WT and single KO controls. Triple KO cells had improved growth rates. Two independent experiments were performed. Statistics were performed on pooled data. Error bars, SD. N = 6. (E–G) One-way ANOVA followed by multiple comparison test was performed for the last time point. (***, P = 0.0003; ****, P < 0.0001). (H) FANCD2, ALDH9A1, ATP13A3, γ-H2AX, H2AX, and α-tubulin western blot of Jurkat clones used in the experiments. ATP13A3 bulk KO was performed by Cas9-sgRNA-RNP nucleofection of FANCD2−/−ALDH9A1−/− cells. ATP13A3 indel percentage from the bulk cells assessed by Sanger sequencing and analysis by Synthego ICE were 89% and 91% for dKO c#2–5 and dKO c#2–18, respectively. dKO, double KO. Source data are available for this figure: SourceData F5.

Figure 5.

Deficiency of ATP13A3, a polyamine transporter, rescues synthetic lethality of FANCD2−/−ALDH9A1−/−cells. (A) Schematic summary of the metabolism-focused CRISPR KO suppressor screen. FANCD2−/− and FANCD2−/−ALDH9A1−/− Jurkat cells were infected with lentivirus-containing metabolism-focused sgRNA library in biological triplicate at MOI of 0.3. sgRNA representation of 500x was maintained throughout the experiment. sgRNAs after 14 population doublings were assessed to determine genetic perturbations that rescue synthetic lethality of FANCD2−/−ALDH9A1−/− Jurkat cells. (B) FANCD2, ALDH9A1, γ-H2AX, H2AX, and cleaved caspase 3 western blot of Jurkat clones used in the experiments. Vinculin was used as a loading control for each membrane. (C) cDNA-expressing WT ALDH9A1 and YFP was overexpressed in WT, ALDH9A1−/−, FANCD2−/−, and FANCD2−/−ALDH9A1−/− cells, and their relative growth was compared with luciferase-GFP–overexpressed counterparts by monitoring YFP/GFP ratio using flow cytometry. One experiment in biological triplicate was performed. One-way ANOVA followed by Dunnett’s multiple comparison test was performed (ns, not significant; *, P < 0.05; ***, P < 0.0005). Error bars, SD. N = 3. (D) A volcano plot showing log2 fold change (log2FC) value and P adj value between FANCD2−/− and FANCD2−/−ALDH9A1−/− at the sgRNA level. Only sgRNAs with P < 0.01 were used. Ten out of ten sgATP13A3s were significantly enriched in FANCD2−/−ALDH9A1−/− condition and marked as indicated. Values for all data points in this graph are in Table S5. (E) A competition assay using FANCD2−/− and two independent FANCD2−/−ALDH9A1−/− clones. The ratio of mCherry/GFP normalized to baseline was progressively increasing in FANCD2−/−ALDH9A1−/− clones with mCherry-sgATP13A3 compared with FANCD2−/−ALDH9A1−/− clones with mCherry-sgCTRL. There were no differences between mCherry-sgsgATP13A3 and mCherry-sgCTRL in FANCD2−/− cells. Two independent experiments were performed. A representative figure is shown. Error bars, SD. N = 3. (F) A competition assay, as shown in Fig. 5 E, with ALDH9A1−/− cells included. Growth advantage was not observed in ALDH9A1−/− cells targeted by sgATP13A3. One experiment in biological triplicate was performed. Error bars, SD. N = 3. (G) Cumulative population doublings of FANCD2−/−ALDH9A1−/− clones (dKO) as well as FANCD2−/−ALDH9A1−/−ATP13A3−/− clones (tKO), and their WT and single KO controls. Triple KO cells had improved growth rates. Two independent experiments were performed. Statistics were performed on pooled data. Error bars, SD. N = 6. (E–G) One-way ANOVA followed by multiple comparison test was performed for the last time point. (***, P = 0.0003; ****, P < 0.0001). (H) FANCD2, ALDH9A1, ATP13A3, γ-H2AX, H2AX, and α-tubulin western blot of Jurkat clones used in the experiments. ATP13A3 bulk KO was performed by Cas9-sgRNA-RNP nucleofection of FANCD2−/−ALDH9A1−/− cells. ATP13A3 indel percentage from the bulk cells assessed by Sanger sequencing and analysis by Synthego ICE were 89% and 91% for dKO c#2–5 and dKO c#2–18, respectively. dKO, double KO. Source data are available for this figure: SourceData F5.

Close modal
+ Expand view− Collapse view
Figure S5
Figure S5. Refer to the image caption for details.

DNA damage in and survival of FANCD2−/−ALDH9A1−/−clones. (A) Summary table for single-cell cloning of FANCD2−/−ALDH9A1−/− cells. (B) Results of RT-qPCR for ALDH9A1 gene in WT, FANCD2−/−, and FANCD2−/−ALDH9A1−/− (dKO) clones. One experiment was performed with technical triplicate. A mean of technical triplicate was shown in the graph. (C and D) Quantification of 53BP1 foci per cell (C) and γ-H2AX foci per cell (D) by immunofluorescence. Both were elevated in two dKO clones compared with their parental FANCD2−/− clone. One-way ANOVA followed by Tukey’s multiple comparison test was performed (*, P < 0.05; **, P < 0.005; ***, P < 0.0005;****, P < 0.0001). The red line indicates the median of each replicate. (C) Number of cells analyzed: WT n = 124, FANCD2−/− c#2 n = 170, dKO c#2-5 n = 63, dKO c#2-18 n = 62. (D) Number of cells analyzed: WT n = 90, FANCD2−/− c#2 n = 131, dKO c#2-5 n = 65, and dKO c#2-18 n = 48. (E) cDNA-expressing ALDH9A1 C288A (catalytic-dead mutant) and YFP was overexpressed in WT, ALDH9A1−/−, FANCD2−/−, and FANCD2−/−ALDH9A1−/− cells, and their relative growth was compared with luciferase-GFP–overexpressed counterparts by monitoring YFP/GFP ratio using flow cytometry. One experiment in biological triplicate was performed. One-way ANOVA followed by Dunnett’s multiple comparison test was performed (ns, not significant). Error bars, SD. N = 3. (F) ALDH activity was measured using a fluorometric ALDH activity assay kit (Abcam) in WT, parental ALDH9A1−/−, ALDH9A1−/− cells complemented with luciferase (Luc), WT ALDH9A1, or mutant ALDH9A1 (C288A) cDNA. One-way ANOVA followed by Tukey’s multiple comparison test was performed (ns, not significant, *, P < 0.05; **, P < 0.005; ***, P < 0.0005;****, P < 0.0001). Error bars, SD. N = 3, except for ALDH9A1−/− complemented with WT (purple bar), in which one outlier was excluded. (G and H)FANCD2−/− cells were serially transduced with lentivirus carrying mCherry-sgALDH9A1 followed by either GFP-sgCTRL or GFP-sgATP13A3. Two independent experiments were performed. A representative figure is shown. (G) The ratio of mCherry-GFP double-positive and mCherry single-positive cells (collectively, dKO) was compared with that of GFP single-positive and double-negative cells (collectively, FANCD2−/−). Error bars, SD. N = 3. (H) The ratio of mCherry-GFP double-positive (tKO) cells was compared with that of mCherry single-positive (dKO) cells. Error bars, SD. N = 3. (I) P adj values for genes that were differentially enriched in FANCD2−/−ALDH9A1−/− condition (dKO). They were calculated by the DESeq2 package and shown as a minus log 10 graph. Values for all data points in this graph are in Table S5. (J) Distribution of sizes of the second site indels in the ALDH9A1 gene of FANCD2−/−ALDH9A1−/− c#1 cells after retargeting ALDH9A1 with a second sgRNA. The parental clone carries compound heterozygous mutations—1-bp deletion and 7-bp insertion. ALDH9A1 c.765insC (1-bp insertion) was the most abundant second site indel, which would restore the reading frame of 1-bp deletion of the parental clone. Note that even though 2-bp insertions were the most frequent when the allelic frequencies of different 2-bp insertions were combined, ALDH9A1 c.765insC (1-bp insertion) was the most abundant mutant allele with the allelic frequency of 5.62%. (K) Predicted protein sequences of indicated alleles of ALDH9A1 showing that the second-site indels can restore the ALDH9A1 reading frame. WT ALDH9A1 protein is 518-amino acid long. FANCD2−/−ALDH9A1−/− c#1 carries 1-bp deletion of the seventh base in exon 5 (c.599DelC), which results in a premature stop codon. 1-bp insertion was the most frequent second-site indel after retargeting of ALDH9A1 with a second gRNA, which is predicted to restore the reading frame and result in a full-length protein with 90.5% amino acid sequence homology. Amino acids identical to WT sequences are shown in blue. dKO, double KO.

Figure S5.

DNA damage in and survival of FANCD2−/−ALDH9A1−/−clones. (A) Summary table for single-cell cloning of FANCD2−/−ALDH9A1−/− cells. (B) Results of RT-qPCR for ALDH9A1 gene in WT, FANCD2−/−, and FANCD2−/−ALDH9A1−/− (dKO) clones. One experiment was performed with technical triplicate. A mean of technical triplicate was shown in the graph. (C and D) Quantification of 53BP1 foci per cell (C) and γ-H2AX foci per cell (D) by immunofluorescence. Both were elevated in two dKO clones compared with their parental FANCD2−/− clone. One-way ANOVA followed by Tukey’s multiple comparison test was performed (*, P < 0.05; **, P < 0.005; ***, P < 0.0005;****, P < 0.0001). The red line indicates the median of each replicate. (C) Number of cells analyzed: WT n = 124, FANCD2−/− c#2 n = 170, dKO c#2-5 n = 63, dKO c#2-18 n = 62. (D) Number of cells analyzed: WT n = 90, FANCD2−/− c#2 n = 131, dKO c#2-5 n = 65, and dKO c#2-18 n = 48. (E) cDNA-expressing ALDH9A1 C288A (catalytic-dead mutant) and YFP was overexpressed in WT, ALDH9A1−/−, FANCD2−/−, and FANCD2−/−ALDH9A1−/− cells, and their relative growth was compared with luciferase-GFP–overexpressed counterparts by monitoring YFP/GFP ratio using flow cytometry. One experiment in biological triplicate was performed. One-way ANOVA followed by Dunnett’s multiple comparison test was performed (ns, not significant). Error bars, SD. N = 3. (F) ALDH activity was measured using a fluorometric ALDH activity assay kit (Abcam) in WT, parental ALDH9A1−/−, ALDH9A1−/− cells complemented with luciferase (Luc), WT ALDH9A1, or mutant ALDH9A1 (C288A) cDNA. One-way ANOVA followed by Tukey’s multiple comparison test was performed (ns, not significant, *, P < 0.05; **, P < 0.005; ***, P < 0.0005;****, P < 0.0001). Error bars, SD. N = 3, except for ALDH9A1−/− complemented with WT (purple bar), in which one outlier was excluded. (G and H)FANCD2−/− cells were serially transduced with lentivirus carrying mCherry-sgALDH9A1 followed by either GFP-sgCTRL or GFP-sgATP13A3. Two independent experiments were performed. A representative figure is shown. (G) The ratio of mCherry-GFP double-positive and mCherry single-positive cells (collectively, dKO) was compared with that of GFP single-positive and double-negative cells (collectively, FANCD2−/−). Error bars, SD. N = 3. (H) The ratio of mCherry-GFP double-positive (tKO) cells was compared with that of mCherry single-positive (dKO) cells. Error bars, SD. N = 3. (I) P adj values for genes that were differentially enriched in FANCD2−/−ALDH9A1−/− condition (dKO). They were calculated by the DESeq2 package and shown as a minus log 10 graph. Values for all data points in this graph are in Table S5. (J) Distribution of sizes of the second site indels in the ALDH9A1 gene of FANCD2−/−ALDH9A1−/− c#1 cells after retargeting ALDH9A1 with a second sgRNA. The parental clone carries compound heterozygous mutations—1-bp deletion and 7-bp insertion. ALDH9A1 c.765insC (1-bp insertion) was the most abundant second site indel, which would restore the reading frame of 1-bp deletion of the parental clone. Note that even though 2-bp insertions were the most frequent when the allelic frequencies of different 2-bp insertions were combined, ALDH9A1 c.765insC (1-bp insertion) was the most abundant mutant allele with the allelic frequency of 5.62%. (K) Predicted protein sequences of indicated alleles of ALDH9A1 showing that the second-site indels can restore the ALDH9A1 reading frame. WT ALDH9A1 protein is 518-amino acid long. FANCD2−/−ALDH9A1−/− c#1 carries 1-bp deletion of the seventh base in exon 5 (c.599DelC), which results in a premature stop codon. 1-bp insertion was the most frequent second-site indel after retargeting of ALDH9A1 with a second gRNA, which is predicted to restore the reading frame and result in a full-length protein with 90.5% amino acid sequence homology. Amino acids identical to WT sequences are shown in blue. dKO, double KO.

Close modal
Figure 6.

3-aminopropanal treatment accelerates dropout and increases DNA damage in FANCD2−/−ALDH9A1−/−cells. (A) A flow-based competition assay using WT and two independent FANCD2−/− clones. As shown in Fig. 1 G, targeting by sgALDH9A1 results in a preferential dropout of two independent FANCD2−/− clones. The rate of dropout was accelerated by the repeated treatment of 3-aminopropanal 12.5 µM (every 4 days). There was no apparent acceleration of dropout in the spermine-treated condition, in which cells were treated by spermine 250 µM and every 4 days from the day of mixing until day 15, after which the dose of spermine was increased to 500 µM until the end of the experiment. For the 3-aminopropanal treatment, two independent experiments were performed, and a representative figure is shown. For the spermine treatment, one experiment was performed in biological triplicate. Error bars, SD. N = 3. (B) γ-H2AX, H2AX, and vinculin western blot of Jurkat clones treated with or without 25 µM 3-aminopropanal for 24 h. (C) γ-H2AX, H2AX, and α-tubulin western blot of Jurkat clones treated with or without 250 µM spermine in 10% human serum-containing media for 72 h 3-APAL, 3-aminopropanal. Source data are available for this figure: SourceData F6.

Figure 6.

3-aminopropanal treatment accelerates dropout and increases DNA damage in FANCD2−/−ALDH9A1−/−cells. (A) A flow-based competition assay using WT and two independent FANCD2−/− clones. As shown in Fig. 1 G, targeting by sgALDH9A1 results in a preferential dropout of two independent FANCD2−/− clones. The rate of dropout was accelerated by the repeated treatment of 3-aminopropanal 12.5 µM (every 4 days). There was no apparent acceleration of dropout in the spermine-treated condition, in which cells were treated by spermine 250 µM and every 4 days from the day of mixing until day 15, after which the dose of spermine was increased to 500 µM until the end of the experiment. For the 3-aminopropanal treatment, two independent experiments were performed, and a representative figure is shown. For the spermine treatment, one experiment was performed in biological triplicate. Error bars, SD. N = 3. (B) γ-H2AX, H2AX, and vinculin western blot of Jurkat clones treated with or without 25 µM 3-aminopropanal for 24 h. (C) γ-H2AX, H2AX, and α-tubulin western blot of Jurkat clones treated with or without 250 µM spermine in 10% human serum-containing media for 72 h 3-APAL, 3-aminopropanal. Source data are available for this figure: SourceData F6.

Close modal

References

Alter
,
B.P.
2014
.
Fanconi anemia and the development of leukemia
.
Best Pract. Res. Clin. Haematol.
27
:
214
221
.
Bierings
,
M.
,
C.
Bonfim
,
R.
Peffault De Latour
,
M.
Aljurf
,
P.A.
Mehta
,
C.
Knol
,
F.
Boulad
,
A.
Tbakhi
,
A.
Esquirol
,
G.
McQuaker
, et al
.
2018
.
Transplant results in adults with Fanconi anaemia
.
Br. J. Haematol.
180
:
100
109
.
Birsoy
,
K.
,
T.
Wang
,
W.W.
Chen
,
E.
Freinkman
,
M.
Abu-Remaileh
, and
D.M.
Sabatini
.
2015
.
An essential role of the mitochondrial electron transport chain in cell proliferation is to enable aspartate synthesis
.
Cell
.
162
:
540
551
.
Burgos-Barragan
,
G.
,
N.
Wit
,
J.
Meiser
,
F.A.
Dingler
,
M.
Pietzke
,
L.
Mulderrig
,
L.B.
Pontel
,
I.V.
Rosado
,
T.F.
Brewer
,
R.L.
Cordell
, et al
.
2017
.
Mammals divert endogenous genotoxic formaldehyde into one-carbon metabolism
.
Nature
.
548
:
549
554
.
Castells-Roca
,
L.
,
S.
Gutiérrez-Enríquez
,
S.
Bonache
,
M.
Bogliolo
,
E.
Carrasco
,
M.
Aza-Carmona
,
G.
Montalban
,
N.
Muñoz-Subirana
,
R.
Pujol
,
C.
Cruz
, et al
.
2021
.
Clinical consequences of BRCA2 hypomorphism
.
NPJ Breast Cancer
.
7
:
117
.
Ceccaldi
,
R.
,
K.
Parmar
,
E.
Mouly
,
M.
Delord
,
J.M.
Kim
,
M.
Regairaz
,
M.
Pla
,
N.
Vasquez
,
Q.S.
Zhang
,
C.
Pondarre
, et al
.
2012
.
Bone marrow failure in Fanconi anemia is triggered by an exacerbated p53/p21 DNA damage response that impairs hematopoietic stem and progenitor cells
.
Cell Stem Cell
.
11
:
36
49
.
Chung
,
Y.R.
,
E.
Kim
, and
O.
Abdel-Wahab
.
2014
.
Femoral bone marrow aspiration in live mice
.
J. Vis. Exp.
51660
.
Crossan
,
G.P.
,
L.
van der Weyden
,
I.V.
Rosado
,
F.
Langevin
,
P.H.L.
Gaillard
,
R.E.
McIntyre
,
F.
Gallagher
,
M.I.
Kettunen
,
D.Y.
Lewis
,
K.
Brindle
, et al
.
2011
.
Disruption of mouse Slx4, a regulator of structure-specific nucleases, phenocopies Fanconi anemia
.
Nat. Genet.
43
:
147
152
.
Dingler
,
F.A.
,
M.
Wang
,
A.
Mu
,
C.L.
Millington
,
N.
Oberbeck
,
S.
Watcham
,
L.B.
Pontel
,
A.N.
Kamimae-Lanning
,
F.
Langevin
,
C.
Nadler
, et al
.
2020
.
Two aldehyde clearance systems are essential to prevent lethal formaldehyde accumulation in mice and humans
.
Mol. Cell
.
80
:
996
1012.e9
.
Dufour
,
C.
2017
.
How I manage patients with Fanconi anaemia
.
Br. J. Haematol.
178
:
32
47
.
Feron
,
V.J.
,
H.P.
Til
,
F.
de Vrijer
,
R.A.
Woutersen
,
F.R.
Cassee
, and
P.J.
van Bladeren
.
1991
.
Aldehydes: Occurrence, carcinogenic potential, mechanism of action and risk assessment
.
Mutat. Res.
259
:
363
385
.
Garaycoechea
,
J.I.
,
G.P.
Crossan
,
F.
Langevin
,
M.
Daly
,
M.J.
Arends
, and
K.J.
Patel
.
2012
.
Genotoxic consequences of endogenous aldehydes on mouse haematopoietic stem cell function
.
Nature
.
489
:
571
575
.
Garaycoechea
,
J.I.
,
G.P.
Crossan
,
F.
Langevin
,
L.
Mulderrig
,
S.
Louzada
,
F.
Yang
,
G.
Guilbaud
,
N.
Park
,
S.
Roerink
,
S.
Nik-Zainal
, et al
.
2018
.
Alcohol and endogenous aldehydes damage chromosomes and mutate stem cells
.
Nature
.
553
:
171
177
.
Haines
,
D.C.
,
S.
Chattopadhyay
, and
J.M.
Ward
.
2001
.
Pathology of aging B6;129 mice
.
Toxicol. Pathol.
29
:
653
661
.
Hamouda
,
N.N.
,
C.
Van den Haute
,
R.
Vanhoutte
,
R.
Sannerud
,
M.
Azfar
,
R.
Mayer
,
Á.
Cortés Calabuig
,
J.V.
Swinnen
,
P.
Agostinis
,
V.
Baekelandt
, et al
.
2021
.
ATP13A3 is a major component of the enigmatic mammalian polyamine transport system
.
J. Biol. Chem.
296
:
100182
.
Harrison
,
B.A.
,
E.
Mizrahi-Powell
,
J.
Pappas
,
K.
Thomas
,
S.
Vasishta
,
S.
Hebbar
,
A.
Shukla
,
S.S.
Nayak
,
T.K.
Truong
,
A.
Woroch
, et al
.
2025
.
Deficiency of the Fanconi anemia core complex protein FAAP100 results in severe Fanconi anemia.
J. Clin. Invest.
135
:
e185126
.
Hira
,
A.
,
H.
Yabe
,
K.
Yoshida
,
Y.
Okuno
,
Y.
Shiraishi
,
K.
Chiba
,
H.
Tanaka
,
S.
Miyano
,
J.
Nakamura
,
S.
Kojima
, et al
.
2013
.
Variant ALDH2 is associated with accelerated progression of bone marrow failure in Japanese Fanconi anemia patients
.
Blood
.
122
:
3206
3209
.
Jackson
,
B.
,
C.
Brocker
,
D.C.
Thompson
,
W.
Black
,
K.
Vasiliou
,
D.W.
Nebert
, and
V.
Vasiliou
.
2011
.
Update on the aldehyde dehydrogenase gene (ALDH) superfamily
.
Hum. Genomics
.
5
:
283
303
.
Jung
,
M.
,
I.
Ilyashov
,
Y.
Park
,
F.X.
Donovan
,
R.
Ramanagoudr-Bhojappa
,
D.
Keahi
,
J.A.
Durmaz
,
H.B.
Choijilsuren
,
A.
Goldfarb
,
M.
Stein
, et al
.
2022
.
ALDH9A1 deficiency as a source of endogenous DNA damage that requires repair by the Fanconi anemia pathway
.
bioRxiv
.
(Preprint posted May 27, 2022)
.
Jung
,
M.
, and
A.
Smogorzewska
.
2021
.
Endogenous formaldehyde destroys blood stem cells
.
Blood
.
137
:
1988
1990
.
Knies
,
K.
,
S.
Inano
,
M.J.
Ramírez
,
M.
Ishiai
,
J.
Surrallés
,
M.
Takata
, and
D.
Schindler
.
2017
.
Biallelic mutations in the ubiquitin ligase RFWD3 cause Fanconi anemia
.
J. Clin. Invest.
127
:
3013
3027
.
Končitíková
,
R.
,
A.
Vigouroux
,
M.
Kopečná
,
M.
Šebela
,
S.
Moréra
, and
D.
Kopečný
.
2019
.
Kinetic and structural analysis of human ALDH9A1
.
Biosci. Rep.
39
:
BSR20190558
.
Kottemann
,
M.C.
, and
A.
Smogorzewska
.
2013
.
Fanconi anaemia and the repair of Watson and Crick DNA crosslinks
.
Nature
.
493
:
356
363
.
Kutler
,
D.I.
,
B.
Singh
,
J.
Satagopan
,
S.D.
Batish
,
M.
Berwick
,
P.F.
Giampietro
,
H.
Hanenberg
, and
A.D.
Auerbach
.
2003
.
A 20-year perspective on the international Fanconi anemia registry (IFAR)
.
Blood
.
101
:
1249
1256
.
Lach
,
F.P.
,
S.
Singh
,
K.A.
Rickman
,
P.D.
Ruiz
,
R.J.
Noonan
,
K.B.
Hymes
,
M.D.
DeLacure
,
J.A.
Kennedy
,
S.C.
Chandrasekharappa
, and
A.
Smogorzewska
.
2020
.
Esophageal cancer as initial presentation of Fanconi anemia in patients with a hypomorphic FANCA variant
.
Cold Spring Harb. Mol. Case Stud.
6
:
a005595
.
Langevin
,
F.
,
G.P.
Crossan
,
I.V.
Rosado
,
M.J.
Arends
, and
K.J.
Patel
.
2011
.
Fancd2 counteracts the toxic effects of naturally produced aldehydes in mice
.
Nature
.
475
:
53
58
.
Liu
,
J.
,
X.
Xia
, and
P.
Huang
.
2020
a.
xCT: A critical molecule that links cancer metabolism to redox signaling
.
Mol. Ther.
28
:
2358
2366
.
Liu
,
X.
,
Y.
Zhang
,
L.
Zhuang
,
K.
Olszewski
, and
B.
Gan
.
2020
b.
NADPH debt drives redox bankruptcy: SLC7A11/xCT-mediated cystine uptake as a double-edged sword in cellular redox regulation
.
Genes Dis.
8
:
731
745
.
Nalepa
,
G.
, and
D.W.
Clapp
.
2018
.
Fanconi anaemia and cancer: An intricate relationship
.
Nat. Rev. Cancer
.
18
:
168
185
.
Oka
,
Y.
,
M.
Hamada
,
Y.
Nakazawa
,
H.
Muramatsu
,
Y.
Okuno
,
K.
Higasa
,
M.
Shimada
,
H.
Takeshima
,
K.
Hanada
,
T.
Hirano
, et al
.
2020
.
Digenic mutations in ALDH2 and ADH5 impair formaldehyde clearance and cause a multisystem disorder, AMeD syndrome
.
Sci. Adv.
6
:eabd7197.
Paulick
,
M.G.
, and
C.R.
Bertozzi
.
2008
.
The glycosylphosphatidylinositol anchor: A complex membrane-anchoring structure for proteins
.
Biochemistry
.
47
:
6991
7000
.
Pegg
,
A.E.
2013
.
Toxicity of polyamines and their metabolic products
.
Chem. Res. Toxicol.
26
:
1782
1800
.
Pontel
,
L.B.
,
I.V.
Rosado
,
G.
Burgos-Barragan
,
J.I.
Garaycoechea
,
R.
Yu
,
M.J.
Arends
,
G.
Chandrasekaran
,
V.
Broecker
,
W.
Wei
,
L.
Liu
, et al
.
2015
.
Endogenous formaldehyde is a hematopoietic stem cell genotoxin and metabolic carcinogen
.
Mol. Cell
.
60
:
177
188
.
Sanjana
,
N.E.
,
O.
Shalem
, and
F.
Zhang
.
2014
.
Improved vectors and genome-wide libraries for CRISPR screening
.
Nat. Methods
.
11
:
783
784
.
Seiler
,
N.
2004
.
Catabolism of polyamines
.
Amino Acids
.
26
:
217
233
.
Sekhar
,
V.
,
T.
Andl
, and
O.
Phanstiel
IV
.
2022
.
ATP13A3 facilitates polyamine transport in human pancreatic cancer cells
.
Sci. Rep.
12
:
4045
.
Shen
,
X.
,
R.
Wang
,
M.J.
Kim
,
Q.
Hu
,
C.C.
Hsu
,
J.
Yao
,
N.
Klages-Mundt
,
Y.
Tian
,
E.
Lynn
,
T.F.
Brewer
, et al
.
2020
.
A surge of DNA damage links transcriptional reprogramming and hematopoietic deficit in Fanconi anemia
.
Mol. Cell
.
80
:
1013
1024.e6
.
Shimamura
,
A.
, and
B.P.
Alter
.
2010
.
Pathophysiology and management of inherited bone marrow failure syndromes
.
Blood Rev.
24
:
101
122
.
Umansky
,
C.
,
A.E.
Morellato
,
M.
Rieckher
,
M.A.
Scheidegger
,
M.R.
Martinefski
,
G.A.
Fernández
,
O.
Pak
,
K.
Kolesnikova
,
H.
Reingruber
,
M.
Bollini
, et al
.
2022
.
Endogenous formaldehyde scavenges cellular glutathione resulting in redox disruption and cytotoxicity
.
Nat. Commun.
13
:
745
.
Wang
,
A.T.
, and
A.
Smogorzewska
.
2015
.
SnapShot: Fanconi anemia and associated proteins
.
Cell
.
160
:
354
354.e1
.
Wang
,
M.
,
F.A.
Dingler
, and
K.J.
Patel
.
2022
.
Genotoxic aldehydes in the hematopoietic system
.
Blood
.
139
:
2119
2129
.
Yang
,
Z.
,
X.S.
Wu
,
Y.
Wei
,
S.A.
Polyanskaya
,
S.V.
Iyer
,
M.
Jung
,
F.P.
Lach
,
E.R.
Adelman
,
O.
Klingbeil
,
J.P.
Milazzo
, et al
.
2021
.
Transcriptional silencing of ALDH2 confers a dependency on Fanconi anemia proteins in acute myeloid leukemia
.
Cancer Discov.
11
:
2300
2315
.

or Create an Account

Close Modal
Close Modal