Pexophagy, the selective degradation of peroxisomes, is essential for removing excess or dysfunctional peroxisomes, and its dysregulation has been linked to various diseases. Although optineurin (OPTN), an autophagy receptor involved in mitophagy, aggrephagy, and xenophagy, has also been implicated in pexophagy in HEK-293 cells, the underlying mechanisms remain unclear. Using proximity labeling, we identified PEX14, a peroxisomal membrane protein, as a neighboring partner of OPTN. Microscopy analyses revealed that clustering of peroxisomes with OPTN is a key feature of OPTN-mediated pexophagy. Biochemical studies demonstrated that PEX14 and OPTN interact through their coiled-coil and ubiquitin-binding domains, respectively. Further analyses showed that the C-terminal half of overexpressed OPTN triggers pexophagy, likely by oligomerizing with endogenous OPTN. The colocalization of PEX14–OPTN complexes with LC3, together with the suppression of OPTN-mediated peroxisome degradation by bafilomycin A1, supports a model in which PEX14 acts as a docking site for OPTN on the peroxisomal membrane, enabling the recruitment of the autophagic machinery for OPTN-mediated pexophagy.

Introduction
Macroautophagy (here referred to as autophagy) is a critical cellular process wherein unnecessary or damaged intracellular components are enclosed within double-membrane vesicles, called autophagosomes, and subsequently transported to the lysosomal compartment for degradation and recycling (Klionsky et al., 2021). Acting as a vigilant guardian, autophagy plays a crucial role in maintaining cellular and organismal health by efficiently managing responses to various sources of stress (Ravanan et al., 2017). Impaired autophagy flux can result in the accumulation of dysfunctional organelles, contributing to cellular dysfunction by promoting the buildup of oxidative stress and disrupting essential signaling pathways (Rahman et al., 2023). One such organelle is the peroxisome, renowned for its pivotal role in cellular lipid and H2O2 metabolism (Wanders et al., 2023).
In mammals, the autophagic degradation of peroxisomes, known as pexophagy, can occur through different mechanisms (Li et al., 2021; Bajdzienko and Bremm, 2024). For example, a well-characterized pathway involves the recruitment of canonical autophagy receptors like NBR1 (neighbor of BRCA1 gene 1 protein) and SQSTM1/p62 (sequestosome-1) (Deosaran et al., 2013; Yamashita et al., 2014; Zhang et al., 2015; Riccio et al., 2019), which target ubiquitinated proteins (e.g., peroxin-5 [PEX5]) (Zhang et al., 2015; Nordgren et al., 2015) and ATP-binding cassette subfamily D member 3 (ABCD3) (Sargent et al., 2016) at the peroxisomal membrane and bind to microtubule-associated protein 1A/1B light chain 3B (MAP1LC3/LC3) on the autophagosomal membrane (Gubas and Dikic, 2022). In addition, under specific environmental conditions (e.g., amino acid starvation), lipidated LC3 (called LC3-II) can be recruited to the peroxisomal membrane in a noncanonical manner through direct interaction with the peroxisomal membrane protein (PMP) peroxin-14 (PEX14) (Hara-Kuge and Fujiki, 2008; Jiang et al., 2015). This membrane protein, a central player in peroxisomal matrix protein import (Fransen et al., 1998), can also recruit autophagy-related protein 9A (ATG9A), a phospholipid scramblase that plays a key role in autophagosomal membrane expansion (Maeda et al., 2020), through its interaction with TNKS1 (poly[ADP-ribose] polymerase tankyrase-1) and TNKS2 (poly[ADP-ribose] polymerase tankyrase-2) (Li et al., 2017). Moreover, HSPA8 (heat shock cognate 71-kDa protein) has been reported to mediate the translocation of the E3 ligase STUB1 (E3 ubiquitin-protein ligase CHIP) to oxidatively stressed peroxisomes, leading to their turnover by autophagy (Chen et al., 2020). Furthermore, hypoxia and iron chelation have been reported to promote pexophagy by upregulating BCL2/adenovirus E1B 19-kDa protein-interacting protein 3-like through a mechanism yet to be fully characterized, bypassing ubiquitin priming (Wilhelm et al., 2022; Barone et al., 2023). Alterations in pexophagy flux can lead to diseases, either directly (Nazarko, 2017; Cho et al., 2018) or through the impairment of other selective autophagy pathways (Germain et al., 2024).
Recently, we demonstrated that ectopic expression of optineurin (OPTN), a recognized autophagy receptor involved in targeting depolarized mitochondria, protein aggregates, and intracellular bacterial pathogens (Qiu et al., 2022), induces pexophagy in HEK-293 cells (Li et al., 2023). However, the precise mechanisms underlying this process remain unclear. OPTN contains several structural domains crucial for its involvement in autophagy, including a ubiquitin-binding domain named NEMO-OPTN-ABIN (NOA), a C-terminal ubiquitin-binding zinc finger (ZF), and an LC3-interacting region (LIR) (Korac et al., 2013; Weil et al., 2018). OPTN can also interact with diverse protein aggregates through its C-terminal coiled-coil (CC) domain, independently of ubiquitin (Korac et al., 2013). In addition, it employs an unconventional mechanism to initiate mitophagy by interacting with and activating TANK-binding kinase 1 (TBK1), a serine/threonine kinase that directly binds to the phosphoinositide 3-kinase complex (Nguyen et al., 2023; Yamano et al., 2024). Phosphorylation of OPTN by TBK1 increases its affinity for ubiquitin chains and LC3, thereby promoting mitophagy (Nguyen et al., 2023). Furthermore, the LIR–LC3 interaction can drive the ubiquitin-independent recruitment of OPTN, further enhancing mitophagy (Padman et al., 2019). OPTN also harbors a leucine zipper domain capable of forming a complex with ATG9A vesicles, which initiates the formation of local autophagosomal membranes (Yamano et al., 2020). Notably, dysfunctions in OPTN-mediated autophagy have been associated with various diseases, including but not limited to amyotrophic lateral sclerosis, glaucoma, and Crohn’s disease (Qiu et al., 2022).
In this study, we identified PEX14 as part of the OPTN interactome using proximity labeling proteomics. Imaging and biochemistry analyses showed that peroxisome clustering is a characteristic feature of OPTN-mediated pexophagy and that the interaction between OPTN and PEX14 is mediated by the NOA of OPTN and the CC domain of PEX14. Furthermore, we observed that PEX14–OPTN complexes colocalize with LC3 and that OPTN-driven peroxisome degradation is inhibited by bafilomycin A1 (Baf A1). These findings support a model in which PEX14 functions as a molecular bridge, recruiting OPTN to peroxisomes to enable their selective clearance through pexophagy.
Results
OPTN-GFP–mediated pexophagy exhibits cell line–specific variability
Using HEK-293 cells stably expressing po-mKeima—a validated, pH-sensitive red fluorescent reporter for pexophagy that shifts excitation from 440 nm at neutral pH to 586 nm at acidic pH, with an emission peak at 620 nm—we previously demonstrated that (1) both endogenous and GFP-tagged OPTN can localize to peroxisomes, and (2) expression of OPTN-GFP is sufficient to induce pexophagy, even under basal growth conditions (Li et al., 2023). At the start of this study, we observed that OPTN-GFP expression induced pexophagy to varying extents across different cell lines expressing po-mKeima (Fig. S1, A–C). This variability correlated with the degree of OPTN-GFP recruitment to peroxisomes, as shown by its colocalization with the peroxisomal marker mCherry–C-terminal peroxisomal targeting signal 1 (PTS1) in HCT116 cells (Fig. S1 A, upper panels) and HEK-293 cells (Fig. 1 A, upper panels), but not in HeLa cells (Fig. S1 A, lower panels). Consistently, co-expression of OPTN-GFP with a high-affinity, plasma membrane–targeted anti-GFP nanobody caused peroxisomes to relocate to the plasma membrane in HEK-293 (Fig. 1 A, lower panels) and HCT116 (Fig. S1 A, upper panels) cells, but not in HeLa cells (Fig. S1 A, lower panels).
In both HEK-293 and HCT116 cells, OPTN-GFP expression reliably induced the formation of distinct clusters containing both OPTN-GFP and peroxisomes (Fig. 1, A and B; and Fig. S1 A). This clustering coincided with a decrease in peroxisome number, as quantified in HEK-293 cells (Fig. 1 C). The clusters were more clearly visualized using structured illumination microscopy (Fig. 1 D) and showed positive staining for the autophagy marker GFP-LC3 (Fig. 2 A). Importantly, OPTN-GFP did not co-cluster with other organelles—including mitochondria, the endoplasmic reticulum, or lysosomes—indicating specificity for peroxisomes (Fig. S2).
Similar clusters containing endogenous OPTN and peroxisomes were occasionally observed in HEK-293 cells (Fig. 1 E) and in SV40 large T-antigen–transformed human fibroblasts lacking mitochondrial fission factor (MFF) (Fig. 1 F), which exhibit elongated peroxisomes due to impaired fission (Passmore et al., 2020). Notably, OPTN-mediated peroxisome degradation was inhibited by the autophagy inhibitor Baf A1 (Fig. 2, B and C). Moreover, overexpression of OPTN-GFP did not induce general autophagy, as evidenced by unchanged LC3B II/I ratios and SQSTM1 protein levels in western blot analyses (Fig. 2, D and E). Collectively, these findings demonstrate that OPTN can be recruited to peroxisomes and promote their selective degradation via pexophagy, in a manner that varies between human cell types.
The PMP PEX14 is a proximity partner of OPTN
To gain a better understanding of the molecular factors involved in OPTN-mediated pexophagy, we conducted a series of proximity-dependent biotin identification (BioID) experiments in HEK-293 cells transiently expressing OPTN-GFP fused to the miniTurbo biotin ligase (Fig. 3 A). Upon the addition of biotin to the medium, this fusion protein enables the proximity-dependent covalent biotin labeling of proteins within a 10 nm radius (Qin et al., 2021). Subsequently, through streptavidin-based affinity purification of the biotinylated proteins combined with mass spectrometry identification, the neighboring proteins of OPTN can be identified at the molecular level. Among the top-ranked proteins identified in three independent replicates were TBK1, a well-known interaction partner of OPTN (Morton et al., 2008), and the PMP PEX14 (Fig. 3 B and Table S1). Notably, no other peroxisomal protein exhibited the same enrichment factor as PEX14, which led us to hypothesize that PEX14 and OPTN may form a protein complex in these cells.
To test this possibility, we performed GFP-Trap analyses in HEK-293 cells overexpressing OPTN using three methods: (1) transient expression by electroporating cells with an OPTN-encoding mammalian expression plasmid; (2) inducible expression in OPTN-GFP flippase (Flp)-In T-REx 293 cells treated with 1 µg/ml doxycycline; and (3) constitutive expression by infecting Flp-In T-REx 293 cells with lentivirus. In some experiments, OPTN-GFP was expressed alongside ectopically expressed PEX14. As shown in Fig. S3, A and B, both ectopically expressed and endogenous PEX14 co-immunoprecipitated with OPTN-GFP, indicating that the two proteins form a complex in these cells. Note that the expression levels of OPTN-GFP were ∼15 times higher than those of endogenous OPTN (Fig. S3, C and D).
PEX14 is required for the recruitment of OPTN to the peroxisomal membrane
To investigate the role of PEX14 in recruiting OPTN to the peroxisomal membrane, we could not employ our validated po-mKeima pexophagy reporter, as it targets the peroxisomal matrix and depends on a functional import pathway for proper localization (Li et al., 2023). This pathway is disrupted in PEX14-deficient cells (Huybrechts et al., 2008), and PMPs exhibit variable turnover rates (Matsuzaki and Fujiki, 2008; Huybrechts et al., 2009), rendering PMP-mKeima fusion proteins unreliable indicators of pexophagic flux. Therefore, we instead examined the localization of both endogenous OPTN and GFP-tagged OPTN in HEK-293 cells lacking PEX3, PEX5, or PEX14 (Fig. 3 C). In cells lacking either PEX5 or PEX14—both deficient in matrix protein import—endogenous OPTN localized to peroxisomal membrane remnants in PEX5-deficient cells, but not in PEX14-deficient cells. Furthermore, in PEX3-deficient cells, which lack peroxisomal membrane remnants and mislocalize PEX14 to mitochondria (Jansen et al., 2024), OPTN-GFP showed partial mitochondrial localization. Collectively, these findings provide direct evidence that PEX14 is necessary for the recruitment of OPTN to the peroxisomal membrane.
The C-terminal half of OPTN is sufficient to bind PEX14 and initiate pexophagy
OPTN comprises multiple domains that either mediate interactions with various types of cargo or regulate their engulfment into autophagosomes (Fig. 3 A). To determine which regions of OPTN are responsible for binding PEX14 and inducing pexophagy, we co-expressed GFP-tagged N-terminal or C-terminal halves of OPTN with PEX14 in HEK-293 cells and conducted GFP-Trap assays alongside flow cytometry–based pexophagy measurements. These experiments demonstrated that the C-terminal 361 amino acids of OPTN, which include the NOA and ZF ubiquitin-binding domains, are sufficient to bind PEX14 (Fig. 4, A and B) and promote pexophagy (Fig. 4, D and E). In contrast, the N-terminal 209 amino acids, containing the TBK1-, LC3-, and ATG9A-binding domains, showed weak binding to PEX14 (Fig. 4, A and B) and were insufficient to induce pexophagy (Fig. 4, D and E). Representative images of cells exhibiting no, weak, moderate, or strong pexophagy are shown in Fig. 4 C. However, given that (1) pexophagy shows substantial cell-to-cell variability even under the same conditions, and (2) immunofluorescence (IF) captures only a limited number of cells, these images are intended solely to illustrate the range of pexophagy phenotypes. Quantitative analysis was primarily based on flow cytometry, with 100,000 events analyzed to ensure robust statistical accuracy.
OPTN binds to PEX14 and initiates pexophagy through its NOA
To delineate the precise C-terminal domain of OPTN responsible for its interaction with PEX14, we first co-expressed OPTN-GFP fusion proteins with internal deletion of CC2 (OPTNΔ295–360-GFP), CC3 (OPTNΔ422–454-GFP), NOA (OPTNΔ454–520-GFP), or the ZF (OPTNΔ545–577-GFP) domain, alongside non-tagged full-length PEX14. Results indicate that the deletion of amino acids 454–520, encompassing the full NOA, significantly diminishes the affinity of OPTN for PEX14 (Fig. 5, A and B). Unfortunately, due to the very low expression levels of OPTNΔ545–577-GFP (data not shown), no reliable conclusions could be drawn regarding the potential role of the ZF domain of OPTN in PEX14 binding.
We then investigated whether the ubiquitin-binding capacity of OPTN’s NOA is necessary for its interaction with PEX14. We co-expressed PEX14 with OPTND474N-GFP or GFP-OPTNΔ474–479, two OPTN variants in which key residues in the NOA ubiquitin-binding domain were either mutated or deleted (Gleason et al., 2011; Wild et al., 2011). These experiments show that ubiquitin binding in the NOA of OPTN is not required for the OPTN–PEX14 interaction (Fig. 5, C and D). In addition, the OPTNΔ474–479 variant that can bind PEX14 is also capable of inducing pexophagy (Fig. 5, E and F).
Knockdown of endogenous OPTN disrupts GFP-OPTN217–577–mediated pexophagy
It is known that the LC3- and ATG9A-binding domains of OPTN are important for facilitating autophagosome formation and participating in selective autophagy (Zhao et al., 2023). However, as shown in Fig. 4, D and E, a truncated OPTN variant lacking these domains (GFP-OPTN217–577) is still capable of inducing pexophagy. Given that OPTN primarily exists as a trimer in vivo (Gao et al., 2014), we wondered whether the truncated OPTN-GFP protein might oligomerize with endogenous OPTN. Therefore, we downregulated the expression levels of endogenous OPTN by transfecting HEK-293 cells with a Dicer-substrate short interfering RNA (DsiRNA) targeting exon 5, encoding amino acids 57–123 (Fig. 6, A–C). Although we were unable to confirm by immunoprecipitation that GFP-OPTN217–577 interacts with the endogenous protein, due to both proteins exhibiting the same migration pattern on SDS-PAGE (Fig. 6 C), these experiments demonstrated that knocking down endogenous OPTN expression interferes with GFP-OPTN217–577–mediated pexophagy (Fig. 6, D and E).
PEX14 interacts with OPTN via its predicted CC domain
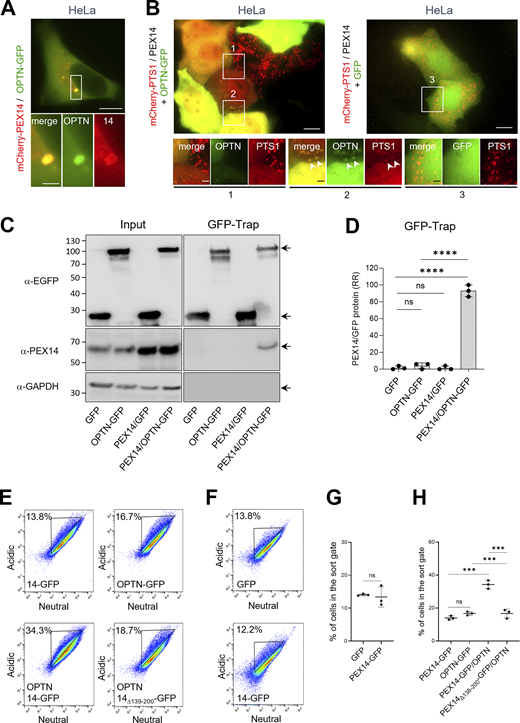
To delineate the domain on PEX14 responsible for its interaction with OPTN, we conducted GFP-Trap assays on lysates derived from HEK-293 cells co-expressing non-tagged OPTN and PEX14-GFP variants lacking the N-terminal PEX5/PEX13/PEX19-binding domain (PEX1465–377-GFP), the membrane anchoring region (PEX14Δ110–126-GFP), the CC domain (PEX14Δ139–199-GFP), or the C-terminal D/E-rich region (PEX141–313-GFP) (Fransen et al., 2002). These experiments demonstrate that the CC domain of PEX14 is essential for its binding to OPTN (Fig. 7, A and B). In line with this, co-expression of non-tagged full-length OPTN with PEX141–377-GFP, but not with the PEX14Δ139–199-GFP, promoted OPTN-induced pexophagy not only in HEK-293 cells (Fig. 7, C–F) but, notably, also in HeLa cells (Fig. 8; see also Discussion). Importantly, the pexophagy-promoting conditions in HeLa cells were observed only upon recruitment of OPTN to peroxisomes via PEX14 overexpression and were accompanied by pronounced peroxisome clustering (Fig. 8).
To investigate why OPTN alone fails to efficiently induce pexophagy in HeLa cells—despite being effective when co-expressed with PEX14—we performed additional immunoblot analyses (Fig. S1, D–F). These experiments revealed that endogenous levels of both PEX14 and OPTN are significantly lower in HeLa cells compared with HEK-293 and HCT116 cells. This finding supports the hypothesis that limited expression of these key proteins restricts OPTN-mediated pexophagy in HeLa cells. Interestingly, this process appears to occur independently of the canonical receptors NBR1 and SQSTM1 (Fig. 9, A–D). However, we cannot exclude the possibility that additional cell type–specific mechanisms may influence the inducibility of pexophagy upon co-expression of OPTN and PEX14.
Torin-1 induces pexophagy in the absence of classical autophagy receptors
The finding that OPTN-GFP does not trigger pexophagy in HeLa cells unless PEX14 is also overexpressed led us to hypothesize that pexophagy in these cells may be mediated by one or more other classical autophagy receptors involved in pexophagy (Deosaran et al., 2013; Yamashita et al., 2014; Zhang et al., 2015; Riccio et al., 2019). To identify those receptor(s), we first examined peroxisome abundance in HeLa cells lacking the five classical autophagy receptors: SQSTM1, NBR1, OPTN, NDP52, and TAX1BP1 (Lazarou et al., 2015). Surprisingly, IF and immunoblotting (IB) analyses revealed that peroxisome abundance remained unchanged in these cells (Fig. 9, E–H). Remarkably, we found that Torin-1, a potent autophagy activator, could still induce pexophagy in po-mKeima penta-KO HeLa cells (Fig. 10, A–C), supporting the existence of noncanonical pexophagy pathways (Hara-Kuge and Fujiki, 2008; Jiang et al., 2015; Li et al., 2017; Wilhelm et al., 2022; Barone et al., 2023).
OPTN-mediated pexophagy involves a noncanonical autophagy pathway
To further determine whether OPTN-mediated pexophagy proceeds via a noncanonical autophagy pathway, we investigated the impact of deficiencies in key autophagy components—specifically FIP200, WIPI2, and the ATG8 protein family—on both basal and OPTN-induced pexophagy. Basal pexophagy was significantly reduced in HEK-293 cells lacking FIP200 (Eickhorst et al., 2024), in WIPI2-deficient HEK-293A cells (Gubas et al., 2024), and in HeLa cells lacking all ATG8 family proteins (Nguyen et al., 2016) (Fig. 10, D and E), indicating that these core autophagy proteins are essential for efficient pexophagy under steady-state conditions.
Interestingly, the loss of FIP200—a key regulator of both early and late stages of autophagosome formation—led to a striking accumulation of endogenous OPTN on peroxisomes and prominent peroxisome clustering in HEK-293 cells (Fig. 10 F). This phenotype closely resembled that seen in control cells treated with Baf A1 (Fig. 10 G), suggesting that—under normal conditions—efficient autophagosome maturation and turnover prevent the stable accumulation of OPTN on peroxisomes. In contrast, such peroxisomal accumulation was not observed in HEK-293A cells lacking WIPI2, a protein required during the early stages of autophagy, although occasional peroxisomal OPTN signals remained detectable in both knockout and parental cells. As expected, no peroxisomal localization of OPTN was observed in the ATG8 hexa KO cell line, as in HeLa cells this phenotype depends on PEX14 overexpression (Fig. 8, A and B).
Due to technical limitations—including poor po-mKeima transduction efficiency and the high sensitivity of knockout cells to fluorescence-activated cell sorting—we were unable to quantify pexophagy by flow cytometry in these cell lines. Most knockout cells did not survive sorting, likely due to increased stress susceptibility. However, imaging-based assays revealed that expression of OPTN-GFP significantly reduced the number of peroxisomal puncta in ΔFIP200 HEK-293 cells but had no such effect in ΔWIPI2 HEK-293A cells (Fig. S4), further underscoring the cell line–specific nature of OPTN-mediated pexophagy. Notably, HEK-293A is a subclone of HEK-293 that carries a stably integrated E1 gene and naturally exhibits a more flattened morphology (Yuan et al., 2018).
Taken together, although our inability to perform FACS-based quantification limits our ability to conclusively distinguish between enhanced pexophagy and peroxisome clustering in these experiments, our findings support the conclusion that OPTN-mediated pexophagy is highly dependent on cellular context and involves features distinct from canonical autophagy.
Discussion
In this study, we identified PEX14 as a central mediator of OPTN-driven pexophagy. Domain mapping analyses revealed that OPTN variants lacking key autophagic motifs, specifically the ATG9A- and LC3-binding motifs, were still capable of initiating pexophagy when ectopically expressed. Notably, this induction was dependent on the NOA, a region known for its affinity for linear ubiquitin chains (Li et al., 2018) and its role in facilitating homotrimer formation (Gao et al., 2014).
Interestingly, the OPTNΔ474–479 variant, which contains an NOA incapable of binding polyubiquitin chains (Turturro et al., 2014), was still capable of triggering pexophagy. In contrast, the knockdown of endogenous OPTN inhibited pexophagy induction by the GFP-OPTN217–577 variant, suggesting that pexophagy induction by this truncated form likely occurs through oligomerization with endogenous OPTN.
GFP-Trap pull-down experiments further demonstrated that the NOA of OPTN, rather than its ubiquitin-binding activity, is essential for its interaction with the CC domain of PEX14. Notably, previous studies have shown that (1) the NOA can bind protein aggregates in a ubiquitin-independent manner (Korac et al., 2013), and (2) the CC domain of PEX14 is a critical determinant for homo-oligomerization (Fransen et al., 2002; Itoh and Fujiki, 2006). Our findings collectively indicate that OPTN-mediated pexophagy is promoted through interactions with PEX14, a relationship further supported by the experiments in which OPTN and PEX14 were co-overexpressed in HeLa cells. Interestingly, inactivating classical autophagy receptors in these cells did not affect peroxisome levels or interfere with Torin-1–induced pexophagy. This suggests that neither OPTN nor other known pexophagy receptors, such as SQSTM1 and NBR1 (Deosaran et al., 2013; Yamashita et al., 2014; Zhang et al., 2015; Riccio et al., 2019), are essential for basal pexophagy under the tested conditions. These observations also support the existence of noncanonical, ubiquitin-independent pexophagy pathways (Hara-Kuge and Fujiki, 2008; Jiang et al., 2015; Li et al., 2017; Wilhelm et al., 2022; Barone et al., 2023). They also raise the possibility that canonical autophagy receptors may regulate pexophagy in a context-dependent manner that remains to be fully elucidated. This interpretation is consistent with recent findings by Leytens et al. (2025), who report that while flux of specific autophagy receptors may be similarly regulated during basal pexophagy, cell type–specific variations become apparent under stress-induced conditions.
Considering the established roles of phosphorylation, ubiquitylation, and acetylation in initiating, regulating, and fine-tuning autophagy (McEwan and Dikic, 2011), a plausible explanation for the cell type–dependent variations in OPTN-mediated pexophagy involves cell type–specific posttranslational modifications. Notably, both OPTN and PEX14 are phosphorylated at multiple sites (see PTM sections in UniProt Q96CV9 and O75381, respectively). In particular, OPTN phosphorylation by TBK1 (e.g., at S177 and S473) (Richter et al., 2016), a top-ranked proximity partner of OPTN in our BioID experiments, has been linked to selective autophagy processes, including the clearance of cytosolic bacteria (Wild et al., 2011), mutant protein aggregates (Korac et al., 2013), and damaged mitochondria (Richter et al., 2016). Although both GFP-OPTN217–577 and OPTNΔ474–479-GFP can induce pexophagy, it remains unclear whether TBK1-mediated phosphorylation at S177 and S473 is essential for this process, especially considering that these variants may oligomerize with endogenous OPTN. While testing these possibilities was beyond the scope of the present study, they open interesting avenues for future research.
An important question is the role of OPTN-mediated pexophagy in normal physiology and disease. While much of the research has focused on autophagy receptors such as SQSTM1 and NBR1, the role of OPTN in pexophagy remains largely unexplored. Proteomics analysis of retinas from OPTN-E50K transgenic mice revealed that the KEGG peroxisome pathway was among the most significantly upregulated pathways in aged (18-mo-old) animals compared with control mice (Liu et al., 2021). This upregulation may result from the OPTN E50K mutation impairing the effective degradation of peroxisomes. In addition, increased expression of OPTN has been associated with elevated levels of pro-inflammatory cytokines (Vittitow and Borrás, 2002; Sudhakar et al., 2013). Its upregulation alongside pexophagy during prolonged fasting in catalase-deficient mouse livers (Dutta et al., 2021) suggests that physiological induction of OPTN may promote pexophagy to support metabolic and energetic demands. Consistent with this idea, IFNγ was recently shown to suppress peroxisome biogenesis, induce peroxisome aggregation, and enhance pexophagy in lung macrophages following viral infection (Wei et al., 2025). Moreover, another study has shown that OPTN is required for pexophagy in cells lacking Fas-associated factor family member 2 (Koyano et al., 2024). Collectively, these findings position OPTN as a potential key regulator of pexophagy in both normal and pathological conditions.
A limitation of this study is the reliance on OPTN overexpression to reliably detect and quantify pexophagy. Given that peroxisomes in cultured cells have a half-life of approximately 2 days (Huybrechts et al., 2009), while autophagosomes are rapidly turned over with an average lifespan of just 8 min (Papadopoulos and Pfeifer, 1986), it is unsurprising that OPTN is infrequently observed on peroxisomes under basal conditions. Although this limitation can be partially overcome by interfering with autophagosome maturation and turnover (e.g., by treating the cells with Baf A1 [Fig. 10 G] or using cells lacking FIP200 [Fig. 10 F]), it nonetheless poses a challenge for studying OPTN-mediated pexophagy in native settings. This challenge reflects longstanding difficulties in studying the well-established PINK–Parkin-mediated mitophagy pathway, particularly in HeLa cells, where the absence of endogenous Parkin has led many studies to rely on Parkin overexpression and artificial mitochondrial depolarization (Dhar et al., 2024). While these approaches have limitations, they are widely accepted and subsequent studies in cell types that express endogenous Parkin (e.g., fibroblasts and neurons) have demonstrated that mitophagy can occur without overexpression, supporting the physiological relevance of the pathway. These considerations underscore the broader challenges of investigating selective autophagy pathways, including PINK–Parkin-mediated mitophagy (McWilliams et al., 2018) and pexophagy, under physiological conditions.
In summary, this study represents a foundational step in understanding OPTN-mediated pexophagy. Further research into the upstream signaling pathways and molecular components involved in this process may enhance our knowledge of disorders associated with peroxisome dysfunction and OPTN dysregulation. Such insights may eventually contribute to the development of innovative therapeutic strategies for these conditions, presenting new opportunities for intervention in diseases linked to impaired selective autophagy.
Materials and methods
DNA manipulations and plasmids
The mammalian expression plasmids encoding mCherry-PTS1 (pMF1218) (Nordgren et al., 2012), po-mKeima (pMF2005) (Li et al., 2023), non-tagged HsPEX14 (Will et al., 1999), HsPEX14-GFP (pMF120) (Fransen et al., 2004), GFP-HsPEX14 (pMF118) (Fransen et al., 2004), GFP-LC3 (Nordgren et al., 2012), GFPNb-PM (pMF1968) (Walton et al., 2017), or HsPMP34-GFP (Wylin et al., 1998) have been described elsewhere. The Flp recombinase expression vector (pOG44; V600520; Thermo Fisher Scientific), the Flp-In inducible expression vector (pcDNA5/FRT/TO; V652020; Thermo Fisher Scientific, the lentiviral GFP expression vector (pLenti CMV GFP Puro; plasmid 17448; Addgene), and the plasmids encoding GFP (6085-1; Clontech), the pOPINE GFP nanobody (plasmid 49172; Addgene [Kubala et al., 2010]), non-tagged OPTN1–577 (SC319257; OriGene), OPTN1–577-GFP (plasmid 27052; Addgene [Park et al., 2006]), GFP-OPTN1–209 (plasmid 68839; Addgene [Turturro et al., 2014]), GFP-OPTN217–577 (plasmid 68841; Addgene [Turturro et al., 2014]), or OPTND474N-GFP (plasmid 68847; Addgene [Turturro et al., 2014]) were commercially obtained. The miniTurbo BirA template was kindly provided by Dr. P. Kim (University of Toronto, Toronto, Canada).
The following plasmids, annotated as “name (encoded protein; cloning vector; cloning procedure; template; forward primer [5’→3′]; reverse primer [5’→3′]; restriction enzymes),” were specifically generated for this study: pDI1 (OPTNΔ545–577-GFP; 27052; Addgene ; Q5 Site-Directed Mutagenesis; 27052; Addgene; 5′-GACTGGCTGCATCATTCGGGATCCAATGG-3′; 5′-TGATGCAGCCAGTCCCTGTCCTCAGC-3′; not applicable [NA]), pDI2 (HsOPTNΔ474–479-GFP; 27052; Addgene; Q5 Site-Directed Mutagenesis; 27052; Addgene; 5′-ACTGTTCTGCAGCGAGAGAGAAAATTCATGAGG-3′; 5′-TCGCTGCAGAACAGTAAACTTCCATCTGAGCC-3′; NA), pHL30 (miniTurbo-HsOPTN1–577-GFP; 27052; Addgene; cloning of digested PCR product; miniTurbo-BirA; 5′-CGAGCGCTAGCACCATGGCGATCCCGC-3′; 5′-CGAGGGAATTCGCGACCCACCCGACCCGCCCTTTTCGGCAGACCGCAG-3′; NheI/EcoRI), pHL31 (HsOPTN1–577-GFP; pcDNA5/FRT/TO vector; cloning of digested PCR product; 27052; Addgene; 5′-CGAGGGTACCACCATGGCTATGTCCCATCAAC-3′; 5′-CGAGGCGGCCGCTTACTTGTACAGCTCGTCCATG-3′; KpnI/NotI), pHL32 (HsOPTN1–577-GFP; pLenti CMV GFP Puro; cloning of digested of PCR product; 27052; Addgene; 5′-GACACCGACTCTAGAGGATCCACCATGGCTATGTCCCATCAA-3′; 5′-ATGGTGGCGACCGGTGGATCCCGAATGATGCAATCCATCACG-3′; BamHI), pHL34 (po-mKeima; pLenti CMV GFP Puro; cloning of digested PCR product; pMF2005; 5′-CGAGGGGATCCACCATGGTGAGCGTGATCG-3′; 5′-CGAGGGTCGACTTACAGCTTGCTCTTGCCCAG-3′; BamHI/SalI), pHL36 (HsOPTN295–360-GFP; pEGFP-N1; cloning of digested PCR product; 27052; Addgene; 5′-GAGAAAGGCCCGGAGACTTTAGAGCTACAAGTGGAAAGCATG-3′; 5′-CCACCTGTAGCTCTAAAGTCTCCGGGCCTTTCT-3′; BglII/PstI), pHL37 (HsOPTN422–455-GFP; pEGFP-N1; cloning of digested PCR product; 27052; Addgene; 5′-GAAAAAGTGGACAGGGCAGAGGACCTGGAAACCATG-3′; 5′-CATGGTTTCCAGGTCCTCTGCCCTGTCCACTTTTTC-3′; BglII/PstI), pHL38 (HsOPTNΔ454–520-GFP; pEGFP-N1; cloning of digested PCR product; 27052; Addgene; 5′-AAGCAAACCATTGCCAAGCATGGGGCGAGAACAAGTGAC-3′; 5′-CCTGGCAATGGTTTGCTTCATTTCATCC-3′; BglII/PstI), pMF235 (HsPEX1465–377-GFP; pEGFP-N1; cloning of digested PCR product; pMF120; 5′-GGGAAGATCTATGGCCTTCCAGCAGTCGGG-3′; 5′-AATCTGCAGGTCCCGCTCACTCTCGTT-3′; BglII/PstI), pMF415 (HsPEX141–313-GFP; pEGFP-N1; cloning of digested PCR product; pMF120; 5′-GGGAAGATCTATGGCGTCCTCGGAGCAG-3′; 5′-GGACTGCAGCACCTCCATCCGCACCTG-3′; BglII/PstI), pMF663 (HsPEX14Δ139–199-GFP; pEGFP-N1; cloning of digested fusion PCR product; pMF120; primer set 1: 5′-GGGAAGATCTATGGCGTCCTCGGAGCAG-3′ and 5′-GATCCAGTTGGTGCCGCCCAGGATGAG-3′; primer set 2: 5′-ATCCTGGGCGGCACCAACTGGATCCTGGAG-3′ and 5′-AATCTGCAGGTCCCGCTCACTCTCGT-3′; BglII/PstI), pMF682 (HsPEX14Δ110–126-GFP; pEGFP-N1; cloning of digested fusion PCR product; pMF120; primer set 1: 5′-GGGAAGATCTATGGCGTCCTCGGAGCAG-3′ and 5′-GTATTTCTTGTAGTAATCTCGCCATCGGGA-3′; primer set 2: 5′-TGGCGAGATTACTACAAGAAATACCTGCTC-3′ and 5′-AATCTGCAGGTCCCGCTCACTCTCGTT-3′; BglII/PstI), pOI9 (mCherry; pEGFP-C2; cloning of digested PCR product; pMF1218; 5′-CCCGGCTAGCACCATGGTCTCTAAGGGC-3′; 5′-CCCCCTGTACACTTTGTACAGTTCATCCATCC-3′; NheI/BsrGI), and pMF1094 (mCherry-HsPEX14; pOI9; cloning of the BsrGI/PstI-restricted insert of pMF118). For the construction of pHL34, pHL36, pHL37, and pHL38, the PCR products were treated with DpnI and then inserted into the cloning vector using the NEBuilder HiFi DNA Assembly cloning kit. The primers were obtained from Integrated DNA Technologies. The TOP10F′ Escherichia coli strain (C3030-06; Thermo Fisher Scientific) was routinely used as a cloning and plasmid amplification host. However, upon using the NEBuilder HiFi DNA Assembly Master Mix (M5520AVIAL; New England Biolabs) or the Q5 Site-Directed Mutagenesis Kit (E0554; New England Biolabs), the DpnI (ER1707; Thermo Fisher Scientific)-treated mixtures, free of parental plasmid, were transformed in DH5α cells (18265017; Thermo Fisher Scientific). All plasmids were validated by DNA sequencing (LGC Genomics).
Cell lines and culture conditions
The following cell lines were used for this study: human embryonic kidney cells (HEK-293, ECACC 85120602; CVCL_0045); Flp-in T-REx 293 cells (R78007; CVCL_U427; Thermo Fisher Scientific); lenti-GFP Flp-In T-REx 293 cells (this study); lenti-OPTN1–577-GFP Flp-In T-REx 293 cells (this study); GFP Flp-In T-REx 293 cells (this study); OPTN1–577-GFP Flp-In T-REx 293 cells (this study); lenti-po-mKeima Flp-In-T-REx 293 cells (Li et al., 2023); HEK-293 cells lacking PEX3 (Jansen et al., 2024); HEK-293 cells lacking PEX5 (Costa et al., 2024); HEK-293 cells lacking PEX14; HEK-293 cells lacking FIP200 (Eickhorst et al., 2024), HEK-293A cells (CVCL_6910) lacking WIPI2 (Gubas et al., 2024); human cervical cancer cells (HeLa, ECACC 93021013; CVCL_0030); po-mKeima HeLa cells (Li et al., 2023); HeLa cells lacking NBR1 and SQSTM1 (DKO) (Lazarou et al., 2015); HeLa cells lacking NDP52, OPTN, TAX1BP1, NBR1, and SQSTM1 (pentaKO) (Lazarou et al., 2015); po-mKeima pentaKO HeLa cells (this study); HeLa cells lacking LC3A, LC3B, LC3C, GABARAP, GABARAPL1, and GABARAPL2 (designated ATG8 hexa KO) HeLa cell line (Nguyen et al., 2016); human colorectal carcinoma cells (HCT116, ECACC 91091005; CVCL_0291); po-mKeima HCT116 cells (this study); and SV40 large T-antigen–transformed MFF-deficient human fibroblasts (Passmore et al., 2020). The PEX14-deficient HEK-293 cell line was generated using CRISPR-Cas9 genome editing, as previously described (Ran et al., 2013). The guide RNA sequence (5′-CTGTAGAAACTTCACTGCCG-3′) was cloned into the pSpCas9(BB)-2A-GFP vector (plasmid ID: 48138; Addgene) to introduce the knockout. After 6–8 wk, a clonal cell line harboring a homozygous deletion (95del/95del), confirmed by Sanger sequence analysis and immunoblot analysis, was selected for downstream analyses. The novel Flp-In T-REx 293, lenti-Flp-In T-REx 293, and po-mKeima–expressing cell lines were generated as detailed elsewhere (Li et al., 2023; Lismont et al., 2019; Campeau et al., 2009; Bhalla et al., 2024). HEK-293, Flp-in T-REx 293, and HeLa cells were cultured in DMEM medium (31966-047; Gibco) supplemented with 10% (vol/vol) FBS (S181B; Biowest) and 0.2% (vol/vol) MycoZap (VZA-2012; Lonza) in a humidified atmosphere of 5% CO2 at 37°C. HCT116 cells were cultured similarly, using DMEM/F12 medium (21041-033; Gibco) and the same supplements plus 2 mM UltraGlutamine I (BE17-605E/U1; Lonza).
The parental HEK-293, HeLa, and HCT116 cell lines were commercially obtained. The identity of the genetically engineered derivative cell lines was confirmed by Sanger sequencing and/or immunoblot analysis. All cell lines tested negative for mycoplasma contamination.
Cell transfection and treatment procedures
Flp-In T-REx 293 cells were either electroporated with the Neon Transfection system (Thermo Fisher Scientific) (Li et al., 2023) for fluorescence microscopy imaging and flow cytometry analyses or transfected using the jetPRIME reagent (114-01; Polyplus) for IP experiments. HCT116 and HeLa cells were transfected with the Lipofectamine 3000 reagent (L3000015; Invitrogen). To prevent autophagosome-lysosome fusion, the cells were pretreated with Baf A1 (11038; Cayman Chemical) as indicated. The same volume of DMSO (02196055; MP Biomedicals) was included as a vehicle control. To induce autophagy, the cells were treated overnight with 250 nM Torin-1 (4247; Tocris) or an equivalent volume of vehicle control (DMSO). To image mitochondria, the endoplasmic reticulum, lysosomes, and nuclei, the cells were incubated with MitoTracker Red CM-H2Xros (M7513; 1:2,000; Thermo Fisher Scientific), ER-Tracker Blue-White DPX (E12353; 1:2,000; Thermo Fisher Scientific), LysoTracker Red DND-99 (L7528; 1:5,000; Thermo Fisher Scientific), and 5 μg/ml Hoechst 33258 (14530; Sigma-Aldrich), respectively. To downregulate OPTN expression, the cells underwent transfection (using Lipofectamine 3000) twice with the OPTN DsiRNA hs.Ri.OPTN.13.10 (sense strand: 5′-AAGCUAAAUAAUCAAGC-3′; antisense strand: 5′-CUUUCAUGGCUUGAUUAU-3′; final concentration: 50 nM), with a 48-h interval between each transfection. A nontargeting DsiRNA (51-01-14-03; Integrated DNA Technologies), which does not recognize any human sequences, was used as a control.
Antibodies and streptavidin conjugates
For IF or IB, the following primary antibodies were used: rabbit anti-ABCD3 (P0497; IB, 1:500; RRID:AB_477306; Sigma-Aldrich), rabbit anti-ABCD3 (ab3421; IF, 1/100; RRID:AB_2219901; Abcam), mouse anti-GAPDH (G8795; IB, 1:2,000; RRID:AB_1078991; Sigma-Aldrich), rabbit anti-GFP (IB, 1:50,000) (Fransen et al., 2001), mouse anti-HSPA9 (S52A-42; IF, 1:200; StressMarq), rabbit anti-LC3B (2775S; IB, 1:1,000; Cell Signaling Technology); rabbit anti-NDP52 (ab68588; IB, 1:2,000; RRID:AB_1640255; Abcam), mouse anti-NBR1 (ab55474; IB, 1:2,000; RRID:AB_2149404; Abcam), rabbit anti-OPTN (ab23666; IF, 1:50; IB, 1:1,000; RRID:AB_447598; Abcam), rabbit anti-PEX10 (stj119242; IB, 1:2,000; St John’s Laboratory), rabbit anti-PEX13 (IB: 1:1,000) (Fransen et al., 2001), rabbit anti-PEX14 (IB, 1:1,000) (Amery et al., 2000), mouse anti-PEX14 (IF, 1:400 or 1:1,000) (Van Veldhoven et al., 2020), rabbit anti-SQSTM1 (ab109012; IB, 1:20,000; RRID:AB_2810880; Abcam), rabbit anti-TAX1BP1 (14424-1-AP; IB: 1:2,000; RRID:AB_219892; Proteintech), and rabbit anti-vinculin (4605; IB, 1:5,000; Cell Signaling Technology). The secondary antibodies for IF were conjugated to Alexa Fluor 488 (A11017; 1:2,000; RRID:AB_2534084; Invitrogen), Texas Red (401355; 1:200; RRID:AB_10681556; Calbiochem), CF 350 (SAB4600223; 1:500; Sigma-Aldrich), or Alexa Fluor 568 (A11031; 1:500; RRID:AB_144696; Invitrogen). Streptavidin-horseradish peroxidase (IB, 1:3,000) was from Sigma-Aldrich (RABHRP3).
IB and densitometric analysis
Antigen–antibody and biotin–streptavidin complexes were detected by using the Amersham ECL western blotting Detection Reagent (RPN2235; Cytiva) in combination with the ImageQuant LAS4000 system (GE Healthcare). Images were further processed and quantified with AlphaView Software (ProteinSample) or ImageJ software (Schneider et al., 2012).
IF microscopy, 3D reconstructions, structured illumination microscopy, and image processing
Fluorescence microscopy was conducted essentially as previously described (Ramazani et al., 2021). Briefly, fluorescence was assessed using a motorized inverted IX-81 microscope (Olympus) controlled by cellSens Dimension software (version 2). The microscope was equipped with (1) a temperature, humidity, and CO2-controlled incubation chamber; (2) a CoolLED pE-4000 illumination system; (3) a 100× Super Apochromat oil immersion objective (1.45 NA); (4) the filter cubes F440 (excitation: 422–432 nm; dichroic mirror: 600 nm; emission: 610 long pass), F482 (excitation: 470–495 nm; dichroic mirror: 505 nm; emission: 510–550 nm), and F562 (excitation: 545–580 nm; dichroic mirror: 600 nm; emission: 610 nm long pass); and (5) a DP73 high-performance Peltier-cooled digital color camera (Olympus Belgium). For live-cell imaging, cells were seeded and imaged in DMEM medium (31966-047; Gibco) at 37°C in FluoroDish cell culture dishes (FD35; World Precision Instruments), either pre-coated with 25 μg/ml polyethyleneimine (195444; MP Biomedicals) for HEK-293 cells or left uncoated for other cell types. For IF microscopy, cells were seeded onto (polyethyleneimine-coated) glass coverslips, then fixed either with ice-cold methanol (10141720; Thermo Fisher Scientific) or, in the case of cells expressing mCherry-PTS1, with 4% (wt/vol) paraformaldehyde (158127; Sigma-Aldrich). Subsequent processing was performed according to methods outlined elsewhere (Huybrechts et al., 2009). Nuclei were counterstained with DAPI (10236276001; Roche). Image acquisition and analysis were performed using cellSens Dimension software (version 2.1) (Olympus). Nanobody-based plasma membrane translocation assays were carried out according to established procedures (Walton et al., 2017).
3D images were acquired in Airyscan mode on a Zeiss LSM 880 microscope using a 63× (1.4 NA) oil-immersion objective. The 488- and 561-nm laser lines (both at 1.5% power) were used to excite Alexa Fluor 488 and Alexa Fluor 568, respectively, with a pixel dwell time of 2.05 µs. Images were collected using the Airyscan detector, with the point spread function oversampled using 30 nm * 30 nm pixels. Z-stacks were acquired at 0.3-µm intervals to capture the entire cell layer. All image stacks were processed using default Airyscan settings and saved as single Airyscan resolved image stacks. Orthogonal views were generated in Fiji (ImageJ, NIH image).
Structured illumination microscopy was performed on cells cultured and imaged in DMEM medium (31966-047; Gibco) at 37°C in FluoroDish cell culture dishes (FD35; World Precision Instruments). For image acquisition, a Nikon Ti2 N-structured illumination (SIM) S microscope (Nikon Instruments) equipped with an ORCA-Flash4.0 sCMOS camera (C13440; Hamamatsu) and a Nikon SR Apo TIRF 100× objective lens (NA 1.49) was controlled by Nikon NIS-Elements imaging software (version 5.21.03). Multicolored images were acquired in 3D SIM mode (with three angles and five phases) with a Z-stack (0.100 µm step size) at room temperature. The fluorescence of GFP, excited at 488 nm, was captured using a 525/30 bandpass filter, and the fluorescence of mCherry, excited at 561 nm, was detected with a 595/30 bandpass filter. The images were reconstructed and analyzed using arivis Vision4D (version 3.3) and Nikon NIS-Elements AR 5.40 software.
The brightness and contrast of fluorescence images were adjusted uniformly to enhance visualization of relevant structures. Images from conditions designated for comparison were processed concurrently using identical settings to ensure consistency and avoid bias.
Flow cytometry analysis
The po-mKeima–expressing cells were washed with DPBS and dislodged from the plate by trypsinization. Next, the cells were pelleted (300 g, 1 min), resuspended in culture medium, and analyzed through FACSymphony A1 flow cytometry (BD Biosciences) by using 405- and 561-nm lasers in combination with a 600–620-nm emission filter (for mKeima) and a 488-nm laser with a 505–560-nm emission filter (for GFP). For each sample, 100,000 events were collected and analyzed using BD FACSDiva v8.0.1 software (BD Biosciences).
MiniTurbo proximity labeling, affinity purification, and sample preparation for LC-MS analysis
Cells were seeded in 15-cm dishes and transfected with 6 µg of a plasmid encoding miniTurbo-OPTN-GFP (pHL30). After 48 h, the cells were pretreated with 200 nM of Baf A1 for 2 h and subsequently incubated with or without 50 µM D-biotin (B4501; Sigma-Aldrich) for 30 min. Next, the cells were rinsed with ice-cold PBS (BE17-512F; Lonza) and lysed on ice for 20 min using lysis buffer (50 mM Tris-HCl [pH 7.5], 150 mM NaCl, 1% [wt/vol] Triton X-100, and 1 mM EDTA) supplemented with protease (P2714; AppliChem, A0999; Sigma-Aldrich) and phosphatase (P5726; Sigma-Aldrich) inhibitor cocktails. Subsequently, the lysates were sonicated (UCD-200; Diagenode Bioruptor) in three 10-s cycles at high intensity and then cleared by centrifugation at 10,000 × g for 10 min. A small portion of the supernatant was taken for biotin IB validation, and the remaining supernatant was further incubated with 25 μl of Streptavidin Sepharose beads (90100484; Cytiva) overnight at 4°C. After discarding the supernatant, the beads were washed three times with 200 μl of lysis buffer and three times with 200 μl of ammonium bicarbonate (50 mM, pH 7.8). Thereafter, the beads were resuspended in 200 μl of ammonium bicarbonate solution, and 250 ng of mass spectrometry grade trypsin (V528A; Promega) was added. The samples were digested for 14 h at 37°C in an Eppendorf Thermomixer C (speed: 750 rpm), and a 2-μl sample was taken for tryptic digestion quality control using a Dionex UltiMate 3000 RSLC Nano System (Thermo Fisher Scientific). The reduction and carbamidomethylation of disulfide bridges in the supernatant were performed by treating the samples with 10 mM dithiothreitol (M109; VWR) for 30 min at 56°C, followed by the addition of 30 mM iodoacetamide (I1149; Sigma-Aldrich) for an additional 30 min at room temperature. Next, the carbamidomethylated samples were acidified using 10% trifluoroacetic acid (202341; Biosolve) and subsequently subjected to desalting using Poros Oligo R3 reversed-phase resin (1133903; Thermo Fisher Scientific). The bound peptides were washed twice with 0.1% formic acid (FA; 28905; Thermo Fisher Scientific) in water and eluted with 100 μl of 60% (vol/vol) acetonitrile (ACN; 34851; Sigma-Aldrich) in water containing 0.1% FA. Finally, the eluates were dried under vacuum, and the peptides were resolubilized in 10 μl of 0.1% FA.
LC-MS analysis
Digested samples (10% of total volume) were injected into an UltiMate 3000 RSLCnano System (Dionex) coupled to an Orbitrap Lumos Tribrid Mass Spectrometer (Thermo Fisher Scientific). After initial loading, peptides were concentrated on a 75-μm × 2-cm C18 pre-column using 0.1% (vol/vol) trifluoroacetic acid at a flow rate of 20 μl/min. Sample separation was accomplished on a reversed-phase column (Acclaim C18 PepMap 100; pore size: 75 µm; length: 50 cm) at 60°C using a binary gradient (A: 0.1% FA; B: 84% ACN with 0.1% FA) at a flow rate of 250 nl/min: 3% solvent B for 5 min, a linear increase of solvent B to 32% for 95 min followed by washing with 95% solvent B for 3 min, and a linear decrease of solvent B to 3% for 1 min. Peptides were ionized by using a nanospray ESI source. MS survey scans were acquired on the Orbitrap Lumos Tribrid by using the following settings: The mass spectrometer was operated in data-dependent acquisition mode with full MS scans from 350 to 1,500 m/z at a resolution of 120,000 at 200 m/z (Orbitrap) using the polysiloxane ion at 445.12,002 m/z as lock mass. The automatic gain control was set to 4E5, the maximum injection time to 100 ms, and the RF amplitude to 40%. The top intense ions (ion intensity ≥ 5E3, charge state = 2–7) were selected within a 1.2 m/z mass isolation window for fragmentation at a normalized collision energy of 32% in each cycle of the 3-s acquisition analysis, following each survey scan. The dynamic exclusion time was set to 60 s. Fragment ions were acquired in the ion trap.
Data analysis of miniTurbo proximity labeling
Raw data were searched against the UniProt human database (June 2023; 20,409 target sequences, including OPTN-GFP) using Sequest HT on Proteome Discoverer v2.5. Precursor mass tolerance was limited to 20 ppm and fragment mass tolerance to 0.5 Da. Cleavage specificity was set to fully tryptic, allowing for a maximum of two missed cleavages. Carbamidomethylation of cysteines (+57.0214 Da) was defined as a fixed modification and oxidation of methionine (+15.9949 Da) as a variable modification for all searches. The results were evaluated with Percolator for false discovery rate (FDR) estimation, and data were filtered at ≤1% FDR on the PSM and peptide level and filtered “master” proteins at the protein level (Käll et al., 2007). Unique peptides (except modified peptides) were taken for label-free quantification. Next, the sum of the top three peptide intensities was calculated to determine the protein intensities. Protein intensities were normalized to total peptide amount. P values between the sample groups (four biological replicates, with or without D-biotin treatment) were determined by a two-sided t test with FDR correction. Common contaminating proteins were removed from the hit lists. The significance cutoffs employed were unique peptides ≥2, adjusted P value ≤0.05, and log2(ratio biotin/no biotin) ≥1. Label-free quantification data were plotted and visualized by GraphPad Prism 9.0.0.
Immunoprecipitation using GFP-Trap
HEK-293 cells were cultured in 10-cm cell culture dishes and transfected with 6 μg of plasmid. 2 days later, the cells were cultured for 2 h in the presence of 200 nM Baf A1. After rinsing with ice-cold PBS, cleared supernatant fractions were prepared similarly to the miniTurbo proximity labeling samples and subjected to a GFP-Trap assay (Claes and Bollen, 2023). Briefly, the supernatants were divided into two portions for input detection and GFP-Trap. The input fractions were supplemented with 3x SDS-PAGE sample buffer for IB analysis and boiled at 100°C for 10 min. The supernatants for GFP-Trap immunoprecipitation were precleared with 30 μl of homemade BSA beads for 30 min at 4°C, followed by incubation with 25 μl of homemade GFP-Trap beads for 2 h at 4°C (the BSA- and pOpine-GFP nanobody-conjugated beads were prepared as described elsewhere [Rothbauer et al., 2008]). Next, the beads were washed 6–8 times with high saline lysis buffer (150 mM Tris-HCl [pH 7.5], 500 mM NaCl, 1% [wt/vol] Triton X-100, and 1 mM EDTA), boiled in 3x SDS-PAGE sample buffer, and after a quick spin, the supernatants were subjected to IB (Li et al., 2023).
Statistical analysis
Statistical analysis involved conducting one-way ANOVA followed by Tukey’s post hoc test for multiple comparisons. Student’s unpaired two-tailed t test was used to compare two groups. Data distribution was assumed to be normal, although this was not formally tested. All statistical analyses were conducted using GraphPad Prism (version 9.0.0 for Windows 64-bit, GraphPad Software, San Diego, CA, USA). Results with a P value of <0.05 were considered statistically significant.
Varia
The data used to generate Fig. 3 A, the schematic depicting the distinct domains and major interactions of OPTN, were gathered from multiple sources (Weil et al., 2018; Zhao et al., 2023; Kachaner et al., 2012; Swarup and Sayyad, 2018). The manuscript’s language was refined with the assistance of ChatGPT.
Online supplemental material
The following supporting information is available: Fig. S1 shows that the OPTN-mediated pexophagy is cell type–dependent and correlates with endogenous OPTN and PEX14 levels. Fig. S2 shows the impact of OPTN-GFP expression on organelle morphology in HEK-293 cells. Fig. S3 shows the analysis of the OPTN–PEX14 interaction using GFP-trapping. Fig. S4 shows the effect of FIP200 or WIPI2 deficiency on peroxisome clustering and number upon expression of GFP or OPTN-GFP. Table S1 shows the normalized mass spectrometry results of miniTurbo-labeled samples.
Data availability
The raw data from the LC-MS runs can be accessed via ProteomeXchange (PRIDE database) with the identifier PXD053489 (https://www.ebi.ac.uk/pride/archive/projects/PXD053489). The data used to generate Fig. 3 B are provided in Table S1. All other data supporting the findings of this study are provided within the article or its supplementary materials.
Institutional review board statement
All experiments were conducted using cell lines and were approved by the Ethics Committee Research UZ/KU Leuven (protocol code: S63808 [AMAND-Id: 0005]). As no animals were involved, the ARRIVE guidelines do not apply to this manuscript.
Acknowledgments
The authors gratefully acknowledge the following entities and individuals for their invaluable support: the VIB Bio Imaging (KU Leuven) and Dr. T. Voet for their support and assistance with super-resolution imaging; the Cell & Tissue Imaging Cluster (KU Leuven) for the 3D imaging; the FACS Core facilities (KU Leuven) for flow cytometry analysis; the John Creemers lab (KU Leuven) for lentiviral packaging; Dr. R. Youle (National Institutes of Health, Bethesda, MD, USA) for the pentaKO HeLa cell line; Dr. C. Kraft (University of Freiburg, Germany) for the ΔFIP200 HEK-293 cell line; Dr. S. Tooze (Francis Crick Institute, London, UK) for the ΔWIPI2 HEK-293A cell line; Dr. M Lazarou (Monash University, Melbourne, Australia) for the ATG8 hexa KO HeLa cell line; Dr. M. Bollen (KU Leuven, Belgium) for the HCT116 cell line; Ms. S. Lemaire and Mr. X.Y. Cao (KU Leuven, Belgium) for valuable advice regarding the GFP-Trap assay; Dr. R.J. Wanders (University of Amsterdam, The Netherlands) for the plasmid encoding non-tagged HsPEX14; Dr. P. Kim (University of Toronto, Canada) for the miniTurbo BirA template; and Dr. B. Yue (University of Illinois, Chicago, IL, USA) for the plasmids encoding OPTN1–577-GFP, OPTN1–209-GFP, OPTN211–577-GFP, or OPTND474N-GFP.
This work was supported by the Research Foundation-Flanders (G091819N, 1213623N, G092915, I001818N, and 1S58121N), Hercules Foundation (AKUL/15/37_GOH1816N), the China Scholarship Council (201906790005), KU Leuven (C14/18/088), and the Ministry of Higher Education of the Arab Republic of Egypt.
Author contributions: Hongli Li: conceptualization, data curation, formal analysis, funding acquisition, investigation, methodology, project administration, resources, software, validation, visualization, writing—original draft, and writing—review and editing. Suyuan Chen: investigation. Celien Lismont: formal analysis, supervision, and writing—review and editing. Bram Vandewinkel: investigation and writing—review and editing. Mohamed A.F. Hussein: formal analysis and writing—review and editing. Claudio F. Costa: formal analysis. Dorien Imberechts: methodology. Yiyang Liu: methodology. Jorge E. Azevedo: formal analysis and writing—review and editing. Wim Vandenberghe: resources and writing—review and editing. Steven Verhelst: supervision and writing—review and editing. Hans R. Waterham: resources and writing—review and editing. Pieter Vanden Berghe: methodology, resources, and visualization. Myriam Baes: project administration, supervision, and writing—review and editing. Marc Fransen: conceptualization, data curation, formal analysis, funding acquisition, investigation, methodology, project administration, resources, supervision, validation, visualization, and writing—original draft, review, and editing.