
Skip Nav Destination
Close Modal


1-20 of 99
Follow your search
Access your saved searches in your account
Would you like to receive an alert when new items match your search?
1
Journal Articles
In Special Collection:
JGP Reviews: Ion Channel Structure and Function
Journal:
Journal of General Physiology
J Gen Physiol (2019) 151 (12): 1347–1356.
Published: 15 October 2019
in Structural and functional insights into transmembrane AMPA receptor regulatory protein complexes
> Journal of General Physiology
Published: 15 October 2019
Figure 1. Functional effects of auxiliary subunits. (A–C) Representative whole-cell currents recorded at −60 mV membrane potential from HEK cells expressing GluA2 (A), GluA2-STZ (B), or GluA2-GSG1L (C) in response to 1-s applications of the full More about this image found in Functional effects of auxiliary subunits. (A–C) Representative whole-cell ...
in Structural and functional insights into transmembrane AMPA receptor regulatory protein complexes
> Journal of General Physiology
Published: 15 October 2019
Figure 2. Topology of AMPARs. (A) Structure of a homotetrameric AMPAR composed of GluA2 subunits (PDB accession no. 5WEO ) in surface representation viewed parallel to the membrane. Synaptic and cytosolic spaces around the membrane (gray bars) More about this image found in Topology of AMPARs. (A) Structure of a homotetrameric AMPAR composed of Gl...
in Structural and functional insights into transmembrane AMPA receptor regulatory protein complexes
> Journal of General Physiology
Published: 15 October 2019
Figure 3. Architecture of an AMPAR–TARP complex. (A and B) Surface representation of an AMPAR (GluA2 homotetramer) bound to four STZ molecules viewed parallel to the membrane (PDB accession no. 5WEO ). Each GluA2 subunit is colored individually More about this image found in Architecture of an AMPAR–TARP complex. (A and B) Surface representation of...
in Structural and functional insights into transmembrane AMPA receptor regulatory protein complexes
> Journal of General Physiology
Published: 15 October 2019
Figure 4. Structures of TARPs and GSG1L. (A-C) Structures of STZ or TARPγ2 (PDB accession no. 5WEO ), TARPγ8 (PDB accession no. 6QKC ), and GSG1L (PDB accession no. 5VHY ) shown in ribbon representation and rainbow colored from N-terminus More about this image found in Structures of TARPs and GSG1L. (A-C) Structures of STZ or TARPγ2 (PDB acce...
in Structural and functional insights into transmembrane AMPA receptor regulatory protein complexes
> Journal of General Physiology
Published: 15 October 2019
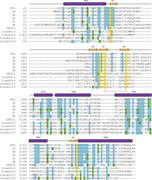
Figure 5. Sequence alignment for claudins and claudin-fold AMPAR auxiliary subunits. The secondary structure of STZ is shown above the sequence alignment as cylinders (α-helices), arrows (β-strands), or lines (loops). Completely conserved More about this image found in Sequence alignment for claudins and claudin-fold AMPAR auxiliary subunits. ...
in Structural and functional insights into transmembrane AMPA receptor regulatory protein complexes
> Journal of General Physiology
Published: 15 October 2019
Figure 6. Interfaces in an AMPAR–STZ complex. (A) Structure of an AMPAR (GluA2 homotetramer) bound to four STZ molecules in ribbon representation viewed parallel to the membrane (PDB accession no. 5WEO ). The ATD has been excluded. Each GluA2 More about this image found in Interfaces in an AMPAR–STZ complex. (A) Structure of an AMPAR (GluA2 homot...
Journal Articles
In Special Collection:
Ion channel modulation
, JGP Reviews: Ion Channel Structure and Function
, Ion Channels & Transporters in Immunity
Journal:
Journal of General Physiology
J Gen Physiol (2019) 151 (2): 100–117.
Published: 16 January 2019
in A 30-year journey from volume-regulated anion currents to molecular structure of the LRRC8 channel
> Journal of General Physiology
Published: 16 January 2019
Figure 1. Relationship between VRAC current activation and cell swelling in a N1E115 neuroblastoma cell. Relative cell volume is measured simultaneously with whole-cell current allowing a direct correlation between VRAC activation and cell More about this image found in Relationship between VRAC current activation and cell swelling in a N1E115 ...
in A 30-year journey from volume-regulated anion currents to molecular structure of the LRRC8 channel
> Journal of General Physiology
Published: 16 January 2019
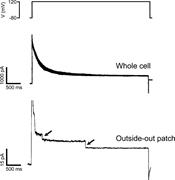
Figure 2. Examples of VRAC single-channel currents in a C6 glioma cell. Top panel shows membrane voltage. Middle panel shows voltage-dependent inactivation of whole-cell current induced by stepping membrane voltage from −80 to 120 mV. Bottom More about this image found in Examples of VRAC single-channel currents in a C6 glioma cell. Top panel sh...
in A 30-year journey from volume-regulated anion currents to molecular structure of the LRRC8 channel
> Journal of General Physiology
Published: 16 January 2019
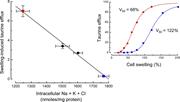
Figure 3. Effect of intracellular ionic strength on VRAC activation in CHO cells. (A) Reduction of intracellular ionic strength increases the rate of swelling-induced current activation. At an ionic strength of 0.04, VRAC activates spontaneously More about this image found in Effect of intracellular ionic strength on VRAC activation in CHO cells. (A)...
in A 30-year journey from volume-regulated anion currents to molecular structure of the LRRC8 channel
> Journal of General Physiology
Published: 16 January 2019
Figure 4. Effect of intracellular inorganic ion levels on swelling-induced 3H-taurine efflux in C6 glioma cells. Left panel shows that swelling-induced taurine efflux is an inverse function of the combined intracellular levels of Na+, K+, and Cl More about this image found in Effect of intracellular inorganic ion levels on swelling-induced 3...
in A 30-year journey from volume-regulated anion currents to molecular structure of the LRRC8 channel
> Journal of General Physiology
Published: 16 January 2019
Figure 5. Regulation of RVD mechanisms by intracellular ionic strength. Large fluctuations in cytoplasmic ionic strength can disrupt protein structure and function and a host of diverse cellular processes. The differential sensitivity of VRAC More about this image found in Regulation of RVD mechanisms by intracellular ionic strength. Large fluctu...
in A 30-year journey from volume-regulated anion currents to molecular structure of the LRRC8 channel
> Journal of General Physiology
Published: 16 January 2019
Figure 6. Effect of intracellular ATP on VRAC activation in N1E115 neuroblastoma cells. (A) Rate of current activation is a saturable function of intracellular ATP concentration. Cells were swollen by a 100-mOsm reduction in bath osmolality. More about this image found in Effect of intracellular ATP on VRAC activation in N1E115 neuroblastoma cell...
in A 30-year journey from volume-regulated anion currents to molecular structure of the LRRC8 channel
> Journal of General Physiology
Published: 16 January 2019
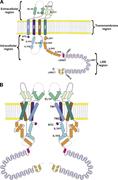
Figure 7. Two-dimensional structure of the LRRC8A channel. (A) Structural components of the LRRC8A protein. The protein comprises four regions, extracellular, transmembrane, intracellular, and LRR regions. β, β strand; EL, extracellular loop; H, More about this image found in Two-dimensional structure of the LRRC8A channel. (A) Structural components...
in A 30-year journey from volume-regulated anion currents to molecular structure of the LRRC8 channel
> Journal of General Physiology
Published: 16 January 2019
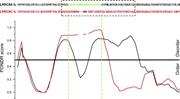
Figure 8. PONDR VL-XT analysis of LRRC8A (black) and LRRC8C (red) intracellular loops (ILs). PONDR scores are aligned with specific amino acid residues, which are shown at the top. Dashed box shows amino acid sequences that diverge significantly More about this image found in PONDR VL-XT analysis of LRRC8A (black) and LRRC8C (red) intracellular loops...
in A 30-year journey from volume-regulated anion currents to molecular structure of the LRRC8 channel
> Journal of General Physiology
Published: 16 January 2019
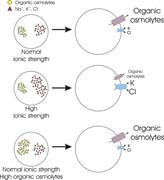
Figure 9. Cartoon illustrating possible mechanism of VRAC regulation by ionic strength and cell swelling-induced mechanical force. LRR region is shown in orange. Mechanical force is represented by the green springs. Conformation of the LRR More about this image found in Cartoon illustrating possible mechanism of VRAC regulation by ionic strengt...
Journal Articles
In Special Collection:
Excitatory Synapses
, JGP Reviews: Ion Channel Structure and Function
, Ligand-gated ion channels
Journal:
Journal of General Physiology
J Gen Physiol (2018) 150 (8): 1081–1105.
Published: 23 July 2018
Published: 23 July 2018
Figure 1. Functional classes of iGluRs. (A) iGluRs are divided into AMPA, kainate, and NMDA receptors with multiple subunits cloned in each of these functional classes. (B) EPSCs from central synapses can be divided into fast AMPA or slow NMDA More about this image found in Functional classes of iGluRs. (A) iGluRs are divided into AMPA, kainate, a...
Published: 23 July 2018
Figure 2. Subunit stoichiometry and subunit arrangement of GluN1/2 NMDA receptors. The crystal structure of the intact GluN1/2B NMDA receptor (the intracellular CTD omitted from structure; Protein Data Bank accession no. 4PE5 ; Karakas and More about this image found in Subunit stoichiometry and subunit arrangement of GluN1/2 NMDA receptors. T...
1

