The epithelial Na channel (ENaC) is a heterotrimer whose trafficking to the apical membrane is stimulated by aldosterone. Trafficking is associated with proteolytic cleavage of the α and γ subunits. We examined the kinetics of this process to ascertain whether the observed changes could contribute to the most rapid anti-natriuretic effects (within 1–3 h) of hormone administration in rats. Infusion of aldosterone increased the abundance of cleaved αENaC and γENaC with time constants of 2.2 and 2.3 h, respectively. Decreases in full-length γENaC and increases in full-length αENaC occurred more slowly, with time constants of 22 and 17 h. Decreases in aldosterone also caused rapid decreases in cleaved and slower changes in full-length forms. Kinetic modeling suggested that the major effect of aldosterone on γENaC kinetics was on the transition from a full-length, intracellular (I) to a cleaved, membrane-associated (M) population. This rate is relatively slow (0.002–0.01 h−1) compared with rates of degradation of M (∼0.4 h−1) and I (∼0.04 h−1). Short lifetimes (∼1 h) of channels at the surface were confirmed in a mouse collecting duct cell line (mCCD). Lifetimes of full-length forms of α and γENaC were also short in whole-cell extracts of mCCD cells but were much longer in the cytoplasm of mouse tubule suspensions (10–20 h). We conclude that one effect of aldosterone in the kidney is to increase forward trafficking of ENaC to the apical membrane, where rapid degradation from the surface permits fast regulation of apical channel abundance.
Introduction
Aldosterone is an adrenal corticosteroid hormone that is essential for maintaining normal Na+ and K+ balance (Garty and Palmer, 1997; Verrey et al., 2008; Rossier et al., 2015). It acts on distal portions of the mammalian renal tubule, particularly the connecting tubule (CNT) and collecting duct (CD), stimulating Na+ reabsorption directly through upregulation of the epithelial Na channel (ENaC) and promoting K+ secretion indirectly through ENaC-dependent depolarization of the apical membrane.
The ENaC is a heterotrimeric protein expressed in the renal CNT and CDs (Garty and Palmer, 1997; Kellenberger and Schild, 2002; Rossier, 2014). The three subunits, α, β, and γ, are similar, forming a pseudosymmetric pore, but have unique features (Noreng et al., 2018; Houser and Baconguis, 2025). αENaC undergoes cleavage at two extracellular sites by furin, while γENaC is cleaved once by furin and once by an unidentified extracellular protease (Kleyman et al., 2009; Anand et al., 2022). β and γENaC contain intracellular domains with binding sites for the Nedd4-2 ubiquitin ligase that can control ubiquitination of α and γENaC (Debonneville et al., 2001; Snyder, 2002; Shi et al., 2024).
Aldosterone affects ENaC in part through membrane-protein trafficking. This effect was first described using immunocytochemistry (Loffing et al., 2000; Loffing et al., 2001). With low levels of circulating aldosterone, all three ENaC subunits were diffusely distributed throughout the cytoplasm of principal cells of the CNT and CD. When hormone levels were elevated, the channel protein moved toward the apical pole of the cells. Later measurements revealed large aldosterone-dependent increases in surface expression of the channels, consistent with the altered cellular distribution patterns (Frindt et al., 2008; Frindt and Palmer, 2009; Frindt and Palmer, 2010).
Aldosterone also stimulates the proteolytic cleavage of α and γENaC (Masilamani et al., 1999; Ergonul et al., 2006). These cleaved forms arise from the actions of furin in the Golgi apparatus and other proteases in the apical membrane and/or luminal fluid and are thought to represent active states of the channels (Kleyman et al., 2009). Cell fractionation studies indicated that aldosterone increases the abundance of cleaved γENaC in the Golgi and postGolgi compartments while decreasing the amounts of the full-length form in the ER (Frindt et al., 2016). This suggested that a major effect of aldosterone on ENaC trafficking was the stimulation of movement from the ER, through the Golgi to the cell surface. The hormone may also increase the lifetime of channels at the surface through downregulation of Nedd4-2–mediated ubiquitination and degradation (Debonneville et al., 2001; Snyder, 2002).
In this paper, we explore the kinetics of aldosterone effects on ENaC processing. We make use of channel cleavage as a marker for trafficking and maturation of the subunits on the way to the apical surface. Our main finding is that after movement into a pool of cleaved, apically located channels, the subunits have short lifetimes. This, together with a large excess of channel protein within the cells (Frindt et al., 2022), may serve to facilitate rapid and reversible regulation of apical channel density.
Materials and methods
Animals
All procedures using animals were approved by the Institutional Animal Care and Use Committee of Weill Cornell Medical College. Female Sprague–Dawley rats (140–200 g) were maintained on normal lab rodent chow (Na content 0.4% and K content 1.2%). C57BL/6N mice (20–30 g) of either sex (Charles River) were fed either normal chow or a synthetic diet containing minimal Na (Na content 0.01–0.02% and K content 0.5%).
Rat kidneys
Rats were injected s.c. with a priming dose of aldosterone (24 μg in 0.2 ml PEG-300) and implanted with subcutaneous osmotic minipumps (Alzet Model 2001) containing aldosterone delivered at a rate of 24 μg/day. For reversal of aldosterone effects, minipumps were removed, and animals were injected s.c. with a single dose of spironolactone (1.5 mg in 0.3 ml PEG-300). For both implantation and removal of minipumps, animals were anesthetized with isoflurane. They recovered and resumed normal activity within minutes. Animals were euthanized with isoflurane overdose, and kidneys were harvested without perfusion.
Mouse tubule suspensions
For preparation of suspensions of mouse tubules, both kidneys were removed and finely minced with a razor blade. The minced pieces were incubated for 20 min at 37°C with gentle rocking in solution containing (in mM) 120 NaCl, 25 NaHCO3, 3.3 KH2PO4, 0.8 K2HPO4, 1.2 MgCl2, 1.2 CaCl2, 10 glucose, and collagenase type II (catalog # LS004176; Worthington, 2 mg/ml). Suspensions were washed twice with the same solution without collagenase, triturated gently with a Pasteur pipette, and suspended in 25 ml of the above solution per kidney. The resulting suspensions contained fragments of all nephron segments as well as glomeruli and blood vessels. These suspensions were incubated at 37°C for up to 6 h with gentle rocking. To block protein synthesis, 100 μg/ml cycloheximide (CHX, 239765; Sigma-Aldrich) was added to half of the suspension and diluent (DMSO) to the other half. Both halves were incubated at 37°C with gentle rocking for 3 or 6 h.
Mouse collecting duct cell line cells
Immortalized mouse collecting duct cell line (mCCD) cells (RRID: CVCL_B7HR) were maintained in DMEM/F12 medium (#21041; Gibco) supplemented with 5 μg/ml insulin (#I1882; Sigma-Aldrich), 5 μg/ml transferrin (#T1428; Sigma-Aldrich), 10 ng/ml epidermal growth factor (#E4127; Sigma-Aldrich), 1 nM triiodothyronine (#T5516; Sigma-Aldrich), 50 nM dexamethasone (#D8893; Sigma-Aldrich), 0.06 nM sodium selenite (#S9133; Sigma-Aldrich), and 2% decomplemented FBS (#26140079; Gibco) as described previously (Mutchler et al., 2024). Cells were seeded onto 24-mm permeable polyester membrane inserts (#3450; Corning) and cultured for 7–10 days to form polarized monolayers with transepithelial electrical resistance >1,000 Ω.
For the pulse-chase assay, apical surface proteins were labeled with 1 mg/ml of EZ-Link Sulfo-NHS-SS-Biotin (#21331; Thermo Fisher Scientific) in a buffer containing 137 mM NaCl and 15 mM sodium borate, pH adjusted to 9.0 for a total of 30 min on ice. Excess biotin was then quenched with 10% FBS in DMEM/F12 for 30 min on ice. After extensive washes with ice-cold PBS, inserts were transferred back to a 37°C incubator for 0, 30, 60, or 120 min to allow channel endocytosis and degradation to occur. Cells were extracted in 500 μl detergent buffer in the presence of protease and phosphatase inhibitors as previously described (Shi et al., 2020). 400 μl total lysate of each sample was incubated with Streptavidin agarose (#20349; Thermo Fisher Scientific) overnight at 4°C to isolate biotinylated surface proteins, while 12 μl total lysate was retained as “3% whole-cell input.” The recovered surface proteins and the whole-cell input were analyzed for ENaC α and γ subunits. GAPDH was blotted to confirm the isolation of surface protein.
To block de novo protein synthesis, CHX (239765; Sigma-Aldrich) was added to apical side of the mCCD cells at a final concentration of 100 μg/ml for 0, 1, 4, or 8 h in a 37°C incubator. Cells were extracted as described above, and 15 μl of whole-cell lysates were analyzed for ENaC α or γ subunit abundance.
Western blots
Rat kidneys were homogenized with a tight-fitting Dounce in 8 ml of lysis buffer containing (in mM) 250 sucrose, 10 triethanolamine HCl, 4 NaF, 3 Na orthovanadate, 10 Na pyrophosphate at pH 7.40, and 60 μl protease inhibitor cocktail (#K1007; APExBIO). Rat kidney homogenates were sieved with a nylon mesh (70-μm porosity) to separate intact tissue and then centrifuged at 100,000 × g for 100 min to sediment a total membrane pellet. This was resuspended in 2 ml of lysis buffer, aliquoted, and frozen at −70°C for later analysis.
Mouse tubule suspensions were centrifuged for 5 min, and the pellet was resuspended in 2 ml lysis buffer with protease inhibitor cocktail per kidney. Tissue was homogenized with tight-fitting Dounce. Homogenates were stored without further fractionation.
Primary antibodies used are listed in Table 1. Polyclonal antibodies against a C-terminal epitope of the γ subunit of the rat ENaC were described previously (Ergonul et al., 2006; Frindt et al., 2008; Frindt and Palmer, 2009). Polyclonal antibody against an N-terminal epitope of the α subunit of mouse ENaC was a generous gift of Prof. Johannes Loffing of the University of Zürich (Sorensen et al., 2013). Protein in the membrane fractions and homogenates was measured (BCA Kit, Pierce Biotechnology). Samples containing 0.2 mg protein in 65 μl of lysis buffer were prepared for electrophoresis with 25 μl of 4× sample buffer and 10 μl of 10× sample reducing agent (Invitrogen) and denatured at 70°C for 10 min.
Primary antibodies used for western blots
| Target | Preparation | Dilution | Source | Reference/catalog # |
|---|---|---|---|---|
| αENaC | Rat kidney | 1:2,000 | J. Loffing | Sorensen et al. (2013) |
| αENaC | mCCD | 1:2,000 | J. Loffing | Sorensen et al. (2013) |
| γENaC | Rat kidney | 1:1,000 | L.G. Palmer | Ergonul et al. (2006), Frindt et al. (2008), Frindt and Palmer (2009) |
| γENaC | mCCD | 1:2,000 | StressMarq | #SPC405D |
| γENaC | Mouse kidney | 1:1,000 | L.G. Palmer | Ergonul et al. (2006), Frindt et al. (2008), Frindt and Palmer (2009) |
| GAPDH | mCCD | 1:3,000 | ImmunoResearch | #711035152 |
For SDS-PAGE, 4–12% bis-Tris gels (Invitrogen) were loaded with equal amounts of protein (25–40 μg) from individual rat kidneys in each lane. Proteins were transferred electrophoretically from the gels to PVDF membranes. After blocking with the reagent in the Western Breeze kit (#WB7106; Invitrogen), membranes were incubated overnight at 4°C with primary antibodies. Anti-rabbit IgG conjugated with alkaline phosphatase (included in the Western Breeze kit) was used as a secondary antibody. Bound antibody was visualized with a Syngene Pxi imager using a chemiluminescence substrate (Western Breeze), following the manufacturer’s instructions. Band densities were quantified using Adobe Photoshop. Densities were within the linear range of the detection system (Ergonul et al., 2006). Total protein in the samples was used as loading control. In previous work, we found that use of “housekeeping” proteins such as β-actin did not improve the consistency of signal detection.
For mCCD cells, γENaC was detected using a polyclonal rabbit antibody (#SPC405D; StressMarq) and goat anti-rabbit IgG fluorescent secondary antibody (1:3,000, #12004161; BioRad). To confirm the specificity of labeling of surface protein, GAPDH was detected using a fluorescence-conjugated GAPDH monoclonal antibody (#CL-750-60004; ProteinTech). The fluorescence signals were detected on a Bio-Rad ChemiDoc MP system. The membranes were then gently stripped and probed for αENaC using an antibody developed by Prof. Loffing as described above. The blots were then incubated with donkey anti-rabbit HRP (1:5,000, #711035152; ImmunoResearch), developed using Clarity Western ECL Blotting Substrates (#1705060; Bio-Rad), and imaged with a Bio-Rad ChemiDoc system.
Data analysis
For rat kidney tissue, band intensity was normalized to values obtained with maximal aldosterone stimulation. Data from western blots were plotted and fitted with exponential functions using Igor (WaveMetrics) or Prism (GraphPad Software Inc.).
For mCCD cells, the band intensity for ENaC α or γ subunits in whole-cell lysates at each time point was firstly normalized to the total protein loading (stain-free gels) and then expressed as a relative value to the signal intensity at t = 0. Surface ENaC α or γ abundance was first calculated as a fraction of the whole-cell input. then normalized to that at t = 0. Rate constant (k) were determined by plotting the relative protein abundance over the experimental time by using a one-phase exponential decay function: , where t is the chase time and A is the relative protein abundance at each time point. The time constant (τ) is computed as the reciprocal of k.
Simulations
As described in the Results section, we developed a mathematical model to simulate levels of cleaved (M) and full-length (I) γENaC. Model equations were numerically integrated using a Runge–Kutta-based solver in MATLAB.
Online supplemental material
Results
Aldosterone produces a decrease in urinary Na+ excretion within 2–3 h of administration (Frindt and Palmer, 2015). To see if the cleavage (and presumed trafficking) of ENaC could play a role over this time period, we implanted rats with osmotic minipumps containing aldosterone and assessed γENaC processing and expression at various times after the implantation. Overall, six separate experiments were carried out, mostly on groups of eight rats with single or duplicate values taken at different time points. As shown in Fig. 1, increased abundance of the cleaved form of the subunit can be observed within 2 h of the start of hormone administration. The abundance increases to maximal levels with a time constant of ∼2 h (Fig 1 D).
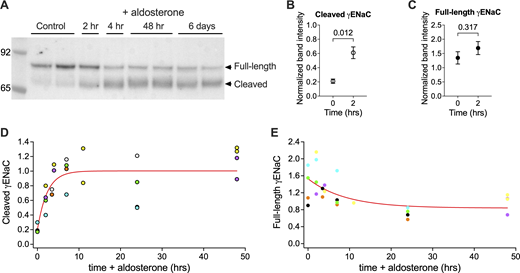
Kinetics of effects of aldosterone administration on γENaC processing. Rats were implanted with osmotic minipumps to deliver aldosterone at a constant rate for various time periods. At the end of the period, animals were sacrificed, the left kidney was removed, and microsomes were prepared. (A) Western blot. Equal amounts of microsomal protein (25 μg) from a different animal were loaded onto each lane. After electrophoresis, the expression of γENaC protein was assessed. (B and C) Changes in band density of the cleaved (B) and full-length (C) forms of γENaC after 2 h of aldosterone administration. Band densities were normalized to the final steady-state level after 6–8 days of aldosterone administration. Data are shown as means ± SEM for four observations. (D and E) Band densities for the cleaved (D) and full-length (E) forms of γENaC were plotted vs time of aldosterone administration. Data from individual experiments are plotted using the same color. (D) Data were fitted with an exponential equation: , with A(0) = 0.20, B = 0.81, and τ = 2.3 h. (E) Data were fitted with an exponential equation: , with B = 0.55 and τ = 17 h. Source data are available for this figure: SourceData F1.
Kinetics of effects of aldosterone administration on γENaC processing. Rats were implanted with osmotic minipumps to deliver aldosterone at a constant rate for various time periods. At the end of the period, animals were sacrificed, the left kidney was removed, and microsomes were prepared. (A) Western blot. Equal amounts of microsomal protein (25 μg) from a different animal were loaded onto each lane. After electrophoresis, the expression of γENaC protein was assessed. (B and C) Changes in band density of the cleaved (B) and full-length (C) forms of γENaC after 2 h of aldosterone administration. Band densities were normalized to the final steady-state level after 6–8 days of aldosterone administration. Data are shown as means ± SEM for four observations. (D and E) Band densities for the cleaved (D) and full-length (E) forms of γENaC were plotted vs time of aldosterone administration. Data from individual experiments are plotted using the same color. (D) Data were fitted with an exponential equation: , with A(0) = 0.20, B = 0.81, and τ = 2.3 h. (E) Data were fitted with an exponential equation: , with B = 0.55 and τ = 17 h. Source data are available for this figure: SourceData F1.
Increased cleaved γENaC abundance is usually accompanied by a decrease in the full-length form of the subunit (Masilamani et al., 1999; Ergonul et al., 2006). Fig. 1 shows that the time course of this decrease is slower than that of the increase in the cleaved species. In the first 2 h after administration of aldosterone, the amount of the cleaved form increased threefold (Fig. 1 B), while there was no significant change in the full-length form (Fig. 1 C). After that time, the amounts gradually decreased to a steady state that averaged 45% of the control level. The estimated time constant of this decrease was 17 h, although there is some uncertainty in this estimate due to the relatively small amplitude of the change in the amounts of full-length subunit in these experiments.
To examine the kinetics of the response to decreased aldosterone, we tested two maneuvers to reverse the effects of the hormone. First, we simply removed the osmotic minipump from the animals. Second, we injected the rats with a single dose of the mineralocorticoid antagonist spironolactone. As shown in Fig. 2, both maneuvers decreased γENaC cleavage substantially over a period of 4 h. Removal of the pump along with spironolactone treatment had little additional effect over administration of the antagonist by itself.
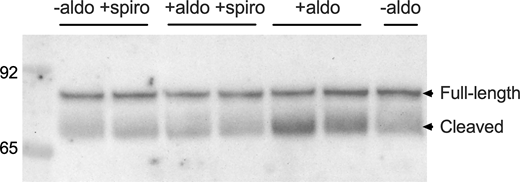
Reversal of aldosterone effects on γENaC processing. Rats were implanted with osmotic minipumps to deliver aldosterone at a constant rate for 6–7 days. Pumps were surgically removed, and/or animals were treated with a single dose of spironolactone (1.5 mg, s.c.). After 4 h, animals were sacrificed, the left kidney was removed, and microsomes were prepared. Equal amounts of microsomal protein (25 μg) from a different animal were loaded onto each lane. After electrophoresis, the expression of γENaC protein was assessed. Source data are available for this figure: SourceData F2.
Reversal of aldosterone effects on γENaC processing. Rats were implanted with osmotic minipumps to deliver aldosterone at a constant rate for 6–7 days. Pumps were surgically removed, and/or animals were treated with a single dose of spironolactone (1.5 mg, s.c.). After 4 h, animals were sacrificed, the left kidney was removed, and microsomes were prepared. Equal amounts of microsomal protein (25 μg) from a different animal were loaded onto each lane. After electrophoresis, the expression of γENaC protein was assessed. Source data are available for this figure: SourceData F2.
To assess the kinetics of the aldosterone-off response, we combined pump removal with spironolactone treatment. The results are shown in Fig. 3. The abundance of cleaved γENaC decreased rapidly, with a substantial decline after 3.5 h and an estimated time constant of ∼4 h. Again, changes in the abundance of the full-length subunit were slower. There was no observable increase over the first 3.5 h, and the time constant of recovery of the full-length form was ∼22 h.
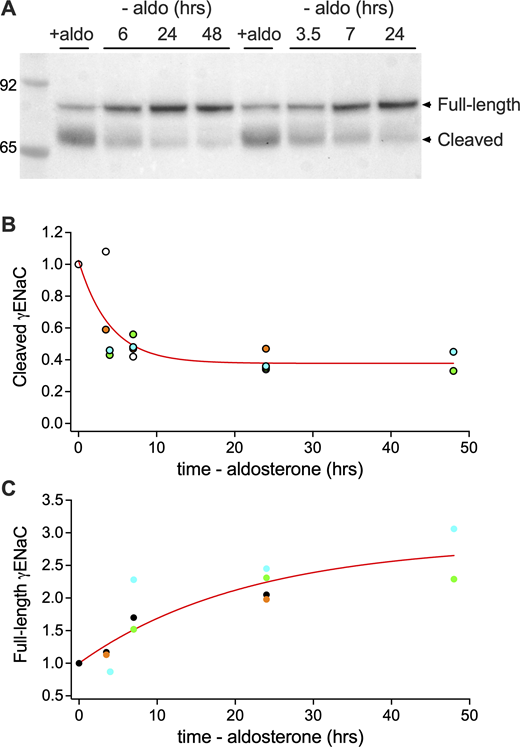
Kinetics of effects of aldosterone removal on γENaC processing. Rats were implanted with osmotic minipumps to deliver aldosterone at a constant rate for 6–7 days. At t = 0, pumps were removed surgically, and a single dose of spironolactone was administered. At various times, animals were sacrificed, the left kidney was removed, and microsomes were prepared. (A) Western blot. Equal amounts of microsomal protein (35 μg) from a different animal were loaded onto each lane. After electrophoresis, the expression of γENaC protein was assessed. (B) Band density for the cleaved form of γENaC was normalized to the initial value and plotted against the time of aldosterone removal. Data from individual experiments are plotted using the same color. Initial values represent four different experiments. Data were fitted with an exponential equation: , with A(0) set to 1, B = 0.65, and τ = 4.0 h. (C) Band density for the full-length form of γENaC was normalized to the initial value and plotted against the time of aldosterone removal. Data from individual experiments are plotted using the same color. Initial values represent 4 different experiments. Data were fitted with an exponential equation: , with A(0) set to 1, B = 1.85, and τ = 22 h. Source data are available for this figure: SourceData F3.
Kinetics of effects of aldosterone removal on γENaC processing. Rats were implanted with osmotic minipumps to deliver aldosterone at a constant rate for 6–7 days. At t = 0, pumps were removed surgically, and a single dose of spironolactone was administered. At various times, animals were sacrificed, the left kidney was removed, and microsomes were prepared. (A) Western blot. Equal amounts of microsomal protein (35 μg) from a different animal were loaded onto each lane. After electrophoresis, the expression of γENaC protein was assessed. (B) Band density for the cleaved form of γENaC was normalized to the initial value and plotted against the time of aldosterone removal. Data from individual experiments are plotted using the same color. Initial values represent four different experiments. Data were fitted with an exponential equation: , with A(0) set to 1, B = 0.65, and τ = 4.0 h. (C) Band density for the full-length form of γENaC was normalized to the initial value and plotted against the time of aldosterone removal. Data from individual experiments are plotted using the same color. Initial values represent 4 different experiments. Data were fitted with an exponential equation: , with A(0) set to 1, B = 1.85, and τ = 22 h. Source data are available for this figure: SourceData F3.
We also evaluated the time course of changes in αENaC (Fig. 4). With administration of aldosterone, the abundance of the cleaved form increased with a time course similar to that of cleaved γENaC; the estimated time constant was 2.2 h (Fig. 4 B). In contrast to γENaC, the abundance of the full-length α subunit increases with aldosterone, in parallel with increased amounts of mRNA (Asher et al., 1992; Masilamani et al., 1999; Ergonul et al., 2006). Again, these changes were relatively slow. There was only a modest increase over the first 8 h, and the time constant of the response was ∼22 h (Fig. 4 C). In the experiment, shown the amount of full-length αENaC decreased between 48 h and 6 days. In two other experiments, expression was maximal at 6 days. We do not know the reason for this variability, which could relate to changes in the regulation of αENaC gene expression. The data in Fig 4 C were normalized to the maximal value for each experiment.
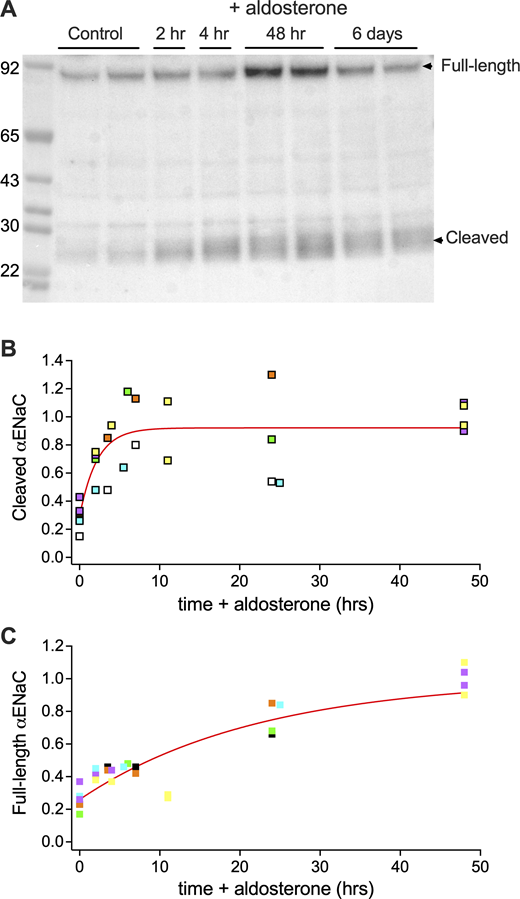
Kinetics of effects of aldosterone administration on αENaC processing. Rats were implanted with osmotic minipumps to deliver aldosterone at a constant rate for various time periods. At the end of the period, animals were sacrificed, the left kidney was removed, and microsomes were prepared. (A) Western blot. Equal amounts of microsomal protein (40 μg) from a different animal were loaded onto each lane. After electrophoresis, the expression of γENaC protein was assessed. (B) Band density for the cleaved form of αENaC was normalized to the steady-state level after 6–8 days and plotted against the time of aldosterone administration. Data from individual experiments are plotted using the same color. Data were fitted with an exponential equation: , with A(0) = 0.29, B = 0.63, and τ = 2.2 h. (C) Band density for the full-length form of αENaC was normalized to the maximal level after either 48 h or 6 days and plotted against the time of aldosterone administration. Data from individual experiments are plotted using the same color. Data were fitted with an exponential equation: , with A(0) = 0.26, B = 0.74, and τ = 22 h. Source data are available for this figure: SourceData F4.
Kinetics of effects of aldosterone administration on αENaC processing. Rats were implanted with osmotic minipumps to deliver aldosterone at a constant rate for various time periods. At the end of the period, animals were sacrificed, the left kidney was removed, and microsomes were prepared. (A) Western blot. Equal amounts of microsomal protein (40 μg) from a different animal were loaded onto each lane. After electrophoresis, the expression of γENaC protein was assessed. (B) Band density for the cleaved form of αENaC was normalized to the steady-state level after 6–8 days and plotted against the time of aldosterone administration. Data from individual experiments are plotted using the same color. Data were fitted with an exponential equation: , with A(0) = 0.29, B = 0.63, and τ = 2.2 h. (C) Band density for the full-length form of αENaC was normalized to the maximal level after either 48 h or 6 days and plotted against the time of aldosterone administration. Data from individual experiments are plotted using the same color. Data were fitted with an exponential equation: , with A(0) = 0.26, B = 0.74, and τ = 22 h. Source data are available for this figure: SourceData F4.
With removal of aldosterone plus antagonist administration, the cleaved form of αENaC decreased rapidly (Fig. 5), with significant decreases within 3.5 h and an estimated time constant of 5 h (Fig. 5 B). For the full-length form, there was no detectable change after 3.5 h, and the time constant of the decline was ∼11 h (Fig. 5 C), although the reliability of this estimate was lower than that obtained for the on-response to the hormone.
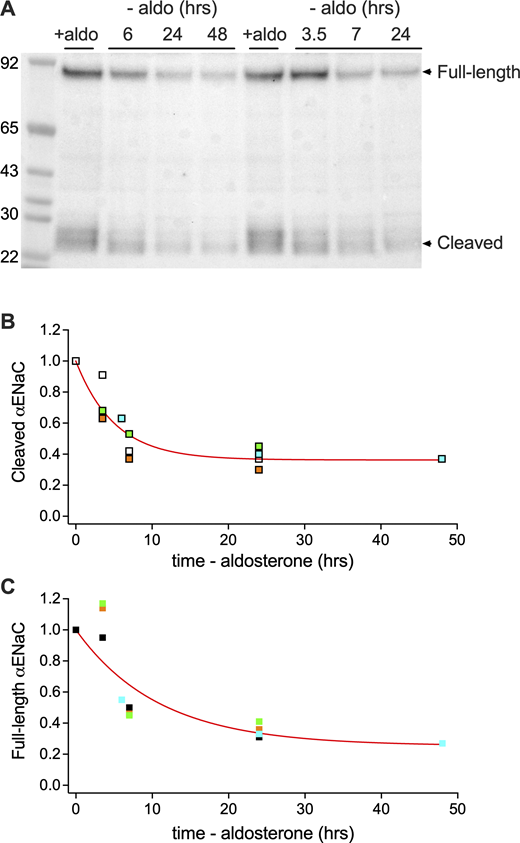
Kinetics of effects of aldosterone removal on αENaC processing. Rats were implanted with osmotic minipumps to deliver aldosterone at a constant rate for 6–7 days. At t = 0, pumps were removed surgically, and a single dose of spironolactone was administered. At various times, animals were sacrificed, the left kidney was removed, and microsomes were prepared. (A) Western blot. Equal amounts of microsomal protein (40 μg) from a different animal were loaded onto each lane. After electrophoresis, the expression of αENaC protein was assessed. (B) Band density for the cleaved form of αENaC was normalized to the initial value at t = 0. Data from individual experiments are plotted using the same color. Initial values represent four different experiments Data were fitted with an exponential equation: , with A(0) set to 1, B = 0.64, and τ = 5.1 h. (C) Band density for the full-length form of αENaC was normalized to the initial value at t = 0 Data from individual experiments are plotted using the same color. Initial values represent four different experiments. Data were normalized to the values at t = 0 and fitted with an exponential equation: , with A(0) set to 1, B = 0.75, and τ = 11 h. Source data are available for this figure: SourceData F5.
Kinetics of effects of aldosterone removal on αENaC processing. Rats were implanted with osmotic minipumps to deliver aldosterone at a constant rate for 6–7 days. At t = 0, pumps were removed surgically, and a single dose of spironolactone was administered. At various times, animals were sacrificed, the left kidney was removed, and microsomes were prepared. (A) Western blot. Equal amounts of microsomal protein (40 μg) from a different animal were loaded onto each lane. After electrophoresis, the expression of αENaC protein was assessed. (B) Band density for the cleaved form of αENaC was normalized to the initial value at t = 0. Data from individual experiments are plotted using the same color. Initial values represent four different experiments Data were fitted with an exponential equation: , with A(0) set to 1, B = 0.64, and τ = 5.1 h. (C) Band density for the full-length form of αENaC was normalized to the initial value at t = 0 Data from individual experiments are plotted using the same color. Initial values represent four different experiments. Data were normalized to the values at t = 0 and fitted with an exponential equation: , with A(0) set to 1, B = 0.75, and τ = 11 h. Source data are available for this figure: SourceData F5.
The simplest kinetic model that we could devise to account for these results is shown in Fig. 6. We separate γENaC protein into two pools, one that is unprocessed (I, full-length) and one that is processed (M, cleaved). These pools presumably correspond to the ENaC that is distributed diffusely in the cytoplasm (I) under low-aldosterone conditions and one that is close to the apical surface (M) under high-aldosterone conditions (Loffing et al., 2000; Loffing et al., 2001). A subpopulation of the cleaved pool is in the apical membrane but is not considered separately; it was not practical to make measurements of surface expression routinely in this study. However, in previous work, changes in surface expression correlated very closely with changes in the total pool of cleaved channels (Fig. 6 B). We assume a constant rate of protein synthesis, all of which enters pool I. Channels can exit pool I either by degradation (kdI) or through processing to pool M (kp). We assume that this step is irreversible and that channels in M are degraded with rate kdM.

Kinetic model of ENaC processing and trafficking in rat kidney. (A) Kinetic model of changes in unprocessed/full-length and processed/cleaved γENaC. Channels enter pool I through biosynthesis (ks, assumed constant) and exit either through degradation (kdI) or processing (kp) to the cleaved form (pool M). Channels exit pool M through degradation (kdM). (B) Relationship between total cleaved γENaC and γENaC expressed at the cell surface. Fractional changes in cleaved γENaC at the cell surface, measured using a cell-impermeant biotinylating reagent, are plotted against changes in total cleaved γENaC. Data are from rats fed a low-Na+ diet (Frindt et al., 2008), a high-Na+ diet (Frindt and Palmer, 2009), and a high-K diet (Frindt and Palmer, 2010), and from animals infused with high doses of aldosterone (Frindt et al., 2008). The line represents the identity relationship.
Kinetic model of ENaC processing and trafficking in rat kidney. (A) Kinetic model of changes in unprocessed/full-length and processed/cleaved γENaC. Channels enter pool I through biosynthesis (ks, assumed constant) and exit either through degradation (kdI) or processing (kp) to the cleaved form (pool M). Channels exit pool M through degradation (kdM). (B) Relationship between total cleaved γENaC and γENaC expressed at the cell surface. Fractional changes in cleaved γENaC at the cell surface, measured using a cell-impermeant biotinylating reagent, are plotted against changes in total cleaved γENaC. Data are from rats fed a low-Na+ diet (Frindt et al., 2008), a high-Na+ diet (Frindt and Palmer, 2009), and a high-K diet (Frindt and Palmer, 2010), and from animals infused with high doses of aldosterone (Frindt et al., 2008). The line represents the identity relationship.
Although as shown below the steady-state amounts of M will depend on changes in kp, the rates of change of the M pool are dominated by the rates of degradation kdM, which are similar for the addition and removal of aldosterone.
In either case, the main conclusion is that the rate of processing to the cleaved M-state pool is slow compared with the rate of degradation of the full-length channel, even with activation of processing by aldosterone. In contrast, the rate of degradation of the cleaved channels is rapid.
We used the estimated values to simulate the behavior of the I and M populations. As shown in Fig. 7, the model predicts a rapid increase in M and a slower decrease in I with hormone challenge (see also Data S1). The simulation shows that M reaches a maximum quickly and then decreases slowly as a consequence of the decreased I population. We did not observe this biphasic response experimentally, but it may have been obscured by the noise in the measurements. The pattern is reversed with decreases in aldosterone, with fast decreases in M and slower increases in I. The bottom left panel explores the effects of graded changes in kp. Effects on I increase in magnitude with increasing kp, without changes in kinetics. Effects on M also change primarily in magnitude, with the secondary fall becoming more prominent with larger kp. The bottom right panel shows the effects of varying kdM. The ks parameter was set to 1 h−1; its value scales absolute amounts of I and M but does not impact the relative amounts plotted here, which are normalized to the initial value before the change in kp. The kinetics of the resulting changes in M, but not those of I, becomes more rapid.

Simulations of changes in pools I and M based on the model of Fig. 6 . Parameters were chosen based on the calculations in the text. (A and B) The top panels show the time courses of changes in I and M in response to a 6.6-fold increase in kp (A), and to the reversal of this increase (B). In both cases, pool M changes much more quickly than pool I. (C) Predicted changes in response to graded increase in kp (from the low-aldosterone value of 0.023 h−1 to twice the high-aldosterone value of 0.013 h−1). (D) Predicted faster response in M for increasing values of kdM (from 1/5 to five times its baseline value of 0.43 h−1). Responses were normalized to the low-aldosterone steady-state value for each value of kdM prior to simulated aldosterone addition.
Simulations of changes in pools I and M based on the model of Fig. 6 . Parameters were chosen based on the calculations in the text. (A and B) The top panels show the time courses of changes in I and M in response to a 6.6-fold increase in kp (A), and to the reversal of this increase (B). In both cases, pool M changes much more quickly than pool I. (C) Predicted changes in response to graded increase in kp (from the low-aldosterone value of 0.023 h−1 to twice the high-aldosterone value of 0.013 h−1). (D) Predicted faster response in M for increasing values of kdM (from 1/5 to five times its baseline value of 0.43 h−1). Responses were normalized to the low-aldosterone steady-state value for each value of kdM prior to simulated aldosterone addition.
We did not attempt to model changes in αENaC, as aldosterone increases the abundance of mRNA for this subunit (Asher et al., 1992). This presumably effects rates of synthesis, making the analysis of kinetics more complicated.
To test these conclusions, we used the mCCD cell line (Gaeggeler et al., 2005) with endogenous expression of ENaC. To examine the rate of degradation of the channels from the surface, we carried out a biotin-chase protocol. Cells were grown to confluence on filters, and apical membrane proteins were biotinylated at 4°C. Cells were returned to 37°C and incubated for various times before assaying for biotinylated ENaC subunits. Since the channels presumably need to be internalized before they are degraded, this will serve as an overestimate of their lifetime at the surface.
Results are shown in Figs. 8 and 9. One significant difference between the cell line and the rodent kidney is the presence of substantial amounts of full-length γENaC at the surface in the mCCD cells. In rat and mouse kidney, almost all the subunits at the surface are cleaved (Frindt et al., 2008; Frindt and Palmer, 2009; Frindt and Palmer, 2010). Over the 2 h chase after biotin labeling, total ENaC α and γ subunits in the whole-cell lysates remained stable, while both forms of the subunit had short lifetimes at the surface (Fig. 8 A and Fig. 9 A). The time constant for the cleaved form of γENaC was 35 min, and that of the full-length form was 21 min, although the former estimate is more reliable since the decay of the signal was more complete (Fig. 8 B). Similar results were observed for the α subunit (Fig. 9 B). Time constants were 51 min for the cleaved and 26 min for the full-length forms. βENaC was not analyzed due to a weak signal using the available antibodies.
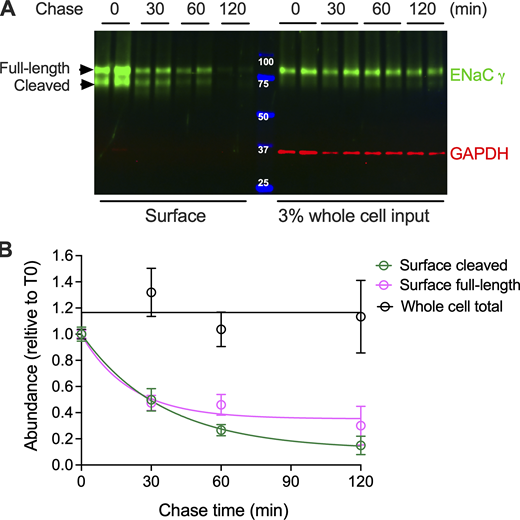
Lifetimes of γENaC subunit at the cell surface of mCCD cells. Cells were grown to confluence on filters. At t = 0, the apical surface was exposed to a cell-impermeant biotinylating reagent and washed with culture medium containing FBS to quench the reaction. Filters were harvested after incubation at 37°C for different times between 0 and 120 min after biotinylation. Cell lysates were solubilized, and streptavidin beads were used to pull down biotinylated proteins. (A) Samples of whole-cell extract and pull-down were analyzed with PAGE. Each lane was loaded with equal volumes of samples from a different filter and probed with anti-γENaC and anti-GAPDH antibodies. In the whole-cell extract, full-length, but not cleaved γENaC, was detected. The cleaved form was observed in the biotin pull-down fraction, while GAPDH, an intracellular protein, was not detected. (B) Changes in subunit abundance were analyzed with an exponential equation: , with τ = 1/k = 36 and 21 min and B = 0.88 and 0.65 for the cleaved and full-length forms, respectively. Source data are available for this figure: SourceData F8.
Lifetimes of γENaC subunit at the cell surface of mCCD cells. Cells were grown to confluence on filters. At t = 0, the apical surface was exposed to a cell-impermeant biotinylating reagent and washed with culture medium containing FBS to quench the reaction. Filters were harvested after incubation at 37°C for different times between 0 and 120 min after biotinylation. Cell lysates were solubilized, and streptavidin beads were used to pull down biotinylated proteins. (A) Samples of whole-cell extract and pull-down were analyzed with PAGE. Each lane was loaded with equal volumes of samples from a different filter and probed with anti-γENaC and anti-GAPDH antibodies. In the whole-cell extract, full-length, but not cleaved γENaC, was detected. The cleaved form was observed in the biotin pull-down fraction, while GAPDH, an intracellular protein, was not detected. (B) Changes in subunit abundance were analyzed with an exponential equation: , with τ = 1/k = 36 and 21 min and B = 0.88 and 0.65 for the cleaved and full-length forms, respectively. Source data are available for this figure: SourceData F8.
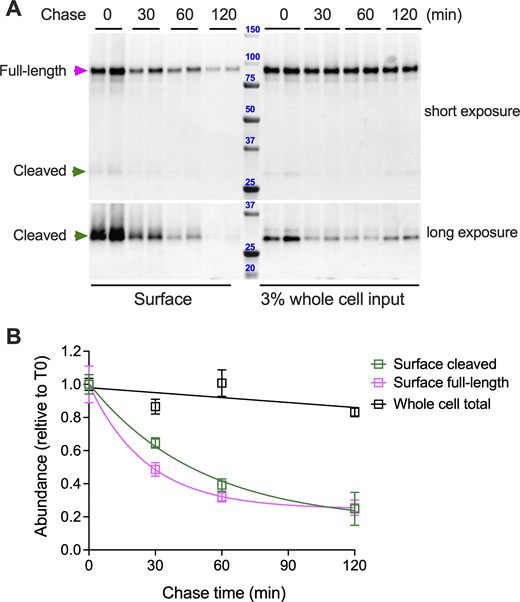
Lifetimes of αENaC subunit at the cell surface of mCCD cells. Cells were grown to confluence on filters. At t = 0, the apical surface was exposed to a cell-impermeant biotinylating reagent and washed with Tris culture media containing FBS to quench the reaction. Filters were harvested after incubation at 37°C for different times between 0 and 120 min after biotinylation. Cell lysates were solubilized, and streptavidin beads were used to pull down biotinylated proteins. (A) Samples of whole-cell extract and pull-down were analyzed with PAGE. Each lane was loaded with equal volumes of samples from a different filter and probed with anti-αENaC. The cleaved form of the subunit was visualized with longer exposure of the blot. (B) Changes in subunit abundance were analyzed with an exponential equation: , with τ = 1/k = 50 and 26 min and B = 0.84 and 0.75 for the cleaved and full-length forms, respectively. Source data are available for this figure: SourceData F9.
Lifetimes of αENaC subunit at the cell surface of mCCD cells. Cells were grown to confluence on filters. At t = 0, the apical surface was exposed to a cell-impermeant biotinylating reagent and washed with Tris culture media containing FBS to quench the reaction. Filters were harvested after incubation at 37°C for different times between 0 and 120 min after biotinylation. Cell lysates were solubilized, and streptavidin beads were used to pull down biotinylated proteins. (A) Samples of whole-cell extract and pull-down were analyzed with PAGE. Each lane was loaded with equal volumes of samples from a different filter and probed with anti-αENaC. The cleaved form of the subunit was visualized with longer exposure of the blot. (B) Changes in subunit abundance were analyzed with an exponential equation: , with τ = 1/k = 50 and 26 min and B = 0.84 and 0.75 for the cleaved and full-length forms, respectively. Source data are available for this figure: SourceData F9.
The kinetic model predicts that the lifetime of the unprocessed channels (in pool I) should be much longer. To assess this, we treated mCCD cells with CHX to block protein synthesis and followed the decline in protein content. As shown in Fig. 10, A and B, the time constant for the degradation of the full-length subunits was 45 min for γENaC and 100 min for αENaC. This indicates slower degradation of the bulk channels compared with those on the surface, but the lifetimes are much shorter than those estimated from the in vivo experiments (∼ 20 h).
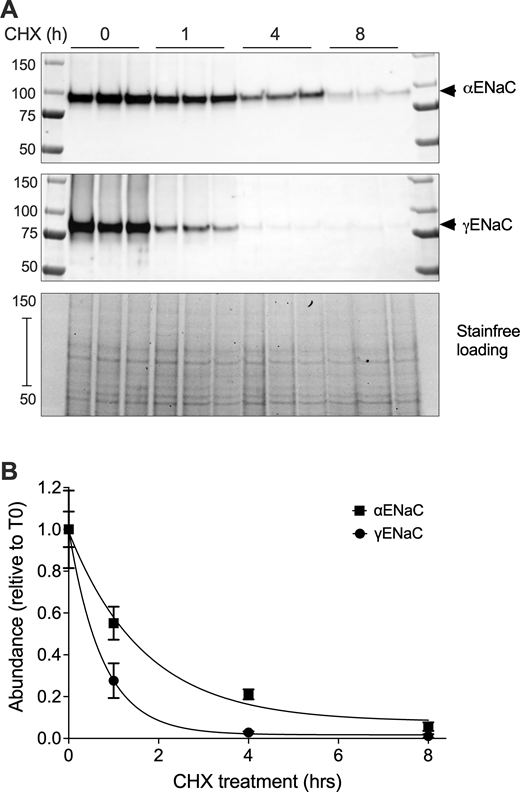
Lifetimes of total γ and αENaC in mCCD cells. Cells were grown to confluence on filters. At t = 0, 100 μg/ml CHX was added to the media, and filters were incubated for various times from 0 to 8 h. (A) Cells were harvested, and extracts were analyzed by PAGE. Each lane was loaded with the same volume of extract from a different filter, and the blot was probed with anti-γENaC or anti-αENaC antibodies. (B) Plots of relative abundance vs. time were analyzed with an exponential equation: , with τ = 1/k = 102 and 45 min and B = 0.92 and 0.98 for α and γENaC, respectively. Source data are available for this figure: SourceData F10.
Lifetimes of total γ and αENaC in mCCD cells. Cells were grown to confluence on filters. At t = 0, 100 μg/ml CHX was added to the media, and filters were incubated for various times from 0 to 8 h. (A) Cells were harvested, and extracts were analyzed by PAGE. Each lane was loaded with the same volume of extract from a different filter, and the blot was probed with anti-γENaC or anti-αENaC antibodies. (B) Plots of relative abundance vs. time were analyzed with an exponential equation: , with τ = 1/k = 102 and 45 min and B = 0.92 and 0.98 for α and γENaC, respectively. Source data are available for this figure: SourceData F10.
The discrepancies could reflect differences between the cell line and the intact kidney or could be related to the way the measurements were done. In the mCCD cells, the administration of CHX will decrease the synthesis of all proteins, and it is possible that ENaC processing could be affected by other short-lived species. To explore this point further, we repeated the CHX experiments using a suspension of tubules from mouse kidney. Mice were used instead of rats because of the relative ease of preparation of the suspension using collagenase digestion of the kidneys. In some experiments, animals were fed a low-Na+ diet for variable times to permit the visualization of both full-length and cleaved forms of the protein. Preliminary experiments showed that γENaC protein levels were stable in these suspensions for up to 6 h. Treatment of the tubules with CHX for 3 or 6 h resulted in modest declines in the amounts of subunit protein (Fig. 11), indicating a greater stability than in the mCCD cells. Rough estimates of the time constants were 11–22 h for the full-length form and 14–16 h for the cleaved form. These values are in reasonable agreement with estimates from 1/kdI of 22 h. We also noted that lifetimes were somewhat shorter in suspensions from animals on a low-Na+ diet for several days (Fig. 10 C). Values of τ for the full-length form were 36–43 h for Na+-replete mice and 6–11 h for Na+-depleted mice. The shorter lifetimes seen with Na+ depletion could reflect degradation of the channels through conversion to fully processed forms, which is accelerated by high aldosterone levels, followed by a rapid degradation of the processed pool.
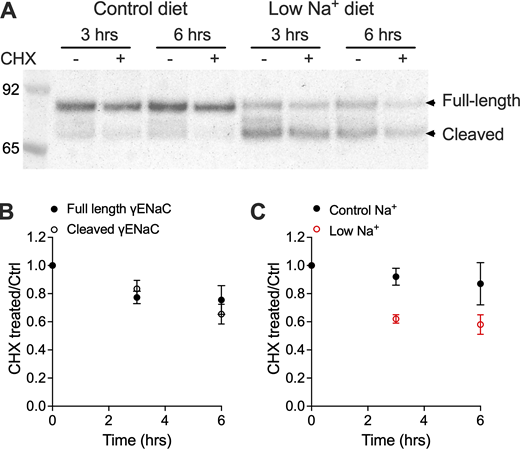
Lifetimes of total γENaC in tubule suspensions of mouse kidney. At t = 0, 100 μg/ml CHX was added to half of the suspension, which was incubated at 37°C for 3 or 6 h. Tubules were harvested, and extracts were analyzed by PAGE. Each lane was loaded with the same amount of total protein from suspensions treated or not with CHX and probed with anti-γENaC antibody. (A) Blot with suspensions of tubules from mice on control or low-Na+ diets, illustrating the shift from full-length to cleaved forms. (B) Fractional changes in full-length and cleaved γENaC abundance versus time. Data are plotted as mean ± SEM for 6–10 different mice. (C) Fractional changes in cleaved γENaC abundance vs. time with suspensions from mice on control diet for 12 days or a Na-deficient diet for 5–7 days. Source data are available for this figure: SourceData F11.
Lifetimes of total γENaC in tubule suspensions of mouse kidney. At t = 0, 100 μg/ml CHX was added to half of the suspension, which was incubated at 37°C for 3 or 6 h. Tubules were harvested, and extracts were analyzed by PAGE. Each lane was loaded with the same amount of total protein from suspensions treated or not with CHX and probed with anti-γENaC antibody. (A) Blot with suspensions of tubules from mice on control or low-Na+ diets, illustrating the shift from full-length to cleaved forms. (B) Fractional changes in full-length and cleaved γENaC abundance versus time. Data are plotted as mean ± SEM for 6–10 different mice. (C) Fractional changes in cleaved γENaC abundance vs. time with suspensions from mice on control diet for 12 days or a Na-deficient diet for 5–7 days. Source data are available for this figure: SourceData F11.
Discussion
One striking effect of the mineralocorticoid hormone aldosterone on the kidney is the promotion of cleaved forms of the γ and α subunits of ENaC (Masilamani et al., 1999; Ergonul et al., 2006). The appearance of these forms correlates with the movement of ENaC from a diffuse intracellular distribution to one where the protein is concentrated near the apical pole of the principal cells (Loffing et al., 2000; Loffing et al., 2001). Increases in circulating levels of aldosterone in vivo increase the amount of γENaC protein in the plasma membrane, in recycling endosomes, in Golgi membranes, and in exosomes, while decreasing amounts associated with the ER (Frindt et al., 2016). This suggests that a major action of the hormone is to promote the trafficking of channels toward the apical surface. Cleavage of the channels correlates with the maturation of glycosylation of the ENaC subunits (Ergonul et al., 2006), consistent with increased movement through the Golgi apparatus. The cleavage is thought to begin in the Golgi itself, using furin (Hughey et al., 2004). In the case of γENaC, the cleavage process is completed by other proteases, including prostasin, acting on channels at the surface (Kleyman et al., 2009).
The main conclusions of this study are based on the kinetics of the effects of either increasing or decreasing levels of aldosterone on these processing events:
- (1)
The amount of cleaved γENaC and αENaC can change within 2 h of either administration of aldosterone or removal of the hormone plus treatment with a mineralocorticoid receptor antagonist.
- (2)
With either increases or decreases in hormone levels, the amounts of cleaved subunits—either γENaC or αENaC—change faster than those of the full-length forms.
- (3)
These observations can be explained by a simple kinetic model in which the rate of degradation of mature cleaved subunits is faster than that of the immature, full-length forms and much faster than the rate of cleavage and processing of the subunits. The major effect induced by aldosterone is an increase in the processing rate.
- (4)
In this model, most of the ENaC subunits synthesized in the ER—about 95% under control conditions—are directly degraded rather than moving through the Golgi. The fraction undergoing Golgi processing increases with aldosterone. This is consistent with a previous study showing a 100- to 1,000-fold excess in the abundance of channel proteins in the cell relative to the number needed for Na+ transport (Frindt et al., 2022).
- (5)
Channels that are fully processed and that, therefore, can participate in epithelial transport are quickly degraded. Channels at the surface may have lifetimes of under 1 h, permitting rapid changes in the transport capacity of the tubules.
The time constant for changes in cleaved ENaC subunits in vivo includes the time required for aldosterone to reach the cells, bind its receptor, and activate gene transcription and protein translation. These time constants therefore underestimate the actual kinetic constants governing channel processing, particularly the rapid degradation of cleaved subunits. The lifetime of the channels at the surface of the cell measured in vitro was only 35–50 min. Even shorter lifetimes (15–25 min) were reported in Xenopus A6 cells (Alvarez de la Rosa et al., 2002).
In both mCCD cells and A6 cells, the lifetime of the total cellular ENaC was much shorter (∼1–2 h) than our estimates of the lifetime of the uncleaved species in vivo (20 h). The reason for this difference is unknown, but it could play a role in the much higher channel activity measured ex vivo in renal tubules compared with the cell lines. In both cases, the lifetimes of the total pool of channels were longer than those of the surface pool, in qualitative agreement with the in vivo results. However, aldosterone affects ENaC protein in very different ways in the A6 cells. The hormone increases both mRNA and protein levels for all three subunits in those cells (Alvarez de la Rosa et al., 2002), whereas in the kidney the increases are restricted to the α subunit (Asher et al., 1992), and this increase is not sufficient to increase channel activity (Frindt and Palmer, 2012). Also, subunit cleavage was not observed in the A6 cells conditions (Alvarez de la Rosa et al., 2002).
While we do not know the mechanisms underlying the decreased stability of the channels at the surface, they could be related to ubiquitination of the α and γ subunits. Ubiquitination is thought to be an important signal for degradation of ENaC (Staub et al., 2000; Snyder, 2002), and we have reported that cleaved γENaC (in the kidney) and surface γENaC (in a heterologous system) are preferentially ubiquitinated (Frindt et al., 2020; Shi et al., 2024).
We lack information on the dynamics of ENaC movement between the total pool of cleaved channels and the apical membrane. Comparison of changes in the total cleaved pool and the apical membrane component suggests that the ratio of channels in these two compartments is fairly constant. However, we do not know exactly what this ratio is. We also do not know how many channels in the cleaved submembrane compartment have come directly from the Golgi apparatus and how many have been recycled from the apical surface. Better labeling and imaging techniques will be required to address these questions.
Data availability
Data underlying all figures are available in the published article. A MATLAB file is available upon reasonable request to the corresponding author.
Acknowledgments
Joseph A. Mindell served as editor.
This work was supported by National Institutes of Health (NIH) grant R01DK111380 to L.G. Palmer
Author contributions: G. Frindt: conceptualization, data curation, formal analysis, investigation, methodology, project administration, validation, and writing—original draft, review, and editing. S. Shi: conceptualization, data curation, funding acquisition, investigation, methodology, resources, visualization, and writing—original draft, review, and editing. T. Krogh-Madsen: software and writing—review and editing. T. Rohan: data curation, investigation, methodology, and writing—review and editing. S.C.M. Whelan: investigation. L.G. Palmer: conceptualization, data curation, formal analysis, funding acquisition, investigation, methodology, project administration, resources, supervision, validation, visualization, and writing—original draft, review, and editing.