


The epithelial Na+ channel (ENaC) is a heterotrimeric protein whose assembly, trafficking, and function are highly regulated. To better understand the biogenesis and activation of the channel, we quantified the expression of individual subunits of ENaC in rat kidneys and colon using calibrated Western blots. The estimated abundance for the three subunits differed by an order of magnitude with the order γENaC ∼ βENaC ≫ αENaC in both organs. Transcript abundance in the kidney, measured with digital-drop PCR and RNAseq, was similar for the three subunits. In both organs, the calculated protein expression of all subunits was much larger than that required to account for maximal Na+ currents measured in these cells, implying a large excess of subunit protein. Whole-kidney biotinylation indicated that at least 5% of β and γ subunits in the kidney and 3% in the colon were expressed on the surface under conditions of salt restriction, which maximizes ENaC-dependent Na+ transport. This indicates a 10- to 100-fold excess of βENaC and γENaC subunits at the surface relative to the requirement for channel activity. We conclude that these epithelia make much more ENaC protein than is required for the physiological function of the channel. This could facilitate rapid regulation of the channels at the cell surface by insuring a large population of inactive, recruitable subunits.
Introduction
The epithelial Na+ channel ENaC mediates Na+ reabsorption in epithelial cells including the distal nephron and colon, where it is essential for the regulation of both Na+ and K+ excretion in the urine and feces (Garty and Palmer, 1997; Kellenberger and Schild, 2002; Rossier, 2014). The channel is composed of three homologous subunits (α, β, γ; Canessa et al., 1994) that form a heterotrimeric pore (Noreng et al., 2018). ENaC is strongly regulated by the adrenal corticosteroid aldosterone in both kidneys and the colon (Verrey et al., 2008). However, the hormone controls the expression of the subunits differently in the two organs. In the kidney, aldosterone increases αENaC mRNA and protein abundance without strongly influencing those of βENaC or γENaC (Asher et al., 1996; Masilamani et al., 1999; Ergonul et al., 2006). In contrast, the colon expresses αENaC constitutively, but β and γENaC are aldosterone-dependent (Asher et al., 1996).
At least in the kidney, regulation of protein abundance is not necessary for controlling channel activity (Frindt and Palmer, 2012). Rather, translocation of all three subunits to the surface is a major determinant of function (Loffing et al., 2000a; Loffing et al., 2001; Frindt et al., 2008; Frindt et al., 2016). During the translocation process, all the three subunits undergo posttranslational modification including changes in glycosylation and, for αENaC and γENaC, proteolytic cleavage at extracellular sites (Masilamani et al., 1999; Ergonul et al., 2006). When aldosterone levels rise the abundance of mature, highly processed forms increases (Masilamani et al., 1999; Ergonul et al., 2006).
Although many studies have measured fractional changes in subunit expression, both in the whole-cell and on the cell surface, a complete understanding of the regulation of the channel requires knowledge of the absolute number of subunits expressed. For example, while it is clear that subunits are translocated to the apical surface with elevated levels of aldosterone, we do not know whether all channels participate in transport under these conditions. This information has been difficult to obtain, especially in native tissues. ENaC has no high-affinity ligands suitable for counting channels and the canonical blocker amiloride has an affinity that is too low (Kd ∼ 100 nM) for this purpose. Firsov et al. (1996) constructed subunits with extracellular epitope tags for quantifying heterologous expression in Xenopus laevis oocytes. They found >10-fold excess of subunits at the surface compared with the amounts needed to account for conduction and concluded that most channels in the plasma membrane are inactive or have a very low open probability. Here, we measure subunits in rodent kidneys and colon. We use antibodies to the three subunits together with calibration peptide standards containing the relevant epitopes to estimate their overall and surface expression. This novel approach allowed us to quantitatively compare the number of different subunits within the cell to each other and to that required for Na+ transport across the epithelium.
Materials and methods
Animals
All procedures using animals were approved by the Institutional Animal Care and Use Committee of Weill Cornell Medical College. Sprague–Dawley rats (200–300 g) and C56BL6 mice (20–30 g) were purchased from Charles River. In some cases, animals were fed a Na-deficient diet containing 0.004% Na by weight (MP Biomedicals) or a K-rich diet containing 5% KCl (Harlan-Teklad). Animals were sacrificed under anesthesia by thoracotomy followed by cutting of the outflow tract from the heart. Kidneys or distal colons were removed for biochemical analysis.
Construction of GFP-peptide fusion probes
Gene inserts coding for GFP fusions were constructed and synthesized by GenScript as follows: (1) the N-terminus of GFP was preceded by the 49 amino acids of the N-terminus of rat αENaC: 5′-MLDHTRAPELNIDLDLHASNSPKGSMKGNQFKEQDPCPPQPMQGLGKGDK-3′, (2) the C-terminus of GFP was followed by the 50 amino acids of the C-terminus of rat βENaC: 5′-PDTTSCRPNAEVYPDQQTLPIPGTPPPNYDSLRLQPLDTMESDSEVEAI-3′, or (3) the C-terminus of GFP was followed by the 50 amino acids of the C-terminus of rat γENaC: 5′-DDLPTFTSAMRLPPAPGSTVPGTPPPRYNTLRLDRAFSSQLTDTQLTNEL-3′. For each construct, a poly-His tag was added to the terminus opposite the ENaC sequence to facilitate purification. The inserts were cloned into the pET-28+ vector.
Plasmids were used to transform Escherichia coli (BL21 DE3). Bacteria were grown overnight in LB medium + kanamycin (25 μg/ml) at 37°C with shaking at 200 rpm. A total of 4 ml of the starter culture was used to inoculate 250 ml LB and grown to an OD600 of 0.6. Cells were induced with IPTG (1 mM) and incubated for 2–3 h at 37°C. Cells were harvested by centrifugation at 6,000 rpm for 5 min (F12-6x500 LEX rotor; Thermo Fisher Scientific). The pellet was resuspended in buffer containing 300 mM NaCl, 20 mM Tris-HCl pH 8.5 mM, 5 mM MgCl2, 1 mM PMSF, 0.05 mg/ml DNAse, and 0.2 mg/ml lysozyme. The suspension was sonicated on ice and clarified by centrifugation at 12,000 rpm for 20 min (F14-14x50cy rotor; Thermo Fisher Scientific). Protein was bound to a TALON resin column, washed with 5 mM imidazole, and eluted with 50 mM imidazole. The eluted fraction was further purified by size-exclusion chromatography. Protein concentrations were measured using absorbance at 280 nm and checked with a micro-BCA protein assay (Pierce).
Western blots
Whole-kidney homogenates were prepared by mincing one kidney. Epithelial cells were scraped from the distal 5 cm of rat colons using the edge of a microscope slide. Tissues were disrupted with a Dounce homogenizer. Homogenates were filtered through a nylon cell strainer (70 μm mesh) to remove intact tissue. After measurement of protein concentration, the samples were prepared for electrophoresis, as described previously (Frindt et al., 2017).
For isolation of the distal nephron segments, mouse kidneys were perfused through the left ventricle 5 ml L15 medium (Sigma-Aldrich) containing type 2 collagenase (300 U/ml). The renal cortex was separated and cut into small pieces for additional incubation in L15 medium with collagenase for 20–30 min at 37°C to loosen tubular segments. The tissue was washed three times with L15 medium and then kept on ice for manual isolation of connecting tubules, identified by branching.
Samples were electrophoresed on 4–12% Bis-TRIS gels (Invitrogen), and the proteins were transferred electrophoretically to PVDF membranes. After blocking, the membranes were incubated overnight at 4°C with primary antibodies. These were raised in rabbits against C-terminal epitopes of rat β and γENaC (Masilamani et al., 1999; Ergonul et al., 2006) and an N-terminal epitope of mouse αENaC (Sorensen et al., 2013). The anti-αENaC antibody was a generous gift from Dr. Johannes Loffing (University of Zürich, Zürich, Switzerland). Anti-GFP antibody was purchased from Genscript. Anti-rabbit IgG conjugated with alkaline phosphatase was used as the secondary antibody. The bound antibody was visualized with a Syngene Pxi imager using a chemiluminescence substrate (Western Breeze, Invitrogen). Band densities were quantified using Photoshop. Two different sets of molecular mass standards were used, which gave somewhat different estimates of the molecular masses of the subunits.
For analysis of surface fractions, kidneys were biotinylated in situ as described previously (Frindt et al., 2008; Frindt and Palmer, 2009; Frindt et al., 2016). Colons were slit along the longitudinal axis and biotinylated in vitro with incubation in PBS pH 8.0 + sulfo-NHS-SS-biotin (1 mg/ml; Campbell Science) for 30 min at 4°C. Reactions were quenched with Tris buffer, pH 8.0. Microsomes were prepared from either kidney or colon homogenates by centrifugation at 100,000 g for 100 min and solubilized with 3% Triton X100. Surface proteins from equal amounts of microsomal protein were isolated using neutravidin beads.
RNA analysis
For assessment of expression of mRNA for ENaC subunits, pieces of cortex ∼5 × 5 × 5 mm were cut from rat kidneys. The pieces were soaked for 1 h in RNA-protect reagent (Qiagen) and stored at −70°C. Tissues were thawed and total RNA was isolated using an RNeasy mini kit (Qiagen). cDNA was prepared using q-Script cDNA synthesis kit (QuantaBio). cDNA preparations from 24 ng total RNA were mixed with commercial primer-probe assays (BioRad) for rat α, β, and γENaC (Scnn1a, assay ID dRnoCPE5170906; Scnnb, assay ID dRNoCPE5175567; and Scnng, assay ID dRnoCPE5176168). Fluorophores were FAM for Scnn1a and Scnn1g and HEX for Scnn1b. Digital droplet PCR was done using a BioRad QX200 with an autodroplet generator. Droplets were created using Automated Droplet Generation Oil (BioRad) and read using ddPCR Droplet Reader Oil (BioRad). The thermal cycling protocol was 10 min at 95°C (enzyme activation), 40 × (94°C 30 s/55°C 1 min), and 10 min at 98°C (enzyme deactivation) according to the manufacturer’s instruction. Individual reactions run in duplicate included probes either for Scnn1a and b or for Scnn1g and b. The amounts of each message were calculated using BioRad QuantaSoft software. The final output was the ratio of αENaC or γENaC to βENaC.
For RNA-seq, CNT fragments from mouse kidneys were isolated as described above. RNA was isolated from pools of 50–100 fragments using an RNeasy Micro kit (Qiagen). RNA integrity was checked using a 2100 Bioanalyzer (Agilent Technologies). RNA concentrations were measured using the NanoDrop system (Thermo Fisher Scientific). Preparation of RNA sample library and RNA-seq were performed by the Genomics Core Laboratory at Weill Cornell Medicine. Messenger RNA was prepared using the TruSeq Stranded mRNA Sample Library Preparation kit (Illumina), according to the manufacturer’s instructions. The normalized cDNA libraries were pooled and sequenced on Illumina HiSeq4000 sequencer with single-end 50 cycles. The raw sequencing reads in BCL format were processed through bcl2fastq 2.19 (Illumina) for FASTQ conversion and demultiplexing.
Statistics
Statistical analysis used an unpaired two-way Student’s t test. Data distribution was assumed to be normal, but this was not formally tested.
Online supplemental material
Supplemental figures show the dependence of signals from Western blots on the amounts of protein loaded onto the gels (Fig. S1), the efficiency of transfer of protein from gels to filters (Fig. S2), and the comparison of the estimates of expression of a GFP-βENaC construct using anti-βENaC and anti-GFP antibodies (Fig. S3).
Results
Antibodies raised against an N-terminal epitope of αENaC and C-terminal epitopes of β and γENaC from rodents recognize full-length (80–90 kD) forms of the subunits in Western blots as well as cleavage products of α and γENaC that result from natural posttranslational processing (Masilamani et al., 1999; Ergonul et al., 2006). To make the blots quantitative, we designed and synthesized calibration standards consisting of peptides containing the antigenic epitopes linked to a carrier protein (GFP; Fig. 1). To mimic the natural proteins, the αENaC sequence was added to the N-terminus while the β and γENaC sequences were added to the C-terminus of the carrier. The calibration probes were expressed in E. coli and purified to near homogeneity as judged by Coomassie staining of SDS-PAGE gels. Purified antiserum recognized the standards in Western blots at the expected molecular masses and gave signals that were linear over a range that varied with the construct. The probes for α and βENaC migrated as single bands that were assumed to contain all the proteins loaded onto the gel. For the GFP-γENaC fusion protein, Coomassie staining indicated smaller species that were recognized by anti-GFP antibodies but not by anti-ENaC antibodies. Here, we corrected the protein content of the main band by multiplying the amount loaded by the fraction of signal measured by Coomassie staining in that band.
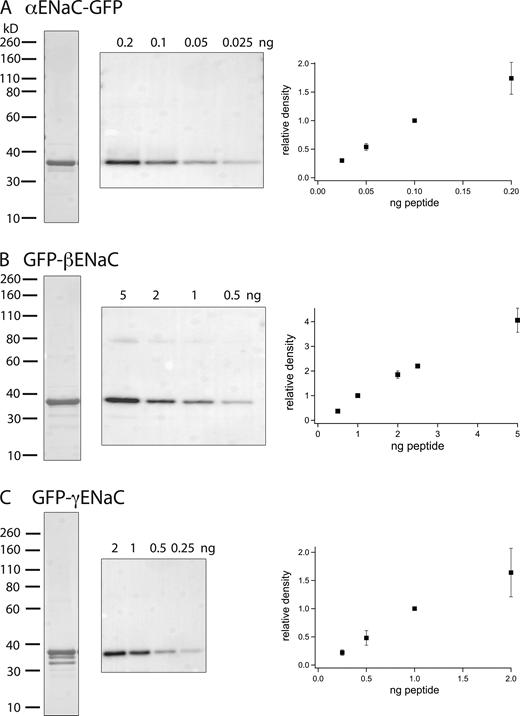
Probes for quantifying Western blots. (A–C) Peptides reproducing the N-terminus of rat αENaC (A) and the C-termini of β (B) and γENaC (C) were added to GFP. The recombinant proteins were purified, separated by PAGE, and visualized by Coomassie staining (left lanes). Gels containing different amounts of the probes were probed with affinity-purified rabbit antiserum raised against the ENaC epitopes (middle). The blot in C was reproportioned to align with the molecular mass standards of the Coomassie stain. Densitometry of the blots indicated linearity of the signal with protein content up to 0.1 ng (αENaC), 2 ng (βENaC), and 1 ng (γENaC). Data represent means ± SD for three to six determinations from independent blots. Source data are available for this figure: SourceData F1.
Probes for quantifying Western blots. (A–C) Peptides reproducing the N-terminus of rat αENaC (A) and the C-termini of β (B) and γENaC (C) were added to GFP. The recombinant proteins were purified, separated by PAGE, and visualized by Coomassie staining (left lanes). Gels containing different amounts of the probes were probed with affinity-purified rabbit antiserum raised against the ENaC epitopes (middle). The blot in C was reproportioned to align with the molecular mass standards of the Coomassie stain. Densitometry of the blots indicated linearity of the signal with protein content up to 0.1 ng (αENaC), 2 ng (βENaC), and 1 ng (γENaC). Data represent means ± SD for three to six determinations from independent blots. Source data are available for this figure: SourceData F1.
The probes were then used to estimate the ENaC protein content in homogenates of the cortex and outer medulla of rat kidneys in Western blots (Fig. 2). Amounts of the homogenates loaded were selected to be within the linear range of the signals from the probes and within the linear range of the signals as a function of the loaded protein. The latter was up to 25 μg as determined from independent blots (Fig. S1). For αENaC, the main band corresponded to the full-length protein at ∼90 kD, with a smaller contribution from a 30 kD N-terminal proteolytic fragment. These species are thought to be physiologically relevant as they are upregulated when aldosterone concentrations are elevated in vivo (Ergonul et al., 2006; Frindt and Palmer, 2012). The anti-βENaC antibody recognized the full-length peptide at 90 kD as well as a smaller sharper band that is non-specific based on its persistence in blots with a C-terminal truncated βENaC (Frindt et al., 2020). The γENaC antibody stained a full-length band at 85 kD as well as a 70 kD protein that represents a cleavage product of an extracellular protease acting on the extracellular loop of the protein (Frindt et al., 2021). The cleaved form increases in abundance, while that of the full-length form decreases, with elevated levels of circulating aldosterone (Masilamani et al., 1999; Ergonul et al., 2006).
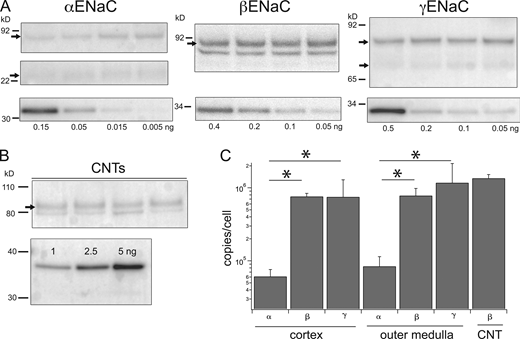
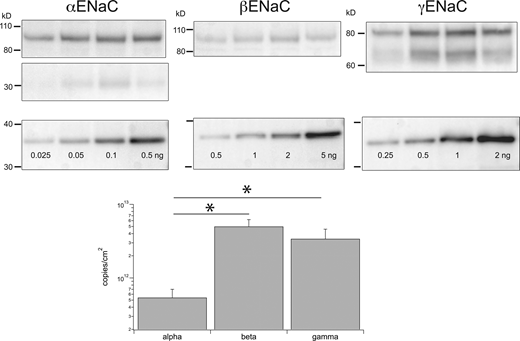
Estimates of subunits/cells in kidney cortex and outer medulla. (A) Tissue lysates. Gel lanes were loaded with 15–25 μg protein from renal cortex homogenates from different animals (upper panels). Separate lanes on the same gel were loaded with indicated amounts of calibration peptides (lower panels). Calibration curves, as in Fig. 1, were used to estimate the number of ENaC subunits in each lane. (B) Isolated CNT fragments. About 30–40 fragments representing 17–20 mm tubule from mouse kidneys were dissolved in sample buffer and separated by PAGE. βENaC calibration standards were loaded at the indicated amounts on separate lanes of the same gel. The blot was stained with anti-βENaC antibody. (C) Band densities were converted to units of subunit/cell as described in the text and plotted on a logarithmic scale. Data represent means ± SD for eight determinations (homogenates) and four determinations (CNTs). * indicates a significant difference between the abundance of α and βENaC (P = 8 × 10⁻¹³ for cortex and 2 × 10⁻⁷ for medulla) or of α and γENaC (P = 0.003 for cortex and 0.007 for medulla). Source data are available for this figure: SourceData F2.
Estimates of subunits/cells in kidney cortex and outer medulla. (A) Tissue lysates. Gel lanes were loaded with 15–25 μg protein from renal cortex homogenates from different animals (upper panels). Separate lanes on the same gel were loaded with indicated amounts of calibration peptides (lower panels). Calibration curves, as in Fig. 1, were used to estimate the number of ENaC subunits in each lane. (B) Isolated CNT fragments. About 30–40 fragments representing 17–20 mm tubule from mouse kidneys were dissolved in sample buffer and separated by PAGE. βENaC calibration standards were loaded at the indicated amounts on separate lanes of the same gel. The blot was stained with anti-βENaC antibody. (C) Band densities were converted to units of subunit/cell as described in the text and plotted on a logarithmic scale. Data represent means ± SD for eight determinations (homogenates) and four determinations (CNTs). * indicates a significant difference between the abundance of α and βENaC (P = 8 × 10⁻¹³ for cortex and 2 × 10⁻⁷ for medulla) or of α and γENaC (P = 0.003 for cortex and 0.007 for medulla). Source data are available for this figure: SourceData F2.
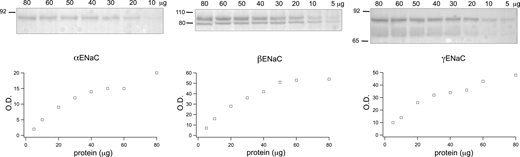
Protein dependence of ENaC signals. Each lane of a Western blot was loaded with a different amount of total protein from the lysate of rat kidney cortex. Signals from αENaC (A), βENaC (B), and γENaC (C) are plotted as a function of loaded protein. Source data are available for this figure: SourceData FS1.
Protein dependence of ENaC signals. Each lane of a Western blot was loaded with a different amount of total protein from the lysate of rat kidney cortex. Signals from αENaC (A), βENaC (B), and γENaC (C) are plotted as a function of loaded protein. Source data are available for this figure: SourceData FS1.
Calculating absolute protein abundance in this way assumes that the affinity of the antibodies are of the same for the full-length protein and for the GFP-based probes. To test this, we measured the signal from anti-βENaC as a function of antibody concentration. As shown in Fig. 3, the signal saturated as the dilution of the purified antiserum decreased from 1/1,500 to 1/50. All signals remained well below the saturation of the detector. There was no discernible difference in the concentration dependence of the whole protein and peptide probe. This suggests that the affinities of the antibody are similar for the two species, although the absolute affinity could not be calculated and we cannot rule out small differences.
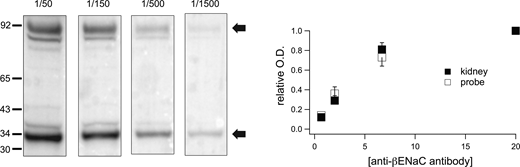
Affinity of anti-βENaC antiserum for full-length βENaC and the GFP-βENaC probe. Individual lanes of the Western blot were loaded with identical preparations containing 80 μg protein from rat kidney cortex and 0.5 ng of the GFP-βENaC probe. After electrophoretic transfer, lanes were cut from the filter and incubated with anti-βENaC antiserum diluted 1/1,500, 1/500, 1/150, and 1/50. Strips were processed in the same solutions and signals measured simultaneously. Optical densities were analyzed for the major species of protein and probe (arrows) and normalized to the value at the 1/50 dilution. Data are presented as means ± SD for three separate blots. There were no detectable differences in the antibody concentration dependence for detecting protein and probe. Source data are available for this figure: SourceData F3.
Affinity of anti-βENaC antiserum for full-length βENaC and the GFP-βENaC probe. Individual lanes of the Western blot were loaded with identical preparations containing 80 μg protein from rat kidney cortex and 0.5 ng of the GFP-βENaC probe. After electrophoretic transfer, lanes were cut from the filter and incubated with anti-βENaC antiserum diluted 1/1,500, 1/500, 1/150, and 1/50. Strips were processed in the same solutions and signals measured simultaneously. Optical densities were analyzed for the major species of protein and probe (arrows) and normalized to the value at the 1/50 dilution. Data are presented as means ± SD for three separate blots. There were no detectable differences in the antibody concentration dependence for detecting protein and probe. Source data are available for this figure: SourceData F3.
We also compared the efficiency of electrophoretic transfer of material out of the gels. We loaded gels with two identical sets of kidney samples with peptide standards. We transferred half of each gel using the standard protocol and then carried out a second transfer using both the transferred and untransferred halves. For β and γENaC, only minimal material was observed with the second transfer, suggesting that the first had been complete (Fig. S2). With αENaC, a significant signal was observed for the kidney protein with the second transfer, amounting to 27% of the total material (n = 2). In contrast, little of the peptide signal was seen with the second transfer. We do not know the reason for the difference. It could relate to the very different pI values of the αENaC subunit (8.39, EXPASY) and the peptide (6.08). However, a similar difference exists for γENaC, which did not show the same phenomenon. We corrected the calculated abundance of αENaC by a factor of 1/0.73 = 1.37 to correct for incomplete transfer of the subunit.
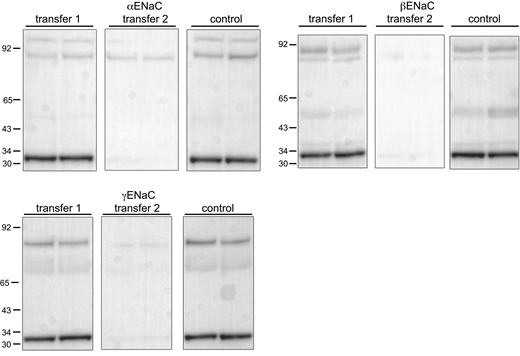
Transfer efficiency of ENaC protein and calibration peptides. Lanes of gels were loaded with 60 μg of lysate from rat kidney cortex together with 4 ng of calibration peptides in two sets of two samples from different animals. The contents of half the gels were transferred electrophoretically to filters. The same half was then retransferred to a second filter together with the remaining half that served as a positive control. For β and γENaC, no significant signals were observed for the second transfer. For αENaC, the second transfer contained 27% of the total material in the first + second transfers. Source data are available for this figure: SourceData FS2.
Transfer efficiency of ENaC protein and calibration peptides. Lanes of gels were loaded with 60 μg of lysate from rat kidney cortex together with 4 ng of calibration peptides in two sets of two samples from different animals. The contents of half the gels were transferred electrophoretically to filters. The same half was then retransferred to a second filter together with the remaining half that served as a positive control. For β and γENaC, no significant signals were observed for the second transfer. For αENaC, the second transfer contained 27% of the total material in the first + second transfers. Source data are available for this figure: SourceData FS2.
As a final check, we designed another construct consisting of full-length βENaC with GFP fused to its N-terminus. This construct was expressed in HEK293 cells, producing relatively small amounts of protein, insufficient in quantity and purity, for use as a standard. However, we reasoned that if the calibration based on the small soluble peptides was reliable, the same results should be obtained with anti-βENaC and anti-GFP antibodies. Both antibodies detected several bands on Western blots, presumably corresponding to full-length protein (130 kD) and cleavage products (Fig. S3). In three independent blots using material from three different transfections, the ratio of copy numbers estimated with anti-βENaC and anti-GFP were 1.9, 0.7, and 1.5. Similar results were obtained with the main secondary band at ∼100 kD. This does not rule out context-dependent antibody interactions, but suggests that errors due to these effects are not large.
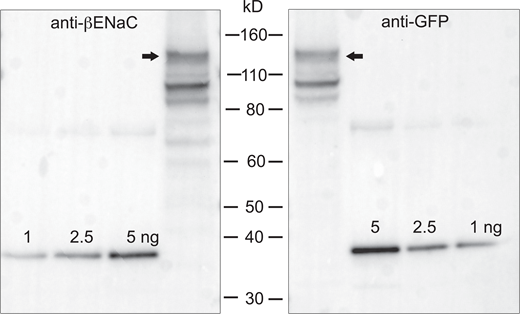
Calibrated Western blot of GFP added to the N-terminal of full-length βENaC. The construct was expressed in HEK293 cells. 5 μl of cell lysate were loaded onto two adjacent lanes of a gel, together with indicated amounts of the βENaC calibration peptide. Gels were cut in half and stained with anti-βENaC (left) or anti-GFP (right). The ratio of copy numbers estimated with anti-βENaC and anti-GFP in this blot was 1.5. In three similar blots from three different transfections the mean (± SD) ratio was 1.4 ± 0.6. Source data are available for this figure: SourceData FS3.
Calibrated Western blot of GFP added to the N-terminal of full-length βENaC. The construct was expressed in HEK293 cells. 5 μl of cell lysate were loaded onto two adjacent lanes of a gel, together with indicated amounts of the βENaC calibration peptide. Gels were cut in half and stained with anti-βENaC (left) or anti-GFP (right). The ratio of copy numbers estimated with anti-βENaC and anti-GFP in this blot was 1.5. In three similar blots from three different transfections the mean (± SD) ratio was 1.4 ± 0.6. Source data are available for this figure: SourceData FS3.
To convert the amount of protein in the lanes to copies/cell, we assumed 37,500 nephrons/rat kidney (Knepper et al., 1977). ENaC is expressed in principal cells of the nephron starting with the distal portion of the distal convoluted tubule (DCT; Loffing et al., 2000b). Approximate lengths of the segments in the rat were taken from the literature (Fig. 4). The DCT itself has a length of ∼1 mm (Weinstein, 2005). ENaC is expressed at the distal end of this segment, designated as “DCT2” or “early connecting tubule (CNT)” and has a length of ∼0.25 mm based on immunocytochemistry (Nesterov et al., 2012; Yang et al., 2021). The geometry of the CNT itself is more complex since these segments form a branched arcade in the cortex. We followed the formulation of (Weinstein, 2005), which assumes an effective CNT length of 1 mm per nephron. For the cortical collecting duct we used a convergence of 5 CNTs to 1 CCD, giving 7,500/kidney (Knepper et al., 1977). The CCD has an average length of 2 mm, including 0.5 mm of initial CCD after the final convergence of CNTs and 1.5 mm of CCD contained within the medullary ray of the cortex (Reif et al., 1984; Weinstein, 2005). All of these structures are contained within the renal cortex, which has a total of 61,900 mm of ENaC-expressing tubules. For the outer medulla we assumed lengths of 2 mm/outer medullary collecting duct (Knepper et al., 1977) giving 15,000 mm per kidney. We used estimates of 510 total cells and 340 principal cells/mm tubule (Frindt and Palmer, 2004). The inner medulla also expresses ENaC but we excluded this part of the kidney in our dissections. The calculated numbers of subunits per cell are shown in the bottom panel of Fig. 2. The summary bar graph includes data from two sets of experiments. Values for α and βENaC were similar in the two sets. γENaC abundance was different, with values consistently less than those of βENaC in one and consistently greater in the other. We do not know the reason for this variaton.

Diagram of ENaC-expressing nephron segments. Assumed lengths of segments containing ENaC protein are DCT2 (early CNT, 0.25 mm; CNT, 1 mm; CCD, 2 mm; and OMCD, 2 mm).
Diagram of ENaC-expressing nephron segments. Assumed lengths of segments containing ENaC protein are DCT2 (early CNT, 0.25 mm; CNT, 1 mm; CCD, 2 mm; and OMCD, 2 mm).
Two surprising findings emerge from the calculations. First, there are large differences in the expression of the different subunits, with γENaC ∼ βENaC ≫ αENaC. The β and γ subunits were about 10-times more abundant than the α subunits. Second, there is a large excess of protein relative to that needed to account for channel activity in native cells. In the CCD under conditions of maximal stimulation (e.g., chronic dietary Na restriction) whole-cell recordings show ENaC-mediated currents as high as 500 pA/cell at a cell potential of −100 mV (Frindt et al., 2001). Currents in the CNT are as large as 1,200 pA/cell (Frindt and Palmer, 2004). Using single-channel currents of 0.9 pA at −100 mV and average open probability of 0.5 (Palmer et al., 1998) the maximum number of active channels ranges from 1 × 10³ to 3 × 10³/cell (Table 1). The excess of subunits is therefore 20- to 60-fold for αENaC (assuming a twofold increase in protein relative to baseline levels; Masilamani et al., 1999; Ergonul et al., 2006). For β and γENaC excesses are >100 fold.
Expression of ENaC subunits in kidney and colon
| Kidney cortex (copies/cell) | Colon (copies/cm2) | |||
|---|---|---|---|---|
| Total | Surface | Total | Surface | |
| αENaC | 6 × 10⁴ | 5 × 10¹¹ | ||
| βENaC | 8 × 10⁵ | >4 × 10⁴ | 5 × 10¹² | >1.4 × 10¹¹ |
| γENaC | 8 × 10⁵ | >4 × 10⁴ | 3 × 10¹² | >1.0 × 10¹¹ |
| Active channels | 1−3 × 10³ | 1−2 × 10⁹ | ||
In the calculations, we have assumed that the cells in the kidney homogenates, other than those of the DCT2, CNT, CCD, and OMCD, do not express ENaC. Since other parts of the nephron, particularly the proximal tubule, contribute a larger mass to the homogenates, it is possible that a low level of expression in these cells contributes to the observed excess of the channel protein. To test this point, we measured βENaC in a preparation containing only ENaC-expressing segments. We isolated 30–40 fragments of branched CNTs from collagenase-treated mouse kidneys, measured the lengths of each fragment with an eyepiece micrometer, and loaded the entire collection, solubilized in sample buffer, onto a single lane of a gel. The total tubule length was 17–20 mm per sample. We used mouse kidneys for these measurements because unlike those of the rat, their tubules can be separated and isolated with mild collagenase digestion that does not damage the tissue. We probed the blots with anti-βENaC because the C-terminal sequence in the mouse is identical to the immunizing epitope from the rat. The results (Fig. 2) confirmed a large number of subunits per cell. The higher estimated density for the CNTs relative to whole-kidney extract could reflect higher expression in the CNTs compared to CDs. The latter will contribute to the signal from whole kidneys but not from the CNT preparation.
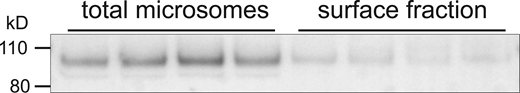
To test whether subunit excesses are also observed for channels in the apical membrane, we isolated cell-surface proteins using in situ biotinylation of rat kidneys (Frindt et al., 2008; Frindt et al., 2016). This provides a lower estimate of the surface protein content, since the reactivity with the biotinylating reagent may not be 100%. Fig. 5 shows Western blots of total kidney microsomes and eluates from the neutravidin beads used to bind biotinylated species. In this case, animals were pretreated with a low-Na diet to induce both surface expression and channel activity (Frindt et al., 2016). The apparent molecular mass of the subunit was slightly higher in the surface fractions, presumably reflecting heavier glycosylation (Ergonul et al., 2006; Frindt et al., 2016). The blots indicated that at least 5% of total βENaC subunits are in the surface pool of channels under these conditions. Comparing the abundance of the subunits at the surface with the number required to account for transport we still calculate a significant excess of at least 10-fold (Table 1). Similar results were obtained for γENaC (not shown). αENaC is more difficult to analyze due to the non-specific binding of the cleaved fragment to the neutravidin beads (Frindt et al., 2008).
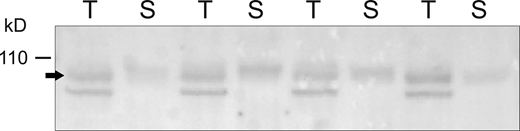
Microsomal and surface fractions of βENaC from rat kidney. Kidneys from four individual rats were perfused in situ with a filtered, impermeant biotinylating reagent. Kidneys were homogenized, microsomes were prepared by centrifugation, and surface fractions were isolated using Neutravidin beads. Lanes of the Western blot were loaded with either 30 μg of total microsomes (T) or Neutravidin eluate obtained from 530 μg of the microsomes (S). The ratio of the signals T/S for individual animals was 0.84 ± 0.21, indicating that 4.8 ± 1.2% of the proteins in the microsomes were recovered in the eluate. Source data are available for this figure: SourceData F5.
Microsomal and surface fractions of βENaC from rat kidney. Kidneys from four individual rats were perfused in situ with a filtered, impermeant biotinylating reagent. Kidneys were homogenized, microsomes were prepared by centrifugation, and surface fractions were isolated using Neutravidin beads. Lanes of the Western blot were loaded with either 30 μg of total microsomes (T) or Neutravidin eluate obtained from 530 μg of the microsomes (S). The ratio of the signals T/S for individual animals was 0.84 ± 0.21, indicating that 4.8 ± 1.2% of the proteins in the microsomes were recovered in the eluate. Source data are available for this figure: SourceData F5.
We next applied the same approach to estimate ENaC copy numbers in the colon. As described in the Introduction, the regulation of subunits is very different in this organ, suggesting that the subunit abundance might also have a different pattern. In this case, we pretreated rats with a low-Na diet to increase the expression of the β and γENaC subunits and facilitate comparison with transport rates. Colonocytes were scraped from the mucosal surface of a measured area of epithelium. Results with homogenates of the scrapings were similar to those in the kidney (Fig. 6). Expression of β and γENaC were comparable and roughly 10-fold higher than that of αENaC. Here, we calculate expression normalized to the surface area of the epithelium since transport rates are reported as μA/cm2 of tissue area. Studies of rat colon under Na-depleted conditions report amiloride-sensitive short-circuit currents (a measure of net Na+ flux through ENaC) of 200–400 μA/cm2 (Edmonds and Marriott, 1970; Will et al., 1980; Turnamian and Binder, 1988; Sotak et al., 2011). To convert this to densities of active channels, we use an open-channel current of 0.39 pA measured in rabbit colon with fluctuation analysis under short-circuit conditions (Zeiske et al., 1982). There is no information on ENaC open probability in the colon, so we assume a mean value of 0.5 as measured in the kidney (Palmer et al., 1998). This predicts a density of active channels of 1 × 10⁹ to 2 × 10⁹/cm2. The number of ENaC subunits in the colonocyte homogenate is at least two orders of magnitude greater (Table 1). We also measured the expression of channels at the surface using biotinylation of the colons in vitro (Fig. 7). Analysis of microsomal and surface fractions by Western blot indicated that the surface fractions contained 2.7% of βENaC and 3.2% of γENaC. Again, these are lower bounds since it is possible that not all surface proteins interact with the biotinylating reagent. Applying these percentages to the total indicates significant excesses of channel protein in the apical membrane (Table 1).
Estimates of subunits/cm2in rat colon. Individual lanes of gels were loaded with 24 μg protein from colon epithelia homogenates from different animals (upper panels). Separate lanes on the same gel were loaded with indicated amounts of calibration peptides (lower panels). Calibration curves, as in Fig. 1, were used to estimate the number of ENaC subunits in each lane. This was converted to subunits/cm2 as described in the text and plotted on a logarithmic scale. Data represent means ± SD for four determinations. * indicates statistically significant differences in the abundance of β versus α (P = 2 × 10⁻⁴) or γ versus α (P = 3 × 10⁻³). Source data are available for this figure: SourceData F6.
Estimates of subunits/cm2in rat colon. Individual lanes of gels were loaded with 24 μg protein from colon epithelia homogenates from different animals (upper panels). Separate lanes on the same gel were loaded with indicated amounts of calibration peptides (lower panels). Calibration curves, as in Fig. 1, were used to estimate the number of ENaC subunits in each lane. This was converted to subunits/cm2 as described in the text and plotted on a logarithmic scale. Data represent means ± SD for four determinations. * indicates statistically significant differences in the abundance of β versus α (P = 2 × 10⁻⁴) or γ versus α (P = 3 × 10⁻³). Source data are available for this figure: SourceData F6.
Microsomal and surface fractions of βENaC from rat colon. Distal colons from four individual rats were incubated in vitro with an impermeant biotinylating reagent. Lanes of the Western blot were loaded with either 20 μg of total microsomes or eluate from Neutravidin beads obtained from 200 μg of the microsomes (surface fraction). The ratio of the total/surface signals for individual animals was 0.27 ± 0.09 (SD), indicating that 2.7 ± 0.9% of the proteins in the microsomes was recovered in the eluate. Source data are available for this figure: SourceData F7.
Microsomal and surface fractions of βENaC from rat colon. Distal colons from four individual rats were incubated in vitro with an impermeant biotinylating reagent. Lanes of the Western blot were loaded with either 20 μg of total microsomes or eluate from Neutravidin beads obtained from 200 μg of the microsomes (surface fraction). The ratio of the total/surface signals for individual animals was 0.27 ± 0.09 (SD), indicating that 2.7 ± 0.9% of the proteins in the microsomes was recovered in the eluate. Source data are available for this figure: SourceData F7.
Differences in subunit protein abundances could be explained by different levels of mRNA expression. To test this point, we assayed for amounts of mRNA using digital-drop PCR. RNA was isolated from strips of rat kidney cortex. cDNA was prepared and subunit message abundances were compared as shown in Fig. 8. Since each run could assess two species, we compared αENaC with βENaC and γENaC with βENaC in separate assays. Ratios of α/β and γ/β were close to one (Fig. 8 B), implying that the expression levels of mRNA for the three subunits are similar. The absolute numbers of counts were not meaningful.

Assessment of mRNA for α, β, and γENaC in kidney. (A) Digital-drop PCR. cDNA was obtained from reverse transcription of RNA isolated from rat kidney cortex. PCR was performed, and fluorescence intensities of labeled probes were assessed in individual droplets. Magenta lines indicate the assumed boundary between positive and negative droplets. The ratios of positive to negative droplets varied from 33 to 68%. (B) Levels of αENaC and γENaC were measured relative to βENaC. Data are expressed as means ± SD for four independent determinations using samples from different animals. There were no significant differences among subunits. (C) RNAseq of mouse kidney CNTs. Relative counts for ENaC subunits were obtained from collections of CNTs. Data are expressed as means ± SD for six independent determinations using samples from different animals under control conditions. (D) Comparison of mice under control and high-aldosterone conditions. Mice were challenged with a low-Na or a high-K diet to increase circulating aldosterone. Data from the two conditions were similar and combined. Levels of αENaC but not β or γENaC mRNA were increased in the mice with elevated mineralocorticoids.
Assessment of mRNA for α, β, and γENaC in kidney. (A) Digital-drop PCR. cDNA was obtained from reverse transcription of RNA isolated from rat kidney cortex. PCR was performed, and fluorescence intensities of labeled probes were assessed in individual droplets. Magenta lines indicate the assumed boundary between positive and negative droplets. The ratios of positive to negative droplets varied from 33 to 68%. (B) Levels of αENaC and γENaC were measured relative to βENaC. Data are expressed as means ± SD for four independent determinations using samples from different animals. There were no significant differences among subunits. (C) RNAseq of mouse kidney CNTs. Relative counts for ENaC subunits were obtained from collections of CNTs. Data are expressed as means ± SD for six independent determinations using samples from different animals under control conditions. (D) Comparison of mice under control and high-aldosterone conditions. Mice were challenged with a low-Na or a high-K diet to increase circulating aldosterone. Data from the two conditions were similar and combined. Levels of αENaC but not β or γENaC mRNA were increased in the mice with elevated mineralocorticoids.
We also assessed mRNA expression in the mouse kidney using RNAseq. CNT fragments were isolated as in Fig. 2. RNA was analyzed from 50 to 100 fragments from the same animal. Under control conditions the number of sequences detected was similar for the three subunits; the abundance of mRNA for αENaC was ∼25% higher than that for β and γENaC. To verify the ability of the method to detect differences in mRNA levels, we compared CNTs from mice in which aldosterone levels were elevated with either dietary Na depletion or dietary K loading. The abundance of αENaC mRNA was increased by 70% (P = 0.002) with no significant change in the other subunits, in agreement with measurements of whole-kidney mRNA by Northern blot (Asher et al., 1996). Thus, it seems that differences in message abundance do not account for the discrepancy in the relative amounts of ENaC-subunit protein in the kidneys.
Discussion
We present here a simple technique for quantifying the expression of ENaC subunits from the kidneys and colon. The approach requires only an antibody against an epitope of the protein of interest and the same antigenic peptide attached to a carrier protein. We used GFP as the carrier because it is a monomer, it has a size that can be conveniently resolved on SDS-PAGE, and its purification is routine. Although it would be preferable to use recombinant forms of ENaC itself, full-length ENaC subunits are not readily amenable to large-scale purification (Noreng et al., 2018). The use of soluble carriers as described here may have general applications for quantifying the content of membrane proteins.
The possibility that antibody binding to whole subunit proteins and the calibrating peptides might be different is an important caveat in the use of this approach. The problem could be especially acute if proteins refold after transfer from the gel (Kaur and Bachhawat, 2009; #4605). We have addressed this issue by measuring apparent affinities (Fig. 3) and by testing for self-consistency using two different antibodies to different parts of the same protein (Fig. S3). The results suggest that binding to the protein and the probes is similar, but we certainly cannot rule out small differences. Our calculations of copy numbers should therefore be viewed as rough estimates rather than precise determinations.
The technique revealed a large excess of ENaC subunits over the amounts required for Na+ transport. A similar result was reported previously by Firsov et al. (1996) who engineered FLAG epitopes into ENaC subunits and counted surface proteins in Xenopus oocytes using 125I-labeled anti-FLAG antibodies. They defined an effective channel open probability Po,eff,eff = INa/N × iNa, where INa and iNa are the total and single-channel currents and N is the number of channel proteins per oocyte. Measured values were <0.01, much lower than the levels of ∼0.5 observed in patch-clamp recordings. This implied the existence of many channels that are silent or that have a Po of zero or, at best, too low to detect. Our measurements extend these results to native tissues.
In untreated rats or mice on normal chow, ENaC activity is very low in the CNT and CCD (Pácha et al., 1993; Frindt and Palmer, 2004), although higher in cells near the junction of the DCT and the CNT (Nesterov et al., 2012; Yang et al., 2020). Under these conditions, most ENaC subunits are in unprocessed states defined by lack of cleavage (α and γ) and sensitivity to endoglycosidase H (β and γ; Masilamani et al., 1999; Ergonul et al., 2006; Frindt et al., 2016). Furthermore, immunocytochemistry indicates that most ENaC proteins are intracellular (Loffing et al., 2000b; Loffing et al., 2001). Our results imply that the number of subunits within the cell awaiting processing and translocation to the plasma membrane is at least two orders of magnitude larger than that needed for maximal transport activity (Fig. 2 and Table 1). Other membrane transport proteins, including the nicotinic ACh receptor, like ENaC a heteromultimeric ion channel, exhibit a low efficiency of assembly from subunits (Green, 1999). The excess expression in the cell may allow rapid regulation of surface expression of the channels through changes in that efficiency, without increasing the total number of subunits.
When aldosterone levels increase with dietary Na restriction or K loading, or when the hormone is administered exogenously, a substantial fraction of channels undergoes proteolytic cleavage and further glycosylation. At least some of these channels are inserted into the apical membrane as judged by their accessibility to impermeant biotinylating reagents (Frindt et al., 2008; Frindt et al., 2016). Our measurements permit order-of-magnitude estimates for subunit abundance in different states and compartments under basal and stimulated conditions as indicated in Fig. 9. Here we used previous findings that with dietary Na restriction overall βENaC expression increases 1.5-fold, and that about 50% of the subunits achieve mature, EndoH-resistance glycosylation (Ergonul et al., 2006). We assume that 5% of the total βENaC is at the surface (Fig. 4) and that this is a fourfold increase over basal levels (Frindt et al., 2008; Frindt et al., 2016). For functional expression, we took a value of 2,000 channels/cell under stimulated conditions and assume 10% of this value under basal conditions, mostly representing cells in the late DCT/early CNT (Yang et al., 2021). The picture suggests large excesses of processed, presumably fully assembled channels, and even of assembled channels at the cell surface. This pool of ENaC would be available for even more rapid recruitment.

Estimates of βENaC abundance in compartments of a CNT principal cell under basal and stimulated conditions. Channels can be unprocessed (red), presumably in the ER and early Golgi, processed and intracellular (orange) in Golgi and post-Golgi vesicles, processed in the apical membrane (yellow), or actively conducting (green).
Estimates of βENaC abundance in compartments of a CNT principal cell under basal and stimulated conditions. Channels can be unprocessed (red), presumably in the ER and early Golgi, processed and intracellular (orange) in Golgi and post-Golgi vesicles, processed in the apical membrane (yellow), or actively conducting (green).
The asymmetry of subunit protein expression was unexpected. Although equal numbers are required for channel formation, amounts of β and γENaC were substantially larger than those of αENaC. The difference was not mirrored in the levels of mRNA, so the effect presumably reflects differences in rates of protein synthesis and/or degradation. The excess of β and γ subunits implies that not all the ENaC within the cell is in the trimeric αβγ form. Many of the β and γ subunits must be either uncomplexed or in non-canonical assemblies such as ββγ or βγγ. At this time, we cannot resolve a similar issue regarding the stoichiometry of excess subunits at the cell surface. This would require methods to more quantitatively label all three subunits in the apical membrane.
Differences in subunit abundances might also be related to channel regulation, and in the kidney, aldosterone increases the abundance of αENaC, but not those of β or γENaC. However, previous studies showed that stimulation of αENaC expression is not sufficient for increased channel function or surface expression (Frindt and Palmer, 2012). Furthermore, the colon had the same asymmetry in subunit expression even though in that tissue α is constitutively expressed while β and γENaC are aldosterone dependent. Possibly the different subunits have different efficiencies of incorporation into trimeric proteins.
Acknowledgments
Joseph A. Mindell served as editor.
This work was supported by National Institutes of Health grant R01-DK111380 (to L.G. Palmer).
The authors declare no competing financial interests.
Author contributions: L.G. Palmer conceived the project. J.R. Meyerson designed and produced calibration probes. L.G. Palmer designed and analyzed Western blot assays. J.M. Scandura designed and analyzed ddPCR assays. G. Frindt and A. Satty carried out experiments. L.G. Palmer drafted the manuscript. G. Frindt and J.R. Meyerson edited the manuscript. All authors approved the final version of the manuscript.
References
This work is part of a special issue on Structure and Function of Ion Channels in Native Cells and Macromolecular Complexes.

