


Metastatic progression is a major cause of radiotherapy (RT) failure, yet the mechanisms linking RT to immune suppression and metastasis remain unclear. Here, we identify YTHDF2 as a radiation-induced immune checkpoint in dendritic cells (DCs). By analyzing patient biopsies from a clinical trial (NCT03223155), we discover that increased YTHDF2 expression in DCs after RT correlates with treatment failure after RT. Mechanistically, ionizing radiation induces SPI1, which drives transcription of Ythdf2 in DCs. Upregulated YTHDF2 promotes m6A-mediated degradation of Notch pathway regulators (Mfng, Aph1b, Aph1c), impairing MHC-I cross-presentation and CD8+ T cell activation, thereby facilitating tumor immune evasion and metastatic spread. Crucially, targeting YTHDF2 restores DC immunogenicity, enhances RT-induced tumor control, and improves DC-based cancer vaccines when combined with RT, providing a clinically actionable strategy to overcome RT resistance and metastasis.

Introduction
Radiotherapy (RT) is a widely used cancer treatment, but its effectiveness is often compromised by immune suppression and distant metastasis (Wang et al., 2024a; Weichselbaum et al., 2017). While RT can enhance CD8+ T cell activation by promoting dendritic cell (DC)–mediated antigen presentation, it also triggers immunosuppressive pathways that weaken systemic antitumor immunity (Demaria et al., 2004; Lee et al., 2009). RT has been shown to suppress DC type I interferon signaling (Hou et al., 2018), induce DC production of immunoregulatory cytokine CCL22 (Bugno et al., 2024), and upregulate inhibitory molecules such as PD-L1 in DCs (Hou et al., 2024), contributing to tumor progression and metastatic spread. Despite efforts to combine RT with immune checkpoint blockade, clinical trials have yielded limited success (Bestvina et al., 2022; Spaas et al., 2023), highlighting the need for identifying new therapeutic targets in DCs to enhance RT efficacy and prevent metastatic escape.
RNA N6-methyladenosine (m6A) modifications are key regulators of immune function (Chen et al., 2024; Dong et al., 2021; Ma et al., 2023; Su et al., 2020; Wang et al., 2023; Wang et al., 2024b; Xiao et al. 2024), yet their roles in DC-driven antitumor immunity remain to be fully elucidated. Among m6A reader proteins, YTHDF1 enhances mRNA translation (Wang et al., 2015), while YTHDF2 primarily promotes mRNA decay (Wang et al., 2014), both playing distinct roles in immune regulation. YTHDF1 is a key regulator of antigen processing, as our previous work showed that YTHDF1-m6A machinery facilitates the translation of lysosomal cathepsins in DCs, leading to excessive degradation of ingested neoantigens and impaired antitumor immunity (Han et al., 2019; Wen et al., 2024). In contrast, YTHDF2 plays a broader role in mRNA stability and has been implicated in critical biological processes such as cell cycle regulation (Fei et al., 2020), stress response (Yu et al., 2019), hematopoietic stem cell expansion (Li et al., 2018b; Paris et al., 2019), and immune cell differentiation (Zhang et al., 2024). However, its role in DC immunogenicity, RT response, and metastatic progression remains unknown.
Here, we identify YTHDF2 as a radiation-induced immune checkpoint in DCs that drives tumor immune evasion and metastatic progression. Analysis of patient biopsies from a clinical trial (NCT03223155) reveals that RT-induced YTHDF2 expression in DCs correlates with disease progression. We further identify the transcription factor (TF) regulating YTHDF2 expression after RT, define the role of YTHDF2 in DC-mediated antitumor immunity, and identify the target genes that control DC MHC-I antigen presentation. Notably, we demonstrate that pharmacologically blocking of YTHDF2 restores DC immunogenicity and enhances the efficacy of DC-based vaccines, offering a promising strategy to improve RT outcomes and prevent metastasis.
Results
Radiation induces YTHDF2 expression in DCs of patients with metastasis progression
To explore the relationship between YTHDF2 expression and radiation, we quantified YTHDF2 expression in patients and murine models following irradiation. We first collected the peripheral blood mononuclear cells (PBMCs) prior to and following RT from patients treated on a phase I clinical trial (COSINR, NCT03223155) at our institution (Fig. S1 A and Table S1) (Bestvina et al., 2022; Spurr et al., 2022). Patients received stereotactic body RT (SBRT) and either concurrent or sequential immunotherapy (ipilimumab and nivolumab) as a first-line treatment for metastatic non–small-cell lung cancer (NSCLC). We performed spectral flow cytometry to examine the YTHDF2 protein level in various immune cell populations from PBMCs of paired pre- and post-RT samples (Fig. S1 A for gating strategy). We observed that the YTHDF2 expression level was significantly increased in DCs following ionized radiation (IR) (Fig. 1, A and B) to a higher degree than other immune cells such as CD4+ T cells, CD8+ T cells, and monocytes (Fig. 1 C). To evaluate the correlation between induction of YTHDF2 expression by RT and tumor progression, we separated patients into responders who did not progress at distant sites after treatment and nonresponders whose lesions progressed at distant sites (Bestvina et al., 2022; Spurr et al., 2022). There were no significant changes in DC frequency between responders and nonresponders before and after IR (Fig. S1, B and D). However, the YTHDF2 protein level significantly increased following IR in nonresponders but not in responders (Fig. 1 D), indicating that YTHDF2 in DCs is associated with metastatic disease progression. We further analyzed YTHDF2 expression levels in patients prior to IR treatment, and we found no significant differences between responders and nonresponders (Fig. S1 F). This suggests that elevated YTHDF2 expression is not generally associated with disease progression, but more specifically linked to the RT-treated subgroup.
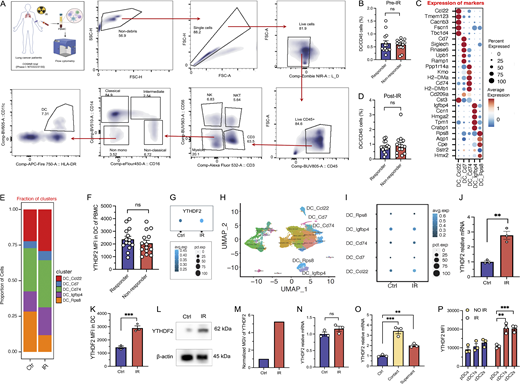
IR induces YTHDF2 expression in DC. (A) Schematic illustration of patients’ PBMCs from the COSINR trial for YTHDF2 detection. Gating strategy of DCs from PBMCs of lung cancer patients in the COSINR trial. (B) DC frequency in CD45+ cells of PBMCs before IR (n = 14). (C) Dot plot of marker gene expression in tumor-infiltrating DC subsets. (D) DC frequency in CD45+ cells of PBMCs after IR (n = 14). (E) Proportion of DC subsets from tumors with or without IR treatment. (F) YTHDF2 expression in DCs from responder or nonresponder patients’ PBMCs prior to IR treatment (n = 14). (G) Dot plot representing percent expression and average expression of YTHDF2 in DCs before or after IR. (H) UMAP displaying different clusters of tumor-infiltrating DCs with control mice or IR treatment by scRNA-seq analysis. (I) Dot plot representing percent expression and average expression of YTHDF2 in different clusters of tumor-infiltrating DCs by control or IR treatment. (J) YTHDF2 relative mRNA expression in Flt3l DCs cocultured with MC38-OZ tumors with or without IR (n = 3). (K) YTHDF2 MFI in DCs cocultured with MC38-OZ tumor cells, which were treated with or without IR (n = 3). (L) Western blotting of the YTHDF2 protein in Flt3l DCs cocultured with MC38-OZ tumors treated with or without IR. (M) Normalized MGV of western blotting results in Fig. 1 L. (N) YTHDF2 relative mRNA expression in Flt3l DCs directly treated with or without IR (n = 3). (O) YTHDF2 mRNA expression in DCs cocultured with irradiated tumor cells or supernatant of tumor cell culture medium (n = 3). (P) YTHDF2 MFI in different subpopulations of DCs cocultured with irradiated or nonirradiated tumor cells. Statistical analysis was performed using unpaired Student’s t test (B, D, F, J–K, and N–P); ns = not significant, P > 0.05; **P < 0.01; ***P < 0.001. Data are represented as the mean ± SEM, and n = number of samples. MGV, mean gray value. Source data are available for this figure: SourceData FS1.
IR induces YTHDF2 expression in DC. (A) Schematic illustration of patients’ PBMCs from the COSINR trial for YTHDF2 detection. Gating strategy of DCs from PBMCs of lung cancer patients in the COSINR trial. (B) DC frequency in CD45+ cells of PBMCs before IR (n = 14). (C) Dot plot of marker gene expression in tumor-infiltrating DC subsets. (D) DC frequency in CD45+ cells of PBMCs after IR (n = 14). (E) Proportion of DC subsets from tumors with or without IR treatment. (F) YTHDF2 expression in DCs from responder or nonresponder patients’ PBMCs prior to IR treatment (n = 14). (G) Dot plot representing percent expression and average expression of YTHDF2 in DCs before or after IR. (H) UMAP displaying different clusters of tumor-infiltrating DCs with control mice or IR treatment by scRNA-seq analysis. (I) Dot plot representing percent expression and average expression of YTHDF2 in different clusters of tumor-infiltrating DCs by control or IR treatment. (J) YTHDF2 relative mRNA expression in Flt3l DCs cocultured with MC38-OZ tumors with or without IR (n = 3). (K) YTHDF2 MFI in DCs cocultured with MC38-OZ tumor cells, which were treated with or without IR (n = 3). (L) Western blotting of the YTHDF2 protein in Flt3l DCs cocultured with MC38-OZ tumors treated with or without IR. (M) Normalized MGV of western blotting results in Fig. 1 L. (N) YTHDF2 relative mRNA expression in Flt3l DCs directly treated with or without IR (n = 3). (O) YTHDF2 mRNA expression in DCs cocultured with irradiated tumor cells or supernatant of tumor cell culture medium (n = 3). (P) YTHDF2 MFI in different subpopulations of DCs cocultured with irradiated or nonirradiated tumor cells. Statistical analysis was performed using unpaired Student’s t test (B, D, F, J–K, and N–P); ns = not significant, P > 0.05; **P < 0.01; ***P < 0.001. Data are represented as the mean ± SEM, and n = number of samples. MGV, mean gray value. Source data are available for this figure: SourceData FS1.
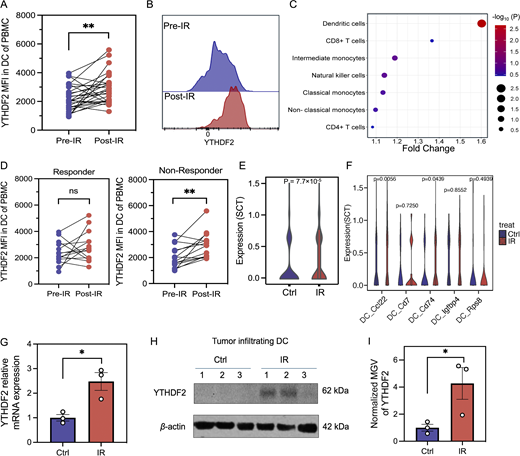
IR induces YTHDF2 expression in DCs. (A) MFI of YTHDF2 in DCs of PBMCs collected from lung cancer patients before and after RT. The post-RT blood samples were collected approximately 1–3 wk (median 2 wk) after the collection of pre-RT samples (n = 28). (B) Representative histogram of YTHDF2 expression in DCs of patients presented in A before RT and after RT. (C) Dot bubble plot of YTHDF2-level changes in DCs induced by IR across different types of immune cells in PBMCs of patients. (D) YTHDF2 level in DCs of paired PBMCs from responders (n = 14) and nonresponder patients (n = 14). (E) Violin plot of YTHDF2 expression in MC38 tumor-infiltrating DCs of tumors treated by control or IR. (F) Violin plot of YTHDF2 expression across different clusters of tumor-infiltrating DCs of tumors treated by control or IR. (G) YTHDF2 mRNA expression by qPCR in DCs isolated from tumor received IR or control treatment (n = 3). (H) Western blotting of the YTHDF2 protein in DCs isolated from MC38 tumor treated by control or IR. 1–3, number of repeats (n = 3). (I) Normalized MGV of western blotting results in Fig. 1 H (n = 3). Statistical analysis was performed using two-sided paired Student’s t test (A and D) and unpaired Student’s t test (E–G and I); ns = not significant, P > 0.05; *P < 0.05; **P < 0.01. Data are represented as the mean ± SEM, and n = number of samples. MGV, mean gray value. Source data are available for this figure: SourceData F1.
IR induces YTHDF2 expression in DCs. (A) MFI of YTHDF2 in DCs of PBMCs collected from lung cancer patients before and after RT. The post-RT blood samples were collected approximately 1–3 wk (median 2 wk) after the collection of pre-RT samples (n = 28). (B) Representative histogram of YTHDF2 expression in DCs of patients presented in A before RT and after RT. (C) Dot bubble plot of YTHDF2-level changes in DCs induced by IR across different types of immune cells in PBMCs of patients. (D) YTHDF2 level in DCs of paired PBMCs from responders (n = 14) and nonresponder patients (n = 14). (E) Violin plot of YTHDF2 expression in MC38 tumor-infiltrating DCs of tumors treated by control or IR. (F) Violin plot of YTHDF2 expression across different clusters of tumor-infiltrating DCs of tumors treated by control or IR. (G) YTHDF2 mRNA expression by qPCR in DCs isolated from tumor received IR or control treatment (n = 3). (H) Western blotting of the YTHDF2 protein in DCs isolated from MC38 tumor treated by control or IR. 1–3, number of repeats (n = 3). (I) Normalized MGV of western blotting results in Fig. 1 H (n = 3). Statistical analysis was performed using two-sided paired Student’s t test (A and D) and unpaired Student’s t test (E–G and I); ns = not significant, P > 0.05; *P < 0.05; **P < 0.01. Data are represented as the mean ± SEM, and n = number of samples. MGV, mean gray value. Source data are available for this figure: SourceData F1.
To explore the YTHDF2 of DCs in the tumor immune microenvironment, we characterized murine CD45+ immune cells from irradiated (4 days after IR) and nonirradiated MC38 tumors via single-cell RNA sequencing (scRNA-seq). The average mRNA level of YTHDF2 significantly increased in tumor-infiltrating DCs after IR (Fig. 1 E and Fig. S1 G). We further identified five major subsets of DCs with markers of Ccl22, Cd74, Cd7, Igfbp4, and Rps8 (Fig. S1, C, E, and H) and then characterized the changes within DC subtypes in irradiated tumors compared with nonirradiated tumors. We observed that YTHDF2 mRNA levels were significantly elevated in Ccl22 DCs (mregDCs) and Cd74 DCs in tumors following IR (Fig. 1 F and Fig. S1 I). Next, we collected tumor-infiltrating DCs by gating live CD45+CD11c+MHC-II+Ly6C−F4/80− cells at day 5 after IR and confirmed that the YTHDF2 mRNA level in DCs increased after IR (Fig. 1 G). The protein level of YTHDF2 was also upregulated in tumor-infiltrating DCs treated with IR (Fig. 1, H and I). When cocultured with irradiated MC38-OT1-zsgreen (MC38-OZ) tumor cells, Flt3l-induced bone marrow–derived DC (BMDCs) exhibited elevated YTHDF2 at both mRNA and protein levels compared with that of DCs cocultured with unirradiated MC38-OZ cells (Fig. S1, J–M). Direct irradiation (5 Gy) of BMDCs did not contribute to the induction of YTHDF2 (Fig. S1 N). To investigate the tumor-derived signals that regulate Ythdf2 in DCs, we compared cocultures using irradiated tumor cell–conditioned supernatant, and irradiated tumor cells with the medium removed. We found that both direct cell–cell contact and soluble factors contribute to Ythdf2 induction (Fig. S1 O), but the effect was over threefold greater in conditions with direct cell contact. Moreover, YTHDF2 expression is specifically increased in both cDC1 and cDC2 populations upon IR rather than in pDCs (Fig. S1 P), suggesting that the effect observed in Fig. 1 G is primarily driven by conventional DC subsets. Taken together, these results demonstrate that IR induces YTHDF2 expression in DCs in both clinical and preclinical settings and that YTHDF2 induction in DCs could play a role in metastatic cancer progression.
SPI1 promotes transcription of Ythdf2 in the context of IR
To investigate the potential mechanisms of YTHDF2 induction by IR, we analyzed tumor-infiltrating DCs collected 5 days after IR using RNA-seq. Gene Ontology (GO) enrichment analysis indicated that IR impacted multiple biological processes of DCs, including upregulation (Fig. S2 A) and downregulation of pathways (Fig. S2 B) involved in transcriptional activities such as those regulated by various TFs (e.g., Ctcf, Irf4, Spi1, Jund, Rela) (Fig. 2 A). In parallel, we used the cell signaling pathway project database (Ochsner et al., 2019) to evaluate protein binding to the Ythdf2 promoter by assessing model-based analysis of the ChIP-seq2 (MACS2) score. Several TFs, including SPI1, CTCF, MEIS, EIF, and RELA, showed a top MACS2 score for Ythdf2, indicating potential binding TFs (Fig. 2 B). Integrating the MACS2 score and RNA-seq output, we identified three TFs (SPI1, RELA, and BATF) as top candidates, which could affect the transcription of Ythdf2 (Fig. 2 C).

SPI1 promotes transcription of Ythdf2 in the context of IR. (A) GO enrichment analysis of upregulated transcription pathways in tumor-infiltrating DCs of IR versus non-IR. (B) GO enrichment analysis of downregulated transcription pathways in tumor-infiltrating DCs of IR versus non-IR. (C) ChIP-qPCR results showing RELA binding to the promoter region of Ythdf2 (n = 3). (D) ChIP-qPCR results showing BATF binding to the promoter region of Ythdf2 (n = 3). (E–G) ChIP-qPCR results showing SPI1 (E), BATF (F), and RELA (G) binding to the promoter region of Ythdf2 at different time points (n = 3). (H)Ythdf2 mRNA expression in RelA KD DCs with or without irradiation (n = 3). (I)Ythdf2 mRNA expression in Batf KD DCs with or without irradiation (n = 3). (J) mRNA expression of relevant genes in DCs with or without siRNA treatment (n = 3). (K) Quantification of the SPI1 level in Fig. 2 F. Statistical analysis was performed using two-sided unpaired Student’s t test (C, D, and H–J); ns, P > 0.05; ***P < 0.001. Data are represented as the mean ± SEM.
SPI1 promotes transcription of Ythdf2 in the context of IR. (A) GO enrichment analysis of upregulated transcription pathways in tumor-infiltrating DCs of IR versus non-IR. (B) GO enrichment analysis of downregulated transcription pathways in tumor-infiltrating DCs of IR versus non-IR. (C) ChIP-qPCR results showing RELA binding to the promoter region of Ythdf2 (n = 3). (D) ChIP-qPCR results showing BATF binding to the promoter region of Ythdf2 (n = 3). (E–G) ChIP-qPCR results showing SPI1 (E), BATF (F), and RELA (G) binding to the promoter region of Ythdf2 at different time points (n = 3). (H)Ythdf2 mRNA expression in RelA KD DCs with or without irradiation (n = 3). (I)Ythdf2 mRNA expression in Batf KD DCs with or without irradiation (n = 3). (J) mRNA expression of relevant genes in DCs with or without siRNA treatment (n = 3). (K) Quantification of the SPI1 level in Fig. 2 F. Statistical analysis was performed using two-sided unpaired Student’s t test (C, D, and H–J); ns, P > 0.05; ***P < 0.001. Data are represented as the mean ± SEM.
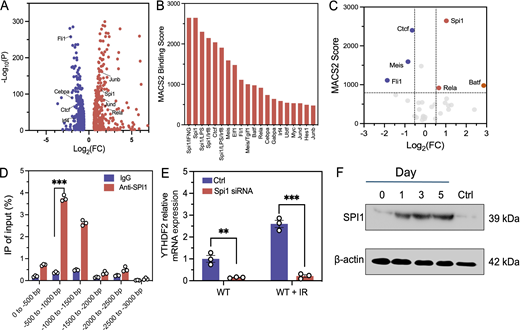
SPI1 promotes transcription of Ythdf2 in the context of IR. (A) Volcano plot of differentially expressed genes from upregulated (red) and downregulated (blue) transcription pathways of tumor-infiltrating DCs (WT+IR versus WT+control). (B) Bar chart showing the MACS2 score of top 20 ranked TFs binding to Ythdf2. A higher MACS2 score indicates the higher capability of TF binding to Ythdf2. (C) Integrated volcano plot of MACS2 score and differential expressed TF genes, upregulated (red) and downregulated (blue), for Ythdf2 transcription in DCs (WT+IR versus WT+control). (D) ChIP-qPCR results showing SPI1 binding to the promoter region of Ythdf2 (n = 3). (E)Ythdf2 mRNA expression in Spi1 KD DCs cocultured with control or irradiated tumor cells (n = 3). (F) SPI1 protein level in tumor-infiltrating DCs at different days after IR (20 Gy). Statistical analysis was performed using two-sided unpaired Student’s t test (D and E); **P < 0.01; ***P < 0.001. Data are represented as the mean ± SEM. Source data are available for this figure: SourceData F2.
SPI1 promotes transcription of Ythdf2 in the context of IR. (A) Volcano plot of differentially expressed genes from upregulated (red) and downregulated (blue) transcription pathways of tumor-infiltrating DCs (WT+IR versus WT+control). (B) Bar chart showing the MACS2 score of top 20 ranked TFs binding to Ythdf2. A higher MACS2 score indicates the higher capability of TF binding to Ythdf2. (C) Integrated volcano plot of MACS2 score and differential expressed TF genes, upregulated (red) and downregulated (blue), for Ythdf2 transcription in DCs (WT+IR versus WT+control). (D) ChIP-qPCR results showing SPI1 binding to the promoter region of Ythdf2 (n = 3). (E)Ythdf2 mRNA expression in Spi1 KD DCs cocultured with control or irradiated tumor cells (n = 3). (F) SPI1 protein level in tumor-infiltrating DCs at different days after IR (20 Gy). Statistical analysis was performed using two-sided unpaired Student’s t test (D and E); **P < 0.01; ***P < 0.001. Data are represented as the mean ± SEM. Source data are available for this figure: SourceData F2.
To further examine the binding of these TFs to the YTHDF2 promoter in DCs following IR, we performed chromatin immunoprecipitation (ChIP)–quantitative PCR (qPCR) using BMDCs. The results showed that SPI1 directly binds to the promoter region of Ythdf2 (0.5–1.0 kb proximal to the transcription start site, Fig. 2 D), whereas RELA and BATF also showed binding to the Ythdf2 region at 0–0.5 kb (Fig. S2 C) and 0.5–1.0 kb (Fig. S2 D), respectively. To study the time course of binding to the YTHDF2 promoter, we performed ChIP-qPCR for SPI1, RELA, and BATF binding at the Ythdf2 promoter at multiple time points (0, 0.5, 1, 2, and 4 h) after IR. SPI1 binding peaked at 1–2 h after irradiation (Fig. S2 E); BATF and RELA showed transient binding, peaking at 1 h, but declined thereafter (Fig. S2, F and G). To further validate the function of TFs, we knocked down Spi1, Rela, and Batf in DCs and measured Ythdf2 mRNA levels in DCs cocultured with irradiated or unirradiated tumor cells. We observed that Spi1 knockdown (KD) significantly decreased the Ythdf2 expression in DCs (Fig. 2 E), whereas no significant changes in Ythdf2 expression were observed in Rela/Batf KD DCs (Fig. S2, H–J). The results suggested that SPI1 is an important TF directly promoting the expression of Ythdf2, whereas RELA and BATF transiently bind but are not essential for YTHDF2 induction. As SPI1 affects Ythdf2 expression regardless of IR, we sought to study whether IR induces SPI1 expression. We performed SPI1 western blots using DCs isolated from tumors 5 days after IR. The results showed that IR directly increased the SPI1 protein level in a time-dependent manner, with the largest increase at days 3 and 5 after IR (Fig. 2 F and Fig. S2 K). Taken together, these results showed that IR upregulates Ythdf2 expression by enhancing the protein level of SPI1, which directly binds to the Ythdf2 promoter and increases Ythdf2 transcription.
YTHDF2 loss in CD11c+ cells enhances local tumor control and inhibits distant metastasis in RT
Given that the expression of YTHDF2 in DCs is induced by IR and that the level of YTHDF2 induction was significant in patients who failed to respond to IR and immune checkpoint inhibitor (ICI) treatment, we hypothesized that YTHDF2 in DCs plays a potential checkpoint role in the context of antigen presentation in response to RT. To investigate this hypothesis, we crossed C57BL/6J background Ythdf2flox/flox mice with Itgaxcre (Cd11cCre) mice to obtain Cd11cCreYthdf2flox/flox conditional knockout mice (abbreviated as Ythdf2-cKO or cKO). Ythdf2f/f mice served as a wild-type (WT) control for Ythdf2-cKO studies. In the MC38 murine colon carcinoma model, primary tumor growth of Ythdf2-cKO mice was similar to that of WT mice in the absence of IR (Fig. 3 A). However, tumor irradiation significantly inhibited the growth of MC38 tumors in Ythdf2-cKO mice in comparison with tumors in WT mice. In the B16F10-OT1-zsgreen (B16F10-OZ) melanoma tumor model, we observed a similar phenotype of tumor growth (Fig. S3 A) in which B16F10-OZ tumors were significantly inhibited by IR in Ythdf2-cKO compared with tumors in WT mice. In addition to improved local tumor response, the survival of tumor-bearing Ythdf2-cKO mice was also significantly prolonged following IR compared with WT mice (Fig. S3 B).

YTHDF2 deficiency in DCs potentiates RT. (A) MC38 tumor growth curves in WT mice or Ythdf2-cKO mice with or without IR treatment (20 Gy). 1 million tumor cells were injected s.c., and tumors were irradiated when sizes reached around 120 mm3 (on day 12) (n = 5, mean ± SD). (B) LLC tumor growth curves in WT or Ythdf2-cKO mice with or without IR treatment (20 Gy). 1 million tumor cells were injected s.c., and tumors were irradiated when sizes reached around 100 mm3 (day 10 after implantation) (n = 5, mean ± SD). (C) H&E staining of lungs of LLC tumor–bearing mice 30 days after tumor inoculation; scale bars: 2 mm. Treatments are as indicated in B. (D) Quantification of total area of metastasis in lungs of C, using QuPath (n = 5, mean ± SEM). (E) CT images of mice at different time points (red color indicating tumor area) and representative calculated tumor contours (green) on day 25. KPC tumor cells were injected orthotopically in the pancreas. IR treatment (6 Gy dose) was delivered guided by CT imaging on day 11. (F) Growth curves of orthotopic KPC tumors in WT or Ythdf2-cKO mice with or without IR treatment (n = 5, mean ± SD). Statistical analysis was performed using two-sided unpaired Student’s t test (A, B, D, and F); ***P < 0.001. H&E, hematoxylin and eosin; s.c., subcutaneously.
YTHDF2 deficiency in DCs potentiates RT. (A) MC38 tumor growth curves in WT mice or Ythdf2-cKO mice with or without IR treatment (20 Gy). 1 million tumor cells were injected s.c., and tumors were irradiated when sizes reached around 120 mm3 (on day 12) (n = 5, mean ± SD). (B) LLC tumor growth curves in WT or Ythdf2-cKO mice with or without IR treatment (20 Gy). 1 million tumor cells were injected s.c., and tumors were irradiated when sizes reached around 100 mm3 (day 10 after implantation) (n = 5, mean ± SD). (C) H&E staining of lungs of LLC tumor–bearing mice 30 days after tumor inoculation; scale bars: 2 mm. Treatments are as indicated in B. (D) Quantification of total area of metastasis in lungs of C, using QuPath (n = 5, mean ± SEM). (E) CT images of mice at different time points (red color indicating tumor area) and representative calculated tumor contours (green) on day 25. KPC tumor cells were injected orthotopically in the pancreas. IR treatment (6 Gy dose) was delivered guided by CT imaging on day 11. (F) Growth curves of orthotopic KPC tumors in WT or Ythdf2-cKO mice with or without IR treatment (n = 5, mean ± SD). Statistical analysis was performed using two-sided unpaired Student’s t test (A, B, D, and F); ***P < 0.001. H&E, hematoxylin and eosin; s.c., subcutaneously.

YTHDF2 depletion in DC boosts RT antitumor immunity by enhancing antigen cross-presentation. (A) B16F10-OZ tumor growth curves in WT and Ythdf2-cKO mice with or without IR (n = 5, mean ± SD). (B) Survival rate of B16F10-OZ–inoculating mice with or without IR. (C) Scheme of KPC344 orthotopic pancreatic cancer models and treatment of CT imaging–guided RT. (D–I) Flow cytometry on immune profiles of (D) CD4+ T cells, (E) CD8+ T cells, (F) macrophages, (G) cDCs, (H) cDC1s, and (I) cDC2s residential in B16F10-OZ tumors on day 5 after IR (n = 5, mean ± SEM). (J) CFSE+ DC frequency in tumor-infiltrating DCs (n = 4, mean ± SEM). (K and L) MFI of (K) CD80 and (L) CD86 in BMDCs (n = 3, mean ± SEM). (M) Viability of DCs before and after coculturing with CD8+ T cells (n = 3, mean ± SEM). (N) ELISPOT assay on IFN-γ secreted by CD8+ T cells stimulated with YTHDF2 inhibitor–treated DCs in coculture with irradiated or nonirradiated tumor cells (n = 4, mean ± SEM). (O) ELISPOT assay on IFN-γ secreted by CD8+ T cells stimulated with WT or cKO DCs in coculture with irradiated or nonirradiated tumor cells (n = 4, mean ± SEM). (P) MFI of H2Kb-SIINFEKL in migratory DCs from WT or cKO mice inoculated with B16-OVA tumors (n = 3, mean ± SEM). (Q) ELISPOT assay on IFN-γ secreted by CD8+ T cells stimulated with migratory DCs in WT or cKO mice inoculated with B16-OVA tumor cells (n = 3, mean ± SEM). (R) ELISPOT assay on IFN-γ secreted by CD8+ T cells stimulated with WT or cKO DCs cocultured with different concentrations of SIINFEKL (n = 3, mean ± SEM). (S) MFI of H2Kd in BMDCs cocultured with irradiated 4T1-HA cells (n = 3, mean ± SEM). (T) MFI of H2Kd-HA tetramer–positive CD8+ T cells, which were stimulated with DCs cocultured with irradiated 4T1-HA cells (n = 3, mean ± SEM). (U) B16F10-OZ tumor growth curves on mice with CD8+ T cell depletion by αCD8 (200 μg/mouse, twice weekly), starting 1 day before IR (n = 5, mean ± SD). (V) H&E staining of lungs collected from LLC tumor–bearing mice 30 days after tumor inoculation; scale bars: 2 mm. Statistical analysis was performed using two-sided unpaired Student’s t test (A and D–U); ns, P > 0.05; *P < 0.05; **P < 0.01; ***P < 0.001.
YTHDF2 depletion in DC boosts RT antitumor immunity by enhancing antigen cross-presentation. (A) B16F10-OZ tumor growth curves in WT and Ythdf2-cKO mice with or without IR (n = 5, mean ± SD). (B) Survival rate of B16F10-OZ–inoculating mice with or without IR. (C) Scheme of KPC344 orthotopic pancreatic cancer models and treatment of CT imaging–guided RT. (D–I) Flow cytometry on immune profiles of (D) CD4+ T cells, (E) CD8+ T cells, (F) macrophages, (G) cDCs, (H) cDC1s, and (I) cDC2s residential in B16F10-OZ tumors on day 5 after IR (n = 5, mean ± SEM). (J) CFSE+ DC frequency in tumor-infiltrating DCs (n = 4, mean ± SEM). (K and L) MFI of (K) CD80 and (L) CD86 in BMDCs (n = 3, mean ± SEM). (M) Viability of DCs before and after coculturing with CD8+ T cells (n = 3, mean ± SEM). (N) ELISPOT assay on IFN-γ secreted by CD8+ T cells stimulated with YTHDF2 inhibitor–treated DCs in coculture with irradiated or nonirradiated tumor cells (n = 4, mean ± SEM). (O) ELISPOT assay on IFN-γ secreted by CD8+ T cells stimulated with WT or cKO DCs in coculture with irradiated or nonirradiated tumor cells (n = 4, mean ± SEM). (P) MFI of H2Kb-SIINFEKL in migratory DCs from WT or cKO mice inoculated with B16-OVA tumors (n = 3, mean ± SEM). (Q) ELISPOT assay on IFN-γ secreted by CD8+ T cells stimulated with migratory DCs in WT or cKO mice inoculated with B16-OVA tumor cells (n = 3, mean ± SEM). (R) ELISPOT assay on IFN-γ secreted by CD8+ T cells stimulated with WT or cKO DCs cocultured with different concentrations of SIINFEKL (n = 3, mean ± SEM). (S) MFI of H2Kd in BMDCs cocultured with irradiated 4T1-HA cells (n = 3, mean ± SEM). (T) MFI of H2Kd-HA tetramer–positive CD8+ T cells, which were stimulated with DCs cocultured with irradiated 4T1-HA cells (n = 3, mean ± SEM). (U) B16F10-OZ tumor growth curves on mice with CD8+ T cell depletion by αCD8 (200 μg/mouse, twice weekly), starting 1 day before IR (n = 5, mean ± SD). (V) H&E staining of lungs collected from LLC tumor–bearing mice 30 days after tumor inoculation; scale bars: 2 mm. Statistical analysis was performed using two-sided unpaired Student’s t test (A and D–U); ns, P > 0.05; *P < 0.05; **P < 0.01; ***P < 0.001.
The enhanced effect of IR in controlling local tumor growth was also observed in Lewis lung carcinoma (LLC) tumors grown in Ythdf2-cKO mice compared with tumors in WT mice (Fig. 3 B). LLC flank tumors spontaneously metastasize to the lung within 30 days after implantation. Quantification of LLC lung metastases at the study endpoint showed a reduction in metastatic burden in the lungs of Ythdf2-cKO mice of which primary tumors received IR compared with those of WT mice that received IR treatment (Fig. 3, C and D). To examine whether the Ythdf2 deficiency in CD11c+ cells elicited an antitumor effect in an orthotopic model, we used pancreatic cancer cell line derived from KrasLSL-G12D;p53LoxP;Pdx1-CreER mice (KPC344) to establish pancreatic tumors (Fig. S3 C). Tumors were imaged by small animal computed tomography (CT) and irradiated using CT-guided RT (Fig. S3 C). IR alone did not significantly reduce the pancreatic tumor burden in WT mice; however, IR significantly reduced KrasG12D/+p53R172H/+Pdx1Cre (KPC) tumor burden in Ythdf2-cKO mice (Fig. 3, E and F). Taken together, these results demonstrated that the deletion of Ythdf2 in CD11c+ cells significantly enhanced the therapeutic efficacy of RT not only by improving tumor control of flank or orthotopic primary tumors, but also by inhibiting spontaneous metastases.
YTHDF2 regulates cross-presentation capacity of DCs in the context of IR
To examine the impact of Ythdf2 deficiency in DCs on the tumor immune landscape, we performed spectral flow cytometry analysis of B16 melanoma–infiltrating immune cells. A t-distributed stochastic neighbor embedding clustering analysis (tSNE) (Fig. 4 A) demonstrated that IR increased the proportions of CD8+ T cells and macrophages in CD45+ cells of WT mice (Fig. 4, A and B), while frequencies of DCs and CD4+ T cells were not significantly altered. In tumors grown in Ythdf2 cKO mice, IR increased the proportions of both CD4+ and CD8+ T cells in CD45+ cells. However, compared with control or irradiated tumors in WT mice, immune cells such as T cells, DCs, and macrophages were not differentially altered in control or irradiated tumors from Ythdf2 cKO mice, respectively (Fig. S3, D–I), indicating that the deficiency of YTHDF2 has no significant effect on the composition of tumor-infiltrating immune cells. Given the role of YTHDF2 in DC migration (Liu et al., 2019), we administered 5-(and-6)-carboxyfluorescein diacetate succinimidyl ester (CFSE)-labeled BMDCs in B16F10 tumor-bearing mice to study whether YTHDF2 affects DC migration in the context of IR. While IR increased the presence of CFSE-labeled DCs in both WT and cKO models (Fig. S3 J), the loss of YTHDF2 did not significantly increase the presence of CFSE-labeled DCs in comparison with WT models, suggesting that YTHDF2 does not affect the migration capability of DCs. We found no significant differences in CD80 or CD86 expression between the WT and cKO groups in the context of IR (Fig. S3, K and L), suggesting that loss of YTHDF2 does not influence canonical DC maturation under our experimental conditions. Moreover, cell viability was comparable between WT and cKO DCs before or after coculture with CD8+ T cells (Fig. S3 M). Therefore, the enhanced antitumor effect is unlikely to result from altered viability of cKO DCs.

YTHDF2 regulates cross-presentation capacity of DCs in the context of IR. (A) tSNE map of different clusters of tumor-infiltrating CD45+ immune cells in B16F10 tumors as detected by flow cytometry. (B) Populations of infiltrating immune cells in B16F10 tumors assessed by flow cytometry. Macrophages: CD45+CD11b+F4/80+; DCs: CD45+CD11c+MHC−II+Ly6c−F4/80−; CD8+ T: CD45+CD3+CD8a+; CD4+ T: CD45+CD3+CD4+. (C) ELISPOT assay of IFN-γ–positive spots secreted by CD8+ T cells. WT, Ythdf2-cKO: CD11c+ BMDC cocultured with control B16F10-OZ tumor cells; WT+IR, Ythdf2-cKO+IR: CD11c+ BMDC cocultured with irradiated B16F10-OZ tumor cells (n = 4, mean ± SEM). (D) MC38 tumor growth in WT or Ythdf2-cKO with or without IR when CD8+ T cells were depleted. Anti-CD8 antibody was given at 200 µg/mouse, twice weekly, starting the day before IR (n = 5, mean ± SD). (E) LLC tumor growth in WT or Ythdf2-cKO with or without IR when CD8+ T cells were depleted. αCD8 was administered at 200 µg/mouse, twice weekly, starting the day before IR (n = 5, mean ± SD). (F) Size of LLC spontaneous metastasis total area at the end of the study in E, and representative images are shown in Fig. S3 V (n = 5, mean ± SEM). Statistical analysis was performed using two-sided unpaired Student’s t test (C–F); **P < 0.01; ***P < 0.001.
YTHDF2 regulates cross-presentation capacity of DCs in the context of IR. (A) tSNE map of different clusters of tumor-infiltrating CD45+ immune cells in B16F10 tumors as detected by flow cytometry. (B) Populations of infiltrating immune cells in B16F10 tumors assessed by flow cytometry. Macrophages: CD45+CD11b+F4/80+; DCs: CD45+CD11c+MHC−II+Ly6c−F4/80−; CD8+ T: CD45+CD3+CD8a+; CD4+ T: CD45+CD3+CD4+. (C) ELISPOT assay of IFN-γ–positive spots secreted by CD8+ T cells. WT, Ythdf2-cKO: CD11c+ BMDC cocultured with control B16F10-OZ tumor cells; WT+IR, Ythdf2-cKO+IR: CD11c+ BMDC cocultured with irradiated B16F10-OZ tumor cells (n = 4, mean ± SEM). (D) MC38 tumor growth in WT or Ythdf2-cKO with or without IR when CD8+ T cells were depleted. Anti-CD8 antibody was given at 200 µg/mouse, twice weekly, starting the day before IR (n = 5, mean ± SD). (E) LLC tumor growth in WT or Ythdf2-cKO with or without IR when CD8+ T cells were depleted. αCD8 was administered at 200 µg/mouse, twice weekly, starting the day before IR (n = 5, mean ± SD). (F) Size of LLC spontaneous metastasis total area at the end of the study in E, and representative images are shown in Fig. S3 V (n = 5, mean ± SEM). Statistical analysis was performed using two-sided unpaired Student’s t test (C–F); **P < 0.01; ***P < 0.001.
We next examined the effects of Ythdf2 on antigen presentation by DCs in the context of IR. In vitro cross-priming assays utilized BMDCs from WT and Ythdf2-cKO mice that were cocultured with control or irradiated B16F10-OZ tumor cells (DCs±IR), and CD11c+ DCs were subsequently purified from the mixture and cocultured with CD8+ T cells from OT1 mice for interferon-γ (IFN-γ) ELISPOT assays. As indicated by IFN-γ production by CD8+ T cells, CD8+ T cell cross-primed by Ythdf2-cKO DCs+IR was significantly augmented compared with WT DCs+IR (Fig. 4 C). YTHDF2 inhibitor DC-Y13-27–treated DCs+IR also showed enhanced cross-priming activity for CD8+ T cells compared with WT DCs+IR (Fig. S3 N) similar to the activity observed in Ythdf2-cKO BMDCs+IR (Fig. S3 O), confirming a central role of YTHDF2 in regulating cross-priming activity of DCs in RT. We further assessed the antigen cross-presentation of DCs using the B16-OVA tumor model, which express full-length ovalbumin. We detected a significant increase of H2Kb-SIINFEKL density in CCR7+ DCs migrated from B16-OVA tumor–inoculated cKO mice in comparison with WT mice (Fig. S3 P). In functional assays, the cKO DCs induced enhanced IFN-γ production from OT-I CD8+ T cells (Fig. S3 Q), confirming that the loss of YTHDF2 enhances the antigen cross-presentation of DCs. To determine whether YTHDF2 regulates direct peptide loading by MHC-I, we performed an ELISPOT assay on IFN-γ+ CD8+ T cells cocultured with WT or cKO DCs pulsed with SIINFEKL. Across addition of different doses of SIINFEKL, we observed comparable IFN-γ secretion between cocultures of WT and cKO DCs, suggesting that YTHDF2 loss will not affect the direct antigen loading by MHC-I (Fig. S3 R). To further assess whether cross-dressing is regulated by YTHDF2, we cocultured irradiated 4T1-HA tumor cells (H2Kd background) with DCs isolated from WT and cKO mice (H2Kb background). There was no significant change in the surface expression of H2Kd on DCs of cKO compared with WT DCs after coculture with 4T1-HA cells (Fig. S3 S), suggesting that Ythdf2 deficiency will not affect the acquisition of exogenous MHC-I (H2Kd). Next, we cocultured these DCs with CD8+ T cells and analyzed antigen-specific responses using H2Kd-HA tetramer staining. We did not observe a significant difference in tetramer+ CD8+ T cells between the WT and cKO groups (Fig. S3 T), indicating that Ythdf2 deletion does not significantly enhance cross-dressing of DCs with exogenous antigens.
To determine whether CD8+ T cells are required for the enhanced response to IR in Ythdf2-cKO mice, we depleted CD8+ T cells using a neutralizing antibody (αCD8) in MC38 and B16F10-OZ tumors. We observed that CD8+ T cell depletion completely abrogated the enhanced antitumor effects of IR in Ythdf2-cKO mice (Fig. 4 D and Fig. S3 U). The depletion of CD8+ T cells also abolished the superior control of LLC local tumors (Fig. 4 E) and metastases (Fig. 4 F and Fig. S3 V) by IR in Ythdf2-cKO, indicating that CD8+ T cells are essential for the enhanced control of local and distant disease in irradiated Ythdf2-cKO mice. Taken together, these findings suggest that loss of YTHDF2 potentiates the cross-presentation capacity of DCs in RT, thus leading to superior activation of CD8+ T cells and ultimate systemic disease control.
IR-induced YTHDF2 degrades m6A-bound mRNA in the Notch signaling pathway
To explore the mechanisms by which YTHDF2 regulates DC function in the context of IR, we analyzed the RNA-seq of tumor-infiltrating DCs from WT and Ythdf2-cKO mice treated with or without radiation. Since an important function of YTHDF2 is in degradation of m6A-modified RNA, we proposed the target of YTHDF2 is shared between the downregulated genes in WT+IR versus WT and the upregulated genes in cKO+IR versus WT+IR (Fig. 5 A). Comparing WT+IR versus WT, we found that radiation leads to downregulation of 998 genes and upregulation of 1,941 genes (Fig. 5 B and Fig. S4, A and B). Comparing cKO+IR versus WT+IR, we found that the loss of YTHDF2 leads to 1,335 upregulated genes and 1,480 downregulated genes in DCs after IR (Fig. 5 B; and Fig. S4, A and B). There were 537 genes shared between downregulated genes in cKO+IR versus WT+IR and upregulated genes in WT+IR versus WT (Fig. S4 A), and 208 genes shared between upregulated genes in cKO+IR versus WT+IR and downregulated genes in WT+IR versus WT (Fig. 5 B).

IR induces YTHDF2 to degrade m6A-bound mRNA in the Notch signaling pathway. (A) Schematic illustration on the analysis strategy for identifying YTHDF2-bound and m6A-modified gene transcripts. (B) Venn diagram of overlapping genes from mRNA-seq that were downregulated following WT+IR versus WT and upregulated following Ythdf2-cKO+IR versus WT+IR. (C) Twin-volcano plot of genes with differential expression levels in the DCs (left: cKO+IR versus WT+IR; right: WT+IR versus WT), m6A marked genes (m6A-seq) are shown with green circles, YTHDF2 marked genes (RIP-seq) are shown with purple circles, and both m6A and YTHDF2 marked genes are shown with red circles. 86 target genes of YTHDF2 shown in upregulated cKO+IR versus WT+IR region and downregulated WT+IR versus WT region are represented with black circles. (D) GO enrichment pathway analysis using 86 YTHDF2 target genes in the context of IR. (E) Sankey flow diagrams of specific genes categorized in each enriched pathway in D. (F) Induction of NICD from BMDCs with single or triple KD of Mfng, Aph-1b, and Aph-1c (n = 3). Statistical analysis was performed using two-sided unpaired Student’s t test (F); **P < 0.01. Data are represented as the mean ± SEM.
IR induces YTHDF2 to degrade m6A-bound mRNA in the Notch signaling pathway. (A) Schematic illustration on the analysis strategy for identifying YTHDF2-bound and m6A-modified gene transcripts. (B) Venn diagram of overlapping genes from mRNA-seq that were downregulated following WT+IR versus WT and upregulated following Ythdf2-cKO+IR versus WT+IR. (C) Twin-volcano plot of genes with differential expression levels in the DCs (left: cKO+IR versus WT+IR; right: WT+IR versus WT), m6A marked genes (m6A-seq) are shown with green circles, YTHDF2 marked genes (RIP-seq) are shown with purple circles, and both m6A and YTHDF2 marked genes are shown with red circles. 86 target genes of YTHDF2 shown in upregulated cKO+IR versus WT+IR region and downregulated WT+IR versus WT region are represented with black circles. (D) GO enrichment pathway analysis using 86 YTHDF2 target genes in the context of IR. (E) Sankey flow diagrams of specific genes categorized in each enriched pathway in D. (F) Induction of NICD from BMDCs with single or triple KD of Mfng, Aph-1b, and Aph-1c (n = 3). Statistical analysis was performed using two-sided unpaired Student’s t test (F); **P < 0.01. Data are represented as the mean ± SEM.

IR induces YTHDF2 to target Notch signaling in DC. (A) Venn diagram of overlapping genes from mRNA-seq that were upregulated following downregulated following Ythdf2-cKO+IR versus WT+IR and WT+IR versus WT. (B) Heatmap of differentially expressed genes in DCs from the WT+IR and WT group (left), and heatmap of differentially expressed genes in DCs from cKO+IR in comparison with the WT+IR group (right). (C) Schematic illustration of the Notch signaling pathway. Ligands in signal-sending cells can bind to glycosylated NOTCH receptors on signal-receiving cells. ADAMs are recruited for cleavage of the outside domain of Notch. After cleavage, the remaining part of the NOTCH receptor can be further cleaved on the cell membrane by γ-secretase and transported into lysosomes for generation of NICD. NICD can be translocated into the nucleus to crosstalk with other signaling pathways and regulate transcription. (D) Enrichment of Mfng, Aph-1b, and Aph-1c mRNA in the YTHDF2-immunoprecipitated RNA fraction of BMDCs, determined by RIP-qPCR (n = 3). (E–G) BMDCs from WT and Ythdf2-cKO mice were treated with actinomycin D. mRNA was collected at indicated time points after treatment, and mRNA levels of (E) Aph-1b, (F) Aph-1c, and (G) Mfng were measured by RT-qPCR (n = 3). (H) mRNA level of Mfng, Aph-1b, and Aph-1c from tumor-infiltrating DCs of WT, WT+IR and cKO, and cKO+IR mice (n = 3). (I) mRNA expression level of Notch receptors in WT or cKO DCs that were cocultured with irradiated tumor cells (n = 3). (J) mRNA expression level of Notch ligands in tumor cells with or without irradiation (n = 3). Statistical analysis was performed using two-sided unpaired Student’s t test (C–H); **P < 0.01; ***P < 0.001. Data are represented as the mean ± SEM. ADAMs, a disintegrin and metalloproteases.
IR induces YTHDF2 to target Notch signaling in DC. (A) Venn diagram of overlapping genes from mRNA-seq that were upregulated following downregulated following Ythdf2-cKO+IR versus WT+IR and WT+IR versus WT. (B) Heatmap of differentially expressed genes in DCs from the WT+IR and WT group (left), and heatmap of differentially expressed genes in DCs from cKO+IR in comparison with the WT+IR group (right). (C) Schematic illustration of the Notch signaling pathway. Ligands in signal-sending cells can bind to glycosylated NOTCH receptors on signal-receiving cells. ADAMs are recruited for cleavage of the outside domain of Notch. After cleavage, the remaining part of the NOTCH receptor can be further cleaved on the cell membrane by γ-secretase and transported into lysosomes for generation of NICD. NICD can be translocated into the nucleus to crosstalk with other signaling pathways and regulate transcription. (D) Enrichment of Mfng, Aph-1b, and Aph-1c mRNA in the YTHDF2-immunoprecipitated RNA fraction of BMDCs, determined by RIP-qPCR (n = 3). (E–G) BMDCs from WT and Ythdf2-cKO mice were treated with actinomycin D. mRNA was collected at indicated time points after treatment, and mRNA levels of (E) Aph-1b, (F) Aph-1c, and (G) Mfng were measured by RT-qPCR (n = 3). (H) mRNA level of Mfng, Aph-1b, and Aph-1c from tumor-infiltrating DCs of WT, WT+IR and cKO, and cKO+IR mice (n = 3). (I) mRNA expression level of Notch receptors in WT or cKO DCs that were cocultured with irradiated tumor cells (n = 3). (J) mRNA expression level of Notch ligands in tumor cells with or without irradiation (n = 3). Statistical analysis was performed using two-sided unpaired Student’s t test (C–H); **P < 0.01; ***P < 0.001. Data are represented as the mean ± SEM. ADAMs, a disintegrin and metalloproteases.
To further identify direct targets that both have m6A modifications and YTHDF2 binding (Fig. 5 A), we performed YTHDF2-RNA immunoprecipitation (IP) sequencing and m6A RNA IP sequencing (MeRIP-seq) to identify the YTHDF2-bound RNAs and reveal m6A-modified mRNAs, respectively. Following this strategy, we found 86 genes (e.g., Sik1, Klf2, Thbs1) as targets of YTHDF2 and with m6A modification in the context of IR (Fig. 5 C). GO enrichment analysis of these genes indicated that the Notch signaling pathway was among the top enriched pathways (Fig. 5 D). Specifically, three target genes (Mfng, Aph1b, and Aph1c) are known positive regulators of the Notch signaling pathway (Fig. 5 E). Mfng is known to promote elongation on O-linked fucose residues on Notch 1 receptors (Kakuda and Haltiwanger, 2017). Aph1b and Aph1c are important in the composition of γ-secretase, which plays a significant role in the cleavage of Notch intracellular domains (Fig. S4 C) (Serneels et al., 2005; Shirotani et al., 2004). We confirmed the direct YTHDF2 binding by IP using YTHDF2 antibody for mRNA pull-down and found that YTHDF2 directly binds to all three transcripts (Fig. S4 D).
To investigate the molecular interactions between YTHDF2 and the Notch pathway target genes (Mfng, Aph1b, and Aph1c), we studied the half-life of these transcripts with and without the presence of YTHDF2 and found increased half-lives of these transcripts in Ythdf2-cKO DCs compared with WT DCs (Fig. S4, E–G), consistent with the known function of YTHDF2 in promoting mRNA degradation. In tumor-infiltrating DCs, we observed decreased mRNA levels of Mfng, Aph1b, and Aph1c in DCs from irradiated tumors in WT mice compared with DCs from nonirradiated WT mice. Conversely, the expression of these genes was increased in DCs of Ythdf2-cKO compared with that of DCs from WT mice in the context of IR. The data suggested that YTHDF2 negatively regulates Notch signaling by reducing the expression of Mfng, Aph1b, and Aph1c following IR (Fig. S4 H). To determine which Notch ligands and receptors are involved, we performed qPCR to profile Notch receptors (Notch1, Notch2, Notch3, Notch4) on DCs and Notch ligands (Jagged1, Jagged2, DLL1) on tumor cells in our coculture system. Among these, we found that Notch1 on DCs was significantly upregulated in the context of YTHDF2 deficiency (Fig. S4 I). Moreover, the ligand DLL1 on tumor cells was significantly upregulated in cells receiving irradiation (shown in Fig. S4 J). These results suggest that the Notch1–DLL1 axis is the most relevant ligand–receptor interaction mediating the enhanced cross-priming observed in our study. This finding aligns with the proposed mechanism in which YTHDF2 modulates DC function through regulation of Notch signaling components.
To characterize the functions of these YTHDF2-regulated genes, we knocked down genes individually or together in an engineered Notch 1 intracellular domain (NICD) reporter system in Flt3l DCs and cocultured the DCs with control or irradiated tumor cells. No significant reduction of NICD was observed in WT DCs with any single gene KD during coculture with irradiated tumor cells. Ythdf2-cKO DCs cocultured with irradiated tumor cells had significantly induced NICD compared with WT DCs. Single KD or TriKD of the target genes resulted in a significant decrease in the NICD induction compared with Ythdf2-cKO scramble control (Fig. 5 F). Collectively, these results suggested that YTHDF2 negatively regulates the Notch signaling pathway by targeting and degrading the relevant genes (Mfng, Aph1b, and Aph1c) in the context of IR.
The loss of YTHDF2 in DCs induces the expression of the MHC-I gene Gm8909
Given that YTHDF2 directly targets the Notch signaling pathway via decreasing relevant transcripts of signaling components (Mfng, Aph1b, and Aph1c) and loss of YTHDF2 enhances antigen cross-presentation function of DCs, we performed network analysis to investigate potential interactions between Notch signaling and MHC-I pathways (Fig. 6 A). A STRING protein–protein interaction network (Szklarczyk et al., 2023) analysis showed that there are multiple potential interactions (e.g., CALR-APP, B2M-NOTCH1, PDIA3-APH1A) between these two pathways (Fig. 6 A), suggesting that the YTHDF2-targeted Notch signaling pathway might impact the MHC-I activity in DCs following irradiation. To test this, we examined the antigen cross-presentation capacity of BMDCs following KD of Mfng, Aph1b, and Aph1c (TriKD). We observed that upon coculturing with irradiated tumor cells, TriKD of these transcripts in both WT and Ythdf2-cKO DCs led to reduced IFN-γ secretion by CD8+ T cells (Fig. 6 B; and Fig. S5, A–D), suggesting the Notch pathway is important to DC cross-presentation function.

Loss of YTHDF2 in DCs induces Gm8909-encoded MHC-I by the Notch signaling pathway. (A) STRING protein–protein interaction network between the MHC-I pathway (involving Gm8909 and H2-Q6) and Notch signaling pathways (involving Mfng, Aph-1b, and Aph-1c). The minimum required interaction score was set to 0.4. k-means clustering was applied. Line thickness denoted the STRING PPI score/confidence. (B) ELISPOT assay on IFN-γ secreted by CD8+ T cells cocultured with WT/TriKD DCs, which were previously exposed to irradiated B16F10-OZ cells (n = 3). (C) Gene Set Enrichment Analysis pathway analysis indicating antigen processing and presentation pathway enriched in DCs (cKO+IR versus WT+IR). (D) Heatmap showing the expression of Gm8909, H2-Q6, and other MHC-I relevant genes in tumor-infiltrating DCs from WT and Ythdf2 cKO mice. (E)Gm8909 mRNA expression in WT or Ythdf2-cKO DCs, which were cocultured with irradiated tumor cells. TriKD indicates DC KD with Mfng, Aph-1b, and Aph-1c siRNA (n = 3). (F) ELISPOT assay on IFN-γ secreted by CD8+ T cells in coculture with H2-Q6/GM8909-overexpressed DCs, which were previously treated with DAPT and exposed to irradiated B16F10-OZ cells. (G) mRNA expression of Gm8909 in WT or cKO BMDCs with or without treatment of inhibitor DAPT (n = 3). (H) H2-Kb-SIINFEKL level in WT DCs or DCs overexpressed with GM8909. (I) Confocal fluorescence imaging of DCs for detecting subcellular localization of GM8909 in ER or lysosomes; scale bars: 5 µm. (J) Structure of GM8909 and ClusPro protein–protein docking between GM8909 and B2M. (K) Confocal fluorescence imaging of DCs for detecting subcellular localization of GM8909 with B2M; scale bars: 5 µm. Statistical analysis was performed using two-sided unpaired Student’s t test (B, E, and G); *P < 0.05; **P < 0.01; ***P < 0.001. Data are represented as the mean ± SEM.
Loss of YTHDF2 in DCs induces Gm8909-encoded MHC-I by the Notch signaling pathway. (A) STRING protein–protein interaction network between the MHC-I pathway (involving Gm8909 and H2-Q6) and Notch signaling pathways (involving Mfng, Aph-1b, and Aph-1c). The minimum required interaction score was set to 0.4. k-means clustering was applied. Line thickness denoted the STRING PPI score/confidence. (B) ELISPOT assay on IFN-γ secreted by CD8+ T cells cocultured with WT/TriKD DCs, which were previously exposed to irradiated B16F10-OZ cells (n = 3). (C) Gene Set Enrichment Analysis pathway analysis indicating antigen processing and presentation pathway enriched in DCs (cKO+IR versus WT+IR). (D) Heatmap showing the expression of Gm8909, H2-Q6, and other MHC-I relevant genes in tumor-infiltrating DCs from WT and Ythdf2 cKO mice. (E)Gm8909 mRNA expression in WT or Ythdf2-cKO DCs, which were cocultured with irradiated tumor cells. TriKD indicates DC KD with Mfng, Aph-1b, and Aph-1c siRNA (n = 3). (F) ELISPOT assay on IFN-γ secreted by CD8+ T cells in coculture with H2-Q6/GM8909-overexpressed DCs, which were previously treated with DAPT and exposed to irradiated B16F10-OZ cells. (G) mRNA expression of Gm8909 in WT or cKO BMDCs with or without treatment of inhibitor DAPT (n = 3). (H) H2-Kb-SIINFEKL level in WT DCs or DCs overexpressed with GM8909. (I) Confocal fluorescence imaging of DCs for detecting subcellular localization of GM8909 in ER or lysosomes; scale bars: 5 µm. (J) Structure of GM8909 and ClusPro protein–protein docking between GM8909 and B2M. (K) Confocal fluorescence imaging of DCs for detecting subcellular localization of GM8909 with B2M; scale bars: 5 µm. Statistical analysis was performed using two-sided unpaired Student’s t test (B, E, and G); *P < 0.05; **P < 0.01; ***P < 0.001. Data are represented as the mean ± SEM.
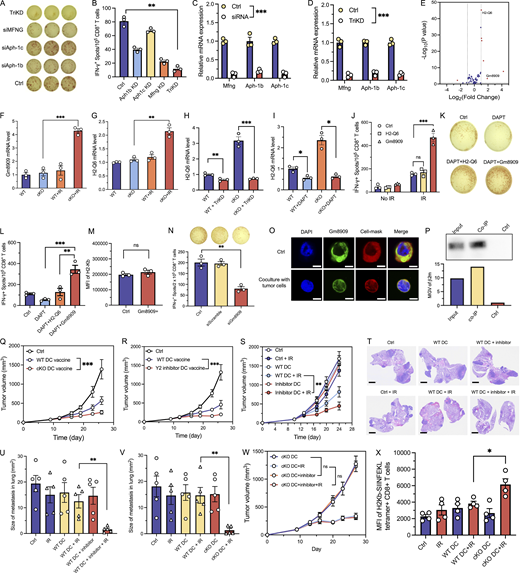
Loss of YTHDF2 in DC induces Gm8909 by the Notch signaling pathway and enhances DC vaccine efficacy. (A) ELISPOT assay on IFN-γ secreted by CD8+ T cells, which were cocultured with DCs with single or triple KD of Mfng, Aph-1b, and Aph-1c. DCs were exposed to irradiated tumor cells prior to CD8+ T cell stimulation. (B) Quantification of IFN-γ spots in A (n = 3, mean ± SEM). (C) mRNA expression of relevant genes in DCs with or without treatment of siRNA (n = 3, mean ± SEM). (D) mRNA expression of relevant genes in DCs with or without using triple siRNAs for gene KD (n = 3, mean ± SEM). (E) Volcano plot on the differential expressed antigen presentation relevant genes in DCs of cKO+IR versus WT+IR. (F and G) mRNA expression of (F) Gm8909 and (G) H2-Q6 in DCs from WT, WT+IR and cKO, and cKO+IR mice (n = 3, mean ± SEM). (H) mRNA expression of H2-Q6 in WT or cKO BMDCs with or without triple KD of Mfng, Aph-1b, and Aph-1c (n = 3). (I) mRNA expression of H2-Q6 in WT or cKO BMDCs with or without treatment of Notch inhibitor DAPT (n = 3, mean ± SEM). (J) Quantification of IFN-γ secreted by CD8+ T cells in coculture with H2-Q6/GM8909-overexpressed DCs, which were previously treated with DAPT and exposed to irradiated B16F10-OZ cells (n = 3). (K) ELISPOT assay on IFN-γ secreted by CD8+ T cells, which were cocultured with WT/DAPT-treated DCs overexpressed with H2-Q6 or Gm8909. (L) Quantification of IFN-γ spots in (S5K) (n = 3, mean ± SEM). (M) H2-Kb expression level in WT or Gm8909-overexpressing DCs (n = 3, mean ± SEM). (N) ELISPOT assay on IFN-γ secreted by CD8+ T cell–stimulated DCs treated by scrambled siRNA (siScramble) and Gm8909 siRNA (n = 3, mean ± SEM). (O) Confocal fluorescence microscopy of DCs with or without coculture with irradiated tumor cells; scale bars: 5 µm. (P) Western blot on co-IP of β2m with Gm8909. (Q) B16F10-OVA tumor growth curves of mice intratumorally injected with WT and Ythdf2-cKO DC vaccines 3 times/wk with or without IR (20 Gy) on day 9 (n = 5, mean ± SD). (R) B16F10-OVA tumor growth curves of mice intratumorally injected with WT and inhibitor-treated DC vaccines 3 times/wk with or without IR (20 Gy) on day 9 (n = 5, mean ± SD). (S) LLC tumor growth curves of mice intratumorally injected with WT and inhibitor-treated DC vaccines 1 time/wk with or without IR (20 Gy) on day 10 (n = 5, mean ± SD). (T) Lung metastasis in WT mice receiving different treatments as indicated in S; scale bars: 2 mm. (U) Size of lung metastases was measured in T (n = 5, mean ± SEM). (V) Size of lung metastases was measured in Fig. 7 D (n = 5, mean ± SEM). (W) B16F10-OVA tumor growth curves of mice intratumorally injected with inhibitor-treated cKO DC vaccines 3 times/wk in combination with or without IR (20 Gy) on day 9 (n = 5, mean ± SD). (X) MFI of H2Kb-SIINFEKL tetramer+ CD8+ T cells stimulated with DCs from different treatments (n = 4, mean ± SEM). Statistical analysis was performed using two-sided unpaired Student’s t test (B–D, F–J, L–N, Q–S, and U–X); ns, P > 0.05; *P < 0.05; **P < 0.01; ***P < 0.001. Source data are available for this figure: SourceData FS5.
Loss of YTHDF2 in DC induces Gm8909 by the Notch signaling pathway and enhances DC vaccine efficacy. (A) ELISPOT assay on IFN-γ secreted by CD8+ T cells, which were cocultured with DCs with single or triple KD of Mfng, Aph-1b, and Aph-1c. DCs were exposed to irradiated tumor cells prior to CD8+ T cell stimulation. (B) Quantification of IFN-γ spots in A (n = 3, mean ± SEM). (C) mRNA expression of relevant genes in DCs with or without treatment of siRNA (n = 3, mean ± SEM). (D) mRNA expression of relevant genes in DCs with or without using triple siRNAs for gene KD (n = 3, mean ± SEM). (E) Volcano plot on the differential expressed antigen presentation relevant genes in DCs of cKO+IR versus WT+IR. (F and G) mRNA expression of (F) Gm8909 and (G) H2-Q6 in DCs from WT, WT+IR and cKO, and cKO+IR mice (n = 3, mean ± SEM). (H) mRNA expression of H2-Q6 in WT or cKO BMDCs with or without triple KD of Mfng, Aph-1b, and Aph-1c (n = 3). (I) mRNA expression of H2-Q6 in WT or cKO BMDCs with or without treatment of Notch inhibitor DAPT (n = 3, mean ± SEM). (J) Quantification of IFN-γ secreted by CD8+ T cells in coculture with H2-Q6/GM8909-overexpressed DCs, which were previously treated with DAPT and exposed to irradiated B16F10-OZ cells (n = 3). (K) ELISPOT assay on IFN-γ secreted by CD8+ T cells, which were cocultured with WT/DAPT-treated DCs overexpressed with H2-Q6 or Gm8909. (L) Quantification of IFN-γ spots in (S5K) (n = 3, mean ± SEM). (M) H2-Kb expression level in WT or Gm8909-overexpressing DCs (n = 3, mean ± SEM). (N) ELISPOT assay on IFN-γ secreted by CD8+ T cell–stimulated DCs treated by scrambled siRNA (siScramble) and Gm8909 siRNA (n = 3, mean ± SEM). (O) Confocal fluorescence microscopy of DCs with or without coculture with irradiated tumor cells; scale bars: 5 µm. (P) Western blot on co-IP of β2m with Gm8909. (Q) B16F10-OVA tumor growth curves of mice intratumorally injected with WT and Ythdf2-cKO DC vaccines 3 times/wk with or without IR (20 Gy) on day 9 (n = 5, mean ± SD). (R) B16F10-OVA tumor growth curves of mice intratumorally injected with WT and inhibitor-treated DC vaccines 3 times/wk with or without IR (20 Gy) on day 9 (n = 5, mean ± SD). (S) LLC tumor growth curves of mice intratumorally injected with WT and inhibitor-treated DC vaccines 1 time/wk with or without IR (20 Gy) on day 10 (n = 5, mean ± SD). (T) Lung metastasis in WT mice receiving different treatments as indicated in S; scale bars: 2 mm. (U) Size of lung metastases was measured in T (n = 5, mean ± SEM). (V) Size of lung metastases was measured in Fig. 7 D (n = 5, mean ± SEM). (W) B16F10-OVA tumor growth curves of mice intratumorally injected with inhibitor-treated cKO DC vaccines 3 times/wk in combination with or without IR (20 Gy) on day 9 (n = 5, mean ± SD). (X) MFI of H2Kb-SIINFEKL tetramer+ CD8+ T cells stimulated with DCs from different treatments (n = 4, mean ± SEM). Statistical analysis was performed using two-sided unpaired Student’s t test (B–D, F–J, L–N, Q–S, and U–X); ns, P > 0.05; *P < 0.05; **P < 0.01; ***P < 0.001. Source data are available for this figure: SourceData FS5.
To investigate the molecular mechanism of antigen cross-presentation enhanced by YTHDF2 deficiency, we conducted gene set enrichment analysis on RNA-seq data in DCs from cKO+IR versus WT+IR (Fig. 6 C). We observed that the antigen presentation pathway was significantly upregulated in cKO+IR DCs, represented by genes such as Cd8a, Gm8909, H2-Oa, and H2-Q6 (Fig. S5 E). Among them, the expression of Gm8909 and H2-Q6 was significantly elevated in DCs from cKO+IR compared with WT+IR (Fig. S5 E and Fig. 6 D). Both Gm8909 and H2-Q6 belong to MHC-I family genes, predicted with MHC antigen recognition domain and functions in antigen peptide loading, processing, and presentation to T cell receptor (Perez et al., 2024). To validate this finding, we collected tumor-infiltrating DCs and quantified the expression level of Gm8909 and H2-Q6 transcripts with qPCR. The expression of both transcripts was significantly upregulated in Ythdf2-cKO DCs from irradiated tumors (Fig. S5, F and G), confirming that Gm8909 and H2-Q6 are regulated by YTHDF2 in the context of IR.
To characterize the relationship between the Notch signaling pathway and MHC-I gene expression, we measured the expression of MHC-I genes Gm8909 and H2-Q6 in BMDCs following TriKD of the YTHDF2 targets in the Notch pathway (Mfng, Aph1b, and Aph1c). The result showed that the expression of both Gm8909 and H2-Q6 was significantly downregulated with TriKD (Fig. 6 E and Fig. S5 H). In DCs treated with the Notch pathway inhibitor DAPT, the expression of Gm8909 and H2-Q6 at the mRNA level also decreased. These results indicate that inhibition of the Notch signaling pathway negatively regulates the transcription of MHC-I genes (Fig. 6 G and Fig. S5 I). To determine the function of MHC-I genes Gm8909 and H2-Q6 in DCs upon IR, H2-Q6 and Gm8909 were overexpressed in BMDCs and cocultured with irradiated or control (unirradiated) tumor cells for antigen cross-presentation assays. As indicated by the IFN-γ spots secreted by CD8+ T cells when cocultured with irradiated tumor cells, Gm8909-overexpressed (Gm8909+) DCs showed significantly enhanced cross-presentation function compared with that of control DCs or Gm8909+ DCs cocultured with unirradiated tumors (Fig. 6 F and Fig. S5 J). A similar effect was not observed in H2-Q6–overexpressed DCs. To investigate the impact of the Notch signaling pathway on MHC-I function, we treated Gm8909- and H2-Q6–overexpressed DCs using the inhibitor DAPT. While DAPT-treated control DCs showed decreased cross-priming capacity, cross-priming capacity of DAPT-treated Gm8909+ DCs remained significantly increased compared with the DAPT-alone or DAPT+H2-Q6+ group (Fig. S5, K and L). We also observed that after coculture with irradiated B16F10-OZ cells, DCs overexpressing Gm8909 showed a higher level of H2-Kb-SIINFEKL than WT DCs (Fig. 6 H), suggesting that Gm8909 in DCs promotes other MHC-I family protein for antigen cross-presentation. Gm8909 overexpression does not affect the H2-Kb expression in DCs (Fig. S5 M), which suggests that Gm8909 selectively enhances antigen presentation efficiency, rather than driving a general upregulation of MHC-I surface levels. We knocked down Gm8909 using siRNA in cKO BMDCs and cocultured them with CD8+ T cells in the presence of irradiated B16F10-OZ cells. The results showed a significant reduction in IFN-γ–producing CD8+ T cells (Fig. S5 N), indicating that Gm8909 is indeed required for the elevated cross-priming activity in cKO DCs. Taken together, these results demonstrate that GM8909 plays an important role in MHC-I–mediated antigen cross-presentation of DCs in the context of IR. The Notch signaling pathway, which is targeted by IR-induced YTHDF2, plays a significant role in sustaining GM8909 expression and antigen presentation function in DCs.
GM8909 was predicted to play a role in antigen processing and presentation of endogenous antigen via ER pathway (Perez et al., 2024). To test this, we performed confocal microscopy of Gm8909+ DCs that were tagged with GFP. The fluorescence of GM8909 colocalized with ER trackers in DCs but to less of an extent with lysosomal trackers (Fig. 6 I), consistent with the prediction that GM8909 preferentially localized to the ER. We also observed that in DCs cocultured with tumor cells, GM8909-GFP translocated to the plasma membrane from the cytoplasm of DCs (Fig. S5 O), which may facilitate antigen cross-presentation. β-2 microglobulin (β2M) is an essential light chain for assembling with the heavy chain to form the MHC-I complex for peptide loading. To detect the affinity of β2M to GM8909, we conducted protein–protein dock calculations with ClusPro (Desta et al., 2020; Jones et al., 2022; Kozakov et al., 2017; Vajda et al., 2017) and observed a high docking energy at −204.9 kcal/mol of van der Waals. The algorithm also detected electrostatic interactions between the β2M chain and GM8909 chain. These predictions suggested a strong binding affinity of β2M to the GM8909 chain (Fig. 6 J). Immunofluorescence microscope imaging showed that β2M is colocalized with GM8909 in DCs (Fig. 6 K). Using a GFP-tagged GM8909 construct, we performed co-IP with an anti-GFP antibody, followed by western blot analysis, which revealed a specific association between GM8909 and β2M (Fig. S5 P). This finding suggests that GM8909 may facilitate or stabilize MHC-I complex formation or trafficking through direct interaction with β2M. Taken together, these results suggested that GM8909 may serve as the heavy chain to assemble with β2M to form the MHC-I complex for antigen loading and presentation.
Targeting YTHDF2 promotes efficacy of DC vaccines to enhance RT
Ex vivo–generated, antigen-loaded DCs have been used as adjuvants for vaccination in patients with cancer, eliciting safe, therapeutic, and protective antitumor immunity (Palucka and Banchereau, 2013; Timmerman and Levy, 1999). Despite this, clinical responses of DC vaccines remain low with objective response rates not exceeding 15% (Anguille et al., 2014), prompting efforts to refine immunological and clinical parameters to improve its efficacy. Given that Ythdf2-deficient DCs exert superior cross-priming capacity, we sought to generate prototype DC vaccines to enhance the antitumor immunity of RT. To test the efficacy of a prototype DC vaccine, we injected WT or YTHDF2-deficient Flt3l DCs into B16F10-OVA tumors 3 times/wk. Compared with control groups, WT DC injection significantly decreased tumor growth (Fig. S5 Q). Further, cKO DC vaccines significantly enhanced antitumor effects compared with WT DC vaccines. In addition, pretreatment of WT DCs with the YTHDF2 inhibitor DC-Y13-27 augmented antitumor effects, consistent with the results of Ythdf2 cKO DCs (Fig. S5 R). The results showed that DC vaccines with YTHDF2 modulation indeed increased antitumor effects.
To test whether DC vaccine with YTHDF2 inhibition affects the efficacy of RT, we administered WT or YTHDF2-deficient Flt3l DCs at a lower frequency (1 time/wk) into B16F10-OVA tumor-bearing mice, starting on the day of radiation. WT DCs exhibited no significant effect on the growth of B16F10-OVA tumors in comparison with control groups. Tumors treated with cKO DC vaccine alone showed similar growth to the tumors treated with WT DC vaccine. A combination of radiation with cKO DC vaccine resulted in the greatest decrease in B16F10-OVA tumor growth when compared to WT DC+IR treatment (Fig. 7 A). Similarly, DCs pretreated with the YTHDF2 inhibitor DC-Y13-27 transferred at 1 time/wk did not show significant effects alone. However, consistent with cKO DC results, DCs treated with the inhibitor significantly improved antitumor effect of radiation compared with either single treatment (Fig. 7 B).

YTHDF2 inhibition promotes DC vaccine efficacy with RT. (A) B16F10-OVA tumor growth curves with indicated treatments. WT and Ythdf2-cKO DC vaccines were administered intratumorally once per week. Tumors were treated with or without IR (20 Gy) on day 9 (n = 5, mean ± SD). (B) B16F10-OVA tumor growth curves with indicated treatments. WT DCs or WT DCs treated with YTHDF2 inhibitor were administered intratumorally once per week. Tumors were treated with or without IR (20 Gy) on day 9 (n = 5, mean ± SD). (C) LLC tumor growth curves with indicated treatments. WT DCs or Ythdf2-cKO DCs were administered intratumorally once per week. Tumors were treated with or without IR (20 Gy) on day 9 (n = 5, mean ± SD). (D) Representative LLC spontaneous lung metastasis of mice receiving treatments as indicated in C; scale bars: 2 mm. (E) IFN-γ+ CD8+ T cells in lung tissue. The lung was collected on day 10 after IR treatment (n = 4, mean ± SEM). (F) ELISPOT assay of human DC to assess antigen cross-presentation capability to matched human T cells. DCs were treated with the YTHDF2 inhibitor and further cocultured with irradiated or nonirradiated HCT116 cells (n = 5, mean ± SEM). Statistical analysis was performed using two-sided unpaired Student’s t test (A–C, E, and F); *P < 0.05; **P < 0.01; ***P < 0.001.
YTHDF2 inhibition promotes DC vaccine efficacy with RT. (A) B16F10-OVA tumor growth curves with indicated treatments. WT and Ythdf2-cKO DC vaccines were administered intratumorally once per week. Tumors were treated with or without IR (20 Gy) on day 9 (n = 5, mean ± SD). (B) B16F10-OVA tumor growth curves with indicated treatments. WT DCs or WT DCs treated with YTHDF2 inhibitor were administered intratumorally once per week. Tumors were treated with or without IR (20 Gy) on day 9 (n = 5, mean ± SD). (C) LLC tumor growth curves with indicated treatments. WT DCs or Ythdf2-cKO DCs were administered intratumorally once per week. Tumors were treated with or without IR (20 Gy) on day 9 (n = 5, mean ± SD). (D) Representative LLC spontaneous lung metastasis of mice receiving treatments as indicated in C; scale bars: 2 mm. (E) IFN-γ+ CD8+ T cells in lung tissue. The lung was collected on day 10 after IR treatment (n = 4, mean ± SEM). (F) ELISPOT assay of human DC to assess antigen cross-presentation capability to matched human T cells. DCs were treated with the YTHDF2 inhibitor and further cocultured with irradiated or nonirradiated HCT116 cells (n = 5, mean ± SEM). Statistical analysis was performed using two-sided unpaired Student’s t test (A–C, E, and F); *P < 0.05; **P < 0.01; ***P < 0.001.
We tested low-dose (1 dose/wk) DC vaccine in the LLC spontaneous lung metastasis model. WT DC vaccines exhibited no significant effect on the growth of LLC flank tumors in comparison with control groups. cKO DC vaccine alone showed similar effects on tumor growth as the WT DC vaccine. The combination of RT with cKO DC vaccine resulted in a significant inhibition of LLC tumor growth when compared to WT DC vaccine + IR therapy (Fig. 7 C). Again, the effect of YTHDF2 inhibitor DC-Y13-27–pretreated DCs showed a similar phenotype as cKO DCs in the LLC tumor model (Fig. S5 S). A reduced burden of spontaneous LLC lung metastases was observed in lungs of the YTHDF2 inhibitor–treated DC vaccine group that received IR compared with the WT DC group that received IR (Fig. S5, T and U). We also observed similarly reduced metastatic area in the lungs of Ythdf2-cKO DC vaccines + IR group in comparison with the WT DC vaccine + IR group (Fig. 7 D and Fig. S5 V). To determine whether the activity of the YTHDF2 inhibitor DC-Y13-27 depends on YTHDF2 expression in DCs, we treated cKO DCs with the inhibitor and found no further enhancement in tumor growth control compared with cKO DCs alone (Fig. S5 W), suggesting that the inhibitor’s effects are YTHDF2 dependent. To examine the global impact of Ythdf2 deficiency on the lung immune microenvironment, we conducted flow cytometry of immune cells from lungs of mice inoculated with LLC cells 10 days after the start of treatments. We observed that in the mice treated with Ythdf2-cKO DC vaccine, IR increased the level of IFN-γ in CD8+ T cells compared to that of mice treated with WT DC vaccines (Fig. 7 E), indicating that the DCs deficient of YTHDF2 significantly improved the function of CD8+ T cells in the mouse lung. To assess tumor antigen–specific CD8+ T cell responses, we used the LLC-OT-1 spontaneous metastasis model. Tumor antigen–specific H2Kb–SIINFEKL tetramers were used to stain T cells, and a significant increase in tetramer mean fluorescence intensity (MFI) was observed in OT-I CD8+ T cells primed with cKO DCs (Fig. S5 X), indicating more efficient antigen-specific cross-priming. Taken together, these data demonstrated that prototype DC vaccines in which Ythdf2 is deleted or inhibited enhanced the efficacy of RT by increasing local and distant metastasis control.
To investigate YTHDF2’s role in human DC function, we induced human DCs from monocytes derived from PBMCs of an EBV+ donor. The induced DCs were cocultured with CD8+ T cells isolated from matched EBV+ PBMC for antigen cross-priming assays. We found that consistent with the outcomes of mouse DCs, human DCs cocultured with irradiated EBV+ HCT116 cells subsequently enhanced IFN-γ secretion by CD8+ T cells, compared with the control group DCs, which were cocultured with unirradiated tumor cells. Moreover, after coculture with irradiated tumor cells, DCs pretreated with the YTHDF2 inhibitor resulted in significantly enhanced IFN-γ secretion by CD8+ T cells in comparison with that of control untreated DCs (Fig. 7 F), indicating that the inhibition of YTHDF2 in human DCs enhances antigen cross-presentation function.
Discussion
We demonstrate that YTHDF2, an m6A-dependent mRNA degrader, functions as a radiation-induced immune checkpoint in DCs, and suppresses antitumor immunity after radiation exposure. Analysis of patient samples and animal models revealed that RT upregulates YTHDF2 in DCs, impairing antigen presentation and promoting immune evasion. Loss of Ythdf2 in DCs enhanced the local antitumor effects of RT and significantly suppressed metastasis development. Using multiple tumor models, including an orthotopic pancreatic tumor model, we found that YTHDF2 depletion or pharmacological inhibition significantly improved RT tumor control and reduced lung metastasis. Notably, the same effect was observed with DC vaccines engineered to block YTHDF2, highlighting its potential as a therapeutic target.
Mechanistically, IR-induced SPI1 directly binds to the Ythdf2 promoter, increasing its expression in DCs. Elevated YTHDF2 levels promote m6A-mediated degradation of Aph-1b, Aph-1c, and Mfng—key regulators of Notch signaling, which lead to impaired MHC-I antigen presentation and reduced CD8+ T cell priming. The loss of YTHDF2 restores Notch signaling, which results in upregulation of Gm8909 (a member of the MHC-I family), and enhances antigen cross-presentation, ultimately improving DC-mediated antitumor immunity in response to RT.
Beyond revealing a new function of YTHDF2, our study highlights a key distinction from YTHDF1 (Han et al., 2019; Wen et al., 2024), which primarily regulates antigen processing by promoting lysosomal cathepsin translation. YTHDF2, in contrast, directly suppresses MHC-I antigen presentation by destabilizing Notch pathway transcripts, impairing CD8+ T cell activation. While previous studies linked YTHDF2 to immune suppression in myeloid-derived suppressing cells (Wang et al., 2023), macrophages (Ma et al., 2023), and B cells (Chen et al., 2024), our work demonstrates its role in DCs as a regulator of antigen presentation and introduces a novel, clinically relevant approach—leveraging YTHDF2 inhibition to improve DC-based cancer vaccines. Given the crucial role of DC vaccines in tumor immunotherapy, targeting YTHDF2 offers a promising strategy to enhance RT efficacy and prevent metastasis.
To translate these findings into a therapeutic approach, we developed proof-of-principle DC vaccines treated with a YTHDF2 inhibitor or genetic depletion of Ythdf2. Intratumoral administration of these modified DC vaccines significantly enhanced the antitumor immunity and metastasis-suppressive effects of RT, reinforcing their clinical potential. Despite limited response rates in clinical trials, DC-based cancer vaccines remain a focus in immuno-oncology. Our results suggest that targeting YTHDF2 could significantly improve the efficacy of these vaccines, particularly given the limited effectiveness of current DC vaccines and the need for strategies to enhance their therapeutic potential. The combination of DC vaccination and YTHDF2 inhibition presents a safe, personalized, and clinically viable strategy for next-generation DC immunotherapies.
Limitations of the study
While we identify YTHDF2 as a key regulator of RT-induced immune suppression in DCs, our study has some limitations. Although YTHDF2 upregulation was most pronounced in DCs after RT, its interactions with other immune cells remain unclear, and it may also play a role in other immune-related diseases. This study primarily used CD11c+ cell–targeted Ythdf2 deletion, which may not fully capture its function in specific DC subpopulations. CD11c+ expression is not confined to DCs, and that YTHDF2 deletion may affect other CD11c-expressing immune cells within the tumor. Additionally, while YTHDF2 depletion enhanced CD8+ T cell priming in the lungs, it is uncertain whether this effect is driven by DC activity or T cell trafficking. Further studies are also needed to determine whether Aph-1b, Aph-1c, and Mfng influence other Notch family members or additional biological pathways. Finally, the effects of YTHDF2 inhibition in human DCs should be carefully assessed, considering genetic and immune heterogeneity among individuals.
In summary, our findings establish m6A reader YTHDF2 as a clinically relevant immune checkpoint in DCs, demonstrating its role in impaired antigen presentation, RT resistance, and metastatic progression. By uncovering the YTHDF2–Notch–MHC-I axis, we provide new insights into epi-transcriptomic regulation of DC function in antitumor immunity. Furthermore, our study highlights the therapeutic potential of targeting YTHDF2 to enhance DC-based cancer vaccines, offering a promising approach to improve RT outcomes and metastatic control. These results lay the groundwork for the development of next-generation DC immunotherapies, with significant implications for overcoming RT resistance and enhancing antitumor immunity.
Materials and methods
Cancer cell lines
Murine colon adenocarcinoma cell (MC38), LLC, and melanoma cells (B16F10) were obtained from American Type Culture Collection. B16F10-OVA, B16F10-SIINFEKL(OT-I)-Zsgreen (B16F10-OZ), and HCT116 cells were preserved in our lab. Pancreatic cancer cells (KPC344) were kindly gifted from Hidayatullah G. Munshi’s lab at Northwestern University, Evanston, IL, USA (Pham et al., 2022). These cell lines were cultured in Dulbecco’s modified Eagle’s medium (DMEM) in supplementation with 10% fetal bovine serum and 1% penicillin–streptomycin. All cell lines were maintained in a humidified incubator at 37°C under 5% CO2.
Mouse models
All mice were housed and used according to the animal experimental guidelines set by the Institute of Animal Care and Use Committee (IACUC) of the University of Chicago. All C57BL/6 mice were purchased from Harlan/Envigo. Cd11ccre and OT-I transgenic mice were purchased from The Jackson Laboratory. Ythdf2flox/flox mice were generated using the CRISPR/Cas9 technology as described previously (Li et al., 2018a). DC-specific Ythdf2 knockout mice were generated by crossing Ythdf2flox/flox mice with Cd11cCre mice (Ythdf2-cKO). All mice were maintained under specific pathogen-free conditions, and female mice with age 8–12 wk were used in accordance with the animal experimental guidelines.
Human samples
Clinical PBMCs were obtained from patients with metastatic NSCLC enrolled in a clinical trial at our institution (COSINR study, NCT03223155); patients were treated with sequential or concurrent SBRT and immune checkpoint blockade therapy (ipilimumab and nivolumab). PBMCs were collected prior to treatment and following completion of SBRT. The procedure for human sample collection was approved by the University of Chicago Biological Sciences Division Institutional Review Board, and written informed consent was obtained from all patients. All experiments were performed in compliance with the Helsinki Declaration. HLA-typed PBMCs from healthy donors (donor ID# 888360769) were obtained from STEMCELL for human CD8+ T cell isolation and DC induction.
Tumor growth and treatment
1 million MC38, LLC, B16F10-OZ, or B16-OVA tumor cells were subcutaneously injected in the right flank of mice. Mice were pooled and divided into different groups at random when the tumor volume reached 100 mm3. 20 Gy dose of irradiation was delivered to local tumor-localized radiation. For CD8+ T cell depletion experiments, 200 μg of anti-CD8a antibody was delivered by intraperitoneal injection, starting from 1 day before other treatments (twice a week). For DC vaccine treatment, BMDCs cocultured with YTHDF2 inhibitor (10 μg/ml) were injected intratumorally. For orthotopic tumor models, 5 × 10⁴ KPC cells were inoculated to the pancreas of mice, followed by treatment with IR (6 Gy) on day 11 under guidance of CT imaging. Mice were measured according to the IACUC requirement, and tumor volumes were calculated by volume = length × width × height × 0.5. Animals were euthanized when the tumor length reached 20 mm and ulceration length >10 mm, or in poor health state in compliance with IACUC guidelines.
Flow cytometry
Tumors were collected, diced into small pieces, and digested with digesting medium containing 1 mg/ml collagenase and 200 μg/ml DNase I. Cell suspensions were obtained through a 70-μm cell strainer and washed with flow cytometry staining (FACS) buffer, which was made with PBS containing 2% FBS and 0.5 mM EDTA. Dead cells were stained with Zombie NIR. Cells were blocked with anti-FcR for 10 min and subsequently stained with surface antibodies for 30 min at 4°C in the dark. For intracellular staining of IFN-γ, cells were stimulated with Cell Activation Cocktail with brefeldin A for 6–8 h, followed by fixation and permeabilization using Thermo FoxP3 Fixation and Permeabilization Kit before intracellular staining. For intracellular staining of YTHDF2, fixed DCs were incubated with the YTHDF2 antibody at 4°C overnight, followed by adding the Alexa Fluor 647 goat anti-rabbit IgG (Life Technologies) and staining for 1 h. Samples were tested with Cytek Aurora benchtop analyzer at Flow Cytometry Core Facility of the University of Chicago, and the generated data were analyzed by FlowJo software.
Induction of BMDCs
Single-cell suspensions of bone marrow cells were collected from WT and Ythdf2-cKO mice. Red blood cells were removed with ammonium–chloride–potassium buffer. Then, cells were cultured in a humidified incubator at 37°C and 5% CO2 with Iscove’s modified Dulbecco’s medium containing 10% FBS, 1% penicillin–streptomycin solution, 55 mM 2-mercaptoethanol, 1% sodium pyruvate, 1% MEM nonessential amino acid, and 100 ng/ml of FLT3L. Equal volume of fresh media containing FLT3L was added on day 5, and BMDCs were collected on day 9 for further applications.
Human DC induction
To induce human DCs, CD14+ monocytes were isolated from human PBMCs using EasySep Human CD14 Positive Selection Kit II. The isolated CD14+ cells were cultured with RPMI 1640 medium, which contains 10% FBS, 1% penicillin–streptomycin solution, 1% L-Glutamine solution, human GM-CSF (1000 U/ml), and human IL-4 (250 U/ml). On day 3, fresh medium was added and cells were cultured for another 48 h. Immature DCs were treated with YTHDF2 inhibitors for 24 h (10 μg/ml) and further incubated with EBV peptide or irradiated EBV-positive HCT116 cells to get antigen-loading DCs. Thereafter, DCs were activated with TNF-α for 24 h before coculture with human CD8+ T cells for antigen cross-presentation assays. Human CD8+ T cells were isolated from PBMCs using MojoSort Human CD8+ T Cell Isolation Kit according to the manufacturer’s protocol.
In vivo migration of DCs
The migration of DCs in vivo was performed as previously described (Liu et al., 2019). Briefly, BMDCs were labeled with 0.5 mM of CFSE. 2 million labeled cells were injected intravenously in mice bearing B16F10 tumors after treatment with or without irradiation. Tumors were collected at 24 h after DC administration, and the proportion of CFSE-labeled DC was measured by flow cytometry.
Antigen cross-presentation assay
For antigen cross-presentation functional assay, 1 × 10⁷ BMDCs were collected with irradiated (40 Gy) or nonirradiated B16F10-OZ cells (ratio = 1:1) overnight. BMDCs were isolated with EasySep Mouse CD11c Positive Selection Kit II. Meanwhile, CD8+ T cells were sorted from tumor draining lymph nodes and spleens of OT-1 mice using EasySep Mouse CD8+ T Cell Isolation Kit. 4 × 10⁴ sorted DCs were cocultured with 2 × 10⁵ CD8+ T cells in each well of a preincubated IFN-γ+ ELISPOT plate for 72 h. Following biotinylated detection antibody incubation and streptavidin-HRP enzyme conjugation, the cytokine spots of IFN-γ were detected with AEC Substrate Set and counted with immunospot analyzer. Tumor-infiltrating DCs were sorted from B16F10-OZ tumors at day 5 after IR for function assays following the above protocols.
Real-time qPCR (RT-qPCR)
Total RNA was extracted by using RNeasy Plus Mini Kit. cDNA was then synthesized by using High-Capacity cDNA Reverse Transcription Kit. RT-qPCR using SYBR Green PCR Master Mix was performed in QuantStudio 3 according to the manufacturer’s instruction. The specific mRNA primers for RT-qPCR are as follows: Ythdf2 forward 5′-GAGCAGAGACCAAAAGGTCAAG-3′, Ythdf2 reverse 5′-CTGTGGGCTCAAGTAAGGTTC-3′; Aph-1c forward 5′-CTCTCCTGGGTTTCCACGAC-3′, Aph-1c reverse 5′-CAAAGAACACAACGCCCCAG-3′; Mfng forward 5′-TTCCTCCTTTCCCGTTGGTGT-3′, Mfng reverse 5′-GCCCTGTATCATCCTCTGGG-3′; Aph-1b forward 5′-CTGGGGCGTTGTGTTCTTTG-3′, Aph-1b reverse 5′-AAATGCCCAGATGCCCATGA-3′; Gm8909 forward 5′-GGTGGTGTTGCAGAGACGCT-3′, Gm8909 reverse 5′-CTGCTCTTCAACACAAAAGG-3′; H2-Q6 forward 5′-GTATTTCCACACTGCTGTGTCCT-3′, H2-Q6 reverse 5′-AAGGACAACCAGAATAGCTACGT-3′; Gapdh forward 5′-AGGTCGGTGTGAACGGATTTG-3′, Gapdh reverse 5′-TGTAGACCATGTAGTTGAGGTCA-3′; Gapdh was chosen as an endogenous control. Gene expression was calculated by using the 2−ΔΔCt method, and fold difference = 2–(ΔCtA −ΔCtB), where Ct represents cycle threshold.
Western blotting analysis
Proteins were extracted with radioimmunoprecipitation assay containing protease and phosphatase. Protein concentration was measured by using the Pierce BCA protein assay kit. Equal amounts of proteins were separated by SDS-PAGE and transferred to PVDF membranes. Then, the membranes were blocked in 5% nonfat dry milk and probed with primary antibodies overnight at 4°C. The next day, membranes were incubated with an HRP-conjugated secondary antibody after being washed with TBST and finally detected using enhanced chemiluminescence.
Gene KD in BMDCs
siRNAs targeting Spi1, Batf, RelA, Aph-1b, Aph-1c, and Mfng were purchased from Santa Cruz Biotechnology. siRNAs were transfected into BMDCs by Genlantis GeneSilencer siRNA Transfection Reagent according to manufacturer’s procedures. 2 days after the transfection, the cells were collected. The KD efficiency was detected by qPCR.
Gene overexpression in BMDCs
For gene overexpression, 293 T cells were seeded into D60 plates and cultured with DMEM containing 10% FBS overnight. On day 2, Opti-MEM containing transfer vector (Gm8909-eGFP_MSGV1 or H2-Q6-eGFP_MSGV1), retrovirus packaging vector (pCL-Eco), and polyethylenimine were dropwise added to cells to continue culture for 48–72 h. For transduction, supernatant media containing retrovirus were harvested and mixed with protamine sulfate (10 μg/ml) and fresh prewarmed DMEM containing 10% FBS. BMDCs were dispersed in the mixed medium containing retrovirus and spinoculated at 1,000 g for 90 min at 32°C. The GFP expression level in DCs was checked with fluorescence microscopy before further assays.
Notch pathway activation assays
Notch activation assays were conducted using Mouse Notch1 Pathway Reporter Kit. Briefly, 3 × 10⁴ DCs were seeded into each well of clear-bottom 96-well plate and cultured at 37 in a CO2 incubator. After 24 h, cells were transfected with medium OPTI-MEM/Lipofectamine 2000 containing CSL (CBF1/RBP-Jk) luciferase reporter, Renilla luciferase, and Notch1ΔE vector. Fresh medium was added after 24 h of transfection. Luciferase assays were performed after 2 days of transfection with TWO-Step Luciferase (Firefly & Renilla) Assay System (BPS Bioscience). The luciferase signals of Firefly or Renilla were read with luminometer.
Bulk mRNA-seq
Tumor-infiltrating DCs were collected on day 5 after IR, followed by RNA extraction using RNeasy Plus Mini Kit. Cells were FACS-sorted directly into RNA lysis buffer with thiocyanate (RLT) from the QIAGEN RNeasy UCP Micro Kit, and total RNA was extracted using the manufacturer’s instructions. mRNA was enriched, and RNA-seq libraries were constructed using the Illumina TruSeq Stranded mRNA kit. Paired-end, dual-index sequencing was performed on the Illumina NovaSeq 6000 system.
RNA immunoprecipitation (RIP)-seq
The procedure was adapted from a previous report (Han et al., 2019). Briefly, DCs were washed twice with cold PBS and the cell pellet was resuspended with two volumes of lysis buffer (150 mM KCl, 10 mM HEPES, pH 7.6, 2 mM EDTA, 0.5% NP-40, 0.5 mM dithiothreitol (DTT), 1:100 protease inhibitor cocktail, 400 U/ml RNase inhibitor). The lysate was incubated on ice for 5 min and centrifuged for 15 min to clear the lysate. One-tenth volume of the cell lysate was saved as input, and total RNA was extracted using TRIzol. The rest of the cell lysate was incubated with 5 μg anti-YTHDF2 (Aviva Systems) at 4°C overnight with gentle rotation followed by incubation with 40 μl protein G beads for 1 h at 4°C. The beads were then washed five times with 1 ml ice-cold washing buffer (200 mM NaCl, 50 mM HEPES, pH 7.6, 2 mM EDTA, 0.05% NP-40, 0.5 mM DTT, 200 U/ml RNase inhibitor). The IP complex was resuspended in 400 μl 1 × Proteinase K and digested with 2 mg Proteinase K at 55°C for 1 h. RNA was then extracted using an RNA isolation kit (Zymo). Input and immunoprecipitated RNA of each sample were used to generate the library using Takara SMARTer Stranded Total RNA-Seq Kit v2 Pico Input Mammalian.
m6A sequencing
Total RNA was isolated from DCs using RNeasy Plus Mini Kit. Two cycles of ploy(A) selection were performed to get enriched mRNA. The obtained mRNA was used for m6A IP (m6A-IP) with the NEB EpiMark N6-methyladenosine enrichment kit according to the manufacturer’s protocol. RNA was enriched with Zymo Research RNA Clean & Concentration-5, followed by library construction using Takara SMARTer Stranded Total RNA-Seq Kit v2 Pico Input Mammalian. Library sequencing was performed at the University of Chicago Genomics Facility Core with an Illumina NovaSeq machine in pair-read mode at 100 bp per read.
RIP-qPCR analysis
RIP for YTHDF2 was performed using 20 mg anti-YTHDF2 rabbit polyclonal antibody (Aviva Systems Biology), as described above. After IP, RNA was isolated from input and IP fractions using phenol/chloroform extraction. cDNA was prepared with Applied Biosystems High-Capacity cDNA Reverse Transcription Kit (Thermo Fisher Scientific). SYBR Green–based qPCR was performed using QuantStudio 3 (ABI).
ChIP-qPCR assay
ChIP assays were performed with Magna ChIP A/G ChIP Kit in accordance with the manufacturer’s instructions. Briefly, 1 × 10⁷ BMDCs were treated with irradiated tumor cells for different time points as indicated and fixed with 1% formaldehyde, cross-linked, and sonicated. Cell lysates were incubated with antibody of interest or IgG control antibody and protein A/G magnetic beads overnight at 4°C. The next day, protein/DNA complexes were eluted and reverse-cross-linked. DNA was purified for RT-qPCR by using the Ythdf2 promoter DNA-specific primers. Input (1% of the chromatin) was chosen as an internal control, and the results are shown as the percentage of input (100 × 2[(Input Ct − 6.64) – Ythdf2 Ct]).
RNA-seq analysis
Fastp software (v0.20.0) was used to trim adaptor and remove low-quality reads to get high-quality clean reads (Chen et al., 2018). STAR software (v2.7.9a) was used to align the high-quality clean reads to the mouse reference genome (mm39) (Dobin et al., 2012). featureCounts software (v2.0) was used to get the raw gene-level mRNA read counts as the mRNA expression profile (Liao et al., 2013). DESeq2 software (v1.30.1) was used to normalize and calculate the fold change and P value between two groups (Love et al., 2014). Ensembl GTF gene annotation database (v104) was used to annotate the mRNA. GO and KEGG pathway enrichment analysis were performed with clusterProfiler R package (v3.18.1) based on the differentially expressed mRNAs (Yu et al., 2012). rMATS software (v4.1.1) was used to predict the alternative splicing events between two groups (Shen et al., 2014). For mRNA m6A MeRIP-seq analysis, MACS2 (v2.2.7.1) was used for detection of m6A peaks (Zhang et al., 2008). R package DiffBind (v3.0.15) was used for methylation difference calculation between groups (Ross-Innes et al., 2012). Peaks on mRNA were annotated by R ChIPseeker (v1.26.2) using gtf annotation file (v104) from the Ensembl database (Yu et al., 2015). HOMER (v4.11) was employed for m6A mRNA peak motif analysis (Heinz et al., 2010). R Guitar (v2.6.0) was utilized for drawing the metaplot of mRNA methylation (Cui et al., 2016). For YTHDF2 RIP-seq, input on each GENCODE annotated gene was counted using HTSeq, and then, differentially expressed genes were called using the DESeq2 package (Love et al., 2014). YTHDF2 target genes were identified as differentially upregulated genes comparing YTHDF2 IP sample with the corresponding input samples. Functional enrichment analysis was performed with DAVID (Sherman et al., 2022).
Confocal imaging
For DC subcellular localization analysis, cells were costained with the following dyes and antibodies: ER-Tracker Red to label the ER, LysoTracker Red to stain lysosomes, and CellMask Deep Red to outline the plasma membrane. For detection of β2M, cells were fixed with 4% paraformaldehyde, permeabilized with 0.1% Triton X-100, and incubated with β2M antibody followed by a fluorescently conjugated secondary antibody. Nuclear staining was performed with DAPI. After staining, DCs were then centrifuged onto slides and mounted with ProLong Gold medium to prevent photobleaching. Confocal images were acquired using a Leica SP8 laser scanning confocal microscope equipped with a 63× oil-immersion objective. Image analysis and colocalization quantification were performed using ImageJ software.
Quantification and statistical analysis
To estimate the statistical significance of differences between two groups, we used paired or unpaired Student’s t tests to calculate two-tailed P values. One-way analysis of variance (ANOVA) or two-way ANOVA with multiple comparison test was performed when more than two groups were compared. Error bars indicate the standard error of the mean (SEM) and standard deviation (SD). P values are labeled in the figures. P values were denoted as follows: *P < 0.05, **P < 0.01, ***P < 0.001. Statistical analyses were performed by using GraphPad Prism (v8.0).
Online supplemental material
Fig. S1 shows that RT induces YTHDF2 in DCs. Fig. S2 shows that SPI1 promotes the transcription of Ythdf2 in DCs in the context of IR. Fig. S3 shows that YTHDF2 depletion in DC boosts RT antitumor immunity by enhancing antigen cross-presentation. Fig. S4 shows that IR induces YTHDF2 to target Notch signaling in DC. Fig. S5 shows that the loss of YTHDF2 in DC induces Gm8909 by the Notch signaling pathway and enhances DC vaccine efficacy. Table S1 shows patient-level clinicogenomic data for the COSINR cohort.
Data availability
The scRNA-seq datasets have been deposited in the Gene Expression Omnibus (GEO) under the accession number GSE206387. Bulk mRNA-seq, RIP-seq, and m6A-seq datasets have been deposited in the GEO under the accession number GSE309228. All deposited data are publicly available as of the date of publication. This paper does not report original code. Source data are provided with this paper. Any additional information required to reanalyze the data reported in this paper is available from the lead contact upon request.
Acknowledgments
We thank the National Institutes of Health (NIH) Tetramer Core Facility (NIH contract 75N93020D00005 and RRID:SCR_026557) for providing the SIINFEKL MHC tetramer. We thank Rolando Torres for help with irradiating the mice. We thank Amy K. Huser for editing the manuscript and Mingjie Chen from Newcore Biotechnology for help with bioinformatics analysis.
This research was funded in part by the Chicago Tumor Institute, an endowment from the Ludwig Cancer Research Foundation (to Ralph R. Weichselbaum and Chuan He), and a Team Science Grant from the University of Chicago Comprehensive Cancer Center (to Ralph R. Weichselbaum and Chuan He). Andras Piffko is the recipient of a Walter Benjamin scholarship provided by the German Research Foundation (Deutsche Forschungsgemeinschaft project no. 455353745). Research reported in this publication was also supported by the National Cancer Institute of the NIH under award numbers R01CA262508 and U54CA274291 (to Ralph R. Weichselbaum), and R01CA251150 (to Chuan He). Jason Bugno was supported by T32GM007019 and K12CA139160. The content is solely the responsibility of the authors and does not necessarily represent the official views of the NIH. Technical support was provided through resource core funding: University of Chicago Human Tissue Resource Center SCR_019199; Animal Studies Core SCR_021806; Microscopy Core SCR_019197; Cellular Screening Core SCR_017914; Functional Genomics Core SCR_019196; and Flow Cytometry Core SCR_017760.
Author contributions: Dapeng Chen: conceptualization, data curation, formal analysis, investigation, methodology, project administration, resources, validation, visualization, and writing—original draft, review, and editing. Liangliang Wang: conceptualization and investigation. Chuangyu Wen: formal analysis and investigation. Andras Piffko: formal analysis, investigation, methodology, and writing—review and editing. Jason Bugno: formal analysis, investigation, and methodology. Xianbin Yu: formal analysis, investigation, visualization, and writing—original draft. Pingluan Wang: investigation and methodology. Fei Ji: methodology. Emile Z. Naccasha: investigation. Jiaai Wang: resources. Xiaona Huang: data curation and supervision. Steven J. Chmura: conceptualization, funding acquisition, investigation, supervision, and writing—review and editing. Sean P. Pitroda: supervision and writing—review and editing. Chuan He: conceptualization and writing—review and editing. Hua Laura Liang: conceptualization, data curation, funding acquisition, investigation, methodology, project administration, resources, supervision, and writing—original draft, review, and editing. Ralph R. Weichselbaum: conceptualization, data curation, formal analysis, investigation, methodology, project administration, resources, supervision, validation, visualization, and writing—original draft, review, and editing.

